Research Article
Plasma Oxytocin Concentration in Pre-
and Postmenopausal Women: Its Relationship
with Obesity, Body Composition and
Metabolic Variables
Sabrina Maestrini a Chiara Mele b, c Stefania Mai d Roberta Vietti d
Annamaria Di Blasio a Luigi Castello c Daniela Surico c
Gianluca Aimaretti c Massimo Scacchi b, e Paolo Marzullo b, c
a Laboratory of Molecular Biology, I.R.C.C.S. Istituto Auxologico Italiano, Ospedale S.
Giuseppe, Verbania , Italy; b Division of General Medicine, I.R.C.C.S. Istituto Auxologico
Italiano, Ospedale S. Giuseppe, Verbania , Italy; c Department of Translational Medicine,
Università del Piemonte Orientale, Novara , Italy; d Laboratory of Metabolic Research,
I.R.C.C.S. Istituto Auxologico Italiano, Ospedale S. Giuseppe, Verbania , Italy; e Department of
Clinical Sciences and Community Health, University of Milan, Milan , Italy
Keywords
Body composition · Obesity · Menopause · Oxytocin
Abstract
Objective: To investigate the relationship between oxytocin, menopause and obesity.
Meth-ods: A cross-sectional analysis on 56 obese (OB; 28 premenopausal) and 53 normal-weight
women (NW; 27 premenopausal) was performed by measurement of oxytocin, leptin, adipo-nectin, gonadotropins, sex steroids, glucose, and lipid homeostasis as well as DXA assessment of fat mass (%FM) and fat-free mass (FFM). Results: Women from NW and OB groups were comparable for age but differed in anthropometric measures. In our cohorts, menopause was not associated with changes in gluco-lipid homeostasis and %FM, while FFM was lower in post-menopausal women from both study groups (p < 0.05). In each group, leptin was unaltered, and adiponectin only marginally changed across menopause, while oxytocin levels were lower in post- than in premenopausal women (NW: p < 0.05; OB: p < 0.005), and lower in OB than NW women, either when assessed as whole groups or if stratified by menopause (p < 0.001). In cor-relation analysis, inverse associations related oxytocin to menopause, obesity, and adiposity-related measures. BMI (p < 0.0001) and menopause independently predicted oxytocin levels (p < 0.001), but their interaction was null (p = 0.5). Conclusions: Obesity and menopause are independent negative predictors of plasma oxytocin. Longitudinal studies should clarify the role of oxytocin on weight modifications experienced around and after menopause.
© 2018 The Author(s)
Published by S. Karger GmbH, Freiburg Paolo Marzullo, MD, PhD
Department of Translational Medicine Università del Piemonte Orientale Via Solaroli 17, Novara, 28100 Italy paolo.marzullo @ med.uniupo.it
Introduction
Body weight excess affects a growing proportion of the adult population and represents a compelling public health problem [1] . In women, hormone modifications experienced during transition into menopause accompany a shift of body fat distribution from the gynoid to the android type, which is associated with an increase in adipocyte diameter, reduced lipo-lytic activity, enhanced pro-inflammatory adipokine secretion, and impaired insulin sensi-tivity [2] . These modifications are critical for the future risk of developing obesity, type 2 diabetes mellitus (T2DM) and cardiometabolic disease [3, 4] .
Estrogens and the estrogen receptor-α (ER-α) are reckoned as essential components of the central network controlling food intake and energy expenditure [5] ; yet the pathophysi-ological mechanisms relating menopause to adiposity are incompletely understood. Oxytocin, a hypothalamic hormone physiologically implicated in labor [6] and psycho-neural functions [7, 8] , has been increasingly studied for its putative role in the control of energy metabolism [9, 10] . Oxytocin and its receptor are widely expressed in brain areas regulating food intake, such as the hypothalamic paraventricular (PVN) and supraoptic nucleus, and oxytocin expression has been detected in adipocytes and in the gastrointestinal tract, both in rodents and humans [11–14] . In line with these evidences, knockout of oxytocin receptors and/or oxytocin signaling in rodents promoted the onset of obesity [15] . In contrast, oxytocin admin-istration to obese rats reduced food intake, decreased body weight, and prevented the reduction of energy expenditure typically associated with weight loss [16] .
In humans, oxytocin has shown the potential ability to contrast obesity and its related metabolic disorders [17] . In a placebo-controlled study in healthy men, acute intranasal administration of oxytocin reduced calorie intake and curbed the meal-related rise in plasma glucose devoid of effects on energy expenditure and hunger-driven food intake [18, 19] . Simi-larly, intranasal oxytocin administration to obese and prediabetic patients resulted in a significant decrease of body weight after 4 and 8 weeks of treatment [20] . In line with these evidences, cohort studies investigating oxytocin concentration additionally found an inverse association between oxytocin and obesity, HbA1C levels, insulin resistance as well as T1DM or T2DM, thus emphasizing the potential negative influence of positive energy states on circu-lating oxytocin [21–23] . However, this inference has been recently challenged in a study in premenopausal women with different energy states [24] .
To date, very little is known on the interplay relating oxytocin, menopause, and obesity. Studies in rodents have consistently demonstrated that estrogen deprivation decreases plasma oxytocin levels [25] . In humans, cross-sectional analysis found that oxytocin circu-lates at lower levels in amenorrheic athlete women than in non-amenorrheic control women [26] . Because menopause constitutes a critical period for changes in body weight and adiposity, we sought to perform a cross-sectional study in pre- and postmenopausal women to assess the interaction between circulating oxytocin, menopause, and obesity.
Participants and Methods
Study Participants
The study originally comprised 60 sedentary obese women (OB group; 30 pre- and 30 postmenopausal) and 60 sedentary normal-weight women (NW group; 30 pre- and 30 postmenopausal). Women from the OB group were recruited between 2014 and 2015 from patients referring to our institution for work-up and rehabilitation of obesity. Women from the NW group were recruited as healthy controls from the hospital staff upon matching for age and menopausal stage. All premenopausal women reported regular menses, whereas postmenopausal women reported loss of menses for at least 12 months along with increased FSH levels ( ≥ 35 ng/ml) and reduced estradiol levels (<40 pg/ml). Of the original study sample, datasets were
complete and available for analysis in 56 OB women (28 pre- and 28 postmenopausal) and 53 NW women (27 pre- and 26 postmenopausal). No woman was taking hormone therapy nor reported premature meno-pause (<age 40 years), thyroid disorders, previously diagnosed diabetes mellitus, liver or kidney disease, chronic disorders, and psychiatric illness or its treatment. Informed consent was obtained from each partic-ipant before inclusion into the study. The study was approved by the clinical research ethics committee of our institute according to the declaration of Helsinki. The study protocol conformed to the guidelines of the European convention on human rights and biomedicine concerning biomedical research.
Anthropometric and Biochemical Analyses
Height and weight were measured with standardized techniques. BMI was expressed as kilograms per square meter. Dual-energy x-ray absorptiometry (DXA) (GE Lunar Corp., Madison, WI, USA) was used for the assessment of fat and lean body mass, expressed as percent fat mass (%FM), trunk %FM and fat-free mass (FFM, kg).
Participants were asked to avoid stressful physical activities for at least 3 days before blood sampling, performed in the morning in fasting conditions. In premenopausal women, blood sampling was obtained in the early follicular phase of the menstrual cycle. Blood samples were separated by centrifugation after clotting, and aliquots of serum or plasma supernatants were processed for routine measurements and stored at –80 ° C until assay. Metabolic analyses included blood glucose, insulin, HbA1c, total cholesterol (TC), high-density (HDL-C) and low-high-density lipoprotein cholesterol (LDL-C) and triglycerides (TGL) determined by enzymatic assays (Roche Diagnostics GmbH, Mannheim, Germany). Insulin resistance was calculated by the homeostatic model of insulin resistance (HOMA-IR) index as insulin (mU/l) × (glucose (mmol/l) / 22.5). Women from the OB group underwent oral glucose tolerance test for the screening of T2DM according to American Diabetes Association guidelines [27] . HbA1c levels were determined by a turbidimetric immuno-logic inhibition assay (TINIA; Boehringer-Mannheim, Mannheim, Germany). A two-site, solid-phase chemi-luminescent immunometric assay or competitive immunoassay was used for insulin, estradiol, testosterone, FSH, and LH levels (Immulite 2000 Analyzer; DPC, Los Angeles, CA, USA). Serum adiponectin levels were determined by an enzyme-linked immunoabsorbent assay (DRG Instruments GmbH, Marburg, Germany), the detection limit was 1.56–100 ng/ml, sensitivity was 0.2 ng/ml, inter- and intra-assay CV was 2.4–8.4 and 0.9–7.4%, respectively. Serum leptin concentrations were quantified using a commercially available ELISA kit (Mediagnost GmbH, Reutlingen, Germany) with sensitivity of 0.2 ng/ml as well as inter- and intra-assay CVs of 6.8–8.3% and 5.5–6.9%, respectively.
Plasma oxytocin levels were determined by EIA (Phoenix Pharmaceutical Europe GmbH, Karlsruhe, Germany) according to the manufacturer’s instructions, as follows: Prior to processing, plasma samples were added with a commercial protease inhibitor cocktail manufactured by Sigma-Aldrich (Merck KGaA, Darm-stadt, Germany) to preserve oxytocin from proteolytic degradation. Subsequently, samples were stored in individual cryotubes to avoid any freeze-thaw cycles, and all samples were analyzed in three consecutive batches within a year. To eliminate interfering molecules and concentrate the sample before analysis, plasma sample were subjected to an solid-phase extraction procedure as recommended by the manufacturer and described by Szeto et al. [28] . For sample extraction, 200 mg C18 Sep-Pak columns (Phoenix Pharmaceuticals, Burlingame, CA, USA) were used and equilibrated with 1 ml buffer B followed by washing with 3 ml of buffer A. Then, 0.8 ml of plasma was acidified with an equal volume of buffer A. After centrifugation (at 17,000 × g for 20 min at 4 ° C), the organic supernatant was applied to the column. The flow-through fraction was discarded; the columns were washed twice with 3 ml of buffer A. Plasma oxytocin was eluted with 3 ml of buffer B. The solvent was then evaporated to dryness in a centrifugal concentrator. Extracted oxytocin was stored frozen (–80 ° C) until all samples were extracted, using the same lot of columns and reagents. For the assay, samples were reconstituted in 0.1 ml (i.e. concentrated 8-fold) using the assay kit buffer and assayed manually according to the manufacturer’s instructions. The lowest calibrator concentration for the EIA kit was 0.01 ng/ml, while the minimum detectable concentration was 0.06 ng/ml. Inter- and intra-assay coef-ficient of variation (CV) was 5.2–14.5% and 8.7–9.1% respectively.
Statistical Analysis
Statistical analysis was performed using IBM SPSS Statistics software v.18.0 (SPSS, IBM, Armonk, NY, USA). Values are expressed as means ± standard deviation (SD). Data points not normally distributed were log-transformed to improve the symmetry and homoscedasticity of the distribution. For pairwise comparative analysis, ANOVA between NW and OB groups and the unpaired t-test within each group were used. Pearson’s correlation analysis and the chi square test were used to identify significant associations between variables
of interest. Regression analyses and analysis of variance for multiple dependent variables by one or more factor variables or covariates were calculated using the general linear model multivariate procedure, comprising of the effects of covariate interactions with the variables of interest. To determine the impact of menopause and obesity (or related hormonal and metabolic variables) on oxytocin levels, different models were attempted, and the following covariates of interest, as well as their interaction, were used if not mutually excluded by the collinearity test: age, estradiol, menopause status (pre = 0; post = 1), body weight (kg), BMI, fat body mass (as percent or kg) and lean body mass (kg). Multivariate linear and logistic regression analysis were used to estimate the coefficients of the linear equation, involving one or more independent variables, that best predict the value of the dependent variable. β coefficients and related significance values obtained from the models are reported. Statistical tests were 2-tailed with p < 0.05 as the threshold level of significance.
Results
A summary of anthropometric and biochemical results obtained in NW and OB groups is reported in tables 1 and 2 , respectively. Analysis of anthropometric variables showed predictable differences in body weight, %FM, trunk %FM, and FFM between NW and OB groups. Compared to the NW group, women from the OB group harbored lower gonado-tropins and higher sex steroids concentrations, a less healthy gluco-metabolic profile, and higher insulin resistance. At study entry, naïve T2DM was diagnosed in 14 OB women equally distributed between pre- (N = 7) and postmenopausal women (N = 7). As expected, OB women harbored lower adiponectin and higher leptin levels than NW women. When NW and OB groups were considered separately, pairwise analysis between premenopausal and post-menopausal women showed no difference in %FM and trunk %FM, while FFM was lower in postmenopausal than in premenopausal women in both study groups. While metabolic homeostasis and leptin levels were similar between pre- and postmenopausal women within each cohort, adiponectin levels were slightly higher in postmenopausal conditions, a finding that parallels previous observations in healthy women [29] .
Analysis of circulating oxytocin levels showed markedly lower hormone levels in OB than in NS women, with average oxytocin levels being 3.5-fold lower in the OB group. When groups were analyzed according to the menopausal stage, the intergroup difference in oxytocin levels was 2.7-fold in premenopausal and 5.8-fold in postmenopausal conditions ( fig. 1 ).
Table 1. Anthropometric characteristics in normal-weight women and women with obesity as whole study groups and after strat-ification in the premenopausal (Pre) and postmenopausal (Post) subpopulations
Parameters Normal-weight women (N = 53) Obese women (N = 56)
whole menopause status whole menopause status
Pre (n = 27) Post (n = 26) p Pre (n = 28) Post (n = 28) p Age, years 52.09 ± 5.6 47.6 ± 3.6 56.7 ± 2.7 <0.001 50.09 ± 6.6 44.7 ± 3.9* 55.5 ± 3.8 <0.001 No. of pregnancies 1.30 ± 0.89 1.33 ± 0.9 1.27 ± 0.87 ns 1.75 ± 1.4 1.25 ± 1.2 2.25 ± 1.4* <0.05 Weight, kg 60.04 ± 8.5 62.52 ± 9.6 57.5 ± 6.4 0.03 115 ± 11.8§ 116.8 ± 9.6§ 113.2 ± 13.6§ ns Height, cm 158.68 ± 7.3 159.3 ± 6.7 158.1 ± 8.0 ns 157.88 ± 6.7 158.8 ± 7.2 157 ± 6.2 ns BMI, kg /m2 22.68 ± 3.07 23.4 ± 3.2 21.9 ± 2.8 ns 46.04 ± 4.45§ 46 ± 4.2§ 46.1 ± 4.7§ ns FM, % 37.1 ± 7.5 37.7 ± 6.6 36.4 ± 8.4 ns 52.4 ± 3.3§ 51.8 ± 3.4§ 53.2 ± 3.1* ns Trunk FM, % 35.7 ± 9.2 36.1 ± 8.6 35.3 ± 9.9 ns 52.2 ± 4.5§ 51.2 ± 4.5* 53.5 ± 4.3* ns FFM, kg 37.08 ± 4.6 38.5 ± 5.2 35.6 ± 3.4 <0.05 51.6 ± 6.11§ 53.3 ± 5.1 49.8 ± 6.7§ <0.05
Results are expressed as mean ± standard deviation (SD). For statistical significance: ns = not significant; *p < 0.05 and §p < 0.001
between normal-weight and obese groups.
ingly, oxytocin levels were significantly lower in postmenopausal than in premenopausal conditions both in the NW and OB group, with the difference being particularly robust within the OB group. An analysis restricted to this group showed no difference in oxytocin concen-trations between normoglycemic OB women and OB women diagnosed with naïve T2DM (1.0 ± 0.7 vs. 0.7 ± 1.0).
Table 2. Baseline hormone and metabolic characteristics in normal-weight (NW) and obese (OB) subjects as whole study group and after stratification in the premenopausal (Pre) and postmenopausal (Post) subpopulations
Parameters Normal-weight women (N = 53) Obese women (N = 56)
whole menopause status whole menopause status
Pre (n = 27) Post (n = 26) P P re (n = 28) Post (n = 28) P
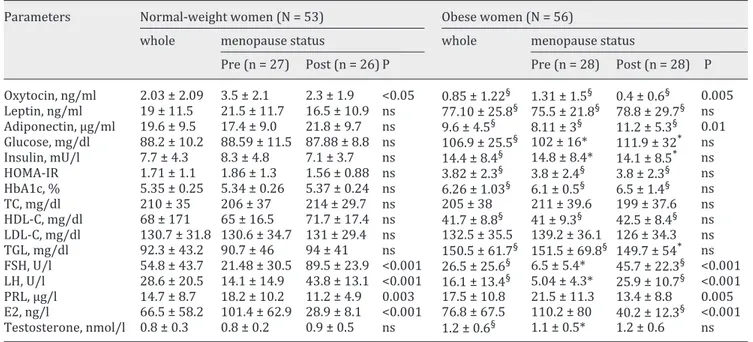
Oxytocin, ng/ml 2.03 ± 2.09 3.5 ± 2.1 2.3 ± 1.9 <0.05 0.85 ± 1.22§ 1.31 ± 1.5§ 0.4 ± 0.6§ 0.005 Leptin, ng/ml 19 ± 11.5 21.5 ± 11.7 16.5 ± 10.9 ns 77.10 ± 25.8§ 75.5 ± 21.8§ 78.8 ± 29.7§ ns Adiponectin, μg/ml 19.6 ± 9.5 17.4 ± 9.0 21.8 ± 9.7 ns 9.6 ± 4.5§ 8.11 ± 3§ 11.2 ± 5.3§ 0.01 Glucose, mg/dl 88.2 ± 10.2 88.59 ± 11.5 87.88 ± 8.8 ns 106.9 ± 25.5§ 102 ± 16* 111.9 ± 32* ns Insulin, mU/l 7.7 ± 4.3 8.3 ± 4.8 7.1 ± 3.7 ns 14.4 ± 8.4§ 14.8 ± 8.4* 14.1 ± 8.5* ns HOMA-IR 1.71 ± 1.1 1.86 ± 1.3 1.56 ± 0.88 ns 3.82 ± 2.3§ 3.8 ± 2.4§ 3.8 ± 2.3§ ns HbA1c, % 5.35 ± 0.25 5.34 ± 0.26 5.37 ± 0.24 ns 6.26 ± 1.03§ 6.1 ± 0.5§ 6.5 ± 1.4§ ns TC, mg/dl 210 ± 35 206 ± 37 214 ± 29.7 ns 205 ± 38 211 ± 39.6 199 ± 37.6 ns HDL-C, mg/dl 68 ± 171 65 ± 16.5 71.7 ± 17.4 ns 41.7 ± 8.8§ 41 ± 9.3§ 42.5 ± 8.4§ ns LDL-C, mg/dl 130.7 ± 31.8 130.6 ± 34.7 131 ± 29.4 ns 132.5 ± 35.5 139.2 ± 36.1 126 ± 34.3 ns TGL, mg/dl 92.3 ± 43.2 90.7 ± 46 94 ± 41 ns 150.5 ± 61.7§ 151.5 ± 69.8§ 149.7 ± 54* ns FSH, U/l 54.8 ± 43.7 21.48 ± 30.5 89.5 ± 23.9 <0.001 26.5 ± 25.6§ 6.5 ± 5.4* 45.7 ± 22.3§ <0.001 LH, U/l 28.6 ± 20.5 14.1 ± 14.9 43.8 ± 13.1 <0.001 16.1 ± 13.4§ 5.04 ± 4.3* 25.9 ± 10.7§ <0.001 PRL, μg/l 14.7 ± 8.7 18.2 ± 10.2 11.2 ± 4.9 0.003 17.5 ± 10.8 21.5 ± 11.3 13.4 ± 8.8 0.005 E2, ng/l 66.5 ± 58.2 101.4 ± 62.9 28.9 ± 8.1 <0.001 76.8 ± 67.5 110.2 ± 80 40.2 ± 12.3§ <0.001 Testosterone, nmol/l 0.8 ± 0.3 0.8 ± 0.2 0.9 ± 0.5 ns 1.2 ± 0.6§ 1.1 ± 0.5* 1.2 ± 0.6 ns
Results are expressed as mean ± standard deviation (SD). For statistical significance: ns = not significant; *p < 0.05 and §p < 0.001
between normal-weight and obese groups.
HOMA-IR = Homeostatic model of insulin resistance; TC = total cholesterol; LDL = low-density lipoprotein; HDL = high-density lipoprotein; FSH = follicle stimulating hormone; LH = luteinizing hormone; PRL = prolactin; E2 = total estradiol.
Fig. 1. Plasma oxytocin levels in premenopausal and postmeno-pausal normal-weight (Pre-NW and Post-NW, respectively) and obese (POB and Post-OB, re-spectively) women. Results are expressed as mean ± SD.
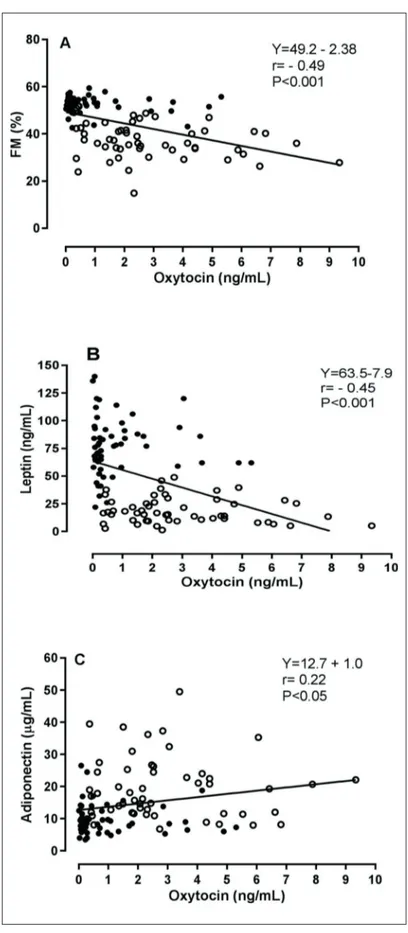
Correlation analysis on the entire population and separate groups is shown in table 3 . A significant inverse association between oxytocin and the menopausal status (pre = 0, post = 1), but not with estradiol, testosterone or gonadotropins levels, was observed. A strong inverse association related oxytocin levels to indices of adiposity and metabolic homeostasis, including body weight and BMI, %FM, trunk %FM and FFM, glucose homeostasis and insulin resistance, triglycerides levels as well as leptin and adiponectin levels ( fig. 2 ). In contrast, oxytocin and HDL cholesterol levels were directly correlated. When age, BMI, estradiol, meno-pause, and insulin resistance were controlled for, the aforementioned associations were abrogated, thereby confirming the blunting effect of obesity and menopause-related vari-ables on oxytocin. When separating NW and OB groups, associations were generally weaker and correlations were only significant between oxytocin and age (NW r = –0.32, p < 0.05; OB r = –0.33, p < 0.05), menopause (NW r = –0.28, p < 0.05; OB r = –0.37, p < 0.05) and, in the OB group, estradiol levels (r = 0.28, p < 0.05).
Stepwise multivariable regression analysis and general linear model analysis were carried out to identify potential independent predictors of circulating oxytocin. Both BMI (β = –0.51, p < 0.0001) and menopause (β = –0.28, p < 0.001) acted as independent predictors of oxytocin levels (adjusted R 2 = 0.32). Nevertheless, their interaction was null (F = 0.34, p = 0.5).
Discussion
Oxytocin is a hypothalamic neuropeptide involved in parturition and increasingly studied for its role in psychological behavior [8] . Recent preclinical and clinical studies have focused on oxytocin as a conditional anorexigen with pivotal regulatory actions on energy
Table 3. Correlation analysis between oxytocin concentrations and parameters of interest in the population as a whole and sub-grouped as normal-weight and obese women
Parameter s Whole population (N = 109) Normal-weight women (N = 53) Obese women (N = 56)
r p value r p value r p value
Age, years –0.17 0.07 –0.32 0.02 –0.33 0.01
Age at menarche, years 0.31 0.001 0.165 ns 0.13 ns
Menopausal status –0.26 0.005 –0.28 0.04 –0.37 0.005 Weight, kg –0.48 0.001 –0.08 ns 0.17 ns BMI, kg/m2 –0.50 0.001 –0.09 ns 0.05 ns FM, % –0.49 0.001 0.01 ns 0.06 ns Trunk FM, % –0.48 0.001 –0.17 ns –0.13 ns FFM, kg –0.40 0.001 0.01 ns 0.1 ns Glucose, mg/dl –0.24 0.013 0.26 ns –0.21 ns Insulin, mg/dl –0.19 0.04 0.04 ns 0.09 ns HOMA-IR –0.23 0.016 0.07 ns 0.04 ns TC, mg/dl 0.17 0.07 0.16 ns 0.19 ns HDL-C, mg/dl 0.41 0.001 0.08 ns –0.01 ns LDL-C, mg/dl 0.12 ns 0.15 ns 0.20 ns TGL, mg/dl –0.228 0.017 –0.005 ns 0.09 ns E2, ng/l 0.132 ns –0.16 ns 0.28 <0.05 Leptin, ng/ml –0.45 0.001 –0.13 ns 0.005 ns Adiponectin, μg/ml 0.22 0.02 –0.06 ns –0.18 ns
Parameters related by significant associations are indicated in italics.
FM = Fat mass; FFM = fat-free mass; Trunk FM = indicated the regional percentage of fat mass of trunk; HOMA-IR = homeostatic model of insulin resistance; TC = total-cholesterol; LDL = low-density lipoprotein; HDL = high-density lipoprotein; TGL, triglycerides; E2, total estradiol; ns = nonsignificant.
Fig. 2. Relationship between oxy-tocin percent fat mass (FM, panel A), leptin (panel B) and adiponec-tin (panel C). Open circles, control group; closed circles, obese group.
stasis [30] . The results of our study depict an association between menopause and plasma oxytocin concentrations both in normal-weight and severely obese women. Specifically, plasma oxytocin levels were significantly higher in premenopausal women compared with postmenopausal women. Notably, obesity and its related variables yielded an even stronger negative effect on oxytocin concentrations, such that all indexes of overall and central obesity, FFM, insulin resistance, lipid homeostasis, and leptin were inversely associated with plasma oxytocin concentrations. Multivariate analysis revealed that BMI and menopause were signif-icant and independent negative predictors of circulating oxytocin. These findings could support a new role for oxytocin in the control of body weight after menopause.
Mid-life is a critical period for many women transitioning into menopause due to changes in body weight, visceral fat accumulation, and cardiometabolic health [3, 4, 31] . A mechanistic interplay linking oxytocin, hypoestrogenism, and adiposity has been suggested in animal studies showing that: i) ovarian hormone deprivation plays a critical role on oxytocin activity and its expression in the hypothalamic nuclei involved in the control of food intake [25] ; ii) hypothalamic and circulating oxytocin are associated with fasting-feeding cycles [32] ; iii) weight gain accompanying ovariectomy is blunted by exogenous oxytocin administration [33] ; iv) gene knockout of oxytocin and its receptor promotes obesity [15] ; v) carriers of mutations related to Sim1 haplo-insufficiency and MAGED1 deficiency harbor low hypotha-lamic expression of oxytocin and obesity [34, 35] . Complimentarily, oxytocin levels have been found decreased in most but not all animal models of obesity and T2DM, including diet-induced-obesity (DIO) and carriers of leptin deficiency [16, 36, 37] . In cohort studies, oxytocin levels are reportedly similar between genders [22] as well as with regard to decline with age [38] , and decrease in obesity and newly diagnosed T2DM [23] . Concordant with evidence that estrogen loss decreases oxytocin levels, our current results show that oxytocin levels are lower in postmenopausal than premenopausal women both in normal-weight and obese conditions, suggesting that an inverse association relates oxytocin to menopause indepen-dently of obesity. Herein, a correlation between oxytocin and estradiol levels could only be recorded in the obese group, likely due to the enhanced aromatase activity associated with obesity [31] . Because oxytocin secretion is clearly affected by mechanism related to the hypo-thalamus-pituitary-gonadal system and estradiol has been shown to positively modulate oxytocin levels at the central level in animal models [5] and at the peripheral level in humans [39] , we are inclined to explain the lack of correlation between oxytocin and estradiol in the whole dataset as the result of the cross-sectional design of our study, the relatively small study sample and, possibly, the use of an enzyme-linked immunoassay instead of the recom-mended mass spectrometry-based assay for estradiol determination [40] .
A potential link between oxytocin and body weight changes at menopause is provided by our finding of an inverse association between oxytocin and obesity or its related variables. On average, oxytocin levels were 3.5-fold lower in obese compared to lean women, and this difference was more evident in postmenopausal conditions, when oxytocin was detected at the lowest concentrations. In multivariable analysis, only BMI and menopause entered the regression equation, although this model could only explain 32% of the variability in oxytocin levels, implying that additional mechanisms contribute to control oxytocin secretion around the menopause. It is intriguing to note that the interaction between BMI and menopause was null, thus suggesting that their effect is independent but potentially synergistic. Also other adiposity indexes were inversely related to oxytocin levels, such as gluco-lipid homeostasis, leptin levels, FM, trunk FM and FFM. In naïve T2DM women, totaling 25% of this obese cohort, oxytocin levels paralleled those recorded in non-diabetic ones, a finding that partly disagrees with previous evidence of lower oxytocin levels in T2DM [22] . In this regard, we hypothesize that the high BMI values of our obese patients could have yielded a broad bulky effect on oxytocin secretion. To date, oxytocin levels in obesity have been found decreased [18] ,
unchanged [41] , or even increased [24] as compared to controls. Several reasons could contribute to explain these discrepancies, such as differences in study cohorts, gender preva-lence, degree of obesity, sampling procedures, and analytical methodologies [21, 28] . In a recent cross-sectional investigation on premenopausal women, mean nocturnal concentra-tions of non-extracted oxytocin were found to be higher in mildly obese compared to lean eumenorrhoic women [24] . The elaborated sampling procedure associated with this investi-gation significantly expands current knowledge on premenopausal oxytocin secretion [24] . However, it is worth mentioning that obesity alters nocturnal secretory orderliness of feeding-related hormones [42] , and mean nighttime levels only partially reflect the nocturnal dynamics of hormone secretion [42–44] . Thus, a true comparison between results originating from different investigational procedures seems challenging. It would have been stimulating to test non-extracted oxytocin in our subjects to thoroughly compare our results with findings previously described by others [24] . In a search for potential explanatory mechanisms related to our findings, we noted a robust inverse correlation between oxytocin and leptin levels. This relationship is currently argued [10, 26, 45] and has been shown to be positive in premeno-pausal women with T1DM [23] and postmenopremeno-pausal women with osteoporosis [21] . Although leptin and oxytocin act synergistically at the central level to inhibit food intake [19, 45] , obesity alters this interplay [16, 46] , and oxytocin administration to obese mice or humans reduces caloric intake devoid of leptin resistance, leading to hypothesize that oxytocin control of body weight could occur independently of leptin-sensitive circuitries [18, 47, 48] .
Conclusion
In summary, our study shows that oxytocin levels are decreased in postmenopausal women compared to premenopausal ones, both in the lean and obese state, and that inde-pendent negative associations relate oxytocin to menopause and, more robustly, to obesity. Longitudinal studies could inform on intrinsic mechanisms relating oxytocin to body weight across menopause.
Acknowledgments
The authors would like to thank Gillian E. Walker contributing to the manuscript final drafting.
Disclosure Statement
The authors declared no conflict of interest. This work was funded by a grant for the Ricerca Corrente program from the Italian Ministry of Health
References
1 World Health Organization: Obesity and Overweight. Fact sheet 2015;N 311. Available online: www.who.int/
mediacentre/factsheets/fs311/en/ (last accessed October 9, 2018).
2 Tchernof A, Després JP: Pathophysiology of human visceral obesity: an update. Physiol Rev 2013; 93: 359–404. 3 Al-Safi ZA, Polotsky AJ: Obesity and menopause. Best Pract Res Clin. Obstetr Gynaecol 2015; 29: 548–553. 4 Karvonen-Gutierrez C, Kim C: Association of mid-life changes in body size, body composition and obesity
status with the menopausal transition. Healthcare Rev 2016; 4: 1–16.
5 McCarthy MM: Estrogen modulation of oxytocin and its relation to behavior. Adv Exp Med Biol 1995; 395: 235–245.
6 den Hertog CE, de Groot AN, van Dongen PW: History and use of oxytocics. Eur J Obstet Gynecol Reprod Biol 2001; 94: 8–12.
7 MacDonald K, MacDonald T: That peptide that binds: a systemic review of oxytocin and its prosocial effects in humans. Harv Rev Psychiatry 2010; 18: 1–21.
8 Shamay-Tsoory SG, Abu-Akel A: The social salience hypothesis of oxytocin. Biol Psychiatry 2016; 79: 194–202. 9 Cai D, Purkayastha S: A new horizon: oxytocin as a novel therapeutic option for obesity and diabetes. Drug
Discov 2013; 10:e63–e68.
10 Perello M, Raingo J: Leptin activates oxytocin neurons of the hypothalamic paraventricular nucleus in both control and diet-induced obese rodents. PLoS One 2013; 8:e59625–e59634.
11 Welch MG, Tamir H, Gross KJ, Chen J, Anwar M, Gershon MD: Expression and developmental regulation of oxytocin (OT) and oxytocin receptor (OTR) in the enteric nervous systems (ENS) and intestinal epithelium. J Comp Neurol 2009; 512: 256–270.
12 Yi KJ, So K, Hata Y, Suzuki Y, Kato D, Watanabe K, Aso H, Kasahara Y, Nishimori K, Chen C, Katoh K, Roh SG: The regulation of oxytocin receptor gene expression during adipogenesis. J Neuroendocrinol 2015; 27: 335–342. 13 Ohlsson B, Truedsson M, Djerf P, Sundler F: Oxytocin is expressed throughout the human gastrointestinal
tract. Regul Pept 2006; 135: 7–11.
14 Monstein HJ, Grahn N, Truedsson M, Ohlsson B: Oxytocin and oxytocin-receptor mRNA expression in the human gastrointestinal tract: a polymerase chain reaction study. Regul Pept 2004; 119: 39–44.
15 Takayanagi Y, Kasahara Y, Onaka T, Takahashi N, Kawada T, Nishimori K: Oxytocin receptor-deficient mice developed late-onset obesity. Neuroreport 2008; 19: 951–955.
16 Morton GJ, Thatcher BS, Reidelberger RD, Ogimoto K, Wolden-Hanson T, Baskin DG, Schwartz MW, Blevins JE: Peripheral oxytocin suppresses food intake and causes weight loss in diet-induced obese rats. Am J Physiol Endocrinol Metab 2012; 302:E134–E144.
17 Barengolts E: Oxytocin – an emerging treatment for obesity and dysglycemia: review of randomized controlled trials and cohort studies. Endocr Pract 2016; 22: 885–894.
18 Lawson EA, Marengi DA, DeSanti RL, Holmes TM, Schoenfeld DA, Tolley CJ: Oxytocin reduces caloric intake in men. Obesity (Silver Spring) 2015; 23: 950–956.
19 Ott V, Finlayson G, Lehnert H, Heitmann B, Heinrichs M, Born J, Hallschmid M: Oxytocin reduces reward-driven food intake in humans. Diabetes 2013; 62: 3418–3425.
20 Zhang H, Wu C, Chen Q, Chen X, Xu Z, Wu J, Cai D: Treatment of obesity and diabetes using oxytocin or analogs in patients and mouse models. PLoS One 2013; 8:e61477.
21 Breuil V, Panaia-Ferrari P, Fontas E, Roux C, Kolta S, Eastell R, Ben Yahia H, Faure S, Gossiel F, Benhamou CL, Euller-Ziegler L, Amri EZ: Oxytocin, a new determinant of bone mineral density in post-menopausal women: analysis of the OPUS Cohort. J Clin Endocrinol Metab 2014; 99:E634–E641.
22 Qian W, Zhu T, Tang B, Yu S, Hu H, Sun W, Pan R, Wang J, Wang D, Yang L, Mao C, Zhou L, Yuanet G: Decreased circulating levels of oxytocin in obesity and newly diagnosed Type 2 Diabetic patients. J Clin Endocrinol Metab 2014; 99: 4683–4689.
23 Kujath AS, Quinn L, Elliott ME, Varady KA, LeCaire TJ, Carter CS, Danielson KK: Oxytocin levels are lower in premenopausal women with type 1 diabetes mellitus compared with matched controls. Diabetes Metab Res Rev 2015; 31: 102–112.
24 Schorr M, Marengi DA, Pulumo R, Yu E, Eddy KT, Klibanski A, Miller KK, Lawson EA: Oxytocin and its rela-tionship to body composition, bone mineral density and hip geometry across the weight spectrum. J Clin Endo-crinol Metab 2017; 102: 2814–2824.
25 De Melo VU, Saldanha RR, Dos Santos CR, De Campos Cruz J, Lira VA, Santana-Filho VJ, Michelini LC: Ovarian hormone deprivation reduces oxytocin expression in paraventricular nucleus preautonomic neurons and correlates with baroreflex impairment in rats. Front Physiol 2016; 13: 461–469.
26 Lawson EA, Ackerman KE, Slattery M, Marengi DA, Clarke H, Misra M: Oxytocin secretion is related to measures of energy homeostasis in young amenorrheic athletes. J Clin Endocrinol Metab 2014; 99:E881–E885. 27 American Diabetes Association: Classification and diagnosis of diabetes. Diabetes Care 2016; 39(suppl 1):S13–
S22.
28 Szeto A, McCabe PM, Nation DA, Tabak BA, Rossetti MA, McCullough ME, Scheiderman N, Mendez AJ: Evalu-ation of enzyme immunoassay and radioimmunoassay methods for the measurement of plasma oxytocin. Psychosom Med 2011; 73: 393–400.
29 Jürimäe J, Jürimäe T: Plasma adiponectin concentration in healthy pre- and postmenopausal women: rela-tionship with body composition, bone mineral, and metabolic variables. Am J Physiol Endocrinol Metab 2007; 293:E42–E47.
30 Olszewski PK, Klockars A, Levine AS: Oxytocin: a conditional anorexigen whose effects on appetite depend on the physiological, behavioural and social contexts. J Neuroendocrinol 2016; 28. doi: 10.1111/jne.12376. 31 Palmer BF, Clegg DJ: The sexual dimorphism of obesity. Mol Cell Endocrinol 2015; 402: 113–119.
32 Deblon N, Veyrat-Durebex C, Bourgoin L, Caillon A, Bussier AL, Petrosino S, Piscitelli F, Legros JJ, Geenen V, Foti M, Wahli W, Di Marzo V, Rohner-Jeanrenaud F: Mechanism of the anti-obesity effects of oxytocin in diet-induced obese rats. PLoS One 2011; 6:e25565–e25577.
33 Beranger GE, Pisani DF, Castel J, Djedaini M, Battaglia S, Amiaud J, Boukhechba F, Ailhaud G, Michiels JF, Heymann D, Luquet S, Amriet EZ: Oxytocin reverses ovariectomy-induced osteopenia and body fat gain. Endo-crinology 2014; 155: 1340–1352.
34 Holder JL Jr, Butte NF, Zinn AR: Profound obesity associated with a balanced translocation that disrupts the SIM1 gene. Hum Mol Genet 2000; 9: 101–108.
35 Dombret C, Nguyen T, Schakman O, Michaud JL, Hardin-Pouzet H, Bertrand MJ, De Backer O: Loss of Maged1 results in obesity, deficits of social interactions, impaired sexual behavior and severe alteration of mature oxytocin production in the hypothalamus. Hum Mol Genet 2012; 21: 4703–4717.
36 Zhang G, Bai H, Zhang H, Dean C, Wu Q, Li J, Guariglia S, Meng Q, Cai D: Neuropeptide exocytosis involving synaptotagmin-4 and oxytocin in hypothalamic programming of body weight and energy balance. Neuron 2011; 69: 523–535.
37 Plante E, Menaouar A, Danalache BA, Yip D, Broderick TL, Chiasson JL, Jankowski M, Gutkowskaet J: Oxytocin treatment prevents the cardiomyopathy observed in obese diabetic male db/db mice. Endocrinology 2015; 156: 1416–1428.
38 Elabd C, Cousin W, Upadhyayula P, Chen RY, Chooljian MS, Li J, Kung S, Jiang KP, Conboyet IM: Oxytocin is an age-specific circulating hormone that is necessary for muscle maintenance and regeneration. Nat Commun 2015; 5: 4082–4507.
39 Chiodera P, Volpi R, Capretti L, Marchesi C, d’Amato L, De Ferri A, Bianconi L, Coiro V: Effect of estrogen or insulin-induced hypoglycemia on plasma oxytocin levels in bulimia and anorexia nervosa. Metabolism 1991; 40: 1226–1230.
40 Demers LM, Hankinson SE, Haymond S, Key T, Rosner W, Santen RJ, Stanczyk F Z, Vesper HW, Ziegler RG; Endocrine Society; PATH (Partnership for Accurate Testing of Hormones); AACC (American Association for Clinical Chemistry): Measuring estrogen exposure and metabolism: workshop recommendations on clinical issues. J Clin Endocrinol Metab 2015; 100: 2165–2170.
41 Coiro V, Passeri M, Davoli C, d’Amato L, Gelmini G, Fagnoni F, Schianchi L, Bentivoglio M, Volpi R, Chioderaet P: Oxytocin response to insulin-induced hypoglycemia in obese subjects before and after weight loss. J Endo-crinol Invest 1988; 11: 125–128.
42 Marzullo P, Caumo A, Savia G, Verti B, Walker GE, Maestrini S, Tagliaferri A, Di Blasio AM, Liuzzi A: Predictors of postabsorptive ghrelin secretion after intake of different macronutrients. J Clin Endocrinol Metab 2006; 91: 4124–4130.
43 Sinha MK, Ohannesian JP, Heiman ML, Kriauciunas A, Stephens TW, Magosin S, Marco C, Caro JF: Nocturnal rise of leptin in lean, obese, and non-insulin-dependent diabetes mellitus subjects. J Clin Invest 1996; 97: 1344– 1347.
44 Roelfsema F, Pereira AM, Veldhuis JD, Adriaanse R, Endert E, Fliers E, Romijn JA. Thyrotropin secretion profiles are not different in men and women. J Clin Endocrinol Metab 2009; 94: 3964–3967.
45 Blevins JE, Schwartz MW, Baskin DG: Evidence that paraventricular nucleus oxytocin neurons link hypotha-lamic leptin action to caudal brain stem nuclei controlling meal size. Am J Physiol Regul Integr Comp Physiol 2004; 287:R87–R96.
46 Matarazzo V, Schaller F, Nedelec E, Benani A, Penicaud L, Muscatelli F, Moyse E, Bauer S: Inactivation of Socs3 in the hypothalamus enhances the hindbrain response to endogenous satiety signals via oxytocin signaling. J Neurosci 2012; 32: 17097–17107.
47 Fenselau H, Campbell JN, Verstegen AM, Madara JC, Xu J, Shah BP, Resch JM, Yang Z, Mandelblat-Cerf Y, Livneh Y, Lowell BB: A rapidly acting glutamatergic ARC-PVH satiety circuit postsynaptically regulated by α-MSH. Nat Neurosci 2017; 20: 42–51
48 Thienel M, Fritsche A, Heinrichs M, Peter A, Ewers M, Lehnert H, Hallschmid M: Oxytocin’s inhibitory effect on food intake is stronger in obese than normal-weight men. Int J Obes 2016; 40: 1707–1714.