EUI WORKING PAPERS
© The Author(s). European University Institute. version produced by the EUI Library in 2020. Available Open Access on Cadmus, European University Institute Research Repository.EUROPEAN UNIVERSITY INSTITUTE 3 0001 0026 9992 6 © The Author(s). European University Institute. version produced by the EUI Library in 2020. Available Open Access on Cadmus, European University Institute Research Repository.
EUROPEAN UNIVERSITY INSTITUTE, FLORENCE
ECONOMICS DEPARTMENT
EUI Working Paper ECO No. 96/21
‘ Actual’ Versus ‘ Virtual’ Employment in Europe: Is Spain Different?
RA M O N M ARIM ON and Fa b r i z i o Zi l i b o t t i
BADIA FIESOLANA, SAN D O M ENICO (FI)
© The Author(s). European University Institute. version produced by the EUI Library in 2020. Available Open Access on Cadmus, European University Institute Research Repository.
All rights reserved.
No part of this paper may be reproduced in any form without permission of the authors.
© Ramon Marimon and Fabrizio Zilibotti Printed in Italy in July 1996 European University Institute
Badia Fiesolana I - 50016 San Domenico (FI)
Italy © The Author(s). European University Institute. version produced by the EUI Library in 2020. Available Open Access on Cadmus, European University Institute Research Repository.
‘Actual’ versus ‘Virtual’ Employment
in Europe:
Is Spain Different?*
Ramon Marimon'
Fabrizio Zilibotti
European University Institute
Universitat Pompeu Fabra
Universitat Pompeu Fabra
and CEPR
and CEPR
May 1996
A bstract
We study the evolution of sectoral employment and labor cost in eleven Eu ropean countries in the last two decades. Our statistical approach consists on decomposing for country, industry and temporal effects. Virtual economies are constructed by filtering country effects. We find that sectoral effects account for more that 80% of the long-run differentials across countries and industries in employment growth, whereas country-specific effects are more important in the analysis of labor cost dynamics. The initial distribution of labor across sectors plays a crucial role in explaining cross-country differences on employment. We pay special attention to Spain, the country that has experienced a higher persis tent unemployment rate, and show that this can be the effect o f a severe problem of sectoral reallocation, originating from the very high weight of the agricultural employment in 1975. Our study of the virtual economies also provides new evi dence about the relative performance of some industries and/or countries, e.g.. the poor performance of Belgium, the relatively good performance of Italy, in particular its textile sector, etc.
JE L C lassification : C23, J21, J31, L60.
K e y w o rd s: Decomposition, Employment, Labor Cost, Panel Data, Sectoral Effects, Spain, Virtual Economy.
*We would like to thank for the financial support of the Secretarla de Estado de Economia
del Ministerio de Economia y Hacienda of Spain and for the comments of Daron Acemoglu,
Tito Boeri, Fabio Canova, Daniel Cohen, Assar Lindbeck, Miquel Nadal, Alfred Pastor, An drew Scott and seminar participants at the European University Institute, the Ministerio de Economia y Hacienda, the CEPR Summer Macro Workshop, the Society for Economic Dy namics and Control 1995 Meeting in Barcelona and the International Institute of Economic Studies in Stockholm. Only the authors, however, are responsible for the results and opinions expressed in this paper.
tRamon Marimon: Department of Economics, European University Institute, Badia Fiesolana, 1-50016 San Domenico di Fiesole (FI), Italy. Ph.: (+39-55) 46.85.252; fax: (+39- 55) 46.85.202; e-mail: [email protected] © The Author(s). European University Institute. version produced by the EUI Library in 2020. Available Open Access on Cadmus, European University Institute Research Repository.
© The Author(s). European University Institute. version produced by the EUI Library in 2020. Available Open Access on Cadmus, European University Institute Research Repository.
1
Introduction
In most European countries, unemployment rates have been close or above 10% in the last decade. This fact has been regarded as unacceptable by most economists and politicians: it questions whether resources are efficiently allo cated and it raises important social issues. But the European unemployment is not a homogeneous phenomenon, and is dramatically severe in some countries. In Spain, for example, with above 20% unemployment rates, a policy which succeeded in bringing the national unemployment rate down to the European average would be viewed as a great achievement. This paper studies these dif ferences on employment patterns across European countries using disaggregate sectoral data. Our work complements, in part, an expanding literature on Eu rope’s unemployment problems, among them [1], [5] and [18]. To a large extent, this literature focuses on macroeconomic or regulation (social protection, etc.) policies that may explain, both the high European unemployment rate and the differences across countries. We ask a fairly modest (but, we think, impor tant) question: are the observed differences in the evolution o f employment across countries due to nation-idiosyncratic effects - such as labor policies - or, mainly, the result o f the composition o f sectoral effects in economies with different employment structures?
We consider ten European countries: Belgium, Denmark, Finland, France, Germany, Italy, Netherlands, Spain, Sweden and United Kingdom. We estimate a statistical model for the evolution o f employment and labor costs at the indus try level using data from these countries. The dynamics o f each variable are de composed into ‘country-specific’ , and ‘sector-specific’ effects (allowing for time variation o f both o f them) which are common to the ten European economies considered. The methodology adopted is a modified version o f the statistical model applied by Stockman [20] and Costello [6] to the analysis o f output and productivity growth trends.
Our results are fairly striking: almost 80% o f the long-run employment growth differentials across countries and industries is accounted by sectoral ef fects and only 20% by country effects. Our analysis not only provides a good long-run picture o f employment, it also helps to explain the short-run fluctu ations (60%), and shows that more than half of the variability explained by our model is accounted for by either ‘ international business cycle’ or ‘sectoral’ effects which are common to all countries considered. The remaining 47% is in stead explained by country-specific aggregate shocks1. In the case of labor costs, 1Garcia-Mila and Marimon [10] obtain similar results when they apply the same
method-© The Author(s). European University Institute. version produced by the EUI Library in 2020. Available Open Access on Cadmus, European University Institute Research Repository.
however, country-specific effects are substantially more important, and the vari ance decomposition o f the long-run effects attributes 80% o f the variability in the labor costs across countries and industries to country-specific effects.
A methodological innovation which is presented in this paper is the use the estimated sectoral effects of employment to simulate the behavior o f ‘virtual’ economies. In plain words, once we have filtered all components which have a nation-idiosyncratic nature, we simulate the evolution o f employment in each industry using the number of workers employed in the first year o f the sample as the initial condition. The study o f the ‘virtual’ economies shows that differences in the initial distribution of employment across sectors can cause significant divergences into the level o f employment in the period considered (1974-91). This analysis also allows us to assess the performance o f different sectors and industries from a comparative perspective, by characterizing what evolution employment in each industry would have followed had all country-idiosyncratic effects been absent.
The results o f the analysis have some surprising implications when we consider individual countries. In Spain, for example, the country where the boom o f unemployment was most spectacular during the sample period (the unemployment rate went up from 3.6% in 1975 to 22.4% in 1993), the generation o f employment in Spain, with the exception o f agriculture, looks pretty much ‘ European’ . In other words, the long-run rate o f employment creation in the non-agricultural sector is very similar to (actually, slightly higher than) that of the other countries considered.
By taking the ‘virtual’ economies as filters for observed patterns we can obtain some useful insights for specific countries, sectors or cyclical fluctuations. For example: with respect to long-run country performances we observe that Germany or Denmark follow employment paths that are very close to their ‘virtual’ economies while Belgium shows a poor performance and Italy clearly outperforms its ‘virtual’ economy; with respect to the performance o f a given sector by country, we observe wide disparities in the textile sector, with Italy, again, outperforming the industry average; with respect to cyclical fluctua tions, we observe severe downswings in Spain (1979-88) and United Kingdom (1981-88). These departures from the ‘virtual’ model can be associated with idiosyncratic factors, like political shocks (the transition towards democracy in Spain, the government o f Mrs. Thatcher in the UK, etc.).
From the detailed picture o f a country or a sector to the more general ology to the comparative study of employment behavior across Spanish regions.
© The Author(s). European University Institute. version produced by the EUI Library in 2020. Available Open Access on Cadmus, European University Institute Research Repository.
picture o f employment (and cost) growth patterns in Europe, this paper em phasizes several aspects that, in general, have not been properly considered. In doing so, it also opens new questions in which to center future theoretical research. In particular, we think that two facts, documented in this paper, are not well accounted for by existing models o f the labor market. First, long-term growth o f employment is mostly explained by sectoral effects and shows a low -b u t negative and significant- elasticity with respect to (country L: industry) long-term growth o f labor costs, furthermore labor supply differences, such as the existence o f a larger pool o f displaced workers from other sectors, do not seem to have had a major impact on labor costs and employment creation (see. Section 5). Second, while short-term growth fluctuations of employment have an important national component such component is vert’ weakly correlated with countries’ idiosyncratic fluctuations o f labor costs. That is. idiosyncratic short-term fluctuations o f productivity (and profits) ought to be behind the corresponding employment fluctuations. This last fact is. therefore, consistent with other studies that find an important country specific component in de composing productivity growth (see, for example. [6]). It is not our aim here to discuss the shortcomings o f different theories of the labor market, nor to pro vide a new model that encompasses these facts. W e leave this task for future research.
The rest o f the paper is organized as follows. Section 2 explains our statis tical model and describes the sources o f the data. Section 3 report the statistical results for employment in more detail. Section 4 describe the construction of our ‘ virtual’ economies and graphically shows the results. Section 5, studies the behavior o f labor costs and productivity. Section 6 concludes.
2
Decomposing the evolution of employment.
A statistical model.
In this section we propose a statistical model which disentangles country-specific and sector-specific components to the net generation o f employment at the in dustry level. The model in the spirit o f Stockman [20] and Costello [6], though both our specification and identifying assumptions are different. We are moti vated by the observation that on the one hand there are significant comovements o f employment at the industry level across countries. These car. be ascribed to either sector-specific (worldwide sectoral technological trends, movements in the international price system) or aggregate effects (‘international business cycle’).
© The Author(s). European University Institute. version produced by the EUI Library in 2020. Available Open Access on Cadmus, European University Institute Research Repository.
On the other hand, the generation o f employment is affected by country specific factors, such as labor legislation, contractual practices, fiscal and monetary poli cies, etc.. Nation-level effects can have either an aggregate or industry-specific nature.
We specify the model as follows:
e(i, n, t) — h(i) + m(i, n) + b(t) + f (i , t) + g(n, t) + u(i. n. t) (1) i = 1, n = 1 , JV; t = 1,..., T
where:
- e (i,n ,t ) represents the growth rate of total employment in industry i in country n at time f,
- h(i) is a time invariant sectoral trend component which is shared by all countries;
- rri(i. n) is a time invariant effect which is specific to industry i and country n;
- b(t) is a pure time effect;
- f (i , t) is the interaction between a fixed industry and a time effect; - g(n, t) is the interaction between a fixed nation and a time effect; - u (i,n ,t) is an idiosyncratic disturbance which is orthogonal to all other
effects.
The model presented is unidentified, and cannot be estimated before a sufficient number o f restrictions are imposed. Here, we depart from the strat egy followed in the previous literature which was to impose zero restrictions to some parameters, by assigning to a time period and a country the role of numeraire2. Identifying the model by means of ‘zero restrictions’ has in fact a number o f shortcomings. First, the results o f the variance decomposition are not independent o f the country chosen as a reference point. Second, since nation and industry effects are correlated, then some fraction o f the variance will be explained by the covariation o f the different effects and it will only be possible
2For instance, Stockman assumes that (i) g ,(N ,t) = 0 for all t and (ii) f s(i,T ) =
gs(n ,T ) = 0 for all i, n, where N ,T are the indices for the last country and time in the
sample. In his model this guarantees identification.
© The Author(s). European University Institute. version produced by the EUI Library in 2020. Available Open Access on Cadmus, European University Institute Research Repository.
to disentangle the variance which is attributed to the orthogonal components o f each effect (see [20], p. 392, and [6], p. 218).
Here, we will assume that all different effects are orthogonal. This as sumption is, like any alternative one, criticizable. But in the absence o f a theoretical model which predicts a particular structure o f correlation we view it as a natural benchmark (this is for instance a standard identifying assumption in structural VAR models). We will show that this corresponds to take as the reference point, instead o f one specific country, industry or year, the respective sample averages.
More specifically, we assume that:
- T.n=i m(*>«) = 0, i =, 1,..., I
- E i= i/(M ) = 0, t =, 1,..., T- T.I=1 f(i,t) = 0,
i=, 1,...,/
- Tj=i g(n, t) = 0, n = , 1,..., N - E " =1s (n ,t) = o , t = , i , . . . , r-
eL 6(0 = 0
which give a set o f 2T + 21 + N 4- 1 restrictions, o f which all but two are independent. This guarantees exact identification to our model. The interpre tation o f the various effects is the following:
(i) The vector H = h(i) represents the sectoral trends o f employment growth. More precisely, h(ia) is the unweighted3 European mean over the yearly average employment growth rates in industry ia.
(ii) The matrix M = {m (i,n ) } gives the differences between country-specific employment trends in industry z’s and the average European rate for the same industry, i.e. m (i',n ) = ^ ^E^=i(e(i*, rz,4) — fi(z*))).
(iii) The vector B = b(t) represents international business cycle effects which affect homogeneously employment growth rates across both industries and countries. Note that business cycle effects are assumed to average zero over time.
3In this work, all averages are computed by giving the same weight to the observation of each country. We discuss this issue in the next section.
© The Author(s). European University Institute. version produced by the EUI Library in 2020. Available Open Access on Cadmus, European University Institute Research Repository.
(iv) The matrix F = {/(£ .£ ) } represents industry-specific effects which cause temporary deviations from the employment trend in industry-d (in all countries) during the year t. For instance f ( i a. 1978) says how much in 1978 the European employment in industry ia was above its trend (aside from business cycle effects).
(v) The matrix G = {g (n ,t)} represents country-specific aggregate effects, or national transitory deviations o f employment growth with respect to the international business cycle.
There are three differences between the specification o f our model and that proposed by Stockman [20] and Costello [6]. First, we explicitly specify an ‘international business cycle effect’ , which in their model get confused with the ‘sectoral’ effect. Second, we disentangle the part o f the trend which is common to all countries from that which is country-specific4.
Third, we use different identifying restrictions. In particular, our restric tions make all components orthogonal. This is the most important innovation o f our approach.5
D a ta so u rce s
We use yearly data from 1974 to 1991 for total employment (from which growth rates from 1975 to 1991 have been computed) o f ten european countries and fifteen industries. We have data disaggregated by the following activi ties: agriculture (agr)\ mining, electricity, gas and water (ene); food, beverages
4The two models can be easily reconciled if one rewrites (1) as:
e (i,n ,t ) = m s(i,n ) -I- } s(i,t) + gs(n ,t) 4- us( i,n ,t) (2)
which is the model which they estimate, taking:
m a( i,n )= T n (i ,n ) + h(i) ; f s(i,t) = b{t) + f ( i , t ) ; gs(n ,t) = g{n ,t)
5To see the orthogonality between components consider, for example, components and g (n , t ):
E E /( » , T )g(n , T ) = £ / ( * , T ) E !?(«, ? ) = 0 VT
i n i n
=> E E E /(*’ *)»(". o = o
t i nSimilar arguments would show that any pair of components are by assumption orthogonal in our model. © The Author(s). European University Institute. version produced by the EUI Library in 2020. Available Open Access on Cadmus, European University Institute Research Repository.
and tobacco (fo d ): textiles, wearing apparels and leather industries (tex): pa per, printing and publishing (pap): chemicals, petroleum, rubber and plastic (che); non-metallic mineral products (mnm); basic metal products (bmi): fab ricated metal products, machinery and equipment (meq): wood, furniture and other manufactured products (mot): construction (cst): wholesale, retail trade, restaurants and hotels (ret); transport, storage and communication (trs): fi nance, insurance and real estates (fin ): community, social and personnel ser vices (com). The data for all countries except for Spain are drawn from the OECD International Sectoral Database (ISDB. revision o f 1994). whose method ological aspects axe described in [14].
We had to make some adjustments in order to obtain data which are comparable across countries. First, in some countries the figures o f employment in the financial sector did not include real estate activities. In these cases we have used the growth rate of employment in the financial activities for which the data were available. When variables in levels have been needed (section 4). the size o f the financial sector has been estimated bv adjusting the available figure by the share o f employment in real estate activity over the total f in sector in the other countries where these were separately reported. Second, the OECD data set reports the category ‘producers o f government services', as a separate sector, differently from the data which we have available for Spain. Third, in some countries some workers were reported as employed in unclassified ‘other activities’ . In all problematic cases we have compared the data with those provided by the International Labour Office Statistical Year Books (table B3). and made adjustments such that the total employment figure was unaffected.
The source o f data for Spain is Garcia, Goerlich and Orts [9] - based on Encuesta Industrial (E l) - for the manufacturing sector and the International Labour Office Statistical Year Books (with data proceedings from Encuesta de Poblacion Activa (E PA)) for non manufacturing activities. Since there axe discrepancies between the two sources o f data (in particular, the sum o f the disaggregated employment levels from El does not match with the figure for total employment in manufacturing reported by EPA), we opted to use the aggregate figure for employment in manufacturing provided by EPA and the shaxe o f employment at the industry level implied by the El data.
© The Author(s). European University Institute. version produced by the EUI Library in 2020. Available Open Access on Cadmus, European University Institute Research Repository.
3
Statistical results.
The model is estimated using a dummy variable regression method for a panel data o f employment growth rates. The residuals o f the regression are the esti mates o f u (i,n ,t). The model explains (as either sectoral, or national or time effects) almost two thirds o f the employment growth rate variance in the ten countries studied. The formal statistics o f the regression are Ft2 = 0.647. and a highly significant F(533. 2016) = 6.946.6
Tables la and 16 report the point estimates of the coefficients of the model. In table la we give the trend components o f the employment growth rates, disentangling the (yearly) average European sectoral growth rates (H (i)) from country-specific deviations (M (i,n )). Consider the vector of sectoral trends. H (i). As expected, employment in agriculture falls steadily, at a rate of about 3% per year. In the manufacturing industry, all industries seem to have expelled labour force in net terms, though at rather different speeds, and with significant differences in the time patterns (as revealed by table lb ). On the one hand, the textile and basic metal industry are characterized by a high rate o f destruction o f employment (at an average 4.1% and 2.9% per year, respectively). The industries o f paper and chemicals follow a more cyclical pattern, and almost maintain the initial employment throughout the period considered. Food, non metallic minerals and machinery and equipment behave in an intermediate way, loosing employment at about an average 1% per year. The service activities are clearly the main net creator o f employment in the period considered, with a leading role of the financial sector, whose net absorption of labour force proceeds at an annual 3.6%.
INSERT TABLE l.a and l.b
The matrix M (i,n ) shows, by columns, the relative performance o f the different industries in a particular country. As a whole, Italy seems to have been the best and Belgium the worst performer7. It is perhaps surprising to observe that Spain, the country whose unemployment rate has grown most during the
6There is some marginal evidence of serial correlation of the residuals (Durbin Watson statistics = 1.63, first lag correlation coefficient = 0.18). A procedure to correct for this problem is suggested by [20], p.395. Our results seem to be robust to the introduction of an autorregressive component.
7The finding that large economies like France and Germany exhibit very little deviations from the average for almost all sectors suggest that weighting the countries by their relative size is unlikely to change our results significantly.
© The Author(s). European University Institute. version produced by the EUI Library in 2020. Available Open Access on Cadmus, European University Institute Research Repository.
sample period, has generated more employment than average in almost all sec tors. with the only significant exception o f agriculture! In particular, there is a positive country effect for the textile industry, which has lost less employment than predicted by the purely sectoral effect (with a difference o f the order of 1.3% per year). Among services, trade and hotel activities (tourism) together with community (particularly, government) services grew significantly above the European average.
Table lb reports the estimates of all time varying effects. Notice that the ‘ business cycle effects’ record the crisis o f 1975. the recovery o f 1979-80. a new slump in 1982-84, then a prolonged boom in 1985-90. and finally the spark o f the most recent recession in 1991. The matrix (G (n ,t)) shows the country-specific fluctuations For example, the severe recession in UK at the beginning o f the 1980’s. Focusing again on Spain. G(Spain, t)) reveals a heavily cyclical pattern, more pronounced than in most o f the other European countries. In particu lar, after a relatively good reaction to the first oil shock. Spain experienced a prolonged negative period from 1978 to 1985. Also, Spain clearly misses the recovery o f 1979-80. corresponding to the years o f political instability during the transition which preceded the Socialist electoral victory o f 1982. On the other hand, Spain experiences a rapid recovery in the end o f the eighties and in 1991 it was not suffering yet from the effects o f the mot recent recession.
We can proceed to assess formally the relative importance o f country and sectoral effects on both the trend and short run dynamics. The first question which we address concerns the relative variability across countries and indus tries o f the employment trends. Do we observe more variability in the evolution o f employment across industries, or across countries? Since aggregate unem ployment rates have grown unevenly across countries, the answer can suggest if the differences in the structure factor to understand the evolution o f the differ ent European countries. To begin with, we calculate the vector o f time average employment growth rates:
1 T
e(i,n) = - } 2 e( i , n, t)
1 (=i
and decompose its variance into sectoral effects (h{i)) and country-specific de viations (m (i.n )). The results are reported in Table 2a.
© The Author(s). European University Institute. version produced by the EUI Library in 2020. Available Open Access on Cadmus, European University Institute Research Repository.
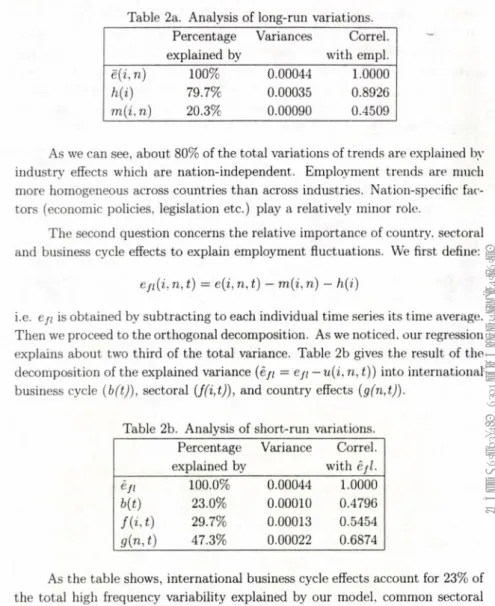
Table 2a. Analysis o f long-run variations. Percentage explained by Variances Correi, with empi. e(i, n) 100% 0.00044 1.0000 h(i) 79.7% 0.00035 0.8926 m (i, n) 20.3% 0.00090 0.4509
As we can see, about 80% o f the total variations o f trends are explained by industry effects which are nation-independent. Employment trends are much more homogeneous across countries than across industries. Nation-specific fac tors (economic policies, legislation etc.) play a relatively minor role.
The second question concerns the relative importance o f country, sectoral and business cycle effects to explain employment fluctuations. We first define:
e f i ( i , n , t ) = ) — m( i ,n) — h(i)
i.e. e/; is obtained by subtracting to each individual time series its time average. Then we proceed to the orthogonal decomposition. As we noticed, our regression explains about two third o f the total variance. Table 2b gives the result o f the decomposition o f the explained variance (eji = e/; — u(i, n, t)) into international business cycle (b(t)), sectoral (f(i,t)), and country effects (g(n,t)).
Table 2b. Analysis o f short-run variations. Percentage explained by Variance Correi, with èfl. èfi 100.0% 0.00044 1.0000 b(t) 23.0% 0.00010 0.4796 R i't ) 29.7% 0.00013 0.5454 g{n, t) 47.3% 0.00022 0.6874
As the table shows, international business cycle effects account for 23% of the total high frequency variability explained by our model, common sectoral effects accounts for 30% o f it, and country-specific effects account for 47% o f it. In conclusion, although more than half of the fluctuations explained by our model have a nation-independent origin (international business cycle plus sec toral effects), country-specific cyclical effects are also important. This contrast with the long-run effects where, as we have seen, country-specific effects are much less important.
© The Author(s). European University Institute. version produced by the EUI Library in 2020. Available Open Access on Cadmus, European University Institute Research Repository.
4
The construction of ‘virtual’ economies.
Table 2 already shows the importance o f the sectoral effects, particularly in the decomposition o f the long-term components. In this section we will provide a more direct picture o f these effects by considering the following exercise. Imag ine to filter out o f the actual series all country-specific components, i.e. to set m(i. n) = g(n .t) = u (i.n .t) = 0 for all i.t. We call virtual employment o f industry i. country k and year T, the level of employment obtained by taking as initial condition the actual level o f employment in 1974 and applying to it. up to year T, the sequence of growth factors:
evirt(i-1) = li(i) + b(t) + f(i. t).
We define as virtual employment of country k in year T the sum o f the virtual employment o f all industries located in country k in year T. Since different activ ities generate (or destroy) employment at different rates, a crucial determinant o f the evolution aggregate employment is the initial distribution o f employment across industries.
Our objective is to provide a picture of what employment levels would have been observed in each European country in the absence o f any ‘country- idiosyncratic’ effect. For this reason, after filtering out country-specific com ponents to each individual series, we will focus on the path o f the aggregate virtual employment o f each country8 We then compare the actual evolution o f employment in each country and the level predicted by the respective initial employment structure if all local industries had behaved like the European aver age. The motivation for the analysis o f this section is twofold. First, it provides an interesting benchmark to assess the evolution of employment in different economies. Second, it shows explicitly that even a homogeneous behavior o f the different industries across countries is consistent with an increasing dispersion in the unemployment rates, when no other market or adjustment mechanism are taken into account.
4.1 ‘ Virtual’ Europe.
Figure 1 shows a comparison between the ‘virtual’ and ‘ actual’ employment in the countries o f our sample. Among the large countries: Germany’s ‘actual’
8Here, we simply use point estimates without trying to construct confidence intervals for the ‘virtual’ economy - which we know would blow up - after some years.
© The Author(s). European University Institute. version produced by the EUI Library in 2020. Available Open Access on Cadmus, European University Institute Research Repository.
economy follows very closely its 'virtual' economy (except for the ‘ Berlin's Wall shock’ in 1990-1991); Italy is a strong outlier, and generates much more em ployment than the one predicted by its ‘virtual’ economy; United Kingdom in the last ten years has been performing slightly below its 'virtual’ economy, with a severe downturn at the beginning o f the eighties, and France that up to 1985 was outperforming its ‘virtual’ economy, has been lagging behind in the last six years o f the sample. Among the smaller countries. Belgium does not perform to its ‘virtual’ expectations, whereas Sweden outperforms it. As a whole (with the exception o f Italy), the differences between 'virtual' and actual economies should be regarded as fairly small.
INSERT FIGURE l.a, l.b , l.c, l.d , l.e, l.f. l.g, l.h, l.i. l.j
Our relation between ‘real’ and ‘virtual’ employment can also be translated into employment and unemployment rate figures. By employment rate, we mean the total employment a percentage of population from 15 to 6f. Table 3a shows observed employment rates in 1974 and 1990 and the ‘virtual’ employment rate in 1990, calculated by dividing the ‘virtual employment’ by the population from 15 to 64 (data for the population from [16] and [8]). The first interesting observation is that although the (arithmetic) mean o f the employment rates is about the same in 1974 and in 1990, the cross-country dispersion, as measured by the coefficient o f variation, increases by 50%. Furthermore, about the same increase in the dispersion is also found for virtual economies. This means that if in all countries employment had grown ‘ homogeneously’ industry-by-industry at the average rate, the resulting aggregate employment rates would have been far from converging to a common level. The second interesting point is that - with the exception o f the two countries o f Benelux which swap their respective positions - the ranking of countries in terms of observed and virtual employment rates is the same. Finally, for six out o f ten countries the difference between the virtual and observed employment rate does not exceed 1.3% in absolute value.
© The Author(s). European University Institute. version produced by the EUI Library in 2020. Available Open Access on Cadmus, European University Institute Research Repository.
Table 3a. Total employment as a percentage of population from 15 to 64. 1974 Actual 1990 Actual 1990 Virtual Germany 67.0 65.7 65.3 France 66.0 59.7 61.0 Italy 55.7 54.5 49.0 UK 71.5 72.0 73.1 Netherlands 55.6 61.1 52.1 Belgium 61.2 57.1 61.6 Denmark 73.9 75.6 76.8 Sweden 75.3 82.1 78.5 Finland 71.6 73.9 73.3 Spain 59.6 49.6 48.5 Mean 65.7 65.1 63.9 Coef. var. 0.106 0.152 0.169
Source: OECD [16] & Eurostat [8] (actual), own comput. (virtual).
Using our analysis to analyze the more standard unemployment figures is more problematic, since our analysis does not consider the dynamics o f the labor force. However, this seems a suggestive exploration, since the unemployment rates are the most commonly referred figures. In Table 3b we present the figures for real and virtual unemployment rate under the convenient, but clearly dis putable assumption that changes in the labor participation rates are exogenous. The results are very similar to those given for the employment rates, suggesting that changes in the participation rates are, overall, o f limited importance.
© The Author(s). European University Institute. version produced by the EUI Library in 2020. Available Open Access on Cadmus, European University Institute Research Repository.
Table 3b. Unemployment rates
1974 1990 1990
Actual Actual Virtual
Germany 1.6 4.8 5.3 France 2.8 9.1 7.1 Italy 5.3 9.8 19.1 UK 2.9 7.1 5.G Netherlands 2.7 7.5 4.3 Belgium 3.0 7.8 0.6 Denmark 2.1 8.0 6.6 Sweden 2.0 1.5 5.7 Finland 1.7 3.4 4.2 Spain 2.6 16.1 18.0 Coef. var. 0.37 0.50 0.74
Source: OECD & Eurostat (actual), own comput. (virtual).
In both tables 3a and 3b, it is striking to observe that the boom o f un employment in Spain is consistent with employment growing at the European level industry-by-industry. To stress the quantitative importance o f sectoral effects, in Figure 2 we provide an interesting inter-country comparison. We normalize the total employment o f every country in 1974 to be the same (as Spain), but we preserve the different initial distributions o f employment across sectors. We then generate the corresponding ‘virtual’ economies from these initial conditions. As it can be seen, countries with similar initial conditions, such as France and Germany, follow practically the same ‘virtual’ paths, but different initial conditions generate fairly different paths. To refer to unemploy ment rates, according to the virtual trends shown by Figure 2, if Spain had had the employment structure o f France in 1974, and had been subject to no idiosyncratic effect thereafter, its unemployment rate in 1991 would have been below 10% (assuming no change in the labor participation). The importance for the Spanish unemployment issue o f the large size o f agriculture, although occasionally noted in some previous work (e.g. [13]), has never been given a quantitative assessment so far. To get the flavor o f the magnitude o f the cross country differences in the initial employment structure, observe that the share o f employment in agriculture, industry, construction and services o f France in 1974 were, respectively, 11%. 28%, 9% and 52%. In the same year, the compo sition o f employment in the UK was 3%, 34%, 7% and 56%, whereas in Spain it was 25%, 27%, 10% and 38%. © The Author(s). European University Institute. version produced by the EUI Library in 2020. Available Open Access on Cadmus, European University Institute Research Repository.
INSERT FIGURE 2
Though the discussion carried on so far has focused on aggregate employ ment. our decomposition is also useful to study dynamics at the industry level. For example, using the estimates of table la and lb . one can observe how the textile sector has behaved quite differently across European countries. In Italy, the best performer, employment in textiles only fell by 150.000 units over the period 1974-1991. whereas in the United Kingdom the decrease was o f the order o f half million workers. Actual employment in the textile industry in Italy in 1991 is 500.000 units above the corresponding virtual employment. The relative success o f the textile industry and the growth of the financial sector account in fact for a large share o f the good performances o f Italy.
4.2
‘ Virtual’ Spain.
Table 3 already shows that Spain’s unemployment problem is not a perverse result. The ‘virtual’ economy has an even higher unemployment rate in 1991 (Figure l.j) than the real economy. This is particularly clear when one isolate the virtual ‘ urban’ sectors (Figure 3) where the size o f the surplus o f the real over the virtual employment in 1991 was about one million workers. On the other hand, as Table la shows, the process of job destruction in the agriculture has been more severe in its ‘ actual’ than in its ‘virtual’ economy, particularly during the expansive years o f the end o f the second part o f the 1980s. This may be a manifestation o f a negative impact on the agricultural sector o f the integration o f Spain in the community.
INSERT FIGURE 3
If we observe sectors in more detail we observe how the industrial sector follows fairly closely the path o f its ‘virtual’ economy (see Table la ). The service sector is stagnating from 1977 to 1985 and then experiences a boom in the years 1984-91. As the last raw o f Table lb shows, employment in Spain is also characterized by a heavy cyclical pattern, with a deep recession from 1977 to 1985, when the gap between the real and virtual employment went above half a million units, followed by a fast recovery thereafter. However, this recovery has only allowed to Spain to go back to its virtual path, which implies some extremely high unemployment rate.
© The Author(s). European University Institute. version produced by the EUI Library in 2020. Available Open Access on Cadmus, European University Institute Research Repository.
4.3
‘ Virtual’ Portugal,
The case o f Portugal is very interesting and deserves special attention to be con trasted with that o f Spain. In 1974 the agricultural sector represented a higher share o f total GDP in Portugal than in Spain (35% and 25%, respectively). Like in Spain, agriculture lost employment at a sustained rate, and its share in total employment fell down to 16.7% in 1991. However, total employment has grown in Portugal during the period 1974-91 (whereas it has fallen in Spain), the difference being due to the positive net creation o f employment in manu facturing and, even more, the boom of employment in services. Furthermore, in the critical period 1977-1982 employment in the Portuguese industry grows at an annual rate o f 3.2%, whereas in Spain it falls at yearly 3.5%.
This sharp contrast can be appreciated by comparing the ‘actual’ and the ‘virtual’ Portuguese employment9 (Figure 4). It is clear that in Portugal employment growth has clearly outperformed the ‘virtual’ economy. This is true even if the agricultural sector has lost more employment than in the ‘virtual" economy. It has been the growth o f employment in some industrial sector - textiles, in particular - and in services - commercial/turistic activities, in particular - which has driven the good aggregate performance. Table 4 reports the average growth rates o f employment in each Portuguese industry and the yearly average ‘virtual’ growth rate drawn from the last column o f Table la.
INSERT FIGURE 4
9The data sources for Portugal are [11] and [12]. However, the corresponding series, as well as others at our disposal, were not entirely consistent with (nor as complete as) the other country’s series. For this reason, we have not included Portugal in the computation of the average ‘ virtual’ economies. That is, our exercise for Portugal is as if Portugal was so small as to not affect European trends. This, of course, it is not entirely correct, but we think that the main features of our exercise would be preserved even if -with proper data- we were to include Portugal in our reference sample.
© The Author(s). European University Institute. version produced by the EUI Library in 2020. Available Open Access on Cadmus, European University Institute Research Repository.
Table 4. Comparative long-run performance of Portugal.
Sect. Portugal Europe Sect. Portugal Europe
Agriculture -0.032 -0.030 Energy 0.047 -0.005
Food -0.001 -0.009 Textiles 0.014 -0.041
Paper 0.003 -0.004 Chemicals 0.011 -0.002
Min. non-met. -0.001 -0.021 Basic metal -0.003 -0.029
Machinery 0.011 -0.009 W ood, leather -0.020 -0.012
Construction 0.008 -0.007 Retail trade 0.028 0.007
Transport Community serv. 0.013 0.038 0.004 0.019 Financial serv. 0.072 0.030
Source (for Portuguese data): ILO and INE St at. Yearbooks.
5
The behavior of labor costs.
To better understand the similarities and differences of employment patterns we also study the behavior o f labor costs by applying the same methodology to the corresponding series. We denote by w (i,n ,t) the growth rate of per employee real labor costs in industry i. country n and period t. Then, like in equation (1), we obtain the following decomposition:
w(i. n, t) = hw(i) + mw(i, n) + bw(t) + f w(i. t) + gw(n, t) + uw(i. n. t) (3) i = 1... / ; n = 1...A’ ; t = 1...T
where we use subindex w to denote the corresponding component of wages. Differences across industries in employment dynamics depend on the be havior o f both labor cost and productivity trends. For instance, a relatively high wage increase can be sustained by those sectors characterized by a faster growth rate of productivity, otherwise it should be matched by an employment reduction. However, if technical change is homogeneous across countries, one would expect that country-specific components of labor costs growth are nega tively correlated with country-specific components o f employment growth. For instance, if unit labor costs grow faster than average in the textile industry o f a particular country, one would expect that this industry generates less employ ment in that country than elsewhere. As we will see. the data although they provide some support to this conjecture, show that this relation is rather weak.
The sources of data used in this section are the same as for the employment series (the data for all countries except for Spain are drawn from the ISDB
© The Author(s). European University Institute. version produced by the EUI Library in 2020. Available Open Access on Cadmus, European University Institute Research Repository.
(revision o f 1994), whereas the Spanish data are drawn from Garcia. Goerlich and Orts [9])10.
After estimating the model (we omit the results here; details are available upon requests from the authors) with the real labor cost data, we performed the variance decomposition as we did in section 3 with the employment data. First, define the series:
w(i, n) = hw(i) + mw(i. n)
which summarize the trend components o f the labor cost series. The results of the decomposition o f the trend components are given in Table 5a. Cross-count ry variability accounts for two-third o f the variation. That is, while the long-run evolution o f employment is mostly (approx. 80%) explained by industry effects, the long-run evolution o f labor costs is mostly (approx. 79%) explained by country effects.
Table 5a. Analysis o f long-run variations. Percentage explained by Variance Correl. with ui w(i, n) 100% 0.000448 1.000 hw(i) 21% 0.000094 0.889 mw(i, n) 74% 0.000354 0.458
Next, we consider short-run fluctuations. We construct, as in Section 3, the panel o f labor cost deviations from trends:
Wfi(i,n,t) = w(i, n, t) — mw(i, n) — hw(i) = bw(t) + f w(i,t) + gw(n,t) + uw(i,n,t)
and we decompose the variance o f Wfi. Table 5b shows that sectoral and national effects have approximately the same importance. Also, observe that the business cycle effects has less explanatory power than in the analysis o f employment.
10The panel of series of real labor costs per employee is constructed from the panel of series labelled WSSS ( compensation o f employees, current prices) and EE (number of employees) in the ISDB. The price deflators for the labor costs are obtained by taking the ratio be tween the panel of series GDP (Gross domestic product, current prices) and GDPV (Gross
domestic product, 1985 prices). We could only perform this analysis for the (nine) two-digit
manufacturing industries listed in section 2 (note that we also re-estimated equation (1) after excluding the non-manufacturing activities, and using the number of employees instead of total employment). © The Author(s). European University Institute. version produced by the EUI Library in 2020. Available Open Access on Cadmus, European University Institute Research Repository.
Table 5b. Analysis of short-run variations. Percentage explained by Variance Correl. with Wfl. uifl 100.0% 0.001754 1.000 bw(t) 17.0% 0.000297 0.412 fw(l-t) 37.8% 0.000663 0.663 gw(n.t) 45.2% 0.000794 0.673
Finally, we analyze the comovements of cost and employment dynamics in the different components o f our decomposition. We first calculate the re gression coefficients, 0 = ^ Irlx) *' ^or a varlet.v ° f Pa' r X . Y o f labor cost and employment series, i.e. e(i.n ,t) vs. w (i.n .t) (original series), eft(i.n .t) vs. W fi(i,n.t) (detrended series). 6(f) + h(i) + f ( i .t ) vs. bw(t.) + hu.(i) 4- (time and industry effects), m (i,n) + g(n,t) vs. mw(i.n ) + gw(n .t) (country effects) u (i.n .t) vs. uw(i.n ,t) (idiosyncratic components). The correlation is negative and significant (there is a large number o f observations) between all five pairs considered, although in no case particularly high (the 0's range between —0.048 and —0.063). Second, in Table 6 we report the correlation between the corresponding estimated components.
Table 6. Correlation o f estimated components.
Y X 0 t-stat N. obs. e(i, n) w(i. n) -0 .1 3 8 -1 .7 2 4 90 h(i) hw(i) -0 .1 7 2 -0 .3 9 0 9 m (i, n) mw(i, n) -0 .1 2 7 -2 .1 2 7 90 b(t) bw(t) -0 .0 4 8 -0 .2 8 4 17 -0 .0 4 8 -1 .4 4 7 153 g(n,t) 9w(n,t) -0 .0 3 9 -0 .8 8 4 170
In the first three rows, we consider the trend components. The only sig nificant negative correlation is found between country-specific labor costs and employment trends (third row). Quantitatively, a country in which labor costs have grown at an annual 1% rate above the European average in a particular industries has experienced - on average - a 0.127% deficit in the annual employ ment growth rate in the same industry. This is not an aggregation effect. No other cross-correlation between components (h, / , g) is statistically significant11,
11 We also analysed cross-correlation at various lags and leads, and always found that they are less significant than contemporary correlation.
© The Author(s). European University Institute. version produced by the EUI Library in 2020. Available Open Access on Cadmus, European University Institute Research Repository.
although they all have the expected sign. In particular, the seemingly negative - but statistically non-significant - correlation between wage and employment sectoral effects reported in the second row is entirely due to an outlier, the basic, metal industry. The remaining eight pairs of observations exhibit no evidence o f correlation, and this confirms our expectation that cross-industry differences in technical progress would make this result unclear.
In summary, we find that the variations o f labor costs trends are better explained by country effects (cf. Table 5a). Since, on the other hand, variations o f employment trends are mostly explained by industry effects (cf. Table 2a). labor costs variations seem to contribute little to explain long-run employment patterns (this is confirmed by the first row o f Table 6). We were also inter ested in studying whether short-run country-specific deviations from 'virtual' employment, g(n ,t), which account for almost 50% o f the short-run employ ment fluctuations (cf. Table 2b), are related to the corresponding variations of labor costs, gw(n, t), but, as Table 6 (last row) shows, this does not seem to be the case.
5.1
Differences on employment patterns vs. differences
on the growth of labor costs
The previous results show that differences on (aggregate national) employment patterns, among the countries under consideration (Portugal excluded), cannot be explained by differences on the growth o f labor costs. The low negative elasticity between country-specific labor cost and employment trends (Table 6, 3rd row) implies that large differences on labor costs would have been required to accomplish the country-specific necessary adjustments due to sectoral changes. We now look at this issue in more detail.
We first study the labor costs in Spain, The obvious question, regarding Spain, seems to be: to what extent did the exceptional growth o f unemployment is related to the behavior o f the labor costs in Spain? Table 7a and 7b report a subset o f the estimated coefficient for the unit labor cost decomposition, com paring the average behavior and the Spanish case. As it can be seen from the first column o f Table 7a (average sectoral effects, Hw(i)), the average growth o f the labor costs is rather homogeneous across manufacturing industries, with the exceptions o f basic metal (5.3%) and chemical (3.7%) industry which faced some particularly high labor cost increase. The second column gives the devi ation o f the Spanish industries with respect to the average, revealing that in
© The Author(s). European University Institute. version produced by the EUI Library in 2020. Available Open Access on Cadmus, European University Institute Research Repository.
all sectors labor costs have grown marginally faster in Spain than in the rest of Europe, although the difference is substantial - within manufacturing activities - only in three industries: food, chemical and paper. Remarkably, chemical and paper are two o f the three best performing industries in terms o f employment (see Table la ). On the other hand, the growth o f labor costs in the Spanish textile industry is just the same as the European average.
Table 7a. Trends in labor costs. Spain and Italy vs. Europe.
Industry Hw(i) M (i, Sp.) M (i. It.)
Energy 0.025 +0.028 -0 .0 0 6 Food 0.027 +0.035 +0.011 Textiles 0.024 +0.000 -0.0 0 4 Paper 0.023 +0.007 +0.005 Chemicals 0.037 +0.025 +0.007 Min. non-met. 0.018 +0.000 +0.016 Basic metal 0.053 +0.004 +0.011 Machinery 0.024 +0.006 +0.016 Others 0.017 +0.009 +0.005
Table 7b reports the estimated time (business cycle) effects (B (t)) and the country-time effects for Spain (as a deviation from the average). Labor costs grew abnormally in Spain during 1975-76 (the period immediately after the death of Franco), then slowed down, and boomed again above the average during the second half o f the eighties, in particular, in 1989 and 1990 (the period after the general strike o f 1988, which put a break on some o f the labor reforms underway). The high wage pressure in the late eighties shows that the labor market was little sensitive to the persistence o f a very high unemployment rate - above 16% in the best years - and, to the opposite highly reactive to the change in income distribution (unfavourable to wage earners) which had occurred during the previous years.
© The Author(s). European University Institute. version produced by the EUI Library in 2020. Available Open Access on Cadmus, European University Institute Research Repository.
Table 7b. Fluctuations in labor costs. Spain and Italy vs. Europe.
Year Bw{t) Gw{S p.,t) Gw(It.,t) Year Bw(t) Gw{Sp.,t) G vilt-.t)
1975 0.025 +0.028 -0 .0 6 6 1984 -0 .0 1 4 -0 .0 1 6 +0.010 1976 0.043 +0.021 -0.011 1985 -0 .0 1 8 -0 .0 3 2 +0.022 1977 -0 .0 0 8 -0 .0 0 2 +0.014 1986 -0 .0 2 8 +0.016 -0 .0 1 8 1978 0.000 +0.000 -0 .0 0 6 1987 0.000 +0.010 +0.004 1979 0.015 -0 .0 2 8 +0.003 1988 -0 .0 0 5 +0.014 -0 .0 0 5 1980 -0 .0 0 4 -0.0 2 1 +0.012 1989 -0 .0 0 6 +0.021 +0.016 1981 0.005 -0 .0 0 3 +0.008 1990 0.012 +0.021 +0.014 1982 0.033 -0 .0 2 3 -0 .0 0 8 1991 0.017 -0.0 0 1 +0.005 1983 0.000 -0 .0 0 5 +0.006
As we have seen in Section 4, Spain’s actual employment trend does not differ substantially from its virtual trend. Consistent with this result, Tables 7a and 7b show that labor costs in Spain have not followed the necessary ad justment that may have been required in order to achieve higher employment growth. We have also seen in Section 4 that Italy and Potugal have outper formed their virtual economies. Has the growth o f labor cost been different in these countries? Unfortunately, we do not have comparable disaggregated cost data for Portugal. Nevertheless, available data suggests that the answer to the last question is basically no for Italy and yes for Portugal. Regarding Italy, Table 7a shows that the growth o f labor costs at the industry level have not been below the European average, with the exceptions o f the textile industry (which difference does not seem large enough to account for the success o f the Italian textile industry) and energy (a sector subject to important measurement errors). In contrast, wage and labor cost behavior in Portugual has been sub stantially different from that o f Spain and the rest o f Europe. For instance, there is a 47% increase o f real wages in manufacturing (according to Eurostat data), between 1974 and 1988 in Spain ( 3.3% yearly growth), while, for the same period, real wages only increase 6% in Portugal (0.4% yearly growth). As a result, in 1991 the hourly labor cost in industry is 3.92 ECU in Portugal and 12.15 in Spain (6 and 13.3, respectively in PPP).
In summary, the data suggest that, regarding Spain and Italy, the behav ior o f the labor costs in manufacturing is not anomalous within the group of European countries (Portugal excluded). For the unemployment rate to be the same in Spain as in the rest o f Europe, the Spanish industry and service sector should have absorbed a larger number o f workers, given the large displacement o f workers from agriculture. For this to be possible, it should have either oc curred a significant wage adjustment in the industry, resulting in a departure of
© The Author(s). European University Institute. version produced by the EUI Library in 2020. Available Open Access on Cadmus, European University Institute Research Repository.
labor costs from European standards as in Portugal, or an exceptional growth o f employment, above European standards, as in Italy12 In contrast, the data shows that Spain employment and labor costs have conformed to the European average in spite o f the potential pressure o f having a large mass o f unemployed people. Our figures on labor costs do not cover other implicit costs, such as firing costs, neither we account for other demand factors, such as different inte gration in international markets or availability o f capital (in particular, human), nor we consider supply factors, such as the different extent o f unemployment benefits. These factors may help to explain differences between Spain. Italy and Portugal13. It is beyond the scope o f this paper to account for these other empirical elements. W hat our finding suggests, however, is that the Spanish labor market does not need to be ‘more rigid' than that of other European countries, contrarily to what has been argued by much o f the previous research. The data analysed so far are hot inconsistent with the conjecture that most Eu ropean countries with their respective existing institutions might have suffered the same problem as Spain if they had been subject to the same problem o f sectoral reallocation.
6
Conclusions.
This work provides new evidence about the sources o f differences in employment growth rates across European countries in the last two decades. We only focus, however, on demand factors. In particular, by decomposing sectoral, country and temporal effects, we show the importance o f sectoral effects. We find that long-term variations o f employment are mostly explained by sectoral factors (around 80%), while -in contrast- long-term variations o f labor costs are mostly explained by country-specific factors (around 79%). While country-specific fac tors account for almost 50% o f the short-run fluctuations o f employment, these country-specific variations do not seem to correspond to country-specific
short-12Although Figure 2 and Table 3 show that employment growth in Spain should have been even above Italian standards in order to absorb the displaced labor force. Given the sharp dual structure of Italy, it would be interesting to check whether the actual employment in the Mezzogiorno - the region where the share of rural employment was significantly higher than average - is indeed larger than the virtual one, or whether the exception is represented by the success of the North of Italy.
13Notice that the puzzle that our paper raises is not why the Spanish labor market is different from other central European labor markets, but why is differer.i from other labor markets with which shares many similarities (for similarities see, for example, (18] and for a possible difference between Spain and Portugal-unemployment benefits- see [4]).
© The Author(s). European University Institute. version produced by the EUI Library in 2020. Available Open Access on Cadmus, European University Institute Research Repository.
run variations o f labor costs, which suggests that country-specific variations of employment may be related to country-specific variations o f productivity and profits.
Methodologically, the paper relies on a simple statistical technique which is not entirely new in the literature, but proposes an innovative identification scheme o f the various components which is easier to interpret, and permits to study simultaneously both “short-run” and “long-run” features o f the data. We believe that this simple model will be useful to the analysts o f data in various fields o f economics (e.g. regional economics). In particular, the concept of “virtual economy” has been particularly useful to focus on some particularly interesting country-cases.
Using the results of our estimation, and constructing the picture of “virtual employment” for each country, we have also discussed some individual case. In particular, we have shown that the pattern o f employment growth in Spain is far less anomalous among the European countries than what the observation of only the aggregate figures would suggest. A critical issue which emerges is that the initial structure o f employment in the mid 70’s (this is the difference from other advanced economies), would have required a much larger process o f labor mobility between sectors and industries than that which has been observed in the most developed European countries in the last two decades, in order to keep total employment rate close to the European standard. Our analysis of the labor costs in manufacturing shows that on the one hand these did not grow in Spain significantly more than in the rest o f Europe; on the other hand, the pressure o f the large mass o f people displaced from the agriculture seems to have induced no important wage adjustment.
W hy did other countries with a large initial share o f agriculture like Portu gal and Italy succeed in outperforming their virtual economy, whereas Spain did not? W hat has prevented the wage adjustment in Spain? These are questions which we do not answer and leave open to future research. Our hope is that our empirical analysis will help the research o f macroeconomists and theorists to address the correct questions, since we believe that the lack o f attention to a more disaggregated picture may have caused substantial misconceptions. In the case o f Spain, for instance, it has been argued that the origin o f the anomalous increase o f unemployment in Spain has been a policy shocks (e.g. monetary shocks) with long lasting effects (hysteresis). The fact that we did not detect any important permanent Spanish-specific effect casts some doubt on this inter pretation. To the opposite, our findings are consistent with recent evidence on labor turnover. In particular, that European turnover is mostly within industry
© The Author(s). European University Institute. version produced by the EUI Library in 2020. Available Open Access on Cadmus, European University Institute Research Repository.
and job -to-job (see, for example, [1]) since ‘displaced’ workers from agriculture do not seem to affect the evolution o f labor in other sectors. In fact, as Phelan and Trejos [19] have recently shown, in a model o f job-creation/job-destruction (as in [15]) shocks that affect the relative size o f sectors are likely to translate into a slow adjustment process leading to a recession. Models stressing the im portance o f sectoral shocks and reallocation effects have received so far limited attention in the analysis o f European unemployment problems. We are currently working along this line in search o f a satisfactory theoretical interpretation of our empirical results.
References
[1] Alogoskoufis, G., C. Bean, G. Bertola, D. Cohen, J. Dolado and G. Saint- Paul. 1995. Unemployment: Choices for Europe CEPR Monitoring Euro pean Integration 5, London.
[2] Bentolilla, S. and O. Blanchard. 1989. “Spanish Unemployment. Is There a Solution?” Economic Policy 10, 233-81.
[3] Bentolilla, S. and J.J. Dolado. 1994. “Labour Flexibility and Wages: Lessons from Spain.” Economic Policy 18, pp. 54-85.
[4] Blanchard, O. and J. Jimeno. 1995. “Structural Unemployment. Spain ver sus Portugal.” The American Economic Review Papers and Proceedings 85 2. pp. 212-218.
[5] Blanchard, O., J. Jimeno et al. 1995. Spanish Unemployment. Is There a Solution? CEPR, London.
[6] Costello, D. 1993. “A Cross-Country, Cross-Industry Comparison o f Pro ductivity Growth.” Journal of Political Economy 101 2. pp. 207-222. [7] Dolado, J.J. and J.F. Jimeno. 1995. “Why is Spanish Unemployment so
High?” wp. No. 9515. CEMFI, Madrid.
[8] Eurostat. 1992 “Basic statistics o f the European Community, 29th edition.” [9] Gaxcfa, S., F.J. Goerlich and V. Orts. 1994. “Macromagnitudes Basicas a
Nivel Sectoral de la Industria Espaiiola: Series Historicas.” W P -E C 94-03. IVIE, Valencia.
[10] Garcia-Mila, T. and R. Marimon. 1995. “Regional Integration and Public Investment in Spain.” (mimeo) Universitat Pompeu Fabra, Barcelona. [11] Instituto Nacional de Estatistica. Lisbon. Anuario Estatistico de Portugal.
Various issues. © The Author(s). European University Institute. version produced by the EUI Library in 2020. Available Open Access on Cadmus, European University Institute Research Repository.