Master’s Thesis
A study of Internet behavioral patterns
in a real access network
By
Alessandro Maretti, mat. 798587
a.y. 2014/2015
Department of Electrical and Information Technology Faculty of Engineering, LTH, Lund University
SE-221 00 Lund, Sweden
Department of Electronic, Information and Bioengineering (DEIB) School of Industrial and Information Engineering, Politecnico di Milano
Piazza Leonardo da Vinci, 32 20133 Milano, Italy
Abstract - English
Analyzing the Internet traffic is an important issue because it allows discovering the today’s patterns, understanding the current trends and forecasting the future ones. This translates in benefits for a multitude of subjects. For example Internet Service Providers and network operators can plan future network upgrades, downgrades, maintenance, and business strategies in order to keep their business profitable and competitive. Also, end users can take advantage of this competitiveness by choosing the operator that offers them the best quality of experience.
The main objectives of this study are to analyze Internet user behavior and Internet applications with particular focus on the behavioral difference between subscribers with different access speeds and on three particular categories of traffic: file sharing, gaming and personal cloud storage.
In this thesis the issue is operationalized by analyzing the IP traffic in an actual Swedish municipal network with around 2800 active households. The empirical data first are collected using Packet Logic, one of the most advanced solutions for deep packet inspection and then studied with a number of different methods and tools.
The results show that the subscribers are willing to upgrade their access speed in order to satisfy new needs. File sharing related traffic is decreasing in favor of legal audio-video streaming services but keeps being the most traffic consuming category. Subscribers with higher access speed exchange on average more traffic and use more bandwidth consuming applications. Mobile applications start penetrating among users; two of the six most played games are mobile-oriented. The user interaction patterns with such games are different from normal PC or console ones. Dropbox users have a tendency to upload small files on the cloud and use widely the collaboration tools that the software provides.
Abstract – Italian
L’analisi del traffico circolante su Internet ricopre oggi un ruolo di notevole importanza. Tale analisi permette infatti di ricavare modelli matematici del traffico, capire tendenze e prevedere possibili scenari futuri. I risultati di tale analisi si traducono in una serie di benefici per una moltitudine di soggetti. Per esempio un Internet Service Provider può pianificare aggiornamenti sulla propria rete, schedulare interventi di manutenzione, ragionare e programmare su future strategie di business e marketing; questo con l’obiettivo di essere sempre più competitivo e profittevole. Dall’altro lato gli utenti possono beneficiare di questa competizione scegliendo l’operatore che offre loro la migliore esperienza di utilizzo.
Il principale obiettivo di questo studio è analizzare i pattern di comportamento degli utenti di Internet con particolare focus sulle differenze tra utenti con varie velocità di accesso alla rete. In particolare lo studio si focalizza su 3 categorie di traffico: file sharing, gaming e personal cloud storage.
In questa tesi il problema è affrontato analizzando il traffico IP in una rete di accesso di una cittadina svedese. Tale rete consiste di circa 2800 utenti con svariate configurazioni di velocità di accesso. I dati utilizzati sono stati prima catturati utilizzando Packet Logic, uno dei più importanti tool attualmente sul mercato per Deep Packet Inspection. Successivamente tali dati sono stati analizzati con un numero di metodi e strumenti differenti. I risultati mostrano che gli utenti di Internet sono sempre più disposti ad incrementare la loro velocità di accesso per fare fronte a nuove necessità. Il traffico di tipo File Sharing sta diminuendo in favore di utenti che scelgono di fruire di streaming di contenuti audio e video. Ciò nonostante il File Sharing continua ad essere la categoria di applicazioni che genera più traffico. Utenti con capacità di accesso maggiore consumano in media più traffico e tendono ad utilizzare applicazioni che consumano più banda. Le applicazioni mobili che utilizzano Internet stanno crescendo di popolarità, ad esempio 2 dei 6 giochi più utilizzati vengono giocati principalmente da dispositivi mobili. Gli utenti Dropbox tendono a caricare sul cloud file di dimensioni ridotte e sembrano usare ampiamente i tool di collaborazione che la piattaforma mette a disposizione.
Popular science article
Analyzing the today’s Internet traffic is of fundamental importance. Studies show that in the next future many more people and many more devices will be connected to the Internet, which will contribute to generate more traffic. This project aimed to analyze the Internet user behavior of a population of around 2800 households in Sweden by focusing on two aspects: traffic patterns and applications. This was done in order understand how households use their Internet connections today, show variations occurred since previous studies were carried out, and forecast possible future trends. The main targets of such analysis are network operators that can use these results, for example, to plan network upgrades and downgrades, schedule maintenance, and optimize the network design with the twofold advantage of keeping their business profitable and provide to the end users with the best possible service.
The over 1027Tbyte of traffic, generated by the households during a 93 days interval, were analyzed by a hardware/software solution called Packet Logic (PL). PL is able to understand which application, service or protocol generates the traffic and makes this information accessible for further analysis.
The results showed that users with higher access speed tend to use the network more, both in terms of traffic and time. Subscribers with asymmetric access speed tend to have a higher upload bandwidth occupancy compared with symmetric users. A restricted amount of subscribers is responsible for generating a consistent part of the traffic, especially in the uplink. The file sharing traffic share decreased compared to previous studies but still consists in almost 50% of the total traffic. Streaming of media content increased its traffic share, being now the first category of traffic in the downlink. The most used file sharing applications is Bit Torrent which generates around 47% of the traffic in the network and is used actively by almost 60% of the subscribers. The 6 top played gaming applications contribute for over 56% of the gaming traffic. 4 of them are traditional PC/console games while 2 are mobile games. The user behavior between them changes, with mobile gaming sessions lasting for a smaller interval of time and being more frequent. Gamers tend to stream music and video while they play. Dropbox is penetrated in over 70% of the population but contributes only for a small part of the Internet traffic, which is
concentrated during the central part of the day. Users tend to store and retrieve relatively small size files on the Cloud, indicatively documents and low quality images. Sharing tools such shared links and folders seem to be widely used.
Further research in this field will have to focus, for example, on the analysis of more populated networks as well as on mobile traffic which is reported to be growing much faster compared to the fixed one.
Acknowledgments
The success of a project, small or big that can be, is always merit of a group of people. For this reason I would like to express my deepest appreciation for all of those who directly or indirectly helped me in this journey.
First of all, many thanks to Professor Maria Kihl who introduced me to the world of Academic Research and assisted me during these months providing me with invaluable help and support. This thesis would not have been possible without the help of Christina Lagerstedt, Research Engineer at Acreo AB, who promptly answered to all my questions and doubts. I would like to thank you also Professor Giacomo Verticale for accepting being my supervisor at Politecnico di Milano and for reviewing, once more, my thesis.
A special mention goes to all the people met during these two years in Sweden. For those who made me laugh and for those who made me cry; each of you gave me something that I will keep with me for the rest of my life.
Last and most important, I would like to thank my family for believing me unconditionally and furnishing me with all the possible support. Your love is my strength.
"Every time I get a webpage that comes up, I am sitting here thinking, 'Holy Crap, it actually worked!'”
Vint Cerf
Table of Contents
Abstract - English ... 2
Abstract – Italian ... 3
Popular science article ... 4
Acknowledgments ... 6
Table of Contents ... 8
1. Introduction ... 10
1.1. File Sharing ... 12
1.2. Gaming ... 13
1.3. Personal Cloud Storage Services ... 14
1.4. Project goals ... 15 1.5. Target ... 16 1.6. Report composition ... 16 2. Background ... 17 2.1. Related projects ... 17 2.2. Related Work ... 17 3. Methodology ... 20
3.1. Target network and population ... 20
3.2. Measurement tools ... 21 3.3. MySQL Database ... 22 3.4. Analysis Tools ... 24 3.4.1. MySQL Workbench ... 24 3.4.2. MATLAB ... 24 3.4.3. Java ... 24 3.5. Subscribers identification ... 24 3.6. Limitations ... 26 4. Results ... 28
4.1. Overview of Network South ... 28
4.2. Population of households and subscribers ... 28
4.3. Daily traffic analysis ... 30
4.3.1. Daily traffic pattern ... 30
4.4. Service specific analysis ... 32
4.4.1. Daily traffic volume and activity time ... 32
4.4.2. Bandwidth occupancy daily pattern ... 33
4.4.3. Instant traffic rate distribution ... 34
4.5. Cluster Analysis ... 36
4.6. Session duration analysis ... 38
4.6.1. Session length for different service types ... 39
4.6.2. Cumulative Distribution Function for session lengths ... 40
4.7. Traffic categories analysis ... 42
4.7.1. Traffic per category ... 44
4.7.2. Variation of the traffic mix during the day ... 46
4.7.3. Variation of the traffic mix during the analysis interval ... 46
4.8. Application penetration ... 47
4.8.1. General application penetration ... 47
4.8.2. Mobile application penetration ... 49
4.9. File sharing traffic analysis ... 50
4.9.1. Daily traffic pattern ... 50
4.9.2. Peer to Peer protocols’ traffic share ... 51
4.9.3. Further analysis on BitTorrent users ... 52
4.10. Gaming traffic analysis ... 53
4.10.1. Daily and weekly traffic patterns ... 53
4.10.2. Gaming Applications Penetration ... 55
4.10.3. Further analysis on players of the top 6 games ... 57
4.10.4. Gaming session duration analysis ... 59
4.10.5. Concurrent services ... 64
4.11. Dropbox traffic analysis ... 65
4.11.1. Average daily traffic for Dropbox ... 66
4.11.2. Dropbox session size ... 66
5. Conclusions and future work ... 69
5.1.1. Conclusions ... 69 5.1.2. Future work ... 71 Bibliography ... 72 List of Figures ... 75 List of Tables ... 76 List of Acronyms ... 77
A.1 Example of SQL query ... 79
CHAPTER
1
This chapter introduces the reader to the topic of this master thesis by presenting an overview of the field of study and describing goals, target and composition.
1. Introduction
Since many years, Internet has become a fundamental part of people’s lives. Its importance and diffusion grows year after year in every level of the society. The first “native digital” generation seems able to easily and quickly adapt to new technologies more than anyone else. Further, Internet based business moves every day an enormous amount of money.
Today’s Internet allows exchanging data between devices at rates that not many years ago were considered impossible. This is mainly due to the tremendous technological development that took place in the last decades, which allowed building faster network apparatus and discovering new and more efficient ways to transmit data over copper, optical fibers and radio waves. As a consequence of that, new techniques for Internet access have become popular in the last years: dial-up connections have given way to Digital Subscriber Lines (xDSLs), Fiber-To-The-Home (FTTH), Wi-Fi, and the new generation for mobile communication Long Term Evolution (LTE). These technologies allow fixed and mobile Internet access up to 1Gbps. Backbone networks are also continuously upgraded and further deployed. As this thesis is being written, for example, a network of 263 submarine cables allows a tremendous amount of data to be transferred among countries and continents [1].
As well as the remarkable technological development, the growth and diffusion of the Internet, at least in the in the most industrialized part of the world, has been facilitated by its relative ease to access and affordability. The importance of Internet as a way of exchanging information, connecting
people and promoting peace is widely recognized, and a huge discussion is ongoing about the opportunity to define Internet as a human right [2].
According to the International Telecommunication Union (ITU) estimations, the percentage on individuals using the Internet in 2014 is 78.3% in the developed world and 32.4% in the developing world, with a global average of 40.4% [3]. This difference on access opportunities, not only between developed and developing countries, but also among and inside them, is a hot topic that goes under the name of digital divide. According to Hilbert’s studies, global digital divide increased steadily during the technological development and started decreasing only in the last years [4].
Together with its diffusion and development, the way people use the Internet has changed. While not many years ago people used their connection mainly for browsing web pages, researching information and exchanging emails, nowadays people use a multitude of devices to do a variety of activities. The Internet that we know today goes under the name of Internet 2.0 and allows users generating information as well as accessing them.
Not only what people do on the Internet, but also how they do it, has changed radically. Personal computers share now the bandwidth with smartphones, tablets, smart TVs, videogame consoles, IP phones and many other devices which sizes get smaller and computation capabilities bigger. The number of devices capable to connect to the Internet is growing quickly. Already in 2017 it is expected that an enormous amount of devices, nearly three times the world population, will be connected to the Internet [5]. The world where not only devices but also objects are able to interact with other objects within the Internet goes under the name of Internet of Things (IoT) and seems to be a likely scenario for the next future as well as an important research topic for the scholars’ community, since it poses a consistent number of new challenges.
The number of different possibilities on how to use the Internet and the ever-growing amount of people willingly to do it has a clear impact on the amount of total data traffic. Studies and forecasts show that the Internet traffic is continuously growing and expected to be 4 Exabyte (4 million Terabyte) per day in 2017, meaning a compound annual growth rate of 23% from 2012 to 2017 [5]. The forecasted steady increment of IP traffic puts a
certain amount of pressure on Internet Service Providers (ISPs), transit network owners, network operators and content providers which, while trying to be competitive and profitable, also try to provide an always better service to their consumers.
In order to deliver the best Quality of Experience (QoE) to their customers is essential for the stakeholders to have an updated knowledge and possibly a prediction of what consumers do when they use the Internet. For this and for other reasons the analysis and characterization of Internet user behavior has to be considered a hot research topic.
The following sections give an overview of the three areas on which this thesis is particularly focused on.
1.1. File Sharing
The way people share computer files has changed remarkably with the time. Ten years ago it was more likely to exchange files through physical devices such as Compact Disks (CDs), Digital Versatile Disks (DVDs) or USB flash drives. Today the whole process can be done using Internet, which is in many ways, easier, faster, and cheaper.
There are multiple ways to share files using the Internet. The most common is using a peer-to-peer (P2P) network. This consists in users called peers which both receive and send data from and to other peers. Once a peer starts receiving a file it becomes itself provider of that specific file, contributing to its diffusion. Peers can be either managed by central servers or can be totally independent and thus able to look for other peers and exchange data with them. The first P2P network was Napster, active from 1999 and based on central servers able to index files. After Napster shut down for copyright violation in 2001, many other P2P networks such as Gnutella, eDonkey, Bit Torrent, Kazaa were developed.
Another way to share files is by means of specific websites that give users the opportunity to upload files in a server and then share a link with other users. Among the many websites that provided this service the most popular was Megaupload which was shut down by the United States Department of Justice during January 2012 for “Widespread Online
Copyright Infringement” [6]. The traffic generated by these services is anyway negligible compared with P2P applications.
According to Sandvine’s latest report, the share of file sharing traffic in Europe is declining in favor of legal video and audio streaming applications, which popularity is increasing [7]. Among other objectives it is also the aim of this project to verify empirically this trend.
1.2. Gaming
The technological development and the ease of access to the Internet supported the diffusion of alternative ways to play video games where users are able to interact with geographically dispersed players by means of the network. This phenomenon has grown consistently during the years and all the recent consoles on the market are now equipped with network interfaces such as Ethernet and Wi-Fi. These consoles often dispose of noticeable computational abilities and can also work as entertainment platforms allowing users to use an ever-growing number of online interactive services. Those concur, together with other applications, to generate Internet traffic. Some examples are: music and video streaming such as Spotify, Music Unlimited, Netflix, HBO, Vevo, and YouTube, social platforms like Twitter, Facebook, and Voice over IP (VoIP) services like Skype. The three most well-known console brands on the market are currently Microsoft, Sony and Nintendo. Each of them has its own multiplayer gaming and digital media delivery service platform called respectively Xbox Live, PlayStation network, and Nintendo network. Besides being the base for the Xbox consoles, Xbox live has recently been fully integrated with the new Microsoft Windows 8.1 and Windows Phone 8.1 making it the main entertainment platform for Windows products. Using the computer to play games keeps being an effective alternative to consoles. The need to protect games from piracy together with the diffusion of online gaming prompted the creation of distribution platforms where games can be purchased and downloaded in a safe and legal way. Such platforms allow users to form communities and interact with other players. The most used platform is Steam, with over 75 million worldwide users reported at the Steam Dev Days during January 2014. Other smaller platforms such for instance GameStop, Greenman Gaming, and Gamefly are also present on the market.
The diffusion of smartphones, tablets and netbooks together with the development of a more modern, cheap and fast mobile Internet network has had a huge impact in the diffusion of mobile online gaming. This success is confirmed by the fact that the 10 most popular mobile games in Google Play and ITunes App Store provide some kind of online experience. While this master thesis is being written there are more than 185.000 Applications categorized as Games in the Google Play Store, around 15% of the total number of Applications [8]. Similar statistics are not available for the main competitor ITunes App Store, Windows Xbox Live and BlackBerry App World but the same proportion is to be expected at least for ITunes App Store, the major competitor of Google Play. It is well known indeed that the majority of the applications are available for both platforms. Besides, Google Play Developers have announced that in the next future users with different devices with different brands and operating system will be able to play against each other through a cross-platform common interface [9]. This brief analysis on gaming and gaming devices suggests that online gaming, in all its forms, represents a growing market. Although gaming and entertainment applications do not have huge bandwidth consumption it is well known that factors such as packets round-trip-time and consistency can make the difference in the experienced QoE perceived by the users.
1.3. Personal Cloud Storage Services
Cloud Computing has gained importance in the last few years. While to end users it might sound as a quite abstract concept, cloud computing is more than a buzz word among IT experts. A cloud computer company is an organization that owns a variable amount of servers and makes its profit by selling to customers the possibility to use the resources of these servers and the network that connects them to the Internet.
Examples of services offered by cloud providers can consist in CPU time, disk space, database storage, virtual servers, etc. The main advantage for a business that use cloud services is that it does not need to build and maintain its own server infrastructure but instead it outsource this task to another company specialized in this particular sector. This has the positive consequence of reducing the IT costs of the business. Cloud providers usually bill their clients on the base of how much they consume the required resource, with benefit for unsteady and growing businesses. Some
of the most used Cloud infrastructures are run by well-known companies such as Amazon, Google, Microsoft, IBM and HP.
From an end user perspective the most known and used cloud service is storage. The user of a cloud storage service uploads and downloads data on the cloud. Additional services include the possibility to share files with other users as well as to keep files synchronized among different devices and accounts. These functions aim to ease processes as collaboration among different people, backup, etc. The most famous and reviewed cloud storage services are Dropbox, Google Drive, Box, and OneDrive, but many other smaller storage cloud providers offer the same products to more or less different type of users. The business model of these companies is usually to offer a ‘freemium’ service, meaning that a basic service with a limited amount of disk space and functionalities is given out for free and then is possible for users and business to pay and get an enhanced service. Dropbox is probably the most well-known personal cloud storage company. According to the company’s blog, there are over 200 million free Dropbox accounts and over 4 million businesses which use Dropbox as first cloud storage service [10].
1.4. Project goals
This master thesis aims to provide the reader with an up to date analysis of the Internet user behavior both by focusing on applications and demand patterns. Similar older or current studies conducted in Sweden and in Europe will be compared with the results in order to explain possible variations, differences and forecast future trends. This work put also much effort in finding behavioral difference among categories of users.
The research covers with particular attention three categories of applications: file sharing, gaming and personal cloud storage. For each of these categories it tries to answer specific research questions or problems. The main objectives for file sharing are to show if there is any sign that the share of this traffic is decreasing as indicated by a number of recent reports, show which file sharing protocol is the most traffic consuming and stress potential differences of traffic consumption among users of different service type. The goals of the gaming analysis are mainly to find out which are the most played and diffused online gaming applications and discover behavioral differences for players of different games, with focus on the differences between traditional console/PC online games and mobile online
games. The analysis of personal cloud storage services aims to find the penetration of Dropbox in the society as well as estimate the average size of the files uploaded and downloaded to and from this cloud service, furnishing possible explanations for the results.
1.5. Target
The main target of this thesis project are network operators such as Internet Service Providers (ISPs), municipalities, network administrators and owners, and more generally any person interested in networks and in user behavior.
From the understanding of current traffic patterns comes the possibility to plan future network upgrades, downgrades, optimize the network design, plan and modify or make new peering agreements.
1.6. Report composition
The thesis is structured as follow:
• Chapter 2 contains the background work, including the background project and the related works that have already been carried out on traffic and user behavior analysis.
• Chapter 3 describes the methodology that has been used to collect and analyze the traffic data.
• Chapter 4 shows the results of such analysis.
• Chapter 5 discusses and summarizes the results of the research and proposes further work.
CHAPTER
2
2. Background
This chapter illustrates the backgrounds of this thesis including the related projects and work that has been already carried out within the subject of analysis and characterization of Internet user behavior.
2.1. Related projects
This master thesis project is done within IP Network Monitoring for Quality of Service Intelligent Support (IPNQSIS) [11] a European project with partners from Sweden, Spain, France and Finland. The IPNQSIS project follows another 3-years-long European project called Traffic Measurements and Models in Multi Service networks (TRAMMS) [12]. The main objective of TRAMMS was to model traffic in multi-service IP networks and to develop both hardware and software tools for monitoring QoS and bottlenecks in networks. Relevant work done within TRAMMS is reported in the section Related Work.
The main object of IPNQSIS is to develop continuous monitoring systems to study the behavior of QoE. This is mainly done by analyzing Internet traffic, monitoring performances and their impact on the user experience. The results of this analysis will be a great help in the development of future network devices which will be able to cope with variables such as QoE and Service Level Agreement (SLA).
2.2. Related Work
In [13] the traffic pattern evolution of 4 different subscription groups is analyzed in a Swedish FTTH residential network in the period June 2007 – May 2011 using a commercial traffic analyzer. The study showed that within the considered time span the total daily Internet traffic had an annual growth rate of only 6%. The study also showed a dramatic increase of
streaming-related traffic, from 2% in 2007 to 13% in 2011, which made streaming the second largest traffic consumer after file sharing.
The main scope of [14] was to dig into properties of home networks with particular focus on availability, infrastructure and usage. The research was conducted on 126 home networks in 19 countries for 1 year using a custom home router called BISmark able to monitor the inbound and outbound traffic and send reports to a central server. The analysis focused on different aspects. Among other results it is shown that the most bandwidth consuming device in a home network uses, on average, 65% of the available bandwidth and the most popular domain is responsible, on average, of 38% of the total traffic.
In [15] the results of a series of measurement conducted in Spanish and Swedish broadband networks are shown. The paper outlines how a large percentage of the traffic generated by P2P applications is due to videos. The share of legal P2P is reported to be increasing. The paper showed also how legislations and policies can affect changes of user behavior. Similar work has been done in [16] where streaming media and file sharing together were found to account for over 80% of the total traffic in a commercial FTTH network of about 2600 households in Sweden during May, 2009. The study showed also how households with different access speed have diverse usage patterns; in particular households with lower speed tend to use the network for a lower time and amount of traffic, while increasing the speed the larger values of time and traffic were registered. The daily pattern was also analyzed; the lowest pick was registered between 5 and 6am while the highest pick between 8 and 11pm.
A wireless broadband Internet network was analyzed in [17] during a week time in 2007. The study showed that 62% of the traffic was generated by P2P applications which tend be active all day long. Among the file sharing clients, BitTorrent was found to be the most used.
Application-specific analyses are conducted in [18], [19], [20] and [21]. In [18] it is shown that partial proxy caching of the most viewed YouTube videos and their related videos, even with a relatively small cache size, can significantly improve the user QoE. In [19] the YouTube traffic generated by the University of Calgary was collected and analyzed during 2007. The paper outlines the difference that proxy caching and content delivery networks can do in reducing the traffic in the network link. In [20] the user
behavior in the most popular massive multiplayer online role-playing game, World of Warcraft was analyzed. In the considered network, a Swedish FTTH, 20% of the households were found to be playing, with an average playing time of about 1 hour per day and an average game session length of 2.3 hours. Finally, in [21] an analysis of the QoE in a Personal Cloud Storage Service is conducted by using a Dropbox-like application called The Box able to record information such as synchronization time and transfer throughput. The results show that available bandwidth and the recorded users’ QoE are extremely connected.
CHAPTER
3
3. Methodology
3.1. Target network and population
The network considered in this study is a Swedish municipal Fiber-To-The-Home network, denominated ‘network south’, with around 2800 unique active broadband connected households. The municipal network offers high speed Internet access. A household is allowed to choose freely among a different selection of broadband service providers by connecting a device to an Ethernet socket and browsing on a specific website. This includes the possibility to choose a range of different access speeds that can vary from a minimum of 1 Mbps to a maximum of 1 Gbps and can be symmetric or asymmetric. A small amount of Asymmetric Digital Subscriber Lines (ADSL) is also included in the network. In this report a particular access speed is referred as service or subscription type. The IP addresses in network south are assigned dynamically by DHCP severs.
The traffic measurements used in this thesis, unless otherwise specified, were performed between July 24, 2013 and October 24, 2013 for a total of 93 days. During this time interval 2817 households were active in the network. It is important to mention that some service types were excluded from this study since their population was too low to be statistically significant. Among them there are subscribers of these services: 1 Gbps, 250 Mbps, 250/100 Mbps as well as all the traffic that has not been possible to assign to any specific subscription type.
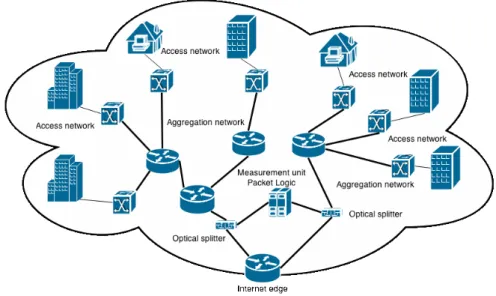
A conceptual representation of the network can be found in Figure 1. Households represent many social groups and building types spread in the town and connected to the access network through switches. The traffic leaving or entering a household is forwarded trough different levels of routers in what is called aggregation network in order to get to the Internet edge. The inbound and outbound traffic passes through optical splitters that make an exact copy of the traffic in favor of the measurement unit. The presence of the optical splitters does not interfere in any way with the
traffic. The thin lines represent links with capacity 1 Gbps while thick lines represent links with capacity 10 Gbps. It is important to mention that the traffic local to the municipal network, for example P2P traffic exchanged by two peers inside the municipal network, is forwarded directly by the internal routers and do not pass through any measurement instrument and thus cannot be part of this analysis.
3.2. Measurement tools
Traffic measurements have been realized using Packet Logic (PL), a commercial real-time hardware/software solution realized by Procera Networks [22]. PL is typically used by ISPs for a variety of purposes: traffic analysis, traffic shaping, firewalling, intrusion detection and prevention, and billing.
Traditional traffic analysis software uses TCP and UDP port numbers to identify and categorize the traffic. Nowadays this strategy is considered not accurate since many applications allow the user to change their default port or even use random ones. Besides protocol obfuscation mechanisms have been implemented, for instance, in many P2P applications in order to avoid the traffic to be discovered by such port based traffic analyzer.
Figure 1. Conceptual representation of network south.
Modern traffic analysis solutions, as the one used in this project, use Deep Packet Inspection (DPI) and Deep Flow Inspection (DFI). These techniques allow categorizing the traffic by looking not only at the header of an IP packet but also at the payload of higher level layers. By comparing the payload of the packets exchanged by two hosts in both directions with already known patterns called application signatures, PL is able to understand which application is generating the traffic and consequently use this information for one of the objectives mentioned above. In our case the traffic was identified as generated by a certain application or protocol. The precision of PL depends on how frequently it is updated with new signatures, which are released weekly.
The signatures used in this master thesis allowed PL to identify more than 2000 different protocols and services. The data collected by PL can be accessed by Graphic User Interface (GUI) called Packet Logic Client. Besides allowing the user accessing to the daily, weekly, monthly and yearly statistics the software permits a real time access to the traffic. The data provided by PL are available for further analysis and can be accessed by using Python Application Programming Interface (API).
3.3. MySQL Database
Packet Logic Client is a simple and complete interface because it allows getting a first look at the data and gives an access to live traffic tracking. However, in order to further analyze the data it is necessary to store this enormous amount of information in a more appropriate way. In our case the data were stored in a MySQL database. Figure 2 shows how the traffic information are first captured and processed by PL and then exported to a MySQL database server. Before being stored in the database, data are mixed with the DHCP servers’ logs, operation that adds a layer of information and allows a better data sourcing. In this process the sensitive information such as MAC and IP addresses are hashed in order to protect the privacy of the user in the network and respect the Swedish law on personal data integrity.
According to [23] MySQL is the second world-wide most used Relational Database Management System (RDBMS). MySQL allows inserting, retrieving and manipulating data by using an interrogation language called Structured Data Language (SQL), language common with many other RDBMS. An example of SQL query is shown in Appendix A.1.
The MySQL database that stores traffic logs from network south currently consists of over 750GByte of data and it is organized in 9 tables. Hashed MAC and IP addresses are stored respectively in table mac(id, mac) and ip(id,ip). The table switch(id, switch), port(id, port) and area(id, area, switch_id) contain respectively a list of switches, a list of ports for each switch and a list of areas where the switches are located. The table isp_service(id, service) contains a list of different service providers and subscriptions types. The table ip_service(id, service) contains the list of services or signatures that packet logic is currently able to identify. The table ip_category(id, name, ip_service_id, hierarchy_level, hierarchy_father) categorizes every occurrence of ip_service in a specific category in a hierarchical way. Finally, the table traffic(id, datetime, src_ip_id, mac_id, switch_id, port_id, ip_service_id, isp_service_id, traffic_in, traffic_out) is the hearth of the database since it contains the actual traffic records.
The traffic is averaged over 5 minute periods meaning that if a subscriber uses the same service twice within 5 minutes this will result in only one record in the database.
Figure 2: transfer of the traffic measurements from PL to MySQL.
3.4. Analysis Tools
In order to retrieve data traffic from the MySQL database a series of support software were used. Their specific role is explained briefly in the following sections.
3.4.1. MySQL Workbench
MySQL Workbench [24] is a MySQL Graphic User Interface developed by Oracle Corporation that integrates in a single software functions for administration, development and design of MySQL based database systems. MySQL Workbench has been largely used in this thesis for testing and running SQL queries, in particular one-time queries. The possibility for MySQL Workbench to export queries’ results in format readable by other applications such as Microsoft Excel, Matlab, and Java itself like XML, CSV, and JSON was exploited many times and made the work of post processing data easier.
3.4.2. MATLAB
MATLAB is a numerical computing software developed by Mathworks [25]. In this master thesis MATLAB was used to post process data, do distribution fitting and cluster analysis as well as represent results graphically.
3.4.3. Java
Java is, as it 2014, one of the most used object oriented programming languages. Java provides appropriate API classes called Java Data Base Connectivity (JDBC) that allows developers connecting to relational databases. In this project, MySQL Connector/J, the official API provided by Oracle has been used as interface to MySQL. Java was used both for post processing of data and as interface with the MySQL database for more complex queries.
3.5. Subscribers identification
In order to characterize the user behavior of particular categories of users it is necessary to find a way to identify and separate the traffic coming from a specific household. The aim of this section is to explain how this is done and the reasons behind the choices.
A household connected to the access network is granted by the DHCP server with a dynamic public IPv4 address valid for a limited amount of time, called lease time, with a duration that varies depending on the ISP. When the lease time expires the IP address returns to the DHCP server that either renews it or releases a new one. During the 3 months period a total of 2353 distinct IP addresses were released by the DHCP servers, with an average number of IP address per user equal to 23.72. Because of the dynamic nature of addresses distribution it is clear that choosing them as a way to identify a specific user in the users-set would not have brought to accurate results. This issue has been resolved by merging traffic logs downloaded from PL with logs furnished by the DHCP server. By using this information it is possible to identify uniquely a household in the network by the combination of two parameters: the switch id and the specific port in that switch.
Households are active subjects and an open access network allows them to change subscription type and ISP at their discretion. For this reason this report distinguishes between households and subscribers. The number of households describes the number of distinct active physical connections to the access network, where a physical connection is identified by the combination of switch id and port number. For example in one building with multiple apartments each apartment represents a household and thus a physical connection. The number of subscriptions refers instead to the number of logical connections, where a logical connection is identified by the combination of switch id, port number and the subscription type. The number of connected households and the number of subscribers differs because the latter takes into account households that have changed service type during the considered time. This means that in a specific interval of time the number of subscribers will be always greater or equal to the number of connected households. Figure 3 explains the difference between the number of households and the number of subscribers. In Figure 3a two households are connected to the same switch. Two households and two subscribers are active in the network. In Figure 3b the household A decides to upgrade its service to a faster subscription type. This change involves an increment of the number of total subscriptions but does not involve any change in the number of physical connections. The old subscription (10Mb) will be no longer active but represents the past of the household. Figure 3c shows instead that when a new household connects to the network, e.g. a new building is finished, it increments both the number of total households and the number of total subscriptions.
3.6. Limitations
In this research project only the traffic generated by users in one residential fixed network has been considered. Although analyzing more than one network or a network with a higher number of subscribers would have
Figure 3. Difference between number of subscribers and number of households.
brought to more accurate results, the amount of traffic to process would have been considerably higher and consequently the time needed to extract and post-process data. The subscribers’ population is anyway considered to be a good representation of different demographic groups.
This thesis does also not include any mobile traffic analysis meaning that only a small portion of the traffic generated by mobile devices, the one generated by devices connected through domestic Wi-Fi, could be analyzed.
The MAC addresses stored in the database belongs to the device directly connected to the Ethernet port which is usually a router but can be any devices equipped with an Ethernet card. For this reason it was not possible to analyze the traffic generated by single devices in a household. Instead all the traffic leaving and entering a specific household is considered to be coming from a unique device, which is a simplification of the real case. The measurements point is at the edge of the network, meaning that all the traffic exchanged inside the municipal network could not be analyzed. The instruments used to record and identify data traffic were capable to process and categorize around 90% of the traffic transiting at the Internet edge, meaning that a small but significant amount of traffic was categorized as unknown.
CHAPTER
4
4. Results
This chapter collects the results of the traffic analysis conducted during this thesis project.
4.1. Overview of Network South
As already mentioned in Section 3.1, network south is a Swedish municipal network where households can choose freely which ISP and service they want to activate. The measurements unit was set to record traffic generated by subscribers of two ISPs and 12 different services. Recorded services were ADSL24/3, 1Gbps, 500/100Mbps, 250/250Mbps, 250/100Mbps, 100Mbps, 100/10Mbps, 30Mbps, 30/10Mbps, 10Mbps, 5Mbps, and 1Mbps. Services with the slash denote asymmetrical access speeds, where the numbers at left and the right of the slash represent respectively the maximum download and upload bitrate in Mbit per second. Services without slash are symmetric meaning that the maximum upload and download bitrate are the same. Households with subscription types 1Gbps, 500/100Mbps, 250/250Mbps and 250/100Mbps were not considered in this study due to their meager population and so will not be longer mentioned in this report.
4.2. Population of households and subscribers
During the 93 days of study a total of 2817 households were connected to the access network. The total number of subscriptions during the same period was 3032 meaning that 215 household changed their service type and/or ISP. Table 1 shows these changes. 185 of the 215 variations, corresponding to 86.05% of the total number of changes were upgrades. An upgrade consists of a household that changes its access speed to a faster one. At the same way there were 17 downgrades corresponding to 7.91% of the total changes. From these numbers it is possible to conclude that households are more incline to upgrade their service type. The two most common upgrades were from 1Mbit to 10Mbit and from 5Mbit to 10Mbit. This can have many reasons but the most straightforward one is that
households consider their connection too slow for their needs. It is also fair to assume that households, knowing that they can change service anytime, select the cheapest option when they subscribe for the first time. 8 households changed their ISP keeping the same service type. This could be due to particular offers of the competitor ISP or dissatisfaction for the service. 5 variations could not be tracked as they might be due to other changes in the network. It is interesting to mention that only 2 households changed their service type 3 times.
Table 1. Variations of Service Type.
New subscription ADSL24/3 100 100/10 30 30/10 10 5 1 Or ig in a l s u b sc rip tio n ADSL24/3 2 0 0 0 0 0 0 0 100 0 3 3 1 1 4 0 0 100/10 0 10 0 4 1 2 0 0 30 0 9 7 0 0 1 0 0 30/10 0 1 3 0 0 0 0 0 10 0 7 18 6 5 3 0 0 5 0 0 0 0 2 46 0 0 1 0 0 0 1 0 70 0 0
Table 2 reports the number of subscribers for each service type. Slightly more than 40% of the subscribers opted for 10Mbit symmetric connections followed for popularity by 100/10Mbit and 100Mbit connections. The less popular service types are also the ones with the slowest access speed, ADSL24/3, 5Mbit and 1Mbit and represent slightly more than 6% of the subscribers’ population.
Table 2. Number of subscribers for each Service Type.
Service Type Tot subscribers
ADSL24/3 52 100 386 100/10 700 30 303 30/10 186 10 1268 5 54 1 83 29
4.3. Daily traffic analysis
The over 3000 subscribers generated in 93 days around 1027 TByte of Internet traffic of which 560 TByte (c.a. 54%) left the network edge (outgoing traffic) and 467 TByte (c.a. 46%) entered the network edge (incoming traffic), with an incoming/outgoing ratio of 0.83.
In this section the daily traffic is analyzed in different aspects. The daily traffic is here intended as the data transferred in 24 hours from 00:00 until 24:00.
4.3.1. Daily traffic pattern
The daily traffic pattern describes how the incoming, outgoing and total traffic varies, on average, during the day. This analysis includes the traffic generated by all the subscribers. As is shown in Figure 4 the traffic pattern varies consistently during the 24 hours. The minimum average traffic volume is 430 Mbps around 6am. Afterwards, the traffic volume starts growing and reaches the maximum value of 1720 Mbps, exactly four times more than the minimum, between 8.30pm and 9.30pm. After 10pm the traffic volume starts decreasing again.
It is also interesting to see the outbound and inbound traffic trends. The inbound traffic volume is generally bigger than the outbound one, except during the early morning approximately from 2am to 9am where the opposite is true. This could be due to many reasons but it is likely that many subscribers leave their devices with P2P software running during the night while all the other traffic decreases. At the same way, during the evening, the download traffic is consistently bigger than the upload one. This suggests that streaming of media content and HTTP traffic, which requires mainly download capacity, happens more likely in the latest part of the day.Since Figure 4 only shows the average traffic volume, spikes due to particularly traffic-intensive days cannot be seen.
Figure 5 shows the average difference in daily traffic between weekdays (Monday to Friday) and weekends (Saturday and Sunday). The weekend traffic looks generally higher than the weekday traffic, in particular during the central part of the day. This could be due to the fact that network south subscribers are mainly households in which tenants work during the week and use their connection mainly during the evening and the weekend. It is interesting, from the network operator point of view, to see that the lowest traffic volume is, on average, between 4.30am and 9am during the weekend which makes it the best time to perform maintenance and upgrades that require service disruption.
00:000 03:00 06:00 09:00 12:00 15:00 18:00 21:00 00:00 200 400 600 800 1000 1200 1400 1600 1800 Time T raf fi c v ol um e ( M bps ) Inbound Outbound Total
Figure 4. Average daily traffic pattern for network south.
00:000 03:00 06:00 09:00 12:00 15:00 18:00 21:00 00:00 200 400 600 800 1000 1200 1400 1600 1800 Time T raf fi c v ol um e ( M bps ) Weekends traffic Weekdays traffic
Figure 5. Average daily traffic in the weekdays and in the weekend.
4.4. Service specific analysis
After having shown how the total traffic volume changes during the day this section introduces results of analysis of specific service types traffic patterns. This includes daily traffic volume, bandwidth occupancy and instant traffic rate distribution.
4.4.1. Daily traffic volume and activity time
This section includes the average daily traffic volume and the average daily activity time for each of the 8 service types considered in this project. The average daily traffic is obtained by first computing the mean daily traffic for each subscriber and then averaging the results among subscribers with the same access speed. The same procedure is done for the daily activity time; in this case it is the number of active 5 minute intervals to be counted. An active time interval is an interval of time where a specific subscriber generates more than 37.5 kByte of traffic considering both incoming and outgoing direction. This corresponds to a constant bit rate of 1Kbps during 5 minute and it was chosen to cut off keep-alive traffic generated, for example, by network devices or background software.
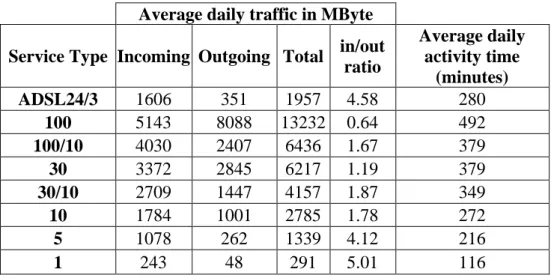
Table 3 shows the results. As can be seen the higher is the access speed the higher is the average daily traffic. The maximum average daily traffic is about 13GByte for 100Mbps subscribers while the minimum is only 291Mbyte for 1Mbps subscribers, more than 45 times smaller. It is also interesting to see the difference between inbound/outbound ratios of different service types. Symmetric subscriptions with lower speed or asymmetric subscriptions tend to have a lower upload traffic compared with other service types. The only subscription where the upload traffic is higher than the download one is the 100Mbit one.
The same trend can be found on the average daily activity. 100Mbps subscribers are active, on average, more than 8 hours a day, 100/10, 30 and 30/10 users have similar behavior, around 6 hours a day. Other service types have an average daily activity time that goes between about 2 to 4.5 hours.
Table 3. Average daily traffic and average daily activity time for different service types.
Average daily traffic in MByte
Service Type Incoming Outgoing Total in/out
ratio Average daily activity time (minutes) ADSL24/3 1606 351 1957 4.58 280 100 5143 8088 13232 0.64 492 100/10 4030 2407 6436 1.67 379 30 3372 2845 6217 1.19 379 30/10 2709 1447 4157 1.87 349 10 1784 1001 2785 1.78 272 5 1078 262 1339 4.12 216 1 243 48 291 5.01 116
4.4.2. Bandwidth occupancy daily pattern
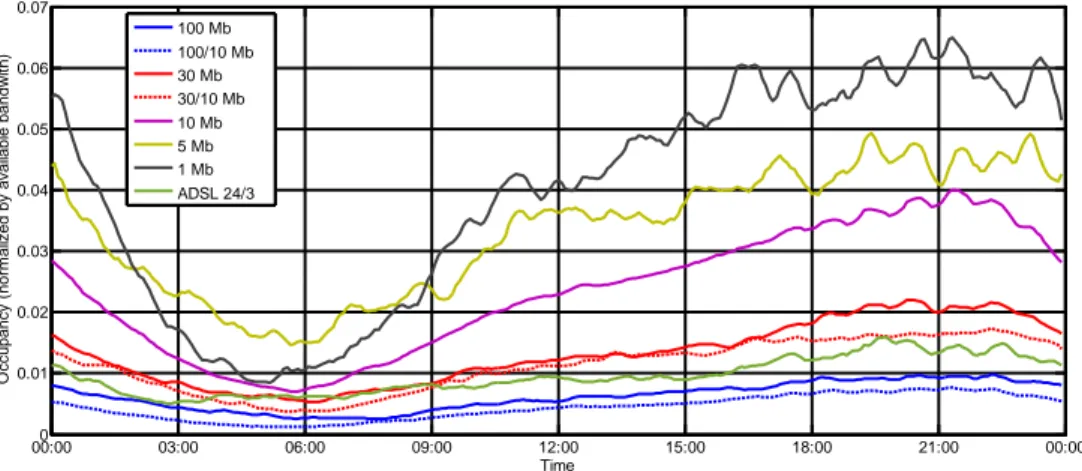
The term bandwidth occupancy represents here how much, on average, a subscriber occupies its total available access speed. For instance a subscriber with a 100Mbit access speed that is downloading at 20Mbps has a downlink bandwidth occupancy of 0.2. This section reports how much, on average, subscribers with different service types occupy their total available bandwidth during the day. Data in Figure 6 and Figure 7 are normalized over the available downlink and uplink access speed.
Figure 6 shows how the bandwidth occupancy in the downlink varies during the day. Minor variations of the daily bandwidth occupancy occur for high speed connections such as 100Mbit, 100/10Mbit, 30Mbit, 30/10Mbit and ADSL24/3. The average occupancy is also really low, in the order of 1-2 % of the capacity. For slower connections the occupancy shape follows the daily traffic pattern reported in Section 4.3.1. In particular 1Mb subscribers have the higher download bandwidth occupancy during the day, from 9am until approximately 1.30am, while 5Mb ones during the night which suggests that they are more likely to leave their computer download. It is interesting to see how the behavior is different in the uplink. The occupancy, in this case, is driven by the upload capacity. As it can be seen in Figure 7 service types with a limited upload capacity such as
100/10Mbit, 10/10Mbit and ADSL24/3 have a higher average occupancy. The most upload craving service type is the 100/10Mbit, which was also the lowest in the downlink. This suggests that the greater is the difference
between the download and the upload capacity the larger the uplink occupancy will be. Comparing, for example, the 100/10Mb connection and the 10Mb it can be seen that although they have the same upload capacity users of 100/10Mb use their upload bandwidth more. This could be explained in two ways. From the human behavior point of view subscribers that pay more use their connection more. From a technical point of view, higher download traffic requires higher upload traffic. Simply the TCP protocol requires to continuously sending acknowledges back to the server, which generates upload traffic proportional to the download one.
A look at the occupancy values shows that in general the average occupancy is really low, less than 4% for all the service types. It is although fundamental to mention that since this an analysis of the average, peaks are not shown. A deeper analysis on the topic is conducted in next section.
4.4.3. Instant traffic rate distribution
This section shows the statistical properties of the instant traffic rate for different service types and more generally for all the subscribers. Equation 1 shows how the traffic rate is computed, considering that the traffic is averaged over 5 minute intervals this is a good approximation of the instant rate. 00:000 03:00 06:00 09:00 12:00 15:00 18:00 21:00 00:00 0.01 0.02 0.03 0.04 0.05 0.06 0.07 Time O c c upanc y ( nor m al iz ed by av ai labl e bandw it h) 100 Mb 100/10 Mb 30 Mb 30/10 Mb 10 Mb 5 Mb 1 Mb ADSL 24/3
Figure 6. Average daily bandwidth occupancy variation during the day in the downlink.
Equation 1. Instant traffic rate formula.
𝑅𝑎𝑡𝑒 [𝑀𝑏𝑝𝑠] = ∑ 𝑢𝑠𝑒𝑟 𝑡𝑟𝑎𝑓𝑓𝑖𝑐 𝑖𝑛 5 𝑚𝑖𝑛𝑢𝑡𝑒 [𝑏𝑦𝑡𝑒]60 × 5 [𝑠𝑒𝑐] × 8 [𝑏𝑦𝑡𝑒] × 10𝑏𝑖𝑡 6
Table 4. Instant traffic rate results for different Service Types.
Inbound Outbound
Mbps Kbps Mbps Kbps
Service Type Max Average Median Max Average Median
ADSL24/3 21.78 0.23 0.53 1.70 0.05 0.35 100 112.14 0.64 8.20 99.08 1.04 5.20 100/10 111.72 0.45 1.40 10.36 0.27 0.79 30 58.06 0.40 1.60 50.31 0.34 0.97 30/10 74.96 0.35 1.40 14.09 0.19 0.77 10 61.40 0.24 0.30 10.24 0.13 0.19 5 12.27 0.17 0.23 5.05 0.05 0.16 1 3.69 0.04 0.07 1.04 0.01 0.09
Results are shown in Table 4. The first thing to notice is that all the service types, except ADSL24/3, have registered a maximum traffic rate bigger
00:000 03:00 06:00 09:00 12:00 15:00 18:00 21:00 00:00 0.005 0.01 0.015 0.02 0.025 0.03 0.035 0.04 0.045 Time O c c upanc y ( nor m al iz ed by av ai labl e bandw it h) 100 Mb 100/10 Mb 30 Mb 30/10 Mb 10 Mb 5 Mb 1 Mb ADSL 24/3
Figure 7. Average daily bandwidth occupancy variation during the day in the uplink.
than the maximum allowed speed. This happens because the network allows users to exceed their maximum speed for a certain restricted amount of time. This is not technically possible for ADSL subscribers because only a limited amount of frequency bandwidth is allocated for the data traffic allowing a maximum theoretical data rate of 24Mbps in download and 3Mbps in upload, which is anyway never reached by any of the users. Median values are rather low for all the service types, compared with the average values. This suggests that there are frequent periods of time where the network is IDLE and really few data are sent or received over the Internet.
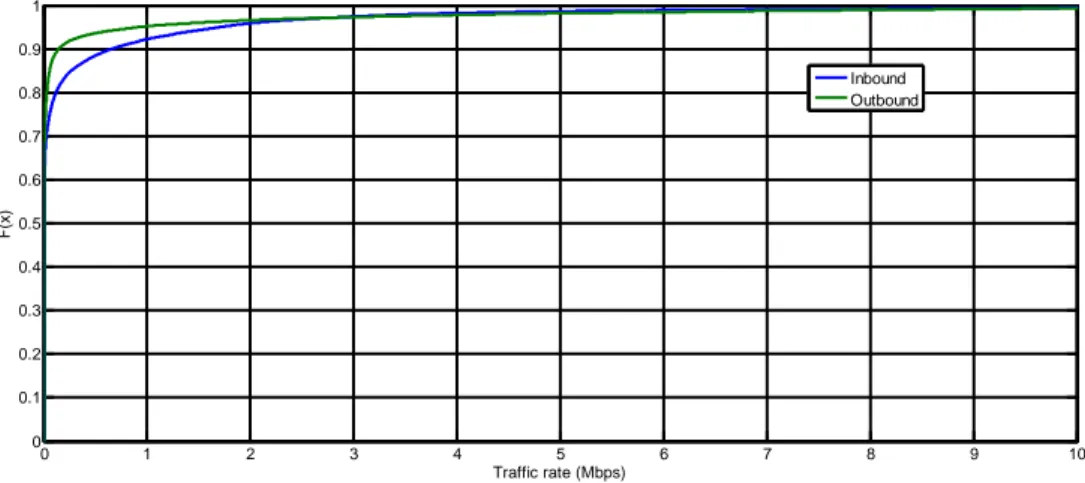
Figure 8 shows the empirical cumulative distribution function for the instant inbound and outbound traffic rate for all the service types. The average traffic rate in the download is 0.37Mbps while in the upload 0.30Mbps with a median value respectively of 91.11Kbps and 51.76Kbps.
4.5. Cluster Analysis
Cluster analysis is a particular type of investigation which consists of grouping together objects with similar characteristics. In this case a particular cluster analysis named k-mean is conducted. K-mean clustering consists in dividing the subscribers’ population in a determined number of groups and then assigning each subscriber to the group with the shortest ‘distance’, in this case the squared Euclidean distance, to the centroid of the group. 0 1 2 3 4 5 6 7 8 9 10 0 0.1 0.2 0.3 0.4 0.5 0.6 0.7 0.8 0.9 1 Traffic rate (Mbps) F( x ) Inbound Outbound
Figure 8. Empirical CDF for inbound and outbound instant traffic rate.
In this report the cluster analysis aims to investigate the relations between the number of total distinct services used by each subscriber in the considered time span and their average daily traffic. Subscribers were divided in three groups depending on their average daily traffic. The groups were named high, medium and low bandwidth consumers.
Figure 9 shows the results for the inbound traffic. There are a total of 78 subscribers (corresponding to around 2.5% of the total) classified as high bandwidth consumers. Their average daily traffic is 20.2GByte with 50% of the subscribers in this category downloading more than 17.1GByte a day. Medium bandwidth consumers are 607 (around 20% of the total) with an average of 6.7GByte daily downloaded data and median downloaded daily quota of 6.12GByte. The biggest group is composed of 2347 low bandwidth consumption users which download on average 1.32Gbyte a day, with 50% of consumers downloading more than 1.03Gbyte a day. The average number of applications for each subscriber group is accordingly higher for high bandwidth consumption users with an average of 111 services followed by medium and low bandwidth consumption users with respectively 101 and 75 services. It is interesting to notice that the most active user download on average 54GByte of data every day which corresponds to almost 19 hours of high quality streaming on Netflix [26].
Figure 10 shows the same results for the upload traffic. As can be seen there are only 8 users classified as high bandwidth consumers. Their
0 20 40 60 80 100 120 140 160 180 100 101 102 103 104 105 106 107 108 Number of services A v er age dai ly t raf fi c ( K B y te/ day )
Medium bandwidth consumption users Low bandwidth consumption users High bandwidth consumption users
Figure 9. Cluster Analysis on inbound average daily traffic and number of services for each subscriber.
average daily upload traffic is 131.9GByte with 50% of the users sending more than 128.4GByte a day. The 135 medium bandwidth consumers upload an average of 23.7GByte a day with 50% of them uploading at least 19.6GByte every day. The biggest group is composed by 2889 low bandwidth consumption users which upload an average of 974.7MByte of data every day with a median value of 182.3MByte.
It is interesting to see that both high and medium consumption users upload, on average, respectively 6.5 and 3.5 times more than they download. This is likely due to P2P software that sends a huge amount of traffic to other clients in the Internet. The slight difference of traffic share between download and upload reported in Section 4.1, is then driven by the low bandwidth consumption users since their average download quota is slightly bigger than the upload one. Without such users the traffic would be de facto much more asymmetric towards outbound traffic.
4.6. Session duration analysis
This part of the report analyzes the statistical properties of session length for different service types and more generally for all the subscribers in network south. 0 20 40 60 80 100 120 140 160 180 100 102 104 106 108 1010 Number of services A v er age dai ly t raf fi c ( K B y te/ day )
High bandwidth consumption users Medium bandwidth consumption users Low bandwidth consumption users
Figure 10. Cluster Analysis on outbound average daily traffic and number of services for each subscriber.
In this section a session is defined as the number of consecutive 5 minute intervals where a subscriber exchanges at least 2.75MByte. This amount of traffic corresponds, for instance, to stream a normal quality, 2:30 minutes song on Spotify [27], navigate few pictures on Facebook or make a brief 1:30 phone call with the lowest quality codec on Skype [28]. Lower traffic intervals are excluded in the way that traffic generated by low bandwidth consuming background applications does not condition the results. Since data are averaged over 5 minutes intervals the minimum session duration will be 5 minutes.
The session duration calculation is done with a Java Application that connects to the database, executes a query and computes the results. The session lengths computed by the applications are then imported in MATLAB and further analyzed with the provided tools. Over 1.5M sessions were recorded for a total of roughly 56M minutes of internet usage.
4.6.1. Session length for different service types
Table 5 shows the result of the session length analysis for the 8 different service types. The average session length for all the subscription types is under 60 minutes. It should be noticed that the so called Relative Standard Deviation (RSD), expressed as the ratio between the standard deviation and the average, varies consistently between access speeds. The variation of the RSD indicates that some of the service types such as high speed connections and in particular ADSL24/3, have higher dispersion of session length compared with others as 5Mbit and 1Mbit. This could indicate that 1Mbit and 5 Mbit users are more likely to use their connection in a more simple and static way, for example for checking the emails or reading the news, actions that need only a specific restricted amount of time. Subscribers with higher access speed are more dynamic and may use their home connection in multiple and different ways. Interesting is to see that the median value is 10 minutes for all the service types meaning that short session are most likely to happen. This value is of course driven by the fact that not all the 5 minutes intervals were considered. By decreasing the 2.75Mbyte boundary the median value would certainly increase as well as the average session length.
The longest reported session was 62K seconds, corresponding to a session of over 17 hours. The average number of sessions per subscriber indicates
that subscribers with higher speed tend to use their connection more often. The highest value for this field is for 30/10Mbit subscriptions with roughly 646 sessions per user, meaning an average of just about 7 sessions a day.
Table 5. Session duration for different service types.
Session duration (minutes) Service Type Averag e Medi an Max RSD Average Number of Sessions per Subscriber ADSL24/ 3 31.33 10 45180 11.83 326.25 100 50.05 10 56165 7.97 541.54 100/10 38.71 10 62050 6.27 571.26 30 40.31 10 31585 5.48 559.26 30/10 33.71 10 22715 4.35 646.74 10 31.87 10 28290 4.36 454.35 5 31.26 10 3795 2.87 250.15 1 22.96 10 2635 2.18 163.18
4.6.2. Cumulative Distribution Function for session lengths
This section of the report analyzes the cumulative distribution function (CDF) for all the subscribers. As explained before due to memorization strategies the traffic logs are averaged over a 5 minute interval and thus the empirical cumulative distribution function is discrete. In reality the session length would assume real values and the actual CDF be continuous. The aim of this paragraph is to fit the empirical discrete CDF with a continuous distribution.
A similar study was conducted in [16] and a Power-Law distribution was found to fit optimally the session length distribution. As explained in [29] a Power-Law distribution suits best situations where some sample can be several orders of magnitude bigger or smaller than the average. For example as shown in the last paragraph, the maximum session length for the 100/10 subscription is over 1600 times bigger than the average. The probability distribution function of a power-law distribution is described by Equation 2. Since the function diverges for x0, the value of xmin denotes
the lower bound for the function. In this case xmin = 5, which corresponds to
the smallest possible session length.
Equation 2. Probability Density Function (PDF) of a Power Law distribution. 𝑝(𝑥) = 𝛼 − 1𝑥 𝑚𝑖𝑛 � 𝑥 𝑥𝑚𝑖𝑛� −𝛼 ∀ 𝑥 ≥ 𝑥𝑚𝑖𝑛
α is called the scaling parameter. The procedure to estimate the scaling parameter is shown by Equation 3. According to [29] this method gives the maximum likelihood estimation (MLE) of α. In this case n is the total number of sessions.
Equation 3. ML estimation of the scaling parameter α in the Power Law Distribution. 𝛼� = 1 + 𝑛 �� ln 𝑥𝑥𝑖 𝑚𝑖𝑛 𝑛 𝑖=1 � −1
The estimation of α for this case is α=2.006. The cumulative density function for the power-law distribution can be computed by integrating Equation 2 and is shown in Equation 4.
Equation 4. CDF of a Power Law Distribution. 𝐹(𝑥) = 𝑝(𝑋 ≤ 𝑥) = 1 − �𝑥𝑥
𝑚𝑖𝑛� −𝛼+1
Figure 11 shows both the empirical CDF and the power-law estimation. The average session length is 37.23 minutes with a median of 10 minutes and a RSD of 6.16. From Figure 11 can be concluded that the share of session lasting more than 90 is in the order of 5% and thus that subscribers tend to generate traffic continuously only for a relatively short interval of time.
4.7. Traffic categories analysis
So far only aspects regarding the traffic in its entirety have been considered. It is also really interesting to see how the traffic mix is composed knowing that the traffic is generated by a large number of applications. The aim of this part of the report is to explain and analyze how the mix of traffic looks like in network south, how it changes during the daytime, and how it changed during the considered period.
As explained in Section 3.2, PL is able to identify with a certain level of precision a good number of services but it is also able to divide these services in categories of traffic. The categories are hierarchically organized, with 11 main categories and a considerable number of subcategories organized in 3 hierarchic levels. A service can belong to one and only one category in one particular hierarchy level.
Table 6 shows the 11 main categories of traffic and some examples of services that are assigned to those categories. Remote access services include services for remote procedure call (RPC), proxy and Virtual Private Network (VPN) access, graphical remote access such as desktop sharing, etc. Entertainment contains all the services that relates to online gaming, gambling, eBook downloading etc. File Sharing contains all the applications that allow clients to exchange files. File Transfer includes services that transfer files between a client and a server. Information includes services that deliver news, intelligent personal assistants, and
0 50 100 150 200 250 300 350 400 450 500 0 0.1 0.2 0.3 0.4 0.5 0.6 0.7 0.8 0.9 1 Minutes F( x )
Powerlaw distribution fitting Empirical CDF
Figure 11. Empirical and fitted CDF for session duration.