Autore:
Marco Simone
Relatori:
Prof. Leonardo Tognotti Prof. Cristiano Nicolella
Development of Experimental Systems and
Modelling Tools for Studying
Biomass Gasification
Scuola di Dottorato in Ingegneria “Leonardo da Vinci”
Corso di Dottorato di Ricerca in
Ingegneria Chimica e Scienza dei Materiali
Autore:
Marco Simone
Relatori:
Prof. Leonardo Tognotti Prof. Cristiano Nicolella
Sviluppo di Sistemi Sperimentali e
Strumenti Modellistici per lo Studio della
Gassificazione delle Biomasse
Anno 2010
Scuola di Dottorato in Ingegneria “Leonardo da Vinci”
Corso di Dottorato di Ricerca in
Ingegneria Chimica e Scienza dei Materiali
Copyright © Marco Simone 2010 All Rights Reserved
Tutto questo avviene rapidamente, in silenzio, alla temperatura e pressione dell‟atmosfera , e gratis: cari colleghi, quando impareremo a fare altrettanto saremo “Sicut Deus”, ed avremo anche risolto il problema della fame nel mondo.
da Il Sistema Periodico, Primo Levi
I
Negli ultimi quaranta anni lo sfruttamento delle biomasse ha subito una crescente evoluzione. Durante la crisi petrolifera degli anni settanta si è assistito a un crescente interesse nei confronti delle biomasse, spinto dalla ricerca di fonti energetiche diverse da quelle fossili. Successivamente questo concetto è stato affiancato dalla necessità di utilizzare fonti rinnovabili e ridurre l‟effetto serra. Ad oggi la nascita del concetto di bioraffineria considera la biomassa non solo un combustibile alternativo, ma anche materia prima per ottenere combustibili liquidi e gassosi, nonché chemicals. La gassificazione delle biomasse a partire dagli anni settanta si è sempre posta come una possibile risposta alle esigenze del momento. La gassificazione, potendo essere attuata in diverse condizioni operative e configurazioni reattoristiche, consente di convertire la biomassa in un gas di diversa composizione che può essere utilizzato per molteplici scopi, dalla produzione di energia elettrica alla sintesi di chemicals; inoltre, non essendo legata ad uno specifico tipo di biomassa, consente di utilizzare fonti di approvvigionamento diversificate. Tuttavia ad oggi la gassificazione delle biomasse non è una tecnologia matura, a causa della persistenza di alcune barriere tecnologiche, in particolare la formazione di catrami (tar) che costituiscono un problema per l‟utilizzo finale del gas prodotto. Questa situazione di stallo può essere superata proponendo soluzioni alle barriere di natura tecnologica e fornendo esempi concreti di impianti di gassificazione funzionanti ed affidabili. L‟attività svolta nella presente tesi ha cercato di fornire delle risposte a queste esigenze. Data la complessità dell‟argomento è stato adottato un approccio che affianca l‟attività sperimentale a quella modellistica che sono applicate a problemi di diversa scala, da quella di laboratorio a quella pilota. Gran parte dell‟attività svolta è in relazione alla recente nascita del CRIBE (Centro di Ricerca Inter-Universitario Biomasse da Energia); in particolare è stato seguito lo sviluppo, la messa a punto e il testing delle unità di pirolisi e gassificazione presenti nel centro. L‟approccio multi-scala è partito dai fenomeni coinvolti nella gassificazione delle biomasse: in particolar modo lo step di pirolisi. A riguardo è stata messa a punto una procedura di valutazione di cinetiche di devolatilizzazione di biomasse ad alta velocità di riscaldamento, che integra una campagna sperimentale di prove di pirolisi con un Drop Tube Reactor e la relativa modellazione di questa apparecchiatura con un codice CFD. Lo studio della pirolisi delle biomasse è proseguito presso il CRIBE attraverso la messa a punto di un reattore di pirolisi a letto fisso finalizzata allo sviluppo di un sistema di campionamento dei catrami di pirolisi (tar) e la relativa procedura di caratterizzazione analitica, che va a integrare diverse tecniche di laboratorio, dall‟analisi TG-FTIR alla GC-MS. Queste attività sono state propedeutiche alla fase successiva che è stata incentrata sullo studio e caratterizzazione di un impianto di gassificazione di biomasse di scala pilota. Lo studio è composto da una parte sperimentale nella quale sono stati condotti dei test di gassificazione di biomasse pellettizzate e una parte modellistica dove si è cercato di rappresentare il funzionamento del gassificatore attraverso un codice di flow-sheeting. Dallo studio sperimentale si è potuto valutare i parametri di processo più importanti e valutare le prestazioni del processo di gassificazione, attraverso misure e campionamenti. Lo studio modellistico ha consentito di dare un‟interpretazione fenomenologica del funzionamento del gassificatore.
III
In the last forty year biomass exploitation has evolved. Dating back to the seventies biomass were recognized as an alternative source of energy to fossil fuels in the scenario of the oil crisis. Subsequently the interest in biomass increased driven by the search of renewable and carbon dioxide neutral fuels. Nowadays biomass is not just an alternative fuel but a source of liquid and gaseous bio-fuels as well as the raw material for chemicals production, within the framework of a bio-refinery.
Starting from the seventies biomass gasification has always been recognized as a potential solution to the aforementioned issues. Biomass gasification can be carried out in different operating conditions and reactors, allowing controlling the composition of the syngas. As a consequence it is possible to use the gas for different purposes, from power generation to chemicals synthesis. Moreover biomass gasification is not biomass specific, spreading the range of feedstock sources.
Despite these capabilities, biomass gasification is not an established technology. The reason is related to some technological barriers; in particular biomass tar still represents a big issue for the final use of the syngas.
In order to overcome this situation it is necessary to promote solutions to the technological barriers and provide reference of operating and reliable gasification plants.
The activity carried out in this Thesis was focused on these needs.
Recognizing the complexity of the topic, a methodology that integrates modelling and experimental activities was adopted and applied both to laboratory and pilot scale studies. This Thesis is linked to newly born CRIBE (a research centre devoted to the study of energy biomass), dealing with the development, setup and testing of the pyrolysis and gasification units installed in the centre.
The first part of the work was focused on the phenomena involved in biomass gasification, in particular biomass devolatilization. A procedure for the evaluation of high heating rate biomass devolatilization kinetics was developed, integrating an experimental campaign on a Drop Tube Reactor with a modelling activity of this laboratory device by means of a CFD code.
The study of biomass pyrolysis was further carried out at CRIBE. An experimental campaign on a batch pyrolysis reactor was carried out both to test the capabilities of a tar sampling system and asses a tar characterization methodology which integrates different laboratory techniques (from TG-FTIR to GC-MS).
These activities provided the basis for the following phase, which focused on the study and characterization of a pilot scale gasification plant. This activity was carried out integrating an experimental campaign and a modelling study. The experimental campaign was focused on the gasification of pelletized biomass, evaluating the most important parameters as well as the performance of the gasification process, based on process measures and samplings. The modelling study was carried out with a flow-sheeting code and aided the phenomenological description of the gasifier behaviour.
V
SOMMARIO ... I
ABSTRACT ... III
CONTENTS ...V
LIST OF SYMBOLS AND ABBREVIATIONS ... 1
LIST OF FIGURES ... 9
LIST OF TABLES ... 12
CHAPTER 1. BIOMASS GASIFICATION: STATE OF THE ART
AND TECHNOLOGICAL BARRIERS ... 15
1.1 Biomass gasification basics ... 16
1.1.1 Gasification chemistry and phenomena ... 16
1.1.2 Biomass gasification steps ... 18
1.2 Biomass gasification technologies ... 20
1.2.1 Fixed bed gasifiers ... 20
1.2.2 Fluid bed gasifiers ... 20
1.2.3 Comparative analysis ... 21
1.2.3.1 Documented applications ... 23
1.2.3.2 Performance Indicators ... 25
1.3 Syngas properties and operating conditions ... 27
1.3.1 Gasifying agent ... 27
1.3.2 Equivalence ratio... 28
1.3.3 Temperature ... 31
1.4 Technological barriers ... 32
1.4.1 Feedstock specifications ... 32
1.4.1.1 Variability of biomass properties ... 33
1.4.1.2 Moisture content ... 33
1.4.1.3 Solid Handling ... 34
1.4.4 End-user specifications ... 35
1.4.4.1 Ash and particulate ... 35
1.4.4.2 Tar ... 37
1.5 Summary ... 43
1.6 Research needs in biomass gasification ... 43
CHAPTER 2. THESIS APPROACH AND METHODOLOGY ... 45
2.1 Steps of the work ... 46
2.1.1 Selection of the working subjects... 46
2.1.2 High heating rate devolatilization kinetics ... 46
2.1.3 Tar sampling and characterization ... 47
2.1.4 Development and testing of a pilot scale gasification facility ... 47
2.1.5 Modelling study of the downdraft gasifier ... 47
CHAPTER 3. EVALUATION OF HIGH HEATING RATE BIOMASS
DEVOLATILIZATION KINETICS ... 49
3.1 Methodology ... 50 3.2 Experimental section... 52 3.3 Numerical model ... 55 3.4 Results ... 58 3.4.1 Experimental results... 58 3.4.2 CFD model results ... 59 3.4.3 Kinetic Analysis ... 623.4.4 CFD as a predictive tool for flash pyrolysis ... 65
3.5 Summary ... 68
CHAPTER 4. QUALIFICATION OF A TAR SAMPLING SYSTEM
AND A TAR CHARACTERIZATION METHODOLOGY ... 71
4.1 Literature survey of tar sampling systems ... 72
4.1.1 Absorption methods ... 73
4.1.2 Condensation methods ... 75
4.1.3 Adsorption methods ... 76
4.1.4 On-Line methods... 77
4.1.5 Tar analysis ... 79
4.2 Assessment of a tar sampling system ... 79
4.2.1 Sampling system description ... 81
4.2.2 Preliminary tests ... 82
4.2.3 Pyrolysis tests ... 83
4.2.3.1 Pyrolysis reactor ... 83
VII
4.2.3.3 Results ... 87
4.2.3.3.1 Pyrolysis evolution ... 87
4.2.3.3.2 Tar sampling ... 90
4.2.3.3.3 Mass balance ... 92
4.3 Assessment of a tar characterization methodology ... 94
4.3.1 TGA ... 94
4.3.1.1 Instrument and methodology ... 94
4.3.1.2 TGA Results ... 95
4.3.2 TG-FTIR ... 97
4.3.2.1 Instrument and methodology ... 97
4.3.2.2 TG-FTIR Results ... 98
4.3.3 UA ... 99
4.3.3.1 Instrument and methodology ... 99
4.3.3.2 UA Results... 101
4.3.4 GC-MS ... 101
4.3.4.1 Instrument and methodology ... 101
4.3.4.2 GC-MS Results ... 102
4.4 Summary ... 106
5. DEVELOPMENT AND TESTING OF A PILOT SCALE BIOMASS
GASIFICATION FACILITY ... 107
5.1 Literature review on recent studies about downdraft biomass gasifiers 107 5.2 Gasification facility description ... 109
5.2.1 The gasification plant ... 109
5.2.1.1 Feeding system and gasifier ... 112
5.2.1.2 Clean-Up section ... 115
5.2.1.3 Water handling section ... 115
5.2.1.4 Plant control and operation ... 115
5.2.1.5 Gasifier feedstock specifications ... 117
5.2.2 Plant measurements ... 119
5.2.2.1 Temperature ... 119
5.2.2.2 Pressure ... 121
5.2.2.3 Gas flow-rate ... 122
5.2.3 Gas sampling and analysis ... 122
5.2.3.1 micro-CG ... 123
5.2.3.1.1 Technique ... 123
5.2.3.1.2 Instrument ... 123
5.2.3.1.3 Sampling point and procedure ... 124
5.2.3.1.4 Data acquisition and elaboration ... 125
5.2.3.2 FTIR ... 126
5.2.4 Liquid sampling and analysis ... 127
5.2.5 Solid sampling and analysis ... 127
5.2.5.2 Solids analysis ... 129
5.2.5.2.1 Moisture content ... 129
5.2.5.2.2 Heating value ... 129
5.2.6 Ancillary equipments ... 130
5.2.6.1 Drying system ... 130
5.2.6.2 Tar cracking system ... 131
5.3 Gasification tests of pelletized biomass ... 132
5.3.1 Biomass feedstock selection ... 132
5.3.2 Biomass feedstock properties and characterization ... 133
5.3.3 Test resume ... 135 5.3.4 Test procedure ... 137 5.4 Tests results ... 137 5.4.1 Gasifier behaviour ... 137 5.4.1.1 Temperature ... 137 5.4.1.1.1 Clean-up Temperature ... 137 5.4.1.1.2 Gasifier Temperature ... 139 5.4.1.2 Syngas composition ... 140 5.4.1.2 Pressure ... 143
5.4.1.2.1 Pressure drop in the clean-up system ... 143
5.4.1.2.2 Pressure drop across the gasifier bed ... 144
5.4.1.4 Bed permeability ... 150
5.4.1.5 Sampling ... 153
5.4.1.5.1 Condensate ... 153
5.4.1.5.2 Gasifier residues from the collection tank ... 154
5.4.1.5.3 Gasifier bed from the nozzle ... 156
5.4.1.5.4 Gasifier particulates ... 158 5.4.2 Gasification performance ... 163 5.4.2.1 Balances approach ... 163 5.4.2.2 Balances calculation ... 165 5.4.2.3 Gasification performance ... 167 5.5 Summary ... 168
6. MODELLING A PILOT SCALE DOWNDRAFT BIOMASS
GASIFIER ... 171
6.1 Literature review of fixed bed biomass gasifiers and combustors models ... 171
6.2 Gasifier modelling ... 173
6.2.1 Modelling approach ... 173
6.2.1.1 Domain ... 173
6.2.1.2 Gasifier description ... 174
6.2.1.3 Assumption and hypothesis ... 176
IX
6.2.2 Phenomena and reactions ... 181
6.2.2.1 Biomass drying ... 181
6.2.2.2 Biomass devolatilization ... 183
6.2.2.2.1 Representation of the macro-products ... 183
6.2.2.2.2 Kinetic scheme and kinetic parameters ... 184
6.2.2.2.3 Gas speciation ... 186
6.2.2.3 Heat Transfer... 187
6.2.2.3.1 Convective Heat Transfer ... 187
6.2.2.3.2 Conductive Heat Transfer ... 188
6.2.2.3.3 Radiative Heat Transfer ... 188
6.2.2.4 Mass Transfer ... 189
6.2.2.4 Particle evolution ... 190
6.2.2.6 Heterogeneous reactions ... 191
6.2.2.6.1 Carbon oxidation ... 192
6.2.2.6.2 Carbon dioxide gasification ... 192
6.2.2.6.3 Steam (water) gasification ... 193
6.2.2.6.4 Hydro-gasification ... 193
6.2.2.7 Homogeneous phase reactions... 193
6.2.2.7.1 Hydrocarbons combustion ... 194
6.2.2.7.2 Carbon monoxide combustion ... 195
6.2.2.7.3 Hydrogen combustion ... 195
6.2.2.7.4 Water-gas shift ... 196
6.3 Gasifier simulation ... 197
6.3.1 Simulation software and implementation ... 197
6.3.2 Simulation parameters ... 198
6.3.3 Simulation strategy... 199
6.3.3.1 Geometry ... 199
6.3.3.2 Solution procedure ... 200
6.3.3.3 Boundary conditions ... 200
6.3.3.4 Initial conditions, ignition and simulation sequence ... 201
6.3.3.5 Input values ... 201
6.3.3.6 Assigned coefficients ... 201
6.4 Model results ... 202
6.4.1 Case study ... 202
6.4.1.1 Variables distribution ... 202
6.4.1.2 Comparison with experimental data ... 204
6.4.2 Parameter Sensitivity ... 205 6.4.2 Heat transfer ... 206 6.4.3 Throated configuration ... 208 6.5 Summary ... 211
CONCLUSIONS ... 213
REFERENCES ... 215
LIST OF PUBLICATIONS ... 225
PROJECTS AND COLLABORATION ... 227
ACKNOWLEDGEMENTS ... 229
1
Chapter 1
Nomenclature
CC carbon conversion, - CGE cold gas efficiency, - ER equivalence ratio, - FC fixed carbon, %
LHV lower heating value, MJ m-3n
Mbio biomass loading rate, kg of dry biomass h-1 PS specific gas production, m3n kg
-1
of dry biomass Qgas gas flow-rate, m3n h
-1
Rj reaction-j, kg s-1 VM volatile matter, % X biomass conversion, -
xi mass fraction of component i, - yi molar fraction of component i, -
Subscripts
c carbon C combustion G gasification MR methane reforming P1 primary pyrolysis TC tar cracking WS water gas-shiftSuperscripts
bio biomassAbbreviations
BFB bubbling fluidized bed CFB circulating fluidized bed CHP combined heat and power IC internal combustion
IGCC integrated gasification combined cycle PCFB pressurized circulating fluidized bed
Chapter 3
Nomenclature
A pre-exponential factor, s-1 Ap particle area, m2
CD drag coefficient, -
CP specific heat at constant pressure, cal kg-1 K-1 d characteristic system dimension, m
dp particle diameter, m D32 Sauter mean diameter, m E activation energy, cal mol-1 ep particle emissivity, m
fi mass fraction of the i-th particle dimensional class, - g gravitational constant, m s-2
h convective heat exchange coefficient, cal s-1m-2K-1 I radiating flux to the particle surface, cal s-1
k first order kinetic constant, s-1
kf thermal conductivity of the fluid, cal s-1m-1K-1 m mass, kg
n fluid refraction index, - Nu Nusselt number, f
k
dh
Nu
pp particle perimeter, m Pr Prandtl number, f pk
C
Pr
Qc convective heat flow, cal s-1 Qm mass heat flow, cal s-1 Qc radiating heat flow, cal s-1 R ideal gas constant, cal mol-1 K-1 Rep particle Reynolds number,
g d g p pu
u
d
Re
Re gas Reynolds number,
g gdu
Re
RF Roundness factor, p pA
p
RF
4
t time, stpr particle relaxation time, s
18
2 p p prd
t
T particle temperature, K Tg gas temperature, K3 ug gas velocity, m s-1
up particle velocity, m s-1 V volatiles mass released, -
V∞ maximum volatile mass released, -
xi pyrolysis conversion for the i-th particle dimensional class, -
Xash ash mass fraction, -
z axial coordinate from the DTR entrance downwards, m
Greek letters
α stoichiometric coefficient related to volatiles, -
stoichiometric coefficient related to char, -
mass fraction of a dimensional class, - ρg gas density, kg m
-3 ρp particle density, kg m-3
μ gas dynamic viscosity, kg m-1 s-1
Hm specific enthalpy variation associated to mass transfer, cal kg-1
Stefan Boltzmann constant, cal s-1 m-2 K-4
residence time, s
global pyrolysis conversion for a single run, -
Subscripts
p particle g gas i index r relaxation 1, 2, 3 indexeslowT low temperature interval highT high temperature interval
Abbreviations
DD size distribution of diameter MD mono-dimensional class DTR Drop Tube Reactor
CFD Computational Fluid Dynamics KIN kinetics
Chapter 4
Nomenclature
FC fixed carbon, % VM volatile matter, %Abbreviations
Bf before feedingCFB circulating fluidized bed dTG derivative thermo-gravimetric ECN Energy Centre of the Netherlands F1 fraction 1
F2A fraction 2A F2B fraction 2B F3 fraction 3
FID Flame Ionization Detector FTIR Fourier Transformed InfraRed GC Gas Chromatography
HPLC High Pressure Liquid Chromatography IEA International Enery Agency
LIF Laser Induced Fluorescence MBMS Molecular Beam Mass Spectrometry MS Mass Spectrometry
NMR Nuclear Magnetic Resonance PAH Policyclic aromatic compounds PID Photo Ionization Detector TC1 thermocouple 1
TC2 thermocouple 2 TC3 thermocouple 3
TCD Thermo Conducibility Detector TGA Thermogravimetric Analysis TD Thermo Desorption
RSD Reference Standard Deviation SPA Solid Phase Adsorption UA Ultimate Analysis
5
Chapter 5
Nomenclature
Ab bed cross section, m2 b permeability, m2 Lb bed depth, m e bed void fraction, - Q gas flow-rate, m3n h
-1
CGE cold gas efficiency, - ER equivalence ratio, -
ESD equivalent spherical diameter, - LHV lower heating value
Mbio biomass loading rate, kg h-1 Mchar char production rate, kg h-1 Mair air flow-rate, kg h-1
Ms syngas production rate, kg h-1 Mw wastewater production rate, kg h-1 Pg depression in the gasifier jacket, mmH2O
Pn depression at the nozzle outlet, mmH2O
PS specific gas production, m3n kg -1
of dry biomass X biomass conversion, -
xi mass fraction of component i, - yi molar fraction of component i, -
Greek letters
μg gas dynamic viscosity, kg m-1 s-1 Φ particle sphericity, -
Pcond pressure drop in the condenser, mmH2O
Pf1 pressure drop in the raw-filter, mmH2O
Pf2 pressure drop in the fine-filter, mmH2O
Pf2 pressure drop in the safety-filter, mmH2O
Subscripts
b bed g gas p particle sens sensible chem chemicalAbbreviations
Ar as receivedB1 balance 1, involving gasification tests 1,2 and 3 B2 balance 2, involving gasification tests 4 and 5 Bf before feeding
C1 charry residue collected from the collection tank after test 1 C3 charry residue collected from the collection tank after test 1 C5 charry residue collected from the collection tank after test 1 FTIR Fourier Transformed InfraRed
GC Gas Chromatograph HFR high resistance to flow IC internal combustion LFR low resistance to flow LPG liquid propane gas
MIX mixture of wood sawdust and sunflower residue pellets MS Mass Spectroscopy
PA Particulate collected at the bottom of the tank below the cyclone PAH Polycyclic aromatic compounds
PB Particulate collected in on the wall of the tank below the cyclone PC Particulate collected in on the wall of the pipe at the gasifier outlet PLC Programmable Logic Controller
SRP Sunflower Residue Pellet TC0 Thermocouple 0 (gasifier outlet) TC1 Thermocouple 1 (cyclone outlet) TC2 Thermocouple 2 (scrubber outlet) TC3 Thermocouple 3 (blower outlet) TCD Thermo Conducibility Detector TOC Total Organic Carbon
WSP Wood Sawdust Pellet
Chapter 6
Nomenclature
A pre-exponential factor, (depends on the reaction rate expression) as specific volumetric area, m2 m-3
Ci concentration, kmol m-3 cp specific heat, J kmol-1 K-1 dp particle diameter, m dpo initial particle diameter, m Dreat reactor diameter, m Dm diffusivity, m2 s-1
E activation energy, J kmol-1 ER equivalence ratio, -
f corrective function for heterogeneous reactions, - h convective heat transfer coefficient, J kmol-1 K-1 m-2 I+ radiation intensity in the positive direction, W m-2 I- radiation intensity in the negative direction, W m-2 Ib black body radiation intensity, W m-2
kj kinetic constant, (depends on the reaction rate expression) km mass transfer coefficient, m s-1
hi specific enthalpy, J kmol-1 m moisture release rate, kg h
-1
7 ng gas pyrolysis yield, -
nt tar pyrolysis yield, - Nu Nusselt number, g sg p
h
d
Nu
q heat flux, J m-3 s-1 P pressure, atm Pr Prandtl number, g g pc
Pr
PS specific gas production, m3n kg -1
of dry biomass R ideal gas constant, atm L mol-1 K-1
Rj reaction rate, kmol m-3 s-1 Re Reynolds number, g g g p
U
C
d
Re
Sc Schmidt number, m g gD
Sc
Sh Sherwood number, m p mD
d
k
Sh
t time , s T temperature , K T0 reference temperature , K Ug gas velocity , m s -1 Us solid velocity , m s-1 Uso initial solid velocity , m s-1 z axial coordinate, mGreek letters
α assigned multiplicative factor in f, -
hj heat of reaction, J kmol-1 ε void fraction, -
absorption coefficient, -
g gas thermal conductivity, W K -1
m-1
s bed thermal conductivity, W K-1 m-1
μg gas dynamic viscosity, kg m-1 s-1
stochiometric coefficient, -
bulk density, kg m-3
char0 constant char bulk density, kg m
-3
Stefan-Boltzmann constant, W m-2 K-4
optical coordinate, m
Subscripts
bio biomass C combustion cond conductive ev evaporation g gas G gasification j reaction index m mass moi moisture MR methane reforming p particle P1 primary pyrolysis rad radiative s solid TC tar cracking WS water gas-shift w wallAbbreviations
PFR Plug Flow Reactor WSP Wood Sawdust Pellet
9
LIST OF FIGURES
Chapter 1
FIGURE 1.1-MAIN REACTIONS AND HEAT TRANSFER PHENOMENA IN A GASIFIER. ... 16 FIGURE 1.2-BASIC SCHEME OF A GASIFICATION PLANT. ... 18 FIGURE 1.3-SUITABLE BIOMASS GASIFIERS FOR A GIVEN THERMAL INPUT [10]. ... 22 FIGURE 1.4-EFFECT OF ER ON GAS (A) YIELD AND (B)LHV REPORTED BY SOME AUTHORS ... 29 FIGURE 1.5-EFFECT OF ER ON (A) LIGHT HYDROCARBONS AND (B) TAR CONTENTS REPORTED BY [16] AND
[17], RESPECTIVELY. ... 30 FIGURE 1.6-EFFECT OF THE REACTOR TEMPERATURE ON TAR CONCENTRATION IN THE RAW GAS, TAKEN
FROM [17]. ... 31 FIGURE 1.7-TAR MATURATION SCHEME PROPOSED BY [41]. ... 39 FIGURE 1.8-TAR DEW POINT OF DIFFERENT TAR CLASSES PLOTTED AGAINST THE TAR CONCENTRATION IN THE GAS [44]. ... 41 FIGURE 1.9-RESEARCH NEEDS IN BIOMASS GASIFICATION. ... 44
Chapter 2
FIGURE 2.1-PROBLEM DECOMPOSITION APPLIED TO A GASIFIER... 45
Chapter 3
FIGURE 3.1-WORK PROCEDURE (COUPLING EXPERIMENTS AND SIMULATIONS). ... 51 FIGURE 3.2-SCHEME OF THE EXPERIMENTAL SYSTEM. ... 52 FIGURE 3.3-DTR EXPERIMENTAL (SYMBOLS) AND PREDICTED (SOLID LINES) THERMAL PROFILES AT TN =600 °C AND 700°C. ... 53 FIGURE 3.4-(A)DIMENSIONAL DISTRIBUTION AND (B) ROUNDNESS FACTOR OF CACAO SHELLS AND DTR
RESIDUES. ... 54 FIGURE 3.5-COMPUTATIONAL DOMAIN OF THE DTR. ... 55 FIGURE 3.6-TG CURVES OF OXIDATION IN AIR OF CACAO SHELLS AND 3 SOLID RESIDUES (OBTAINED FROM
PYROLYSIS TEST IN THE DTR IN POSITION Z2 AND 3 NOMINAL TEMPERATURES). ... 58 FIGURE 3.7-CACAO SHELLS CONVERSION AT DIFFERENT REACTOR LENGTHS AND NOMINAL TEMPERATURE
CONDITIONS... 59 FIGURE 3.8-CFD PREDICTIONS OF PARTICLE THERMAL HISTORIES FOR:(A) NOMINAL TEMPERATURE TN =
800°C AT DIFFERENT REACTOR LENGTHS;(B) REACTOR LENGTH Z3 AND THREE NOMINAL
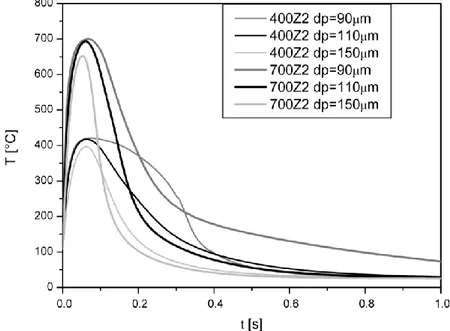
TEMPERATURE CONDITIONS (PARTICLE DIAMETER D32=110 ΜM,KIN_0). ... 60 FIGURE 3.9-CFD PREDICTIONS OF PARTICLE THERMAL HISTORIES FOR DIFFERENT PARTICLE SIZES (DP =90,
110 AND 150 ΜM) FOR TWO EXPERIMENTAL CONDITIONS (TN =400°C, REACTOR LENGTH Z2;TN = 700°C, REACTOR LENGTH Z2)(KIN_0). ... 62 FIGURE 3.10-ARRHENIUS PLOT OF DIFFERENT SET OF KINETICS (SEE TAB.3.2). ... 64 FIGURE 3.11-EFFECT OF DIAMETER CHANGE ON PREDICTED PARTICLE THERMAL HISTORIES FOR:(A)TN =
Chapter 4
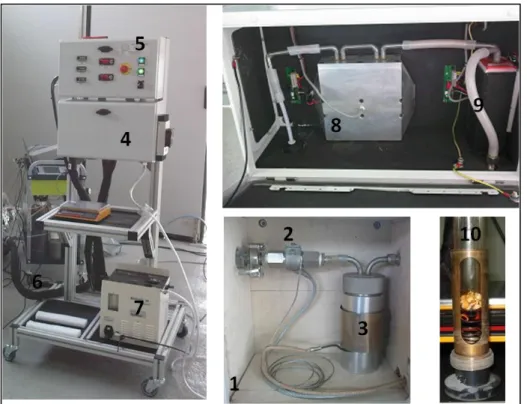
FIGURE 4.1-SAMPLING TRAIN ACCORDING TO THE STANDARD SETUP OF THE TAR PROTOCOL. ... 74 FIGURE 4.2-SAMPLING SYSTEM BASED ON A DRY CONDENSER AS DEVELOPED BY [6]. ... 76 FIGURE 4.3-EXPERIMENTAL SETUP REPORTED BY [12] FOR PAH-LIF... 78 FIGURE 4.4-SCHEMATIC REPRESENTATION OF THE SAMPLING SYSTEM. ... 81 FIGURE 4.5-PICTURES OF THE TAR SAMPLING SYSTEM:(1) MOBILE CASE INTERNAL,(2) FILTER WITH
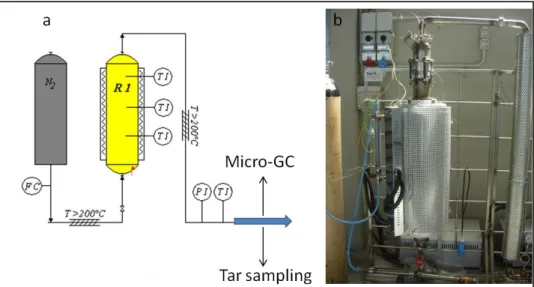
RESISTOR,(3) FIRST CABINET WITH RESISTOR,(4) SECOND CASE,(5) CONTROL BOX,(6) HEATED PIPING, (7) SAMPLING GROUP,(8) SECOND CABINET WITH PELTIER CELL,(9) THIRD CABINET WITH PELTIER CELL, (10) GLASS BOTTLE POSITION IN A METALLIC TUBE WITH SPRING. ... 82 FIGURE 4.6-PYROLYSIS REACTOR:(A) SCHEMATIC FLOW-SHEET,(B) PICTURE OF THE REACTOR WITHOUT
INSULATION AND RESISTORS. ... 84 FIGURE 4.7-TEMPERATURE EVOLUTION IN THE PYROLYSIS REACTOR AND GAS COMPOSITION (NITROGEN IS
THE COMPLEMENT TO 100%) AS FUNCTION OF TEST DURATION. ... 88 FIGURE 4.8-PICTURE OF THE FOUR GLASS BOTTLES AFTER A PYROLYSIS TEST. ... 92 FIGURE 4.9- DTG CURVES OF THE FOUR FRACTIONS OBTAINED IN THE THREE TESTS. ... 96 FIGURE 4.10-IR SPECTRUM OBTAINED IN CORRESPONDENCE OF THE MAXIMUM MASS LOSS RATE OF A
SAMPLE OF F3 IN THE TG. ... 98 FIGURE 4.11-TOTAL IONIC CURRENT CHROMATOGRAM OBTAINED THROUGH THE GC-MS ANALYSIS OF THE FOUR FRACTIONS COLLECTED AFTER TEST 2. ... 102
Chapter 5
FIGURE 5.1-REPRESENTATION OF THE GASIFICATION PLANT SECTIONS AND STREAMS. ... 110 FIGURE 5.2-FLOW-SHEET OF THE GASIFICATION PLANT. ... 111 FIGURE 5.3-BIOMASS LOADING SYSTEM: ... 112 FIGURE 5.4-FRONT VIEW OF THE GASIFIER:(A)PICTURE (B)CADSKETCH. ... 113 FIGURE 5.6-GASIFER CROSS SECTION WITH SOME COMPONENTS HIGHLIGHTED. ... 114 FIGURE 5.5-GASIFIER CROSS-SECTION AND GASIFICATION ZONES. ... 114 FIGURE 5.8-LABVIEW INTERFACE FOR THERMOCOUPLES SIGNALS DISPLAYING AND RECORDING. ... 120 FIGURE 5.7-(A)TC-3 POSITION AFTER THE BLOWER (B) WIRELESS TRANSMITTER. ... 120 FIGURE 5.9-(A)PN AND PG MANOMETERS READING (B) FINE-FILTER MANOMETER. ... 121
FIGURE 5.10-FLOW-METER INSTALLED IN A BY-PASS AFTER THE BLOWER. ... 122 FIGURE 5.11- MICRO-GC AND SAMPLING LINE. ... 124 FIGURE 5.12-CHROMATOGRAM REPORTING THE DETECTOR SIGNALS FOR THE COLUMN SUPPORTING
MOLSIEVE. ... 125 FIGURE 5.13-PRESSURIZED CABINET FOR FTIR. ... 126 FIGURE 5.14-SKETCH 3D OF THE PROBE FOR SOLID SAMPLING IN THE GASIFIER BED. ... 128 FIGURE 5.15-FRONT VIEW OF THE DRYING SYSTEM. ... 130 FIGURE 5.16-TAR CRACKING LINE “TAREK” IN STAND-ALONE CONFIGURATION. ... 131 FIGURE 5.17-DESIGN METHODOLOGY OF SUITABLE FEEDSTOCK FOR A GASIFICATION PROCESS. ... 132 FIGURE 5.18-TEMPERATURE EVOLUTION OF THE FOUR CLEAN-UP THERMOCOUPLES... 138 FIGURE 5.19-TEMPERATURE ACQUISITIONS ALONG THE GASIFIER THROAT MOVING A THERMOCOUPLE
DOWN FROM A NOZZLE. ... 139 FIGURE 5.20-MAIN GAS SPECIES EVOLUTION DURING THREE TESTS. ... 142 FIGURE 5.21-PRESSURE DROP IN SOME COMPONENTS OF THE CLEAN-UP SYSTEM. ... 143 FIGURE 5.22-EVOLUTION OF THE PRESSURE DROP ACROSS THE GASIFIER BED DURING THE TESTS. ... 147
11
FIGURE 5.23-PN TO PG RATIO AND DISCHARGE FREQUENCY MODULATION IN FOUR TESTS. ... 148
FIGURE 5.24-GAS FLOW-RATE/PRESSURE DROP RELATIONSHIP IN THE FIVE TESTS. ... 149 FIGURE 5.25-RELATIONSHIP BETWEEN GAS FLOW-RATE ... 150 FIGURE 5.26-CONDENSATE COLLECTED IN IMPINGER 3 AFTER TEST 5. ... 154 FIGURE 5.27-CHARRY RESIDUES RECOVERED FROM THE COLLECTION TANK ... 155 FIGURE 5.28-COMPARISON OF WSP AND BED. ... 157 FIGURE 5.29-SAMPLING POINT AND APPEARANCE OF GASIFICATION PARTICULATES. ... 159 FIGURE 5.30-TOTAL IONIC CURRENT CHROMATOGRAM OBTAINED FROM GC-MS ANALYSIS OF THE
COMPOUNDS EXTRACTED IN ACETONE FROM PA(A) AND PC(B). ... 162 FIGURE 5.31-REPRESENTATION OF THE MATERIAL AND ELEMENTAL BALANCES. ... 163 FIGURE 5.32-REPRESENTATION OF THE ENERGY BALANCE. ... 164
Chapter 6
FIGURE 6.1-MODELLED PORTION OF THE GASIFIER. ... 173 FIGURE 6.2-REPRESENTATION OF THE MODELLING APPROACH AND FLUXES. ... 174 FIGURE 6.3-REPRESENTATION OF THE DISTRIBUTED DOMAIN. ... 175 FIGURE 6.4-COMPARISON OF THE DRYING RATE REPRESENTED WITH AN ARRHENIUS-TYPE RELATIONSHIP
AND A DIFFUSION LIMITED MASS TRANSFER. ... 182 FIGURE 6.5-COMPARISON OF MASS-LOSS RATE AND FINAL CHAR YIELDS OBTAINED USING FOUR DIFFERENT
DEVOLATILIZATION SUB-MODELS AND COMPARED TO THE CHAR YIELDS ACHIEVED IN THE WORK OF [28,29,30]. ... 186 FIGURE 6.6-GRAPHICAL REPRESENTATION OF THE MAIN FEATURES OF THE GPROMS MODEL BUILDER
UTILITY. ... 197 FIGURE 6.7-REPRESENTATION OF THE GASIFIER GEOMETRIES IMPLEMENTED IN THE MODEL. ... 200 FIGURE 6.8-SIMULATION RESULTS FOR THE TEST CASE:(A) VOLUME FRACTION OF GAS SPECIES,(B) GAS AND
SOLID PHASE TEMPERATURE PROFILES,(C) REACTION RATES DISTRIBUTION ALONG THE GASIFIER AXIS. ... 203 FIGURE 6.9-(A) GAS AND SOLID PHASE TEMPERATURE PROFILES AND (B) HEAT TRANSFER FLUXES WITHIN
THE SOLID PHASE OBTAINED FROM THE SIMULATION OF THE REFERENCE CASE WITH CARBON DIOXIDE AS PRODUCT OF THE CHAR OXIDATION. ... 207 FIGURE 6.10-SHIFTING OF THE SOLID TEMPERATURE PROFILE OBTAINED FROM THE SIMULATION OF THE
REFERENCE CASE WITH CARBON DIOXIDE AS PRODUCT OF THE CHAR OXIDATION AND ASSUMPTION 1 FOR THE SOLID MOTION IN THE THROAT. ... 208 FIGURE 6.11-(A)EFFECT OF THE THROAT ON THE GAS VELOCITY: COMPARISON OF THE THROAT-LESS AND
THROATED CONFIGURATION FROM SIMULATION OF THE GASIFIER WITH CARBON DIOXIDE AS CHAR OXIDATION PRODUCT;(B)SHIFTING OF THE SOLID TEMPERATURE PROFILE OBTAINED FROM THE SIMULATION OF THE REFERENCE CASE WITH CARBON DIOXIDE AS PRODUCT OF THE CHAR OXIDATION AND ASSUMPTION 1 FOR THE SOLID MOTION IN THE THROAT. ... 209
LIST OF TABLES
Chapter 1
TABLE 1.1-MAIN REACTIONS INVOLVED IN BIOMASS GASIFICATION. ... 17 TABLE 1.2-TYPICAL SYNGAS END-USERS AND PROPERTIES. ... 19 TABLE 1.3-BIOMASS GASIFICATION TECHNOLOGIES COMPARISON. ... 22 TABLE 1.4-GASIFICATION APPLICATIONS REPORTED IN INTERNET. ... 24 TABLE 1.5-TYPICAL PERFORMANCE INDICATORSFOR DIFFERENT GASIFICATION TECHNOLOGIES. ... 26 TABLE 1.6-SYNGAS COMPOSITION WITH DIFFERENT GASIFYING AGENTS [20]. ... 27 TABLE 1.7-COMPARISON OF THE MAIN PROPERTIES OF WOODCHIPS PRODUCED FROM THE MAINTENANCE OF
A NATURAL RESERVE AND THE LIMITS TO USE THEM AS FEEDSTOCK FOR A DOWNDRAFT GASIFIER PROVIDED BY THE MANUFACTURER. ... 32 TABLE 1.8-PROXIMATE ANALYSIS OF BIOMASS MATERIALS (DRY BASIS). ... 33 TABLE 1.9-TAR AND PARTICULATE CONTENTS AT THE OUTLET OF A DOWNDRAFT GASIFIER AND LIMITS
SPECIFIED BY THE MANUFACTURER FOR SAFE AND RELIABLE IC-ENGINE OPERATION*. ... 35 TABLE 1.10-ASH COMPOSITION OF SOME BIOMASS (DRY BASIS)[33]. ... 36 TABLE 1.11-TYPICAL COMPOSITION OF TAR DERIVED FROM BIOMASS GASIFICATION [40]. ... 38 TABLE 1.12-TAR CLASSIFICATION REPORTED IN [37]. ... 39
Chapter 3
TABLE 3.1-SIMULATED RESULTS OF CHARACTERISTIC VALUES OF THERMAL HISTORY DETERMINED WITH D32= 110 ΜM AND KIN_0 KINETICS. ... 61 TABLE 3.2-KINETIC PARAMETERS FOR DIFFERENT SFOR CALCULATIONS. ... 62 TABLE 3.3-COMPARISON OF BIOMASS CONVERSION VALUES (% WT DRY) OBTAINED FROM EXPERIMENTAL
TESTS AND PREDICTED BY THE SFOR KINETIC. ... 63 TABLE 3.4-COMPARISON OF BIOMASS CONVERSION VALUES (% WT DRY) OBTAINED FROM EXPERIMENTAL
TESTS AND PREDICTED BY THE CFD MODEL. ... 66
Chapter 4
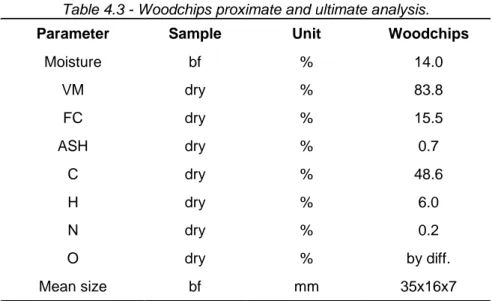
TABLE 4.1-COMPARISON OF TAR SAMPLING METHODS. ... 80 TABLE 4.2-FINAL TEMPERATURE SETUP OF THE TAR SAMPLING SYSTEM. ... 83 TABLE 4.3-WOODCHIPS PROXIMATE AND ULTIMATE ANALYSIS. ... 85 TABLE 4.4-PYROLYSIS CONDITIONS. ... 85 TABLE 4.5-MEAN PYROLYSIS GAS COMPOSITION, CHAR PROXIMATE AND ULTIMATE ANALYSIS. ... 89 TABLE 4.6-FRACTIONATION OF THE SAMPLED CONDENSATE IN THE FOUR BOTTLES. ... 92 TABLE 4.7-MASS BALANCE OF THE PYROLYSIS TESTS. ... 93 TABLE 4.8-PROXIMATE ANALYSIS OF THE FOUR FRACTIONS COLLECTED IN THREE TESTS. ... 97 TABLE 4.9-WATER CONTENT OF THE FOUR FRACTIONS COLLECTED FROM TEST 2. ... 99 TABLE 4.10-MEASUREMENT RANGE AND PRECISION OF THE ULTIMATE ANALYZER. ... 100 TABLE 4.11-PROXIMATE ANALYSIS OF F1 AND F2A COLLECTED IN THREE TESTS. ... 101 TABLE 4.12-ORGANIC SPECIES IDENTIFIED BY GC-MS ANALYSIS IN THE FOUR FRACTIONS OF TEST 2. ... 103
13
Chapter 5
TABLE 5.1-NOMINAL GASIFIER CHARACTERISTIC PROVIDED BY THE VENDOR. ... 109 TABLE 5.2-DISCHARGE FREQUENCY OF THE MECHANICAL SCRAPER. ... 117 TABLE 5.3-VENDOR SPECIFICATIONS RELATED TO SOME CHEMICAL AND PHYSICAL PROPERTIES OF THE
BIOMASS FEEDSTOCK. ... 118 TABLE 5.4-VENDOR SIZE SPECIFICATIONS OF THE BIOMASS FEEDSTOCK. ... 118 TABLE 5.5-ADVANTAGES AND DISADVANTAGES RELATED TO PELLETIZED FUELS. ... 133 TABLE 5.6-SAMPLES PROPERTIES AND THERMO-CHEMICAL ANALYSIS. ... 135 TABLE 5.7-GASIFICATION TESTS RESUME. ... 136 TABLE 5.8-SYNGAS COMPOSITIONS ACHIEVED IN THE FIVE TESTS... 141 TABLE 5.9-MEAN PERMEABILITY VALUES [10-10 M2]. ... 151 TABLE 5.10-VOID FRACTION ACCORDING TO THE INITIAL SIZE AND SHAPE OF THE PARTICLES. ... 151 TABLE 5.11-VOID FRACTION ASSUMING ESD EQUAL TO 4 MM IN THE GASIFIER BED. ... 152 TABLE 5.12-CHARRY RESIDUES PROXIMATE AND ULTIMATE ANALYSIS. ... 155 TABLE 5.13-BED PROXIMATE AND ULTIMATE ANALYSIS. ... 157 TABLE 5.14-PARTICULATES PROXIMATE AND ULTIMATE ANALYSIS. ... 158 TABLE 5.15-ORGANIC COMPOUNDS IDENTIFIED IN THE ACETONE EXTRACTED OF PA AND PC. ... 160 TABLE 5.16-MATERIAL AND ELEMENTAL BALANCE CALCULATION. ... 164 TABLE 5.17-MATERIAL AND ELEMENTAL BALANCE CLOSURES. ... 165 TABLE 5.18-MASS BALANCE RESULTS... 166 TABLE 5.19-OPERATING PARAMETERS AND PERFORMANCE INDICATORS. ... 167
Chapter 6
TABLE 6.1-KINETIC PARAMETERS FOR ARRHENIUS-TYPE BIOMASS DRYING. ... 182 TABLE 6.2-RAW COMPOSITION OF TAR MODEL COMPOUNDS. ... 183 TABLE 6.3-KINETIC PARAMETERS FOR A SINGLE FIRST ORDER REACTION ... 185 TABLE 6.4-WATER YIELD PREDICTED BY THE THREE SUB-MODELS AND COMPARED WITH RANGE OF
EXPERIMENTAL VALUES ACHIEVED BY THREE AUTHORS [28,29,30] AT THREE DIFFERENT
TEMPERATURES. ... 187 TABLE 6.5-PARAMETERS FOR INTRINSIC KINETICS OF CARBON OXIDATION USED IN COMPREHENSIVE BIOMASS COMBUSTOR AND GASIFICATION MODELS... 192 TABLE 6.6-PARAMETERS FOR INTRINSIC KINETICS OF GASIFICATION WITH CARBON DIOXIDE USED IN
COMPREHENSIVE BIOMASS COMBUSTOR AND GASIFICATION MODELS. ... 192 TABLE 6.7-KINETIC PARAMETERS FOR HYDROCARBON COMBUSTION [47]. ... 194 TABLE 6.8-KINETIC PARAMETERS FOR CARBON MONOXIDE OXIDATION. ... 195 TABLE 6.9-KINETIC PARAMETERS FOR FORWARD AND BACKWARD WATER GAS SHIFT REACTION. ... 196 TABLE 6.10-MACRO-PRODUCTS DISTRIBUTION AND ULTIMATE COMPOSITION [%WT]. ... 198 TABLE 6.11-GASEOUS SPECIES DISTRIBUTION OF VOLATILES PRODUCED FROM PRIMARY PYROLYSIS AND
SECONDARY PYROLYSIS. ... 198 TABLE 6.12-BULK DENSITIES OF THE BIOMASS CONSTITUENTS ACCORDING TO THE INITIAL TOTAL BULK
DENSITY, THE INITIAL MOISTURE CONTENT AND THE CHAR YIELD ASSUMED FROM [8]. ... 198 TABLE 6.13-SPECIFIC HEATS OF SOLID AND GASEOUS COMPONENTS USED IN THE SIMULATION OF THE
MODEL. ... 199 TABLE 6.14-HEATS OF REACTIONS USED IN THE SIMULATION OF THE MODEL. ... 199 TABLE 6.15-INPUT VALUES USED IN THE REFERENCE CASE. ... 201
TABLE 6.16-VALUES OF THE SPECIFIED COEFFICIENTS. ... 201 TABLE 6.17-COMPARISON OF SIMULATION AND EXPERIMENTAL RESULTS. ... 204 TABLE 6.18-PARAMETERS SENSITIVITY: COMPARISON OF THE RESULTS OBTAINED FROM THE REFERENCE
CHAPTER 1. BIOMASS GASIFICATION: STATE OF THE ART
AND TECHNOLOGICAL BARRIERS
The economic and environmental sustainability of the planet relies on the identification and use of renewable sources and the exploitation of wastes for energy and materials production. Biomass fuels represent a renewable energy source and may be abundant in specific local areas. The possibility to substitute fossil fuels with biomass is becoming more and more attractive, since it is possible to consider this material not just as a solid fuel but also as a source of chemicals, hydrogen and liquid bio-fuels [1]. The biorefinery concept has been developing in the last ten years and it is the evolution of the traditional oil refinery. Biomass gasification, among other technologies, is an option for exploiting biomass and can be considered the core of the biorefinery, since all the residues deriving from other platforms can be used to produce power, chemicals and hydrogen with this process. Biomass gasification is a thermo-chemical process that converts the solid biomass into a gaseous fuel, mainly composed of CO, H2, CH4, CO2, N2. This gas is often named Syngas (underlining its use as reagent for chemical synthesis); however different names can be found in the literature such as wood-gas or producer-gas. For biomass gasification to occur high temperature and a gasifying agent (e.g. oxygen) are required. The gasification of solid fuels has been studied since the 18th century and the first applications to coal date back to the early 19th century. Biomass gasification has become important during the Second World War due to the fuel shortage for transportation. In the last decades the interest in biomass gasification has been floating, starting from the 70s until about 1987, biomass gasification is considered as a response to the oil crisis [2]. Subsequently the number of published papers and patent decreased until the late 1990s when concerns about the climate change started a new season of studies in Europe [2]. After 2000, Japan, China and India emerged as important players in this field. The main driver to choose biomass gasification as a technology for biomass exploitation is its potential flexibility for the input as well as for output. Different sources can be used as feedstock for a biomass gasifier such as dedicated energy crops, forest and agricultural residues, by-products and wastes of the pulp and paper industry, food industry and specialties industry. As aforementioned, different products can be produced starting from syngas, since, depending on the final destination, the gasification step can be carried out in different operating conditions to generate syngas with different heating value or hydrogen content. This flexibility allows combining biomass gasification with several end-users such as heat and power generation, chemicals synthesis and hydrogen production.
1.1 Biomass gasification basics
The aim of this Paragraph is to highlights the main phenomena involved in biomass gasification, the steps that operate in a gasification plant and the main properties and applications of the syngas.
1.1.1 Gasification chemistry and phenomena
The gasification process is based on the partial oxidation of a solid fuel due to a gasifying agent, usually air, oxygen and steam. The partial oxidation provides heat for the endothermic reactions and phenomena of the process (drying, devolatilization, reduction reactions). Fig. 1.1 represents the main steps involved in a gasification process and Tab. 1.1 reports the reactions of the gasification process.
As a biomass particle enters a gasifier it starts to heat up, as a consequence the biomass particle releases its moisture content and subsequently begins the devolatilization process (reaction Rp1). The biomass devolatilization generates three macro-products: gas, tar and char. The devolatilization gas is usually composed of carbon monoxide, carbon dioxide, hydrogen, methane and water and light hydrocarbons. Tar represents a broad range of organic compounds which are vapours at the gasifier temperature (more than 400°C) but liquid at room temperature. Char is the solid residue of the biomass. As oxygen contacts the combustible volatiles and the char both homogeneous and heterogeneous oxidation reactions can take place. Volatiles and tar combustion produces carbon dioxide and water trough reactions Rc1, Rc2, Rc3, Rc4. Char undergoes oxidation trough the heterogeneous reaction Rc, this reaction generates both carbon monoxide and carbon dioxide, the mutual proportion are function of the temperature, the oxygen availability and ash content of the char. These combustion reactions provide the heat for biomass drying and devolatilization and for the other
reactions involved in the process, the heat is transferred trough convection, mass transfer, conduction and radiation. In the gaseous phase tar and methane are subjected to steam reforming (RTR and RMR), generating carbon monoxide and hydrogen. Tar can also decompose as a consequence of high temperature due to thermal cracking (RTC), generating lighter gases such as carbon monoxide, carbon dioxide, hydrogen and methane. In addition the equilibrium of the water gas-shift reaction (RWS) affects the concentration of carbon monoxide, water, carbon dioxide and hydrogen according to the temperature of the system. The char can be converted into gas at high temperature (more than 600°C) to carbon monoxide, hydrogen and methane due to heterogeneous reactions with carbon dioxide (RG1), steam(RG2)and hydrogen(RG3).
Table 1.1 - Main reactions involved in biomass gasification.
biomass char + volatiles (tar + gas) RP1 DEVOLATILIZATION C + O2 (g) 2(1)CO + (21)CO2 (Oxidation) RC
HETEROGENEOUS
REACTIONS
C + CO2(g) 2CO (Boduard) RG1
C + H2O(g) CO + H2 RG2
C + 2H2(g) CH4 RG3
CO + H2O(g) CO2 + H2 (water/gas shift reaction) RWS
HOMOGENEOUS
REACTIONS
TAR + O2CO+ H2O RC1
TAR + H2OCO+ H2O (Tar reforming) RTR
TARCO+ CO2 + CH4 + H2 (Tar cracking) RTC
CH4 + 1.5O2CO + 2H2O RC2
CH4 + H2OCO+ 3H2 (Reforming-Methanation) RMR
CO + 0.5O2CO2 RC3
H2 + 0.5O2H2O RC4
It is worthy to note that devolatilization and heterogeneous reactions are greatly influenced by the operating conditions such as temperature, heating rate, particle size distribution and pressure. As far as devolatilization is concerned it is widely recognized that operating conditions affects the reaction rate, the macro-products distribution [3], the gas species composition [4], the tar composition [5] and the composition as well as the morphological properties of the char [6,7]. These latter properties along with the ash content of the char have a great influence on the heterogeneous reactions favouring or limiting the reaction rate. The gasification system is characterized by the solid motion and behaviour, the particle size and motion depend on the gasifier configuration, the particles can move very slowly or being transport in fast jet of gas. The particles can break up due to several phenomena such as comminution, fragmentation and abrasion, depending on the flow regime in the gasifier. Since different flow regimes can be achieved in different gasifiers, the gas can experience from laminar to highly turbulent flows; in addition according to the gasifier geometry and solid distribution the gas flow may encounter different degree of mixing from very low axial and radial dispersion to perfectly stirred condition.
As a consequence, despite the chemical reactions are the same in every gasifier, the geometry and the operating conditions generate completely different systems.
1.1.2 Biomass gasification steps
Three different steps can be recognized in a biomass gasification plant (Fig. 1.2): biomass conditioning, biomass gasification and syngas clean-up. Biomass conditioning groups all the pre-treatment that are required to meet the biomass properties specified for a gasifier, for instance drying can be a conditioning step to bring the biomass moisture content below the limit specified for a certain type of gasifier. Biomass gasification can be operated in several gasifier types and operating conditions that will be object of the following Paragraphs. The gasification step produces a charry residue (namely charcoal) and the desired product, the syngas. The last step before the end-user is the syngas clean-up, here different gas treatment can be performed to let the gas meet the end-user specifications. For instance, a cyclone is the clean-up required to reduce the particulate content.
From a logical point of view the design of a gasification plant depends on the end-user. Once the end-user is defined the most suitable gasification technology and operating conditions have to be chosen. The choice of a certain gasifier provides, along with the feedstock properties (biomass) and end-user specifications, the information for the design of the conditioning and the clean-up steps, respectively. The main properties of the syngas are the LHV, the gas species composition, the TAR and particulates contents. Tab. 1.2 reports the relevant syngas properties according to the end-user. For instance, the only need for re-burning in coal power plants is an adequate lower heating value of the gas (LHV). In this case air gasification is a suitable option and the gas clean-up is not a major issue. As the end-user becomes more sophisticate, higher syngas properties are required, as a consequence the gasifier and clean-up systems choice become critical issues. For instance, the syngas preparation for chemicals synthesis via Fischer-Tropsch reaction requires very high hydrogen and carbon monoxide contents. Thus it is necessary to operate gasification with steam and oxygen, in order to avoid the nitrogen removal step, as well as very low tar, particulate and sulphur content to avoid catalyst poisoning.
Figure 1.2 - Basic scheme of a gasification plant.
GASIFIER CLEAN-UP GASYFING AGENT BIOMASS CHARRY RESIDUE SYNGAS WASTES CONDITIONING
Table 1.2 - Typical syngas end-users and properties.
End-User Syngas properties
Co-firing in coal furnace LHV > 2.5 MJ mn -3 gas Steam cycle Turbo-gas LHV > 2.5 MJ mn -3 gas Low tar content
Low particulate matter content IC-Engine CHP
Liquid bio-fuels synthesis
LHV > 10 MJ mn -3
gas Very low tar content Very low particulate content
Nitrogen removal Hydrogen production
1.2 Biomass gasification technologies
As mentioned in Paragraph 1.1 the gasifier setup is, along with the operating conditions, the main choice to satisfy the requirements of the end-user. Different gasification technologies lead to different gasification behaviour and issues [8]. The aim of this Paragraph is to provide a brief description of the available gasification technologies. Two major gasification categories can be identified: fixed bed gasifier and fluid bed gasifier. As aforementioned, the choice of the gasifier is related to the end-user; however the affordability of a technology relies on the size of the plant and the feedstock input.
1.2.1 Fixed bed gasifiers
Fixed bed (or moving bed) gasifiers are thick bed of biomass supported on a grate, the biomass is typically charged from the top of the gasifier. Fixed bed gasifiers can be classified according to the geometry and gasifying agent distribution in two groups: Updraft and Downdraft. These gasifiers operate under slight vacuum conditions, are usually relatively simple and are suitable for small-medium scale applications (up to few MWth). In the updraft gasifier the gasifying agent enters from the bottom of the gasifier and moves upward, the biomass is loaded from the top and moves downward. The biomass is ignited over the grate, generating high temperature in this zone which becomes the oxidation zone. The low oxygen hot gas moves upward providing heat for the other zones; consequently as the biomass enters from top experiences drying, devolatilization and gasification reactions and, finally, oxidation. Due to this configuration the syngas outlet temperature is low and the tar content is pretty high, since the gas does not experience high temperature zones where tar could be converted through reactions RTR andRTC. As far as concern downdraft gasifiers, different configurations
can be identified, the most documented configuration is throated gasifiers. In throated gasifiers the air enters through several radial nozzles in a zone with a restricted cross section, positioned in the middle of the gasifier. The biomass is ignited in the restricted area generating the oxidation zone, as the biomass gets closer is heated up and drying and devolatilization takes place. After the oxidation zone both the gas and the biomass move downward, given the lack of oxygen and the high temperature gasification reactions (RG1,RG2,RG3) occur, this latter zone is often called reduction zone. The tar content in this gasifier is low, due to tar cracking (RTC) that can occur in the throat of the gasifier. A disadvantage of this
technology is high gas outlet temperature, which is likely to contain alkaline vapour and particulates. Several other fixed bed gasifiers are described in the literature such as cross draft gasifier and open-top gasifiers. It is worthy to note that different geometries can be identified in the literature, depending on the design of the gasifier manufacturer.
1.2.2 Fluid bed gasifiers
In fluid bed gasifiers fuel particles of specified size and mixed with another solid are suspended due to the gas flowing from the bottom of the gasifier. Concerning biomass gasification, the two most common configurations are bubbling fluidized bed and circulating fluidized bed. Heat can be provided directly, with air or oxygen
injection in the bed, or indirectly by means of internal heat exchanger, or with the fluidization medium acting as a heat carrier between two reactors.
These gasifiers are specific for stationary processes, therefore are usually suitable from medium to large scale installations and are usually complex to be managed. These gasifiers usually produce gas with high particulates content; therefore a cyclone is usually a component of the installation. The gas temperature at the outlet is relatively high, containing alkaline vapours. These gasifiers are meant to produce more tar than downdraft gasifiers but less than updraft gasifiers. Two phases can be recognized in a bubbling bed gasifier: a dense phase (with a high solid content), located at the bottom of the reactor, and a diluted phase in the riser. In the lower zone gas bubbles formation and implosion generate high turbulence, thus favouring an intimate mixing of the solid components; the higher zone is much more likely to be represented as a plug flow reactor. In circulating bed the gas velocity is high enough to transport pneumatically all the solid, thus achieving higher degree of mixing, turbulence and heat transfer. This gasifier is suitable for large scale applications, a well documented application [9] is the pressurized circulating fluid bed (PCFB) coupled with gas turbine in an integrated gasification combined cycle (IGCC).
1.2.3 Comparative analysis
The evaluation of a gasification technology is strictly related to the end-user, the plant size and feedstock availability. Tab. 1.3 reports a comparison of some gasification technologies, highlighting their advantages and disadvantages. Fixed beds are pretty easy in the design, this leads to simple operating procedures and low realization costs; therefore they are suitable for small scale applications, but, as the plant capacity increase they should be avoided, since this design cannot cope with high biomass load. As a consequence [10] states that downdraft gasifiers are suitable for applications up to 1 MWth and Updraft gasifiers up to 10 MWth (Fig. 1.3). Updraft gasifiers compared to downdraft are more flexible, they can operate with biomass with higher moisture content, since the steam produced in the drying zone does not reach the oxidation zone, and with smaller particle size since there is no restriction in the cross section. Another advantage is the lower gas outlet temperature. On the other hand Updraft gasifiers produce syngas with higher tar and water content. Fluid bed gasifiers are more complex than fixed beds, thus requiring higher investment and management costs. They require tight specifications of fuel size and are very sensible to ash melting phenomena, leading to bed agglomeration and loss of fluidization. On the other hand these reactors are more flexible in terms of feedstock, allow reaching higher throughput and can be coupled (as in the case of PCFB) to gas-turbine. Finally, it can be stated that the higher the plant capacity, the higher the flexibility in terms of feedstock, but the higher the system complexity and costs.
Table 1.3 - Biomass gasification technologies comparison.
\
Technology Downdraft Updraft BFB CFB
Tmax [ C] 1200 900 <900 <900
Tout [ C] 600 300 -
-Solid size [mm] 20-100 5-100 1-20 1-20
Ash content [%] 0.5 1.4 <25 <25
Moisture [%] 20 40 50 50
Pro Simple technology Low management
costs Low tar content High conversion Simple technology Low management costs Medium moisture content allowed Broad range of particle size Acceptable tar content High moisture and ash content allowed Acceptable tar content High moisture and ash content
allowed
Cons Low moisture required Tight spec on
particle size
High tar content High moisture content Complex plant High management costs Very tight spec on particle size Complex plant High management costs Very tight spec on particle size
1.2.3.1 Documented applications
Here a brief list of documented biomass gasification applications is reported. Broad database about gasifier manufacturers and reported applications can be found elsewhere [11, 12].
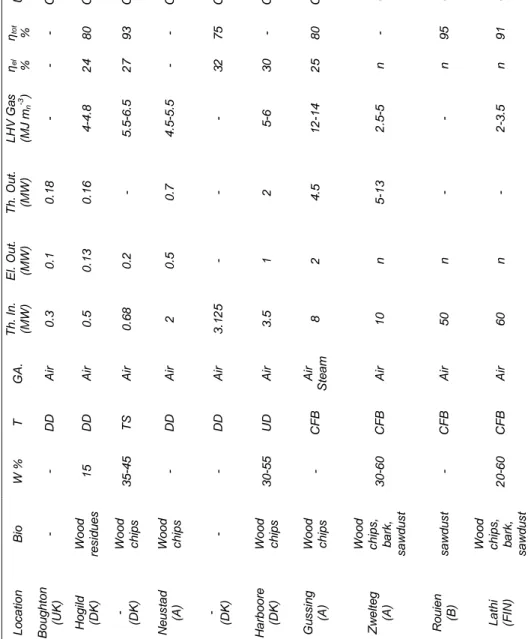
Tab. 1.4 lists some of the most cited applications that can be found in the World Wide Web. Notably the case studies reported are not from scientific articles rather from company reports or research and development centres. With the exception of Güssing, all the documented applications operate with air as gasifying agent. The small scale applications range from 300 kWth to 3 MWth, most of them are based on a downdraft gasifier and the syngas end-user is combustion in an internal combustion engine for combined heat and power (CHP) production. With the only exception of Güssing, medium and large scale applications are devoted to produce syngas for co-combustion in a coal furnace. Notably large scale fluid bed can operate even with very high moisture content (up to 60%); however this leads to a reduction in the gas LHV. To the author knowledge, with the exception of Güssing and Varnamo, the most common applications is air gasification in fixed bed gasifier for very small scale to small scale applications, these are not widely reported and for instance are spread in the rural areas of India [13]. Medium to large scale applications are usually demonstrative project coupled with ―simple‖ end-user such as re-burning or co-combustion in coal power station. No high level applications such as Fischer & Tropsch synthesis are documented at such scale, and this is a consequence of the poor diffusion and the scarce reliability that biomass gasification has encountered in the past years.
U s e CHP CHP CHP CHP CHP CHP CHP CC CC CC ηtot % - 80 93 - 75 - 80 - 95 91 ηel % - 24 27 - 32 30 25 n n n L H V Ga s (MJ m n -3 ) - 4 -4 .8 5 .5 -6 .5 4 .5 -5 .5 - 5 -6 12 -14 2 .5 -5 - 2 -3 .5 Th. Ou t. (MW) 0.1 8 0 .1 6 - 0 .7 - 2 4.5 5 -13 - - E l. Ou t. (MW) 0 .1 0 .1 3 0 .2 0 .5 - 1 2 n n n Th. In . (MW) 0 .3 0 .5 0 .6 8 2 3 .1 2 5 3 .5 8 10 50 60 GA . A ir A ir A ir A ir A ir A ir A ir S te a m A ir A ir A ir T DD DD TS DD DD UD C FB C FB C FB C FB W % - 15 35 -45 - - 30 -55 - 30 -60 - 20 -60 B io - Wood re s idu e s Wood ch ips Wood ch ips - Wood ch ips Wood ch ips Wood ch ips , b a rk , s a w d u s t s a w d u s t Wood ch ips , b a rk , s a w d u s t L o c a tion B o u g h to n (U K ) H o g ild (D K ) - (D K ) N e u s ta d (A ) - (D K ) H a rb o o re (D K ) Gu s s ing (A ) Zw e lt e g (A ) R o u ien (B ) L a th i (FI N )
Table 1.4 - Gasification applications reported in Internet. [W: moisture; T: technology; GA: gasifying agent; Th. In: thermal input; El. Out.: electric output; Th. Out.: thermal output; ηel :electric
efficiency; ηtot :total energy efficiency; DD: downdraft; UD: updraft; TS: double-stage; CFB: circulating fluidized bed.]
1.2.3.2 Performance Indicators
The aim of biomass gasifiers is to convert the solid fuel into a gaseous fuel which can be used for several purposes. Consequently the efficiency of a gasifier can be defined as its ability to convert the solid fuel and its energy content into a gas. Different indicators can be used to evaluate the biomass conversion; here a brief list is presented.
The specific gas production is the rate between the gas flow-rate (in m3n h -1
) and the biomass fed to the gasifier (in kg h-1):
gas gas
M
Q
PS
(1)This parameter can be defined in several ways, depending on the gas (wet gas or dry gas) and biomass (wet, dry or daf) properties, respectively.
The carbon conversion is the rate between the carbon leaving the gasifier in the gas (as CO, CO2 etc.) and the carbon entering the system:
c gas n i i c gas
x
M
y
Q
CC
1 (2)An equivalent definition of the carbon conversion is the rate between the carbon leaving the system as carbonaceous residues and the carbon entering the system. Another representation of the biomass conversion is the overall biomass conversion, which is defined according to the ash-tracer method:
char ash bio ash
x
x
X
1
(3)The energy content of the syngas is usually can be expressed with its lower heating value (LHV) as the heat (in MJ) generated from the combustion of one m3n of syngas. By taking into account the specific gas production and the energy content of the biomass, it is possible to define the cold gas efficiency as the ratio between the chemical energy leaving the system associated to the cold and tar-free syngas and the chemical energy entering the system associated to the biomass: bio bio gas gas
LHV
M
LHV
Q
CGE
(4)Where LHVgas and LHVbio are the lower heating values of the syngas and the biomass (in MJ m3n-1), respectively. Obviously, the higher CGE the more efficient is the gasifier. It is worthy to note that this definition is suitable for standard applications where the gas is cooled prior to combustion, for instance in an internal combustion engine. When different applications are to be considered the definition can be adapted. For instance, if the syngas is to be used as a re-burning fuel in a coal furnace, there is no need for gas quenching and gas removal, thus the gas sensible heat, the water latent heat and the chemical energy associated to tar have to be considered.


![Figure 1.6 - Effect of the reactor temperature on tar concentration in the raw gas, taken from [17]](https://thumb-eu.123doks.com/thumbv2/123dokorg/7550268.109307/47.722.169.546.343.620/figure-effect-reactor-temperature-tar-concentration-raw-taken.webp)
![Figure 1.8 - Tar dew point of different tar classes plotted against the tar concentration in the gas [44]](https://thumb-eu.123doks.com/thumbv2/123dokorg/7550268.109307/57.722.157.554.539.835/figure-tar-dew-point-different-classes-plotted-concentration.webp)