Astronomy
&
Astrophysics
https://doi.org/10.1051/0004-6361/202037752© ESO 2021
A survey of IRAS young stellar object candidates
Searching for large-scale Herbig-Haro objects
?
Rosario López
1, Angels Riera
2,†, Robert Estalella
1, and Gabriel Gómez
3,4,5 1Departament de Física Quàntica i Astrofísica, Institut de Ciències del Cosmos, Universitat de Barcelona, IEEC-UB,Martí i Franquès, 1, 08028 Barcelona, Spain e-mail: [email protected]
2Departament de Física i Enginyeria Nuclear, Universitat Politècnica de Catalunya, Av. Eduard Maristany, 16, 08019 Barcelona,
Spain
3Grantecan S.A., Centro de Astrofísica de La Palma, Cuesta de S. José, 38712 Breña Baja, La Palma, Spain 4Instituto de Astrofísica de Canarias, Via Láctea s/n, 38200 La Laguna, Tenerife, Spain
5Departamento de Astrofísica, Universidad de La Laguna, 38205 La Laguna, Tenerife, Spain
Received 17 February 2020 / Accepted 25 February 2021
ABSTRACT
Context. Jets and outflows are associated with young stellar objects across the stellar mass spectrum, from brown dwarf protostars to
massive Ae/Be stars. Frequently the jet morphology is spatially discontinuous because of the temporal variability of the ejection from the driving source. Images covering a wide field of view around the jet-driving source are useful to map the large-scale jet emission and to explore the mass ejection history.
Aims. The aim of our work was to search for large-scale optical Herbig-Haro (HH) objects lying in a wide field around a sample of
IRAS sources, which are candidates to trace young stellar objects.
Methods. Deep narrowband images through the Hα and [SII] emission lines, and through an off-line continuum filter, covering a
wide (∼150) field around the IRAS targets were acquired. The images in the three filters were analyzed to identify shock-excited line
emission (i.e., HH) in contrast to scattered line emission.
Results. New images of a sample of 15 IRAS sources, obtained in a homogeneous way are presented. HH emission was detected in
six fields, and the astrometry of the knot features is given. The nature of the extended emission as scattered emission around nine of the IRAS targets is confirmed. For seven IRAS sources with unclear optical counterparts, a more plausible counterpart is proposed. A refined value of the source distance is reported for seven targets. An update of the main data available for each of the sampled fields, including images from public data archives, is also presented.
Key words. ISM: general – ISM: jets and outflows – stars: formation
1. Introduction
Protostellar jets and outflows are found everywhere in star-forming regions as fundamental events occurring during the star formation process. They are believed to regulate processes such as the removal of angular momentum excess from the star–disk system, and the dispersion of the parent cloud. They are observed in all evolutionary stages of young stellar objects (YSOs) where accretion is occurring, from Class 0 to Class III, and across the stellar mass spectrum, from brown dwarf protostars (Whelan et al. 2005;Riaz et al. 2017) to massive high-luminosity young stars (Guzmán et al. 2012), and are detected over a wide wavelength range through continuum emission and line emission from molecular, neutral, and ionized atomic transitions.
Herbig-Haro objects (HHs) are the optical manifestation of outflow events. They are small shock-excited nebulae visible in low excitation lines (e.g., [OI], Hα, [SII]) produced by the
radia-tive cooling in post-shock zones. Most HHs appear as a string of knots aligned in a highly collimated jet (HH jet) ending in a bright bow shock where the jet rams into the surrounding
?Based on observations obtained at the Centro Astronómico
Hispano-Alemán de Calar Alto (CAHA), Spain.
†Deceased on 2017 September 27.
medium. The spatial scales covered by the HH jets range from a few au, in the case of microjets of T Tauri stars (Agra-Amboage et al. 2011), to several parsecs (giant Herbig-Haro jets;Devine et al. 1999;Reipurth et al. 2019). The knots trace internal shocks driven by velocity ejection variability. Frequently, the jet mor-phology shows discontinuities in its spatial distribution, which is usually attributed to the temporal variability of the ejection mate-rial from the source (Raga et al. 1990). Because of this, images covering a wide field of view (FOV) around the suspected driv-ing source are essential to explore the mass ejection history. HH jets interact with the natal molecular cloud as they travel outward entraining ambient material and giving rise to large-scale molec-ular outflows (see, e.g., reviews fromFrank et al. 2014andBally 2016for a more complete picture of protostellar outflow theory and observations).
We carried out a project aimed at obtaining new deep opti-cal, narrowband ([SII] and Hα) images of a sample of IRAS
sources, which are candidates for tracing YSOs. A sample of 15 targets was selected to be imaged in a homogeneous way, cov-ering a wide FOV (∼150) around the IRAS counterpart, looking for shocked emission that could be associated with the target. In addition to the narrowband images, an image through an off-Hα filter was obtained to get the continuum emission, with the
aim of distinguishing between reflected and shocked emission in the neighborhood of each of the sources. Because of the properties of the sources selected, we expected to find HH jets with different evolutionary ages and spatial scales. Most of the fields were not previously imaged through narrowband filters, nor with a several arcmin wide FOV. Such a spatial coverage is useful to explore whether the HH jet shows discontinuities in its spatial emission, indicative of episodic mass ejections. It was expected that the sample likely included T Tauri and Her-big Ae/Be stars still actively accreting matter from circumstellar disks and driving small-scale jets, so that a product of the project would increase the sample of known low-mass (T Tauri) and intermediate-mass (Herbig Ae/Be) sources driving HH jets. In this work, in addition to the characterization of the optical emis-sion associated with the YSOs traced by the IRAS sources, we present updates to the observational data available from optical and near-IR data archives for the targets observed, and we report on new accurate astrometry of the jet knots and sources mapped in the observed fields.
The work is structured as follows: in Sect.2we present the criteria followed to select the sample to be observed; in Sect.3
we describe the observations and data reduction; in Sect.4 we present an updated description of the data available and the results obtained for each of the observed fields, and in Sect.5
we summarize the global results derived from our survey.
2. Sample selection criteria
The sample observed was extracted from the GLMP catalogues (García-Lario 1992; García-Lario et al. 1997) and the optical survey ofSuárez et al.(2006) of nearby IRAS sources. GLMP uses the [12] − [25] versus [25] − [60] color–color (CC) diagram to identify YSO candidates. Later onSuárez et al.(2006) con-firmed the YSO nature of several YSO candidates of the GLMP sample, based on the optical spectrum of their IRAS counterpart, their luminosity class, and their location in a star-forming region. We selected targets from the GLMP catalogues and theSuárez et al.(2006) survey that also showed optical emission in the DSS plates. As can be seen in Figs.1and2, all of the selected targets have infrared (IR) color indices characteristic of YSOs. Some of the targets are likely to be T Tauri or Herbig Ae/Be, which would be visible because they had already emerged from their native environment. Thus, they would still be actively accreting matter from circumstellar disks and could be driving small-scale jets (microjets). The resulting sample consists of 15 targets that were observable from the Calar Alto Observatory (CAHA) in an observing run during the winter period. Table1lists the sample of fields mapped.
According to the nature and morphology of the emission detected in this work (see Sect.4) and the data available in the literature the sample was separated into three groups, which are indicated in Table1and used in Figs.1and2. The first group (I) includes fields with extended pure-line emission, suggestive of being produced by shocked (jet) emission. The second group (II) includes IRAS targets associated with nebular reflected emis-sion. Finally, the third group (III) includes IRAS targets showing a point-like emission and for which no extended emission, shocked or reflected, was detected in the entire field mapped around the IRAS source. Each observed field is identified with the name of the central IRAS source (listed in Col. 1) on which the images were centered; its catalogue position is given in Cols. 2 and 3. The following columns list the most probable opti-cal counterpart assigned to the IRAS source in the available
-0,5 0 0,5 1 1,5 [25]-[60] 0,6 0,8 1 1,2 1,4 1,6 1,8 2 [12]-[25] 05426+0903 00044+6521 02236+7224 00087+5833 05393+2235 03220+3035 00422+6131 04073+3800 05380-0728 06471-0329 04239+2436 05302-0537 06249-1007 06562-0337 02181+6817
Fig. 1.Location of the IRAS sources observed in the ([12]–[25], [25]– [60]) color–color diagram. The blue lines indicate the region of young stellar objects, and the magenta lines that of ultra-compact HIIregions. Circles correspond to the driving jets of the sources, squares correspond to the sources with extended nebular emission, and triangles correspond to the point-like sources (see Table1).
0 1 2 3 4 H-K 0 1 2 3 4 J-H 05302-0537 05426+0903 00422+6131 05393+2235 06249-1007 02236+7224 02181+6817 03220+3035 06471-0329 05380-0728 04073+3800 06562-0337 04239+2436 00044+6521 00087+5833
Fig. 2.Location of the IRAS sources counterparts in the (J − H, H − K) color–color diagram. The blue lines indicate the T Tauri region, the purple lines the region of the Herbig Ae/Be stars, and the magenta lines that of Class I sources. The symbols are the same as in Fig.1.
literature. The classification of the counterpart (Class I, T Tauri, FU Ori, Herbig Ae/Be), and the membership of a cluster or extended nebular nature of the object is also indicated. The rest of the columns list the HH objects catalogued in the FOV; the star-forming region where the IRAS source is located, when known; and finally, the distance to the source. Some of the dis-tances have been updated in this work from Gaia data (Gaia Collaboration 2018), and from the improved method based on parallaxes of high-mass star-forming regions of Reid et al.
(2019)1.
As already mentioned, the observed targets have IR colors that are characteristic of YSOs. Figure 1 presents the IRAS ([12]–[25], [25]–[60]) CC diagram of the IRAS sources of the sample. The region of the plane where YSOs are located is
1 http://bessel.vlbi-astrometry.org/node/378,
Table 1. Observed sample.
α2000 δ2000 Distance
IRAS source (h m s) (◦ 0 00) Counterpart Classif.(a) Association(b) HH in FOV Location (pc) Ref.
I: Sources associated with jet emission
00087+5833 00 11 26.5 +58 49 50 LkHα 198 HAeBe · · · 161–164, 462 L1265 344 ± 17 1 02236+7224 02 28 16.4 +72 37 36 J02281661+7237328 TT RNO 7 (c) 488 L1340 861 ± 22 2 03220+3035 03 25 09.2 +30 46 21 L1448-IRS1 TT, b RNO 13 (n) 194–196 L1448 240 ± 12 1 04073+3800 04 10 41.2 +38 07 54 PP 13 TT/FUO, b PP 13 (n) 463–465 L1473 350 3 04239+2436 04 26 55.3 +24 43 34 · · · CI, b · · · 300 Taurus 129.0 ± 0.8 4 05380−0728 05 40 27.7 −07 27 28 Re 50N CI · · · 1121–1122 L1641 460 5
II: Sources with extended nebular emission
00044+6521 00 07 03.5 +65 38 41 PP 1, McC H12 HAeBe · · · Cepheus IV 845 ± 110 6
05302−0537 05 32 41.7 −05 35 48 J05324165−0535461 CI, b · · · Orion A 319 ± 12 2
05393+2235 05 42 21.3 +22 36 47 J05422123+2236471 FUO RNO 54 (n) · · · 1540 ± 106 2
06249−1007 06 27 18.1 −10 09 41 J06271812−1009387 TT HHL 43 (n) · · · 860 ± 70 7
06562−0337 06 58 44.4 −03 41 12 J06584435−0341099 HAeBe Iron-clad Nebula · · · 5650 ± 430 7
III: Point-like sources
00422+6131 00 45 09.9 +61 47 57 J00450982+61147574 TT · · · 2400+920
−520 2
02181+6817 02 22 22.6 +68 30 43 CO Cas HAeBe, v · · · 664 ± 25 2
05426+0903 05 45 22.4 +09 04 13 FU Ori FUO · · · 416 ± 9 2
06471−0329 06 49 40.4 −03 32 51 J06494021−0332523 CI · · · G216−2.5 2110 ± 21 1
Notes. (a)b: binary; CI: Class I; FUO: FU Ori; HAeBe: Herbig Ae/Be; TT: T Tauri; v: variable.(b)c: star cluster; n: extended nebular object.
References. (1) Zucker et al. (2020); (2) Gaia Collaboration (2018); (3) Cohen et al. (1983); (4) Galli et al. (2019); (5) Cohen (1990); (6)MacConnell(1968); (7) see text.
delimited by the blue lines (Palla 1990), and the region delimited by the magenta lines corresponds to the location of ultra-compact HIIregions (Wood & Churchwell 1989), probably also associated with YSOs. Figure2presents the (J − H, H − K) CC diagram of the assigned near-IR IRAS counterpart, when known. The J, H, K magnitudes are taken from the 2MASS catalogue2.
The region of the plane delimited by the blue square corre-sponds to the location of T Tauri stars (Meyer et al. 1997), the purple lines delimits the region of Herbig Ae/Be (Manoj et al. 2006), and the magenta lines delimits the region of the luminous Class I protostars (Lada & Adams 1992).
3. Observations and data reduction
Observations were carried out on November 2016 with the 2.2 m telescope in the Calar Alto Observatory (CAHA) using the Calar Alto Faint Object Spectrograph (CAFOS) in direct imag-ing mode. The instrument was equipped with a 2048 × 2048 CCD, giving a spatial scale of 0.0053 pixel−1 and a field of view of 160. Three narrowband filters were used: the line filters of Hα (central wavelength λ = 6569 Å, bandpass ∆λ = 50 Å), and [SII]
(λ = 6744 Å, ∆λ = 97 Å), which included the emission from the [SII] λ = 6717, 6731 Å lines, and an off-Hα filter (λ = 6607 Å,
∆λ = 43 Å) to look for the continuum emission near the Hα and [SII] lines. Conditions were not photometric and the seeing
values varied from 1.005 up to ∼300during the observing run.
2 This publication makes use of data products from the Two Micron
All Sky Survey, which is a joint project of the University of Mas-sachusetts and the Infrared Processing and Analysis Center/California Institute of Technology, funded by the National Aeronautics and Space Administration and the National Science Foundation.
Fourteen fields of our survey were mapped homogeneously in three narrowband filters, the Hα and [SII] lines and an off-line
nearby continuum filter. One of the targets (IRAS 05302−0535) was only imaged through the [SII] filter due to problems
dur-ing the runs. The images include a total of 18 IRAS sources. Three fields (centered on IRAS 02236+7224, 03220+3035, and 05380−0728) included a second IRAS source. We obtained images in Hα and [SII] of 1 h of total integration time by
combining three frames of 1200 s exposure each, and an addi-tional continuum image of 1200 s integration after combining two frames of 600 s exposure.
All the images were processed with the standard tasks of the IRAF3 reduction package, which includes bias subtraction
and flatfielding corrections, using sky flats. In order to correct for the misalignment between individual exposures, the frames were recentered using the reference positions of field stars well distributed around the source. Astrometric calibration of the images was performed in order to compare the optical emis-sion with the positions of the objects reported in the field and, in particular, with the nominal position of the IRAS sources. The images were registered using the (α, δ) coordinates from the USNO Catalogue4 of ten field stars well distributed in the
observed field. The rms of the transformation was 0.002 in both coordinates.
3 IRAF is distributed by the National Optical Astronomy
Observato-ries, which are operated by the Association of Universities for Research in Astronomy, Inc., under cooperative agreement with the National Science Foundation.
4 The USNOFS Image and Catalogue Archive is operated by the
4. Results
In the following we present the study carried out for each field, following the classification of the sample in the three groups listed in Table1. The structure of each mapped field is as follows. First, we include a summary updating the relevant information reported in the literature. Next, we detail the new results found from our survey: (i) wide-field image in the narrowband, off-line continuum filter, with the IRAS source and other YSOs poten-tially related to the source indicated; (ii) close-ups of selected regions obtained from the images acquired through the Hα and [SII] line filters, with sub-images allowing us to visualize and characterize the structure of the extended emission around the IRAS source; (iii) close-ups of some targets from images retrieved from public data archives, with the aim of comparing the emission in other wavelengths with the emission detected in our observations; (iv) a table with the detailed astrometry of the shocked emission, if detected; and (v) a new identification of the IRAS counterpart in some cases, based on updated catalogue information and in a more accurate astrometry obtained from our images.
4.1. Group I: sources associated with jet emission 4.1.1. IRAS 00087+5833
IRAS 00087+5833 is located in the dark cloud L1265, in Cas-siopeia, at a distance of 344 ± 17 pc (Zucker et al. 2020). In the following we present a short description of the field around the source.
Young stellar objects. They are plotted in Fig. 3, a Hubble Space Telescope (HST) image (HST Legacy Archive. PI K. Stapelfeldt. Program ID: 8216. Cycle 8). Their positions are given in Table2:
V376 Cas: Located north of IRAS. Classified as a Herbig Ae/Be star (Lagage et al. 1993);
LkHα 198 (also known as V 633 Cas): Located south of IRAS. Classified as a Herbig Ae/Be star (Aspin & Reipurth 2000), and a spectroscopic binary (Smith et al. 2005);
LkHα 198-IR: Located 600 north of LkHα 198. Classified as a deeply embedded object. Has counterparts at 10 µm (Lagage et al. 1993) and 1.3 mm (Boissier et al. 2011);
LkHα 198-mm: Located ∼1900 northwest of LkHα 198. Classi-fied as a deeply embedded object, with neither visible nor IR emission detected. Has counterparts at 1.3 mm (Henning et al. 1998) and 3 mm (Boissier et al. 2011).
Proposed counterpart of IRAS. LkHα 198, but it is offset ∼2000from the IRAS position, outside the IRAS error ellipse, as are all the other YSOs.
Molecular outflows. Several CO outflows, observed with low (Cantó et al. 1984) and high angular resolution (Matthews et al. 2007), including the following:
– outflow with lobes east and west of LkHα 198, with signs of precession (Smith et al. 2005) (LkHα 198 is a binary system);
– outflow in the north–south direction, centered on LkHα 198-mm (Smith et al. 2005).
Optical outflows/Herbig-Haro objects. Several knots in [SII] near YSOs (Strom et al. 1986;Goodrich 1993;Corcoran et al. 1995;Aspin & Reipurth 2000).
15 "
mm
V376
IR
00087+5833
Fig. 3. IRAS 00087+5833: HST WFPC2 image in the F814W filter of the field around the IRAS source. The optical, near-IR, and millimeter sources reported in the field, and the IRAS position with the error ellipse are plotted. The coordinates of these objects are given in Table2. All figures are oriented north up and east left.
Table 2. Young stellar objects around IRAS 00087+5833. Position α2000 δ2000 Source (h m s) (◦ 0 00) Ref. V376 00 11 26.7 +58 50 04 1 00087+5833 00 11 26.5 +58 49 50 2 198-mm 00 11 24.3 +58 49 42 3 198-IR 00 11 26.1 +58 49 35 1 198 00 11 25.7 +58 49 28 4 HH 161A 00 11 27.4 +58 49 26 5 HH 461 00 11 30.6 +58 48 16 4, 5
References. (1)Lagage et al.(1993); (2) IRAS PSC; (3)Sandelll & Weintraub(1994); (4)Aspin & Reipurth(2000); (5) this work. Identification of knots (Reipurth et al. 2000):
A and B: correspond to HH 161, driven by LkHα 198-IR (Corcoran et al. 1995);
C, D, E, and F: correspond to HH 164, driven by LkHα 198 (Corcoran et al. 1995);
G, H, I, and J: correspond to HH 162.
HH 461: a new HH, located ∼8200 southeast of LkHα 198, thought to be a distant bow shock of HH 164 (Aspin & Reipurth 2000).
HHs 800–802: likely an extension of the LkHα 198 parsec-scale outflow (McGroarty et al. 2004). They are outside the FOV of our images.
Figure4displays the field around IRAS 00087+5833 mapped through the continuum filter in our survey. We did not detect any new extended line emission in Hα nor in [SII] in the field
mapped. The YSOs around the IRAS source, indicated in the fig-ure, all lie outside the IRAS position error ellipse. This discards the hypothesis that any of these YSOs could be the counterpart of IRAS 00087+5833. Figure5shows a close-up of the Hα and [SII] images showing the extended emission associated with the
YSOs. We detected line emission from the HH knots HH 161A and HH 461. We did not find any evidence of the emission being related to the IRAS source. Regarding HH 461, the emission of
00087+5833 IR 198 mm V376 2’
Fig. 4. IRAS 00087+5833: CAHA image of the field in the continuum filter. 30" A 461 A 461 30" A 461 A 461
Fig. 5. IRAS 00087+5833: close-up of the CAHA images in the Hα (left) and [SII] (right) filters. The YSOs are indicated as in Fig.4. The knots HH 161A and HH 461 are enclosed in boxes.
the knot is stronger in Hα than in [SII], which is a characteristic
of the emission from bow shocks. This confirms the nature of HH 461 as a bow shock previously proposed by Aspin & Reipurth
(2000), based only on geometrical arguments. 4.1.2. IRAS 02236+7224
IRAS 02236+7224 is located in the dark cloud L1340, at a dis-tance of 861 ± 22 pc (Gaia Collaboration 2018). In the following we present a short description of the field around the source.
Other IRAS sources in the field. IRAS 02238+7222, in the southern part of the field, with colors that do not correspond to a YSO. Does not seem related to the HHs of the field.
Young stellar objects. The RNO 7 cluster of YSOs, with several low- and intermediate-mass YSOs surrounded by nebular emission.
Table 3. Emission line features in the IRAS 02236+7224 field Position
α2000 δ2000 Other id. Near-IR
Knot(1) (h m s) (◦ 0 00) (2) (3) MHO(4) HH 671 A 02 28 15.65 +72 37 45.3 A 1 2932 B 02 28 09.03 +72 36 28.9 B 2 2930 RNO7 H 02 28 20.32 +72 37 41.6 · · · 2932B I 02 28 00.4 +72 35 56 · · · 3 2928D HH 672 A 02 28 53.2 +72 36 13 · · · 5 2936 HH 488 J1-2 02 27 59.63 +72 35 57.7 J1-2 · · · 2928B,C A 02 28 22.53 +72 34 55.5 A 4a 2928G b 02 28 30.01 +72 34 36.6 B 4b 2928J B 02 28 35.52 +72 34 31.5 · · · 2928K D 02 28 38.56 +72 34 28.9 E 4d 2928L C 02 28 41.98 +72 34 18.3 C 4c 2928M E 02 28 52.98 +72 34 12.5 · · · 2928N F 02 28 56.40 +72 34 03.6 · · · 2928O G 02 29 06.51 +72 34 08.1 · · · 2928P
References. (1) This work (see Figs. 7, 8, and 9); (2) Reipurth et al.(2000);Nanda Kumar et al.(2002); (3)Magakian et al.(2003); (4)Walawender et al.(2016)
Proposed counterpart of IRAS 02236+7224. A low-mass, Hα-emission star (Kun et al. 2016a).
Optical outflows/Herbig-Haro objects.
Near IRAS 02236+7224: Jet in Hα and [SII] emerging south-ward from IRAS (Nanda Kumar et al. 2002). Knots of the jet (Magakian et al. 2003):
HH 671 A and B: most probably associated with the cluster, but not clearly related to IRAS;
Knot 3: located ∼10southwest of HH 671B, close to a bright Hα emission star;
Knot 5: HH 672 in the Reipurth et al. (2000) catalogue, located ∼30southwest of IRAS.
HH 488: Chain of emission knots, in the east–west direction, south of IRAS 02238+7222, observed in [SII]:
– exciting source not established to date;
– different nomenclatures of the knots, as reported byNanda Kumar et al. (2002), Magakian et al. (2003), and in the
Reipurth et al.(2000) catalogue (see Table3for the cross-identifications based on the astrometry of the present work); – IR counterparts of HH 488 and J optical knots and new knots HH 488E to G without optical counterpart from Spitzer images (Kun et al. 2016b).
Near-IR counterparts (H2 2.12 µm line) catalogued by
Walawender et al.(2016) as molecular hydrogen emission-line objects (MHOs) (see Table3).
Figure 6 displays the image of the field around IRAS 02236+7224 mapped through the continuum filter. The RNO 7 cluster can be seen at the center of the image, and the location of the two IRAS sources are also indicated.
Our narrowband images allowed us to identify the optical knots HH 671A and B, the chain of knots HH 488A to D, the J
RNO 7
2’
02236+7224
02238+7222
Fig. 6. IRAS 02236+7224: CAHA image of the field in the off-line filter. Another IRAS source (IRAS 02238+7222) lies inside the field mapped. I B H 30" RNO 7 A I B H 30" RNO 7 A
Fig. 7. IRAS 02236+7224: close-up of the CAHA images through the Hα (left) and [SII] (right) filters, showing the field around the RNO 7 cluster where the IRAS source is located. The position of the IRAS source and its error ellipse are indicated. The knots are enclosed in boxes.
complex northwest of IRAS 02238+7222, and the HH 672 knot, ∼30 southeast of IRAS02236+7224. In addition, we detected a new knot ∼2000west of HH 671A, labeled H in our images, which corresponds to the optical counterpart of MHO 2932B.
Figure7shows a close-up of the field around the RNO 7 clus-ter of our Hα and [SII] images. HH 671A and B are detected in
both lines, while knot H is only detected in Hα, and knot I only in [SII]. Based on geometrical arguments, it is not clear whether all these knots form part of a single stellar jet powered by IRAS 02236+7224. Most probably HH 671A and knot H are tracing shocked emission produced by the stellar wind ejected from any of the YSOs of the cluster, at some places of the nebulosity surrounding the cluster.
Figure8 shows a close-up of the Hα and [SII] images of
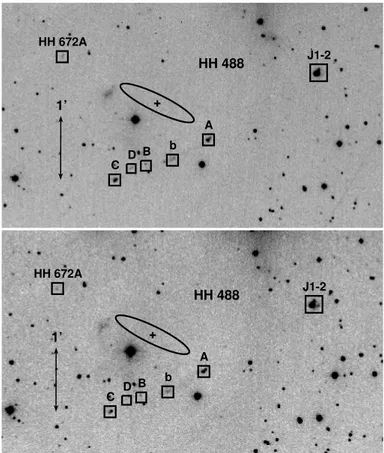
the southern part of the field around IRAS 02238+7222. They show the HH 672A knot, northwest of IRAS 02238+7222, the curved string of emission features lying from west to east, south of the IRAS source (HH 488), and the feature ∼20northwest of HH 488A labeled J1-2 in Fig.8.
HH 672A D B HH 488 1’ J1-2 A b C HH 672A D B HH 488 1’ J1-2 A b C
Fig. 8. HH 488: close-up of the CAHA images in the Hα (top) and [SII] (bottom) filters of the chain of knots of HH 488, close to IRAS 02238+7222. The emission features identified are enclosed in boxes.
b 30" 02236+7224 02238+7222 G F E C D B A J-S
Fig. 9. IRAS 02236+7224: Two-color image composed from Spitzer IRAC 5.8 µm (red) and 3.6 µm (green) images with a FOV including the two IRAS sources and the HH 488 jet.
Regarding the cross-identification of the optical and near-IR knots of HH 488, and the J complex, we show in Fig.9the color-composed image from the Spitzer archive, where these knots have been labeled as shown in the first column of Table3.
We made accurate astrometry of all the knots detected in our images, necessary to determine the positions of the jet knots and the relationship between the optical and near-IR knot emissions in a consistent way, including the MHOs features reported by
2’
03222+3034
03220+3035
Fig. 10. IRAS 03220+3035: CAHA image in the continuum filter of the field. Another IRAS source (IRAS 03222+3034) lies inside the field mapped. The positions and error ellipses of the IRAS sources are indicated.
Walawender et al.(2016). Table3lists the positions for all the HHs knots mentioned here. Since we found discrepancies in the identifications of several knots of the field, the table lists the knots identification ofNanda Kumar et al.(2002) andMagakian et al.(2003), and the identification in theReipurth et al.(2000) catalogue. The table also lists the H2MHO counterpart of each knot (Walawender et al. 2016).
4.1.3. IRAS 03220+3035
IRAS 03220+3035 is located in L1448, in the Perseus cloud complex, at a distance of 240 ± 12 pc (Zucker et al. 2020). In the following, we present a short description of the field around the source.
Proposed association of IRAS with other objects. RNO 13: red reflection nebula (Cohen 1980);
L1448 IRS1: IR source (Hodapp 1994). Other IRAS in the region.
IRAS 03222+3034, southeast of IRAS 03220+3035. – associated with L1448 IRS2;
– very embedded, with no optical nor near-IR counterpart; – classified as a Class 0 protostar, from far-IR and
submil-limeter data (O’Linger et al. 1999).
IRAS 03225+3034 IRS3, associated with YSOs (Anglada et al. 1989), but outside the field mapped.
Binarity. L1448 IRS1 is a close (1.0037) binary system (L band images of Connelley et al. 2008). Characteristics of each component from near-IR spectroscopy (Connelley & Greene 2010):
– northern component: line emission characteristic of a cavity or a young stellar jet very close to the exciting source; – southern component: line emission compatible with a weak
T Tauri star, thus in an older evolutionary stage than the northern component. 1’ 03220+3035 HH 196 HH 195 HH 194 1’ 196D B C A F E A D C B D C B A D D C B A
Fig. 11. IRAS 03220+3035: Close-up of the CAHA image through the Hα filter (top) and [SII] filter (bottom), showing the field around the IRAS source. The HH objects detected (194, 195, 196) are identi-fied (top), and the knots listed in Table4are labeled, enclosed in boxes (bottom).
Molecular outflows. Low-velocity CO outflow, with blue-shifted emission east of the source (Levreault 1988).
Optical outflows/Herbig-Haro objects. HH 194: Hα+[SII] emission (Bally et al. 1997);
HH 195, HH 196: Hα+[SII] (Bally et al. 1997) and H2υ =1–0 S(1) emission (Eislöffel 2000).
Figure10shows the wide field mapped in the continuum fil-ter. The location of the IRAS sources included in the field are indicated. Figure11is a close-up of the field mapped through the Hα and [SII] narrowband filters. The images show the
loca-tion of HH 194, HH 195, and HH 196 (Hα image), and the knots identified in our [SII] image, which are labeled beginning with
A, the knot closest to the proposed driving source.
None of these HH objects is aligned with IRAS 03222+3034 (our target), so there is no clear geometric argument to asso-ciate the driving source of any of the HH objects with the IRAS source.
We now discuss each HH object in more detail.
HH 194. Its knots are aligned along the northern edge of the east–west CO outflow (Levreault 1988), most probably powered by the IRAS source. Thus, HH 194 can be tracing the cavity wall of the CO outflow and is probably driven by IRAS 03222+3034. We identified four knots (labeled A to D in the [SII] image).
Three knots, A, B, and C, are nearly aligned in the east–west direction, have a bow-shaped morphology with the apex point-ing northward, and are brighter in Hα than in [SII]. In addition,
there is an arc-like diffuse emission beyond knot C, ending ∼10 northwest of HH 194C in a compact knot, D, brighter in [SII]
Table 4. HH knot positions of the IRAS 03220+3035 field. Position α2000 δ2000 Knot (h m s) (◦ 0 00) HH 194 A 03 24 58.0 +30 47 41 B 03 24 56.9 +30 47 41 C 03 24 55.9 +30 47 41 D 03 24 51.0 +30 48 20 HH 195 A 03 25 14.4 +30 48 49 B 03 25 15.1 +30 46 51 C 03 25 14.7 +30 46 58 D 03 25 14.0 +30 47 00 E 03 25 13.2 +30 47 16 F 03 25 11.7 +30 47 37 HH 196 A1 03 25 14.7 +30 49 05 A2 03 25 14.6 +30 49 07 A3 03 25 14.4 +30 49 10 B1 03 25 13.2 +30 49 15 B2 03 25 12.9 +30 49 20 B3 03 25 12.7 +30 49 24 C 03 25 13.0 +30 49 36 D 03 25 25.8 +30 46 56
HH 195. Consists of a V-shaped string of knots located ∼10 northeast of IRAS 03220+3035, pointing toward IRAS 03222+3034 (see Fig.11). It coincides with the northern knots of the H2υ =1–0 S(1) outflow centered on IRAS 03222+3034 (Eislöffel 2000). Thus, IRAS 03222+3034 is most probably the driving source of HH 195. The HH 195 knots are brighter in [SII]
than in Hα.
HH 196. Consists of an arc-shaped string of knots ∼30 north-east of IRAS 03220+3035, with the apex oriented toward IRAS 03225+3034, outside the FOV of our images, which has been proposed as the driving source of the outflow (Bally et al. 1997). Our images also show HH 196D, ∼3.02 southeast of HH 196A, in the direction of its apex, identified as a part of the same opti-cal outflow (Bally et al. 1997), and also reported in the near-IR (Eislöffel 2000). Our images show that both HH 196A and B could be resolved into several compact substructures engulfed in nebular emission. We labeled these knotty substructures by adding a number to the letter identifying the knot.
Astrometry of the HHs 194, 195, and 196 knots, including the newly identified substructures, is given in Table4.
4.1.4. IRAS 04073+3800
IRAS 04073+3800 is located in the dark cloud L1473 in the Perseus complex, at a distance of ∼350 pc (Cohen et al. 1983). In the following we present a short description of the field around the source.
Proposed association of IRAS with other objects. PP 13, an optical red nebula with a position closely matching that of IRAS (Parsamian & Petrossian 1979).
04073+3800
1’
PP 13
Fig. 12.IRAS 04073+3800: CAHA image through the continuum filter. The IRAS source position and its error ellipse are shown. The positions of the reflection nebulae PP 13N and S are shown as a white cross (×).
Young stellar objects. The PP 13 nebula consists of two pre-main-sequence stars, classified from optical, near-IR, and submillimeter data (Aspin & Sandell 2001):
PP 13N, a T Tauri star;
PP 13S, a variable FU Ori star, also detected at 2.2 µm (Connelley et al. 2007).
Optical outflows/Herbig-Haro objects. Three chains of HH objects around IRAS 04073+3800 (Aspin & Reipurth 2000), also detected at 2.2 µm (Connelley et al. 2007):
HH 463: a cometary-like emission ∼1000 long, arising from PP 13S southwestward, with five [SII] knots (A to E), plus
a compact isolated [SII] emission at ∼10 in the direction of the jet axis;
HH 464: a chain of five knots (A to E) along a curved path in the north–south direction, beginning east of PP 13S and pointing toward the PP 13N tail;
HH 465: an isolated knot north of PP 13N;
HH 464 and HH 465 form a bipolar jet driven by PP 13N (Aspin & Reipurth 2000).
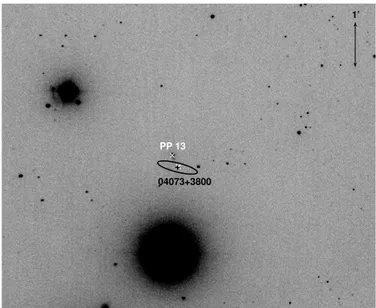
Figure 12 displays the image of the IRAS 04073+3800 mapped through the continuum filter, where the location of the red nebulae and the IRAS source are indicated. As can be seen in the figure, PP 13S is most probably the counterpart of IRAS 04073+3800 because their positions are nearly coincident, while PP 13N does not seem to be related to the IRAS source because it lies outside its error ellipse.
A close-up of the field through the Hα and [SII] line filters
is shown in Fig.13. The three HH jets (HH 463, 464, 465) are identified in the Hα image. Several knots have been identified in the jets and are labeled in the [SII] image according to previous
[SII] observations ofAspin & Reipurth(2000). The astrometry
of the knots of the [SII] image is given in Table5. As can be seen
in Fig.13, most of the knots are brighter in [SII] than in Hα. The
exceptions are knot A of HH 464, the knot closest to the excit-ing source, and the line emission features X1/2 and Y associated with HH 463, which are brighter in Hα than in [SII]. In the case
of HH 463X1/2 and Y, their position far away from the exciting source and their disordered morphology suggest that they may be tracing bow shocks from older mass-ejection episodes.
20" HH 465 HH 464 HH 463 A F E D C B A Y X1/2 A - E 20"
Fig. 13. IRAS 04073+3800: Close-up of the CAHA image through the Hα filter (top) and [SII] filter (bottom), showing the field around the IRAS source. The HH objects detected (463, 464, 465) are identified (top), and the knots listed in Table 5are labeled (bottom). The posi-tions of the two red nebulous objects (PP 13N and S) are indicated as in Fig.12.
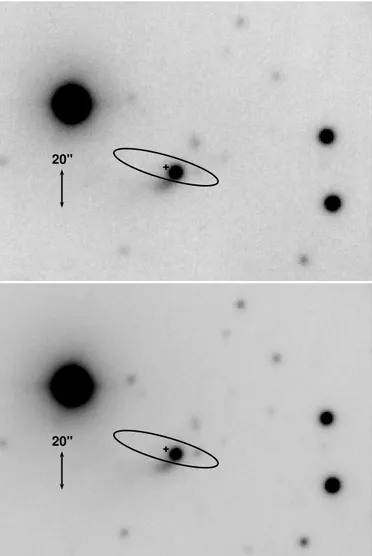
The field close to IRAS 04073+3800 was imaged by the HST with the WPC2 camera through the F814W filter (PI D. Padgett. Program ID 9160. Cycle 10) and with the NIC2 camera through the filter F110W, F160W, and F205W (PI D. Padgett. Program ID 10603. Cycle 14). Figure14shows a close-up of the F814W image.
We identified three knotty structures (N1, N2, N3) south of PP 13N at a PA ' 25◦, and another three knots (S1, S2, S3) south of PP 13S at a PA ' 35◦. The astrometry of these knots, derived from the HST image, is given in Table6. The S knots are part of the HH 463 jet. Given their positions, we could identify S1 with HH 463A, while S2 and S3 correspond to HH 463B, resolved in different substructures because of the better resolution of the HST image.
Regarding the N knots, they are well aligned with HH 465A (PA ' 20◦), so they could be part of the jet–counterjet system
15’’ 04073+3800 S3 S2 S1 N3 N2 N1 PP 13N PP 13S
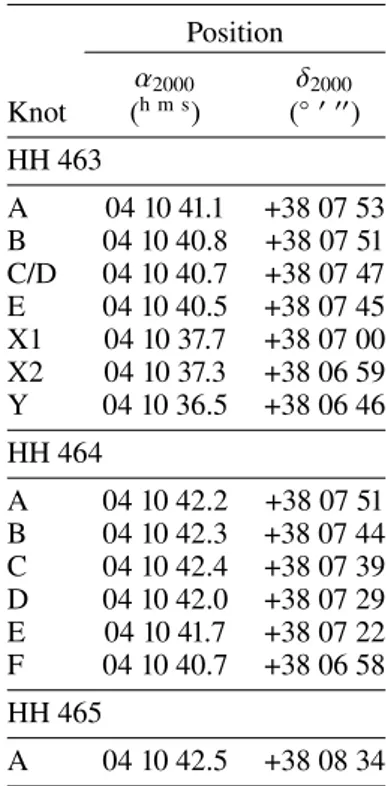
Fig. 14. IRAS 04073+3800: HST image of the field. The position of the IRAS source and its error ellipse are shown. The positions of the reflection nebulae PP 13N and S are shown as a white cross (×). Table 5. HH objects in the IRAS 04073+3800 field.
Position α2000 δ2000 Knot (h m s) (◦ 0 00) HH 463 A 04 10 41.1 +38 07 53 B 04 10 40.8 +38 07 51 C/D 04 10 40.7 +38 07 47 E 04 10 40.5 +38 07 45 X1 04 10 37.7 +38 07 00 X2 04 10 37.3 +38 06 59 Y 04 10 36.5 +38 06 46 HH 464 A 04 10 42.2 +38 07 51 B 04 10 42.3 +38 07 44 C 04 10 42.4 +38 07 39 D 04 10 42.0 +38 07 29 E 04 10 41.7 +38 07 22 F 04 10 40.7 +38 06 58 HH 465 A 04 10 42.5 +38 08 34
Table 6. HST knots in the IRAS 04073+3800 field. Position α2000 δ2000 Knot (h m s) (◦ 0 00) Identif. N1 04 10 41.69 +38 08 06.7 N2 04 10 41.63 +38 08 05.4 N3 04 10 41.57 +38 08 04.1 S1 04 10 41.02 +38 07 53.2 HH 463A S2 04 10 40.92 +38 07 51.4 HH 463B S3 04 10 40.83 +38 07 50.3 HH 463B
2’ 04239+2436
Fig. 15.IRAS 04239+2436: CAHA image through the continuum filter. The IRAS source position and error ellipse are shown.
powered by PP 13N. However, they are also aligned with the S knots of the HH 463 jet, which shows a curved morphol-ogy at large scales. Thus, they could also trace the counterjet of HH 463, projected onto the PP 13N nebula.
4.1.5. IRAS 04239+2436
IRAS 04239+2436 is located in the B18 cloud of Taurus, at a distance of 129.0 ± 0.8 pc (Galli et al. 2019). In the following we present a short description of the field around the source.
Classification. Low-luminosity Class I protostar, from its near-IR spectrum (Greene & Lada 1996).
Binarity. Close binary (separation 0.003, 42 au in projection) (Reipurth 2000).
Molecular outflows. CO outflow driven by IRAS (
Moriarty-Schieven et al. 1992).
Optical outflows/Herbig-Haro objects. Giant HH bipolar outflow HH 300 (Reipurth et al. 1997), driven by IRAS. HH 300A, B, and C: redshifted, bright Hα+[SII] knots with a
bow shock morphology, ∼300southwest of IRAS;
HH 300D: blueshifted, compact and fainter knot, ∼3000 north-east of IRAS.
Near-IR emission.
– cometary nebula surrounding the system (HST (NICMOS F160W and F205W;Reipurth 2000);
– Jet emission in [FeII] collimated and bipolar (Davis et al. 2011), with axis coincident with the optical HH 300A–C knots axis (Reipurth 2000);
– Jet emission in H2collimated and bipolar (Davis et al. 2011); – Jet emission in Brγ isotropical (Davis et al. 2011).
The field of our images centered on IRAS 04239+2436 did not include the bright redshifted HH 300A, B, and C knots. Figure15shows the field imaged in the continuum filter with the
30’’ D1 D0 D DW 30’’ D0 DE
Fig. 16. IRAS 04239+2436: Close-up of the CAHA image through the Hα filter (top) and through the [SII] filter (bottom).
Table 7. HH 300 knots in the IRAS 04239+2626 field. Position HH 300 α2000 δ2000 Knot (h m s) (◦ 0 00) D1 04 26 53.4 +24 43 12 D 04 26 59.2 +24 43 59 DE 04 26 59.1 +24 43 58 DW 04 26 58.6 +24 43 59 D0 04 26 57.9 +24 43 42
location of the IRAS source. Figure16shows a close-up of the field surrounding IRAS 04239+2436 through the Hα and [SII]
line filters. As can be seen in the figure, we detected emission in the two lines from two knots of the blueshifted HH 300 jet. In the Hα+[SII] image ofReipurth et al.(1997) HH 300D shows a
con-ical shape, reminiscent of a bow shock. Our images revealed that the morphology of knot D changes from Hα to [SII]. In the Hα line, knot D shows the bow shock shape reported above, while in the [SII] line knot D appears split in two (labeled DE and
DW in our [SII] image): knot DE coincides with the apex of the
Hα emission of knot D; and knot DW coincides with the north-ern tip of knot D. A new knot, D0, ∼1500northeast of the IRAS position was found in the two lines. Finally, we found knotty, faint Hα emission without a [SII] counterpart ∼5500 southwest of the IRAS position (labeled D1) most probably correspond-ing to the redshifted jet component. We performed astrometry on the knots from our images, and their positions are given in Table7.
2’
Re50 N
Re50 S
05380-0728 05377-0729
Fig. 17. IRAS 05380−0728: CAHA image through the continuum filter. The IRAS source position and error ellipse are shown. The positions of the other IRASsource and the red nebulous objects in the field are also shown.
4.1.6. IRAS 05380−0728
IRAS 05380−0728 is located in the southern region of the L1641 molecular cloud, at a distance of 460 pc (Cohen 1990). In the following we present a short description of the field around the source.
Luminosity. One of the most luminous objects of the cloud. Estimated total luminosity of 250 L (Reipurth & Bally 1986).
Association of IRAS with other objects. IRS1, on the west-ern edge of the reflection nebula Re50N, a very red point-like source (Casali 1991):
– detected in the near-IR (J, H, K, L bands); – coinciding with the IRAS position.
Reflection nebulae. Re50S and Re50N (Reipurth 1985): – associated with YSOs;
– extended emission;
– variability: from 2006 to 2014 Re50N increased its bright-ness, while Re50S faded significantly, probably caused by dusty material orbiting the sources (Chiang et al. 2015). Optical outflows/Herbig-Haro objects.
SMZ9-4, -5, and -6: a large-scale strand of knots and filaments in the H2 line at 2.12 µm (Stanke et al. 2000). Driven by a different source, IRAS 05380-0731;
HH 65: faint single knot in [SII] (Reipurth & Graham 1988),
located at the red lobe of a bipolar CO outflow. It is the optical counterpart of SMZ9-6;
HH 1121: a knotty chain north of the Re50S nebulosity (Chiang et al. 2015);
HH 1122: two faint knots ∼10southwest of Re50S (Chiang et al.
2015).
Figure 17 displays the field centered on IRAS 05380−0728 imaged through the continuum filter. Another IRAS source,
1’ 1122 65 1121 1’ 1122 65
Fig. 18. IRAS 05380−0728: Close-up of the CAHA image through the Hα (top) and [SII] (bottom) filters. The positions of the red nebulous objects are shown as a white cross (×), and that of the IRAS sources as a red plus sign (+). Black rectangles give the locations of the emission line features reported in the field.
IRAS 05380-0729, also appears in the image. IRAS 05380−0728 is located at the tip of Re50N. In our image Re50N and Re50S appear with similar brightness. Re50N is S-shaped, while Re50S is shaped like an arrowhead. The same morphology is found in the Hα and [SII] filter images (Fig.18).
Regarding the variability of Re50N and Re50S, both nebu-losities keep the same shape as observed in the [SII] image of 2014 (Chiang et al. 2015). However, in our [SII] image (Fig.18)
Re50N and Re50S have a similar brightness, and Re50S is not dimmer than Re50N as reported in 2014 (Chiang et al. 2015). Concerning the HH objects in the region, we detected HH 65 in the Hα and [SII] images. We found a slightly different
morphol-ogy in Hα and [SII]: the knot is more compact and brighter in
[SII] than in Hα. HH 1121 was only detected in the [SII] image. In contrast, HH 1122 was detected in both emission lines, being brighter in Hα than in [SII]. We did not detect any additional emission line features in our deep narrowband images of this region.
00044+6521
2’
Fig. 19. IRAS 00044+6521: CAHA image through the continuum filter. The IRAS source position and error ellipse are shown.
4.2. Group II: Sources associated with extended nebular emission
4.2.1. IRAS 00044+6521
IRAS 00044+6521 belongs to the Cepheus IV association, at a distance of 845 ± 110 pc (MacConnell 1968). In the following we present a short description of the source.
Proposed IRAS counterpart.
– appears as a Herbig Ae/Be of the Herbig & Bell (1988) catalogue as HBC 1;
– also known as the emission star MacC H12 (MacConnell 1968), with Hα line emission (Cohen & Kuhi 1976); – included in the Herbig Ae/Be survey ofThé et al.(1994), and
classified with a spectral type of around F4 (Hernández et al. 2004);
– broadband (R, I, J, H, K, L) images (Origlia et al. 1990) show a red stellar component and a nebula, consistent with a T Tauri star with an accretion disk and a cold dust envelope; – position offset ∼500from the IRAS position.
Figure19shows the image of the field around IRAS 00044+6521 through the continuum filter, and Fig. 20 shows close-ups of the Hα and [SII] lines filter images. As can be seen in the
fig-ures the target shows a compact emission inside the position error ellipse of IRAS 00044+6521, plus a cometary tail ∼1000 in length extending southeastward. The extended emission has the same shape in continuum and line emission, thus confirm-ing that the origin of the emission is most probably scattered light, and not shock excitation from a stellar microjet. We mea-sured an offset of 6.005 between the nominal position of the IRAS source and the 2MASS source J00070260+6538381; the 2MASS source coincides with the photocenter of the compact optical counterpart.
Figure 21 shows a close-up of the field around IRAS 00044+6521 from the HST ACS/WFC image through the F814W filter, extracted from the HST Legacy Archive (PI Sahai. Pro-gram ID: 10536). The extended emission can be seen in more
20"
20"
Fig. 20.IRAS 00044+6521: Close-up of the CAHA images through the Hα (top) and [SII] (bottom) filters.
5" 00044+6521
Fig. 21.IRAS 00044+6521: HST ACS/WFC image through the F814W filter of the field around the IRAS source. The white plus sign (+) gives the position of the 2MASS source J00070260+6538381. The IRAS position and its error ellipse are also shown.
detail, showing an arc-shaped morphology, with its center toward the IRAS position. The proposed optical–near-IR counterpart of IRAS lies at the northwest tip of the nebulosity.
2 ’ 05302-0537
Fig. 22.IRAS 05302−0537: CAHA image in the narrowband [SII] fil-ter. The IRAS source position and error ellipse are shown in black. Haro 4-145 is shown as a white plus sign (+). The IR source Vision J5324165−0535461 (Meingast et al. 2016) is shown as a red plus sign, nearly overlapping the IRAS source (black plus sign).
4.2.2. IRAS 05302−0537
IRAS 05302−0537 is located at the southern part of Orion A, at a distance of 319 ± 17 pc (Gaia Collaboration 2018). In the following we present a short description of the field around the source.
First proposed counterpart of IRAS. Haro 4-145, a Hα emission star (Parsamian & Chavira 1982).
Present proposed counterpart of IRAS.
K-band reflection nebula: point-like counterpart with a dif-fuse nebula extending northward from the near-IR source (Connelley et al. 2007).
J05324165-0535461: near-IR source (Orion A VISTA cata-logue; Meingast et al. 2016), with position coincident with IRAS. Source slightly elongated in the northeast–southwest direction (consistent with its binary nature; see below), sur-rounded by diffuse arc-shaped emission extending from north-west to southeast of the compact source.
Binarity. Binary system with an angular separation of 0.0065 (L-band images;Connelley et al. 2008).
Tracers of YSOs.
– bipolar CO outflow (Orion A-west;Fukui et al. 1986); – high-density ammonia clump centered on IRAS (Harju et al.
1993).
Due to weather conditions, only the narrowband [SII] image of
the IRAS 05302−0537 field was obtained in our CAHA survey (Fig.22). We barely detected a faint compact emission coincid-ing with the IRAS source, but we did not detect any extended emission associated with it. Our image also shows another YSO, Haro 4-145. This object is in a more evolved stage than J05324165-0535461, as indicated by its near-IR colors and the
05393+2235 2’
Fig. 23.IRAS 05393+2235: CAHA image through the continuum filter. The IRAS source position and error ellipse are shown.
lower extinction allowing it to be detected at optical wavelengths. Haro 4-145 lies ∼2500southeast of the IRAS source position, out-side the IRAS error ellipse. Thus, it is unlikely to be the optical counterpart of the IRAS source. Instead, J05324165-0535461 is more likely to be the IRAS counterpart.
4.2.3. IRAS 05393+2235
IRAS 05393+223 is located at a distance of 1540 ± 106 pc (Gaia Collaboration 2018). In the following we present a short description of the source.
IRAS counterpart. RNO 54, a red nebulous object (Cohen
1980):
– associated with extended emission (Cohen 1980) with a cometary-shape morphology (broadband, R filter image;
Goodrich 1987);
– FU Ori star, with a spectral type F5 II (Goodrich 1987); – probable post-FU Ori star (double Li absorption profile;
Torres et al. 1995).
Figure23shows the IRAS 05393+2235 field in the continuum filter and Fig.24shows close-ups in the Hα and [SII] line filters.
As can be seen in the figures, the extended arc-shaped nebu-losity surrounding the compact counterpart of the IRAS source presents the same morphology in the continuum and in the line images, indicating that the extended emission is most probably a reflection nebula. No evidence of shocked gas was found in our narrowband images.
4.2.4. IRAS 06249−1007
IRAS 06249−1007 is located at a kinematic distance of 0.86 ± 0.07 kpc (see Footnote 1), determined from its radial velocity, VLSR =12.2 km s−1(Wilking et al. 1989). In the following we present a short description of the field around the source.
Optical and IR emission.
– IRAS located ∼1000 from the southwest edge of the loop-shaped nebula HHL 43 (Gyulbudaghian 1984);
30 "
05393+2235
30 "
05393+2235
Fig. 24. IRAS 05393+2235: Close-up of the CAHA images through the Hα (top) and [SII] (bottom) filters.
1’
06249-1007
Fig. 25.IRAS 06249−1007: CAHA image through the continuum filter. The IRAS source position and error ellipse are shown.
30" 06249-1007 30" 4 3 2 1
Fig. 26.IRAS 06249−1007: Close-up of the CAHA image through the Hα (top) and [SII] (bottom) filters showing the field centered on the IRAS source The stars of the IR cluster reported byTapia et al.(1997) are shown as plus signs (+).
– HHL 43 has the same loop-shaped morphology in broadband optical (I) and near-IR (J, H, K) images (Tapia et al. 1997); – emission at 100 µm peaking at the nominal position of IRAS
(Di Francesco et al. 1998). Young stellar objects.
– a cluster of four stars, all inside the IRAS error ellipse, with near-IR colors characteristic of embedded T Tauri stars (Tapia et al. 1997);
– the position of one of the stars (star 3) coincides with the IRAS position and with the 2MASS source J06271812−1009387.
Molecular outflows. A CO outflow toward the IRAS posi-tion, most probably driven by the source (Wilking et al. 1989).
Figure 25 shows the image of IRAS 06249−1007 field
through the continuum filter. Close-ups of the narrowband images in the Hα and [SII] line filters are shown in Fig. 26.
As can be seen in the figures the nebula shows the same mor-phology in continuum and in the line images, indicating that the origin of the emission is mainly reflection (dust illuminated by the cluster of stars), without signs of shocked emission. In our images, the cluster of YSO including the IRAS counterpart lies outside the nebular emission. We did not detect any optical coun-terparts of any of the YSOs in the cluster. This is consistent with an extinction increasing from north to south along the nebula
(Tapia et al. 1997), with the YSO cluster being embedded in extended K-band emission.
4.2.5. IRAS 06562−0337
IRAS 06562−0337 is located at a kinematic distance of 5.65 ± 0.43 kpc (see footnote 1), determined from its radial velocity, VLSR=54.0 ± 0.2 km s−1(Bachiller et al. 1998). In the following we present a short description of the field around the source.
Controversial nature of IRAS.
– originally classified as a possible planetary nebula (PN) (MacConnell 1978), based on a spectrum showing the Hα emission line and absence of continuum emission;
– renamed as Iron-clad nebula, and classified to be in a tran-sition phase from AGB to PN, based on its high variability and spectrum dominated by allowed and forbidden FeIIlines
(Kerber et al. 1996).
Association of IRAS with molecular gas. CO, 13CO,
and CS emission at millimeter and submillimeter wavelengths (Bachiller et al. 1998).
– powering source of a molecular outflow traced by the high-velocity CO emission;
– non-evolved object because the CS molecule is destroyed in the proto-PN stage.
Association of IRAS with IR emission. K0-band image of the field (Alves et al. 1998):
– IRAS is a young, rich stellar cluster embedded in diffuse emission;
– the cluster contains ∼70 stars within a 3000radius around the bright central object;
– the central object is likely a Herbig Be star;
– spectral variability of the central object is attributed to a stellar wind in its extended atmosphere;
– coordinates of the central source in the K0-band image are in agreement with the CO emission peak.
Figure27shows the IRAS 06562−0337 field mapped through a continuum filter, and Fig.28shows close-ups of the Hα and [SII] line filter images where the stars of the IR cluster have
been indicated. We did not detect any nebular shocked emission from jet structures.
4.3. Group III: Point-like sources 4.3.1. IRAS 00422+6131
IRAS 00422+6131 is located at a distance of 2400+920 −520 pc, derived from its parallax (Gaia Collaboration 2018). In the fol-lowing we present a short description of the field around the source.
Controversial nature of IRAS.
– lies in projection toward the young open cluster NGC 225, although it is not a member of it (Lattanzi et al. 1991); – first identified as a T Tauri star on the basis of its IRAS colors
(García-Lario et al. 1997);
– later proposed to be a G giant star, based on its optical spectrum (Pereira & Miranda 2007).
Association of IRAS with IR emission. 2MASS J, H,
K images show extended emission surrounding the point-like source J00450982+6147574.
Figure29 shows the image of the IRAS 00422+6131 field through a continuum filter. Close-ups of the narrowband images
2’ 06562-0337
Fig. 27.IRAS 06562−0337: CAHA image through the continuum filter. The IRAS source position and error ellipse are shown.
30"
30"
Fig. 28. IRAS 06562−0337: Close-up of the CAHA image through the Hα (top) and [SII] (bottom) filters, showing the field centered on the IRAS source. The positions of the IRAS source and the K-band star reported byAlves et al.(1998) are respectively shown as white and green plus signs (+).
2’
00422+6131
Fig. 29. IRAS 00422+6131: CAHA image through the continuum filter. The IRAS source position and error ellipse are shown.
in the Hα and [SII] line filters are shown in Fig. 30. All the
images show a morphology similar to that of the IRAS optical counterpart. We did not detect in our narrowband line images any shocked emission from jet structures.
4.3.2. IRAS 02181+6817
IRAS 02181+6817 is located at a distance of 664 ± 25 pc (Gaia Collaboration 2018). In the following we present a short description of the source.
Proposed IRAS counterpart. An optical/near-IR bright star.
– classified as a T Tauri star, based on the IRAS colors (García-Lario 1992);
– reported as a non-periodic variable star, CO Cas (Hoffmeister 1936; Samus et al. 2017), with an aver-age Vmag = 15.52, and a variation amplitude of 1.15 mag (Kochanek et al. 2017)5;
– coincides with the 2MASS star J02222276+6830471, with near-IR colors compatible with being a Herbig Ae/Be source;
– 3D dust maps ofGreen et al.(2019)6 give an extinction in
the R band AR =0.93 at the distance of the source.
Figure31shows the image of the IRAS 02181+6817 field through a continuum filter. Close-ups of the narrowband images in the Hα and [SII] line filters are shown in Fig.32.
We found two sources located less than 500 from the IRAS position and inside the IRAS error ellipse. The brighter source is CO Cas, the proposed IRAS counterpart. The other source is located a few arcsec southeast of CO Cas (labeled 3 in Fig.32). The source is faint and slightly elongated in the northwest– southeast direction, and could be tracing a micro-jet powered by CO Cas.
5 https://asas-sn.osu.edu, ASAS-SN Sky Patrol.
6 http://argonaut.skymaps.info, 3D Dust Mapping with
Pan-STARRS 1, 2MASS and Gaia.
15"
15"
Fig. 30.IRAS 00422+6131: Close-up of the CAHA image through the Hα (top) and [SII] (bottom) filters showing the field centered in IRAS 00422+6131.
2’
02181+6817
Fig. 31.IRAS 02181+6817: CAHA image through the continuum filter. The IRAS source position and error ellipse are shown.
4.3.3. IRAS 05426+0903
The optical counterpart of IRAS 05426+0903 is the prototypical, young pre-main-sequence star FU Ori. It is located at a distance
15"
15"
3
2 1
Fig. 32.IRAS 02181+6817: Close-up of the CAHA image through the Hα (top) and [SII] (bottom) filters. The catalogue position of IRAS 02181+6817 is in black, the 2MASS source J02222276+6830471 in cyan, and an additional point-like object in magenta.
of 416 ± 9 pc (Gaia Collaboration 2018). In the following we present a short description of the source.
Binarity.
– binary system (Wang et al. 2004;Reipurth & Aspin 2004); – the companion is a red star, FU Ori S, ∼0.005 south of FU Ori.
FU Ori characteristics.
– optically thick accretion disk (mid-IR, 8–13 µm interfero-metric observations;Beck & Aspin 2012);
– continuum emission at 1 mm detected from circumstellar disk (ALMA Band 7 with 0.006 angular resolution;Hales et al.
2015).
FU Ori S characteristics.
– hints of a disk (mid-IR;Beck & Aspin 2012);
– actively accreting young star, with Macc˙ ' (2–3) × 10−8M yr−1, and is the more massive component of the binary system (Beck & Aspin 2012);
– continuum emission at 1 mm detected from circumstellar disk (Hales et al. 2015);
– high-density tracer HCO+emission-peak close to FU Ori S, indicating that it is embedded in dense molecular gas (Hales et al. 2015).
Circumbinary reflection nebula.
– detected through near-IR high-resolution imaging polarime-try (Liu et al. 2016;Takami et al. 2018);
05426+0903 2’
Fig. 33.IRAS 05426+0903: CAHA image through the continuum filter. The IRAS source position and error ellipse are shown.
– Arc-like morphology, reminiscent of a spiral arm stretching from east to northeast of the FU Ori system;
– morphology probably caused by gravitational instabilities in the accretion disks, in an unstable phase of protoplanetary disk evolution.
Figure33shows the IRAS 05426+0903 field mapped through a continuum filter. Close-ups of the narrowband images in the Hα and [SII] line filters are shown in Fig.34. All the images show
a morphology similar to that of the IRAS optical counterpart. We did not detect shocked emission from jet structures in our narrowband line images.
4.3.4. IRAS 06471−0329
IRAS 06471−0329 is located near the CO boundary of G216−2.5, at a distance of 2110 ± 21 pc (Zucker et al. 2020). In the following we present a short description of the source.
First proposed counterpart of IRAS. Red star detected in the I-band (Campbell et al. 1989).
Later proposed counterpart of IRAS. One of the two bright stars in the K band, close to the IRAS position (Lee et al. 1996): – very high reddening, with near-IR colors consistent with
those of embedded YSOs;
– associated with an IR nebulosity (Ishii et al. 2002);
– absorption feature at 3.1 µm from H2O ice, usually present in high-density interstellar clouds protected from UV radiation, characteristic of embedded objects.
Figure 35 shows the image of the IRAS 06471−0329 field through a continuum filter. Close-ups of the narrowband images in the Hα and [SII] line filters are shown in Fig.36. We detected
in all the images a weak nebular emission surrounding three point-like sources southwest of the bright star at the center of the field. This weak reflection nebula should correspond to the near-IR emission detected byLee et al.(1996) and Ishii et al.
(2002). In the narrowband line images (Fig. 36) we show the catalogue positions of the IRAS source (white) and the
30"
30"
Fig. 34. IRAS 05426+0903: Close-up of the CAHA image through the Hα (top) and [SII] (bottom) filters.
2’
06471-0329
Fig. 35.IRAS 06471−0329: CAHA image through the continuum filter. The IRAS source position and error ellipse are shown.
2MASSX source J06494021−0332523 (red). As can be seen in Fig. 36, the position of the 2MASSX source coincides with a weak star surrounded by nebular emission. Thus, we conclude that the optical counterpart of IRAS 06471−0329, instead of being the bright star at the center of the field, is most probably the more embedded near-IR source J06494021−0332523.
10"
10"
Fig. 36.IRAS 06471−0329: Close-up of the CAHA image through the Hα (top) and [SII] (bottom) filters. The positions from the Vizier Cat-alogue of the IRAS source (white plus sign) and of the 2MASS source J06494021-0332523 (magenta plus sign) are indicated.
5. Conclusions
We obtained narrowband images covering a wide FOV around a sample of IRAS sources that were proposed to be associated with YSOs, based mainly on their location in CC diagrams. The association of the IRAS source with young stellar objects has been confirmed from the images obtained. Although these fields were observed in the past, our survey provides new data both for the IRAS counterparts themselves and for their environment. We note in particular the following points.
In this survey the first-ever images through the narrowband, Hα and [SII], line filters were obtained for nine IRAS sources (all the targets of groups II and III). The IRAS sources of group II were known to have extended emission. However, pre-vious imaging was only made through broadband filters, which do not allow us to distinguish with confidence between reflected and shocked emission. The narrowband images obtained confirm the nature of the extended component of the emission associ-ated with the targets. In IRAS 02181+6817, a point-like target of group III, an elongated emission in the Hα and [SII] lines
was detected, southeast of the source, which could be tracing a micro-jet powered by the source.
New images in the two emission lines, Hα and [SII], were
obtained for three sources of group I (IRAS 03220+3035, 04073+3800, and 04239+2436) These sources were previously mapped only in one of the lines, or through a broadband, red continuum filter.
In six of the mapped fields (group I) extended emission in the Hα and [SII] lines was detected, with no continuum
![Fig. 5. IRAS 00087+5833: close-up of the CAHA images in the Hα (left) and [S II] (right) filters](https://thumb-eu.123doks.com/thumbv2/123dokorg/4407319.28253/5.892.458.836.143.579/fig-iras-close-caha-images-hα-right-filters.webp)
![Fig. 11. IRAS 03220+3035: Close-up of the CAHA image through the Hα filter (top) and [S II] filter (bottom), showing the field around the IRAS source](https://thumb-eu.123doks.com/thumbv2/123dokorg/4407319.28253/7.892.60.432.124.490/iras-close-caha-image-filter-filter-showing-source.webp)


![Fig. 22. IRAS 05302−0537: CAHA image in the narrowband [S II] fil- fil-ter. The IRAS source position and error ellipse are shown in black](https://thumb-eu.123doks.com/thumbv2/123dokorg/4407319.28253/13.892.456.840.123.482/caha-image-narrowband-source-position-ellipse-shown-black.webp)
![Fig. 26. IRAS 06249−1007: Close-up of the CAHA image through the Hα (top) and [S II] (bottom) filters showing the field centered on the IRAS source The stars of the IR cluster reported by Tapia et al](https://thumb-eu.123doks.com/thumbv2/123dokorg/4407319.28253/14.892.58.436.712.1113/close-filters-showing-centered-source-cluster-reported-tapia.webp)
