SAPIENZA UNIVERSITÀ DI ROMA
FACOLTÀ DI FARMACIA E MEDICINA
Dottorato di Ricerca in
MORFOGENESI e INGEGNERIA TISSUTALE XXX Ciclo
(A.A. 2016/2017)
Electroencephalography-based measures
of human mental workload in operational environments
for the development of passive Brain-Computer Interfaces
Dottorando Gianluca Di Flumeri
Tutor Coordinator
Prof. Fabio Babiloni Prof. Sergio Adamo Co-Tutor
ABSTRACT
Is it possible to enhance the performance of an operator by inferring his/her mental workload online from his brain activity? Also, would be possible to use such information to adapt the functionalities of the operative interface he/she is interacting with?
This is the experimental question that my PhD research activity tried to answer.
Even if not quantified, it is widely accepted the assumption that the human brain cognitive resources are limited. Depending on the amount of cognitive resources, i.e. the mental workload, committed to the main task, the human capacity to face additional unexpected events could dramatically decrease. It was demonstrated that humans could achieve their best performance only if maintaining their mental workload within an optimum range, otherwise they will be more prone to commit errors. Unfortunately, the human error is one of the main causes of accidents and no-natural catastrophes. Therefore, neuroscientific research is giving an important contribute in the development of Brain-Computer Interfaces able to recognize the user’s mental state covertly (i.e. without interfering with his/her main activity) and to help him if needed.
In this context, my research activity aimed to develop a method able to evaluate, even online, the user’s mental workload, on the basis of his/her brain activity measured by Electroencephalography, in operational environments, facing all those issues related to perform reliable neurophysiological measures outside the laboratory controlled conditions.
The developed method (patented) has been successfully validated in three different operational environments, i.e. the Air Traffic Management, the car driving and the robot-assisted surgery. Also, it has been applied online in a real application of Brain Computer Interface, where the operative platform changed its behaviour according on the EEG-based measure of the actual operator’s mental workload level.
SOMMARIO
È possibile esaltare le prestazioni di un operatore stimando il suo carico di lavoro mentale dalla propria attività cerebrale, ed usare questa informazione per adattare le funzionalità dell’interfaccia che sta utilizzando?
Questa è la domanda sperimentale a cui la mia attività di ricerca del Dottorato ha provato a dare una risposta.
Anche se in maniera non quantificata, è ampiamente accettata l’idea che le risorse cognitive del cervello umano siano limitate. In funzione della quantità di risorse cognitive, in altre parole del carico di lavoro mentale, dedicate al compito principale, la capacità umana di affrontare ulteriori eventi inaspettati potrebbe diminuire drasticamente. È stato dimostrato che gli uomini possono raggiungere le proprie migliori prestazioni solo mantenendo il proprio carico di lavoro mentale all’interno di un intervallo ottimale, altrimenti aumenta la probabilità che commettano errori. Sfortunatamente, l’errore umano è una delle principali cause di incidenti e catastrofi non naturali. Per tale motivo, la ricerca neuroscientifica sta dando un importante contributo allo sviluppo di Interfacce Cervello-Computer in grado di riconoscere lo stato mentale dell’utente e di aiutarlo se necessario.
In tale contesto, la mia attività di ricercar aveva lo scopo di sviluppare un metodo in grado di valutare online il carico di lavoro mentale dell’utente, sulla base della sua attività cerebrale misurata attraverso Elettroencefalografia, in ambienti operativi, affrontando tutti quei problemi relativi all’eseguire misure neurofisiologiche affidabili al di fuori dei contesti controllati propri dei laboratori.
Il metodo sviluppato (brevettato) è stato con successo validato in tre differenti ambienti operative, ossia il controllo di traffico aereo, la guida di auto e la chirurgia assistita da robot. Inoltre, esso è stato applicato online in una reale applicazione di Interfaccia Cervello Computer, dove la piattaforma operative variava il suo livello di
Index
ABSTRACT ... 3
SOMMARIO ... 5
1. Introduction ... 9
1.1 The human brain and its activity ... 9
1.1.1. Brain anatomy ... 10
1.1.2. Basic neurophysiology ... 15
1.1.3. The electroencephalographic signal ... 19
1.2 The Mental Workload ... 24
1.2.1. A topic in the Human Factors research ... 25
1.2.2. The Mental workload evaluation in operational environments ... 29
1.3 Passive Brain-Computer Interfaces and Automation ... 31
2. Aims ... 35
3. Results ... 37
3.1 Validation of two innovative techniques ... 38
3.1.1. Automatic-stop-StepWise Linear Discriminant Analysis (asSWLDA)... 38
3.1.2. Regressive Eye BLINk Correction Algorithm (REBLINCA) ... 47
3.2 Application in operational environments ... 54
3.2.1. Case study 1: Air Traffic Controllers ... 55
3.2.2. Case study 2: Car drivers ... 62
3.2.3. Case study 3: Robot-assisted surgeons ... 64
3.3 Online passive Brain Computer Interface application... 69
3.3.1. Triggering of Adaptive Automation solutions ... 70
3.3.2. Effectiveness of the passive-BCI system ... 71
3.3.3. Discussion ... 73
4. Material and Methods ... 75
4.1 Validation of two innovative techniques ... 75
4.1.1. Automatic-stop-StepWise Linear Discriminant Analysis (asSWLDA)... 75 4.1.2. Regressive Eye BLINk Correction Algorithm
Gianluca Di Flumeri
4.3 Application in operational environments ... 95
4.3.1. Case study 1: Air Traffic Controllers ... 95
4.3.2. Case study 2: Car drivers ... 98
4.3.3. Case study 3: Robot-assisted surgeons ... 102
4.4 Online passive Brain Computer Interface application.... 105
4.4.1. The experimental protocol ... 105
4.4.2. The performed analysis ... 108
5. Conclusion ... 111
References ... 113
1. INTRODUCTION
1.1 The human brain and its activity
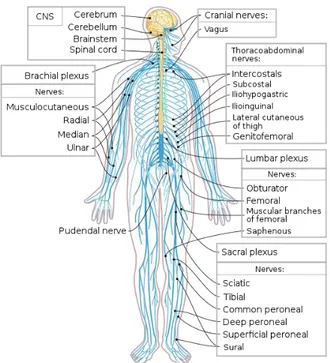
The human brain is the central organ of the human Nervous System, and with the spinal cord makes up the Central Nervous
System (CNS). In a generical assumption the CNS is not directly in
contact either with the body peripheries or the external environment, but all the information is exchanged through the Peripheral Nervous
System (PNS) (Nieuwenhuys, Voogd, & Huijzen, 2007).
The CNS is so named because it integrates information it receives from the external environment as well as from inside the human body, processes such information, and consequently coordinates and influences the activity of all the parts of the body, including movements and actions, decisions, thoughts, behaviours and organs functionalities. The CNS is contained within the dorsal body cavity, with the brain housed in the cranial cavity and the spinal cord in the spinal canal. In vertebrates, the brain is protected by the skull, while the spinal cord is protected by the vertebrae, both - brain and spinal cord - enclosed in the meninges.
The PNS consists of the nerves and ganglia outside the brain and spinal cord. The main function of the PNS is to connect the CNS to the limbs and organs, essentially serving as a relay between the brain and spinal cord and the rest of the body. Unlike the CNS, the PNS is not protected by the vertebral column and skull, or by the blood–brain barrier, which leaves it more exposed to mechanical injuries and external agents (Nieuwenhuys, Voogd, & Huijzen, 2007).
In Figure 1, a graphical overview on the human Nervous System, with its organization in CNS and PNS, is provided.
Within the following paragraph, briefly it will be put the focus on the brain, its activity from a physiological point of view, and the way to measure such activity. The information presented have been summarized from the book “Mental states in aviation” (Gianluca Borghini, Aricò, Di Flumeri, & Babiloni, 2017), whereof I have been co-author.
Gianluca Di Flumeri
Figure 1. A representation of the human Nervous System. In yellow the Central Nervous System (CNS), in blue the Peripheral (PNS) one.
1.1.1. Brain anatomy
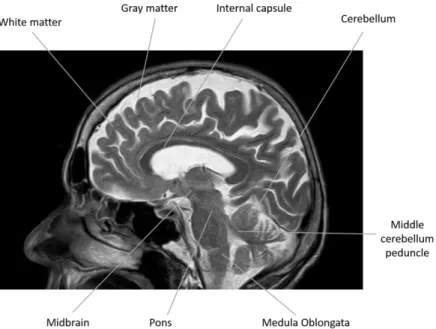
The adult human brain weighs on average about 1.2–1.4 kg, or more in general about 2 % of the total body weight, with a volume of around 1260 cm3 in men and 1130 cm3 in women, although there is substantial individual variation (Cosgrove, Mazure, & Staley, 2007). The brain consists of the cerebrum, the brainstem, and the
cerebellum. It controls most of the activities of the body, processing,
lobes – the frontal, central, temporal, parietal, and occipital lobes (Figure 2). The frontal lobe is associated with executive functions including self-control, planning, reasoning, and abstract thought, the central lobe is mainly dedicated to movements control and motor imagery, the temporal lobe to language comprehension, the parietal lobe to language processing and long-term memory, while the occipital lobe is dedicated to vision. Within each lobe, cortical areas are associated with specific functions, such as the sensory, motor and association regions. Although the left and right hemispheres are broadly similar in shape and function, some functions are associated with one side, such as language in the left and visual-spatial ability in the right. The hemispheres are connected by nerve tracts, the largest being the corpus callosum (Nieuwenhuys et al., 2007).
Figure 2. Brain cortex subdivision in lobes and hemispheres.
The cerebrum is connected by the brainstem to the spinal cord. The brainstem consists of the midbrain, the pons, and the medulla oblongata. The cerebellum is connected to the brainstem by pairs of tracts. Within the cerebrum there is the ventricular system, consisting of four interconnected ventricles in which cerebrospinal fluid is produced and circulated. Underneath the cerebral cortex are several
Gianluca Di Flumeri
hippocampus; the claustrum, the various nuclei of the basal ganglia; the basal forebrain structures, and the three circumventricular organs (Figure 3). The cells of the brain include neurons and supportive glial cells. There are more than 86 billion neurons in the brain, and a more or less equal number of other cells. Brain activity is made possible by the interconnections of neurons and their release of neurotransmitters in response to nerve impulses. Neurons form elaborate neural networks of neural pathways and circuits. The whole circuitry is driven by the process of neurotransmission.
Figure 3. A sagittal brain section in which some of the main structures of the brains
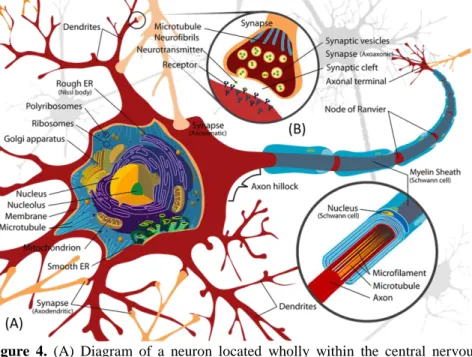
terminals, and a variable number of branching processes called dendrites (Figure 4). Each axon, including its collateral branches,
usually terminates as an arbor of fine fibres; each fibre ends as an enlargement called bouton, which is part of a synaptic junction. At the other end of the neuron, there is a three-dimensional dendritic
field, formed by the branching of the dendrites. The cell body is the
genomic and metabolic centre of the neuron. Dendrites are the main recipients of the neural signals for communication between neurons, and contain critical processing complexes. The axon is the canal apt to conduct messages (action potentials) to the presynaptic terminals, where each neuron is in synaptic contact with other neurons and, thus, is part of the network that constitutes the nervous system. A neuron is designed to react to the stimuli, to rapidly transmit the resulting excitation to the other portions of the nerve cell, and to influence other neurons, muscle cells, and glandular cells. Neurons are so specialized that most are incapable of reproducing themselves, and they lose viability if denied an oxygen supply for more than a few minutes. Dendrites contain the same cytoplasmic organelles (e.g., Nissl bodies and mitochondria) as the cell body of which they are true extensions. The axon is specialized in the transmission of coded information as all-or-none action potentials. The axon arises from the
axon hillock of the cell body, at a site called the initial segment, and
extends for a distance of less than 1 mm to as much as 1 m before arborizing into terminal branches (Figure 4). The axon hillock, initial segment, and the axon lack Nissl bodies. The branches of an axon can have, potentially, two types of bouton. Each branch ends as a
terminal bouton that forms a synapse with the dendrite, cell body, or
axon of another neuron. In addition, along some branches, there are thickenings called boutons en passage, which form synapses with another neuron or smooth muscle fibre. The dendrites of many neurons are studded with tiny protuberances called spines (e.g., pyramidal neurons of the cerebral cortex): these dendritic spines increase the surface area of the membrane of the receptive segment of the neuron. Located on them, there are over 90% of all the
Gianluca Di Flumeri
areas of the cerebrum, they are thought to be involved in learning and memory.
Figure 4. (A) Diagram of a neuron located wholly within the central nervous
system. The (B) represents a synapse between two neurons. The myelin sheath of neuron (A) is entirely the product of a glial cell, and the one of neuron is produced by a glial cell inside the central nervous system and by a Schwann (neurolemma) cell in the peripheral nervous system.
The synapse is the contact point between the neurons. A sub-microscopic space, the synaptic cleft, which is about 200 Å, exists between the bouton of one neuron and the cell body of another neuron
The synapse of each axon terminal of a motoneuron on a voluntary muscle cell is called a motor end plate (Figure 4). The cell membrane of the axon at the synapse is the presynaptic membrane, and the cell membrane of dendrite-cell body complex, muscle, or glandular cell is the postsynaptic membrane. The subsynaptic membrane is that region of the postsynaptic membrane that is juxtaposed against the presynaptic membrane at the synapse. A concentration of mitochondria and presynaptic vesicles is present in the cytoplasm of the bouton; none is present in the cytoplasm adjacent to the subsynaptic membrane. Most neurons contain at least two distinct types of vesicle: small vesicles 50 nm in diameter and large vesicles from 70 to 200 nm in diameter.
1.1.2. Basic neurophysiology
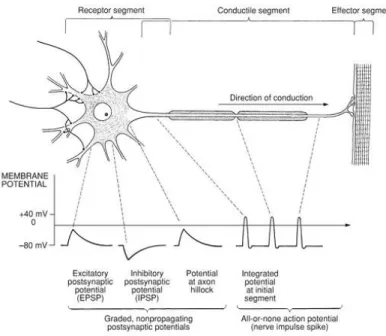
Every neuron is said to possess “in miniature, the integrative capacity of the entire nervous system.” Neurons can transform information and transmit it to other neurons. In most, the dendrite - cell body unit is specialized as a receptor and integrator of synaptic input from other neurons, and the axon is specialized to convey coded information from the dendrite-cell body unit to the synaptic junctions, where transformation functions take place with other neurons or effectors (muscles and glands). To serve these tasks, the neuron is thus organized into a receptive segment (dendrites and cell body), a conductile segment (axon), and an effector segment (synapse) (Figure 5). Neurons are specialized to generate electrical signals, which are used to encode and convey information. These signals are expressed by alterations in the resting membrane potential. Voltage changes that are restricted to at or near the sites where neurons are stimulated are called graded potentials. These can lead to the production of action potentials (nerve impulses or spikes), which transmit information for substantial distances along an axon.
Gianluca Di Flumeri
Figure 5. On the surface of the dendrites and cell body are excitatory and inhibitory
synapses, which, when stimulated, produce local, graded, non-propagating potentials. These are exhibited as an excitatory or depolarizing postsynaptic potential (EPSP) and as an inhibitory or hyperpolarizing postsynaptic potential (IPSP). These local potentials are summated at the axon hillock and, if adequate, could trigger an integrated potential at the initial segment and an “all-or-none” action potential, which is conducted along the axon to the motor end plate.
Two forms of graded potential are generator (receptor
potentials) and synaptic potentials. Generator potentials are evoked
by sensory stimuli from the environment (both inside and outside the body). Information that passes from one neuron to another at synapses produces synaptic potentials in the postsynaptic neuron.
conveyed by both electrical and chemical signals. The electrical signals, called graded potentials and action potentials, are all produced by temporary changes in the current flow into and out of the neuron. These changes are deviations away from the normal value of the resting membrane potential. Ion channels within the plasma membrane control the inward and outward current flow. The channels possess three features. They (1) conduct ions across the plasma membrane at rapid rates up to 100,000,000 ions per second, (2) can recognize specific ions and be selective as to which can pass through, and (3) selectively open and close in response to specific electrical, chemical, and mechanical stimuli. Each neuron is presumed to have over 20 different types of channel with thousands of copies of each channel. The flux (movement of ions) through the ion channels is passive, requiring no expenditure of metabolic energy. The direction of the flux is determined by the electrochemical driving force across the plasma membrane. The primary role of ion channels in neurons is to mediate rapid signalling. These channels, called gated channels, have a molecular “cap” or gate, which opens briefly to permit anion species to pass (Figure 6). Gated channels open when a neurotransmitter binds to them; voltage-gated channels open and close in response to changes in membrane potential;
modality-gated channels are activated by specific modalities (e.g.,
touch, pressure, or stretch). Gating is the process by which a channel is opened or closed during activity. Each channel consists of several plasma membrane-spanning polypeptide subunits (proteins) arranged around a central pore.
Gianluca Di Flumeri
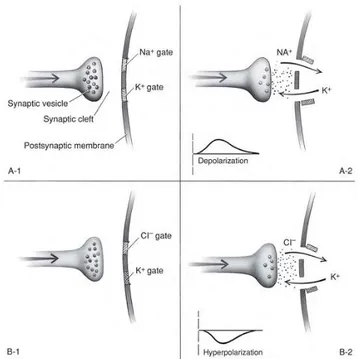
Figure 6. Excitatory synapses (A) and inhibitory synapses (B). A-1 and B-1:
Synapses prior to release of neurotransmitter. A-2: Excitatory postsynaptic response (EPSP) following release of neurotransmitter with Na+ ion inrush through Na+ gate and K+ ion outrush through K+ gate. B-2: Inhibitory postsynaptic response (IPSP) following release of neurotransmitter with Cl– ion in rush through Cl– gate and K+ ion outrush through K+ gate.
Each of these classes of channel belongs to a different gene family. Each member of a family shares common structural and biochemical features, which presumably have evolved from a common ancestral gene of that family. The channels of the
voltage-derived (1) from the binding of the transmitter to the receptor protein in the ligand-gated channels, (2) from the changes in the membrane voltage in the voltage-gated channels, and (3) presumably from the mechanical forces resulting from cytoskeletal interaction at the modality-gated channels. There are two types of membrane response; it could (1) hyperpolarize or (2) depolarize. During
hyperpolarization, the membrane becomes more negative on the
inside with respect to its outside (i.e., could go from –70 mV to –80 mV). During depolarization, the membrane becomes less negative inside with respect to its outside and even might reverse polarity with its inside becoming positive with respect to the outside. This is still called depolarization because the membrane potential becomes less negative than the resting potential (e.g., from –70 mV to 0 to +40 mV).
1.1.3. The electroencephalographic signal
The Electroencephalogram (EEG) is the electrical biosignal recordable over the scalp as the result of the summation of synchronously postsynaptic potentials. The contribution to the electric field of neurons acting synchronously is approximately proportional to their number, and, for those firing non-synchronously, as a square root of their number (Blinowska & Durka, 2006). The problem of the origins of EEG rhythmical activity has been approached by electrophysiological studies on brain nerve cells and by the modeling of electrical activity of the neural populations. The question emerges whether the rhythms are caused by single cells with pacemaker properties or by the oscillating neural networks. It has been shown that some thalamic neurons display oscillatory behaviour, even in the absence of synaptic input (Jahnsen & Llinás, 1984). Evidence exists that the intrinsic oscillatory properties of some neurons contribute to the shaping of the rhythmic behaviour of networks to which they belong. However, these properties may not be sufficient to account for the network rhythmic behaviour. It is generally accepted that cooperative properties of networks consisting of excitatory and inhibitory neurons connected by feedback loops
Gianluca Di Flumeri
the synaptic interactions. Bursts of oscillatory activity may constitute a mechanism by which the brain can regulate changes of state in selected neuronal networks and change the route of information (Lopes da Silva, 1991). EEG is usually registered by means of electrodes placed on the brain scalp. They can be secured by an adhesive (like collodion) or embedded in a special snug cap. The resistance of the connection should be less than 10 (kΩ), so the recording site is first cleaned with diluted alcohol, and conductive electrode paste applied to the electrode cup. Knowledge of exact positions of electrodes is very important for both interpretation of a single recording as well as comparison of results, hence the need for standardization. The traditional 10–20 International System (Jasper, 1958) states positions of 19 EEG electrodes (and two electrodes placed on earlobes A1/A2) related to specific anatomic landmarks, such that 10 – 20 % of the distance between them is used as the electrode interval. The first part of derivation’s name indexes the array’s row—from the front of head: Fp, F, C, P, and O. Such labels are related to the cortial area where the electrode is placed, respectively prefronta, Frontal Central, Parietal and Occipital. The second part is formed from numbers even on the left and odd on the right side, while in the centre ‘‘z’’. Progress in topographic representation of EEG recordings brought demand for a larger amount of derivations. Electrode sites halfway between those defined by the standard 10–20 International System were introduced in the extended 10–20 system. EEG is a measure of potential difference: in the referential (or unipolar) setup, it is measured relative to the same electrode for all derivations. This reference electrode is usually placed on the earlobe, nose, mastoid, chin, neck, or scalp centre. No
the necessity of artefact rejections is universally acknowledged.
Artefacts are recorded signals that are non-cerebral in origin. They
may be divided into one of two categories depending on their origin:
physiological artefacts or non-physiological artefacts. Physiological
artefacts can stem from muscle or heart activity (EMG, ECG), eye movement (EOG), external electromagnetic field, poor electrode contact, subject’s movement. Corresponding signals (EMG, EOG, ECG, and body movements) registered simultaneously with EEG could be helpful in the visual rejection of artefact-contaminated epochs. Non-physiological artefacts arise from two main sources: external electrical interference (power lines or electrical equipment), and internal electrical malfunctioning of the recording system (electrodes, cables, amplifier).
Furthermore, artefacts may reduce the performance of machine-learning techniques. Several ways of handling physiological artefacts can be found in the literature. Artefacts may be avoided, rejected or removed from the EEG dataset. Artefacts avoidance involves asking users to avoid blinking or moving their body during the experiments (Vigario, Sarela, Jousmiki, Hamalainen, & Oja, 2000). This approach is very simple, because it does not require any computation, as brain signals are assumed to have no artefacts. However, this assumption is not feasible in real environments, i.e. outside the laboratory, since some artefacts, eye and body movements, are not easily avoidable. Artefact rejection approaches suggest discarding the epochs contaminated by the artefacts. Manual artefact rejection is an option to remove artefacts in brain signals, and experts could identify and eliminate all artefact-contaminated EEG epochs. The main disadvantage in using manual rejection is that it requires intensive human work, so this approach is not suitable for real-time evaluations. This issue has been directly treated during my PhD research activity (please see Par. 4.1.2).
In the EEG, the following frequency rhythms are considered characteristic for its analysis (Figure 7): delta (0.5 – 4 Hz), theta (4 – 8 Hz), alpha (8 – 12 Hz), beta (12 – 30 Hz), and gamma (above 30
Gianluca Di Flumeri
Figure 7. Characteristic EEG rhythms, from the top: δ (0.5 – 4 Hz), θ (4 – 8 Hz),
α (8 – 12 Hz), β (12 –30 Hz). The gamma band could reach 100 Hz.
Delta activity is characterized by high amplitude and low
frequency. It is usually associated with the slow-wave in psychophysiology of sleep. It is suggested that it represents the onset of deep sleep phases in healthy adults (Hori et al., 2001).
Theta rhythm is generally linked to the hippocampus activity
(Buzsáki, 2002) as well as neocortex (Cantero et al., 2003). It is thought to be linked to deep relaxation or meditation, and it has been observed during the transition between wake and sleep (Hagemann, 2008). However, theta rhythms are suggested to be important for learning and memory functions (Sammer et al., 2007), encoding and retrieval (Vecchiato et al., 2014; Ward, 2003), which involve high
High alpha power has been assumed to reflect a state of relaxation or cortical idling; however, when the operator assigns more effort to the task, different regions of the cortex may be recruited in the transient function network leading to passive oscillation of the local alpha generators, in synchrony with a reduction in alpha power (Smith et al., 2001). Recent results have suggested that alpha is involved in auditory attention processes and the inhibition of task irrelevant areas to enhance signal-to-noise ratio (Gevins et al., 1998; Wolfgang Klimesch, 2012). Additionally, alpha activity may be further divided into sub-bands by means of the frequency corresponding to the alpha peak of the user (Wolfgang Klimesch, 1999), called Individual Alpha
Frequency (IAF). For instance, alpha 3 (IAF÷IAF+2 Hz) reflects
semantic memory performance, while alpha 1 and alpha 2 (respectively, IAF-4÷IAF-2 and IAF-2÷IAF Hz) reflect general task demands and attentional processes.
Beta activity is predominant in wakefulness state, especially in
frontal and central areas of the brain. High power in beta band is associated with the increased mental arousal and activity. Dooley (Dooley, 2009) pointed out that beta wave represents cognitive consciousness and active, busy, or anxious thinking. Furthermore, it has been revealed to reflect visual concentration and the orienting of attention. This band can be further divided into low beta wave (12.5-15 Hz), middle beta wave ((12.5-15-18 Hz), high beta wave (> 18 Hz). Low waves seems to be associated with inhibition of phasic movements during sleep, and high waves with dopaminergic system (Hagemann, 2008).
Finally, Gamma rhythms are the fastest activity in EEG and it is thought to be infrequent during waking states of consciousness (Dooley, 2009). Recent studies reveal that it is linked with many cognitive functions, such as attention, learning, and memory (Jensen, Kaiser, & Lachaux, 2007). Gamma components are difficult to record by scalp electrodes, because of their low amplitude, but with
Electrocorticography (ECoG) components up to 100 Hz, or even
Gianluca Di Flumeri
exist, since EEG pattern is influenced by neuropathological conditions, metabolic disorders, and drug action (Niedermeyer & Silva, 2005).
However, despite the remarkable progresses made in understanding “how the brain works”, the brain is still not fully understood, and research is ongoing (Van Essen et al., 2012). Neuroscientists, along with researchers from other disciplines, study literally how the human brain works. The boundaries between the specialties of neuroscience, neurology and other disciplines such as psychiatry have faded as they are all influenced by basic research in neuroscience.
Neuroscience research has expanded considerably in recent decades. The "Decade of the Brain", an initiative of the United States Government in the 1990s, is considered to have marked much of this increase in research (Jones & Mendell, 1999), and was followed in 2013 by the BRAIN Initiative (UnderwoodJun, 2014). The Human
Connectome Project was a five-year study launched in 2009 to
analyse the anatomical and functional connections of parts of the brain, and has also provided much data and contributions in general in this field (Van Essen et al., 2012).
In this context, the aim of my PhD research activity has been the interpretation of the brain activity, in terms of EEG signal, with respect to a specific mental state: the Mental Workload.
1.2 The Mental Workload
The Mental Workload is a complex construct that is assumed to be reflective of an individual’s level of cognitive engagement and mental effort (Wickens, 1984). Measurement of mental workload
• “Workload is not an inherent property, but rather it emerges from the interaction between the requirements of a task, the circumstances under which it is performed, and the skills, behaviours, and perceptions of the operator” (Hart & Staveland, 1988);
• “Mental workload is a hypothetical construct that describes the extent to which the cognitive resources required to perform a task have been actively engaged by the operator” (Gopher & Donchin, 1986);
• “The reasons to specify and evaluate the mental workload is to quantify the mental cost involved during task performance in order to predict operator and system performance” (Cain, 2007).
These definitions show how the mental workload may not be a unitary concept because it is the result of different aspects interacting with each other. In fact, several mental processes such as alertness, vigilance, mental effort, attention, stress, mental fatigue, drowsiness and so on, can be involved in the meanwhile of a task execution and they could be affected by specific tasks demand in each moment. In general, mental workload theory assumes that: (i) people have a limited cognitive and attentional capacity, (ii) different tasks will require different amounts (and perhaps different types) of processing resources, and (iii) two individuals might be able to perform a given task equally well, but differently in terms of brain activations (Baldwin, 2003; Wickens, Hollands, Banbury, & Parasuraman, 2012).
1.2.1. A topic in the Human Factors research
In some operational environments, the safety of the people could weight on one or few operators. In such contexts, a human error could have serious and dramatic consequences. For example, in the transports domain the safety of the passengers depends on the performance of the Pilot(s), of the (e.g. Air, Train, Vessel) Traffic-Controller(s) or of the Driver(s).
Gianluca Di Flumeri
human errors as principal cause(Feyer & Williamson, 2011). For example, in the health care domain, the US Institute of Medicine estimates that there is a high people mortality per year (between 44.000 and 88.000) as a result of medical errors (Helmreich, 2000). It has also been estimated that inappropriate human actions and consequently errors are implicated are the main cause of the 57 % of road accidents and a contributing factor in over 90 % (Aberg & Rimmö, 1998). The Aviation Safety Network reported 19 accidents with 960 casualties during the last years; in many cases factors related to workload, situation awareness and monitoring were a cause or contributing factor (P. Arico et al., 2017; Gianluca Borghini et al., 2017). Additionally, over the past four decades, human error has been involved in a high number of casualty catastrophes, including the Three Mile Island, Chernobyl and Bhopal nuclear power disasters, the Tenerife, Mont St Odile, Papa India and Kegworth air disasters, the Herald of Free Enterprise ferry disaster, the Kings Cross fire disaster, the Lad-broke Grove rail disaster, and many others (Salmon, Regan, & Johnston, 2005). Consequently, the construct (i.e. human error) has received more and more attention, and it has been investigated across a wide range of domains, including military and civil aviation (Shappel & Wiegmann, 2000; Stanton et al., 2006), aviation maintenance (Rankin, Hibit, Allen, & Sargent, 2000), air traffic management (Shorrock & Kirwan, 2002), rail (Lawton & Ward, 2005), road transport (Reason, 2000a; Rumar, 1990), nuclear power and petrochemical reprocessing (Kirwan, 1998), military, medicine (Helmreich, 2000; Sexton, Thomas, & Helmreich, 2000), and even the space travel domain (Nelson, Haney, Ostrom, & Richards, 1998).
scientific literature, there have been numerous attempts at de-fining and classifying the human error. However, a universally accepted definition does not yet exist. Rasmussen (Jens Rasmussen, 1982) pointed out the difficulty in providing a satisfactory definition of human error; in 1987, he suggested that human error represents a mismatch between the demands of an operational system and what the operator does (J. Rasmussen, 1987). The main causes of human errors have to be searched within the internal or psychological factors of the operator (Reason, 2000b). In fact, errors could arise from aberrant mental processes such as inattention, poor motivation, loss of vigilance, mental overload and fatigue that negatively affect the user’s performance.
In particular, cognitive psychology literature demonstrated that the Mental Workload has an ‘‘inverted U-shape’’ relationship with performance (Figure 8). In other words, some levels of mental workload may help the user to reach high performance level (Calabrese, 2008) since it stimulates positively the user and it keeps him/her awake with high attention level. Nevertheless, a period of mental inactivity and “under-stimulation” can cause a monotonous and boring state (underload), a low level of vigilance and attention, with low cognitive resources demand. For example, Warm and colleagues (Warm, Parasuraman, & Matthews, 2008) showed how vigilance requires an important amount of cognitive resources, by using behavioural, neurophysiological and subjective measures. On the contrary, an operative condition characterized by demanding multi-tasks can lead the user to an overload condition (Kirsh, 2000). Both the cases bring to a variation in neurophysiological factors and often to a decrement of performance. Such performance reduction is highly undesired, especially in critical domains, as discussed above.
Gianluca Di Flumeri
Figure 8. Inverted U-shape relationship between mental workload and
performance.
Mental Workload assessment techniques must be sensitive to such fluctuations in task demands without intruding on primary task performance (O’Donnell & Eggemeier, 1986). This level of sensitivity is unobtainable with behavioural and subjective measures alone. In this regard, neurophysiological techniques have been demonstrated to be able to assess mental workload of humans with a high reliability, even in operational environments (Aricò, Borghini, Di Flumeri, Colosimo, Pozzi, et al., 2016; Gianluca Borghini et al., 2016; Di Flumeri et al., 2015; Mühl, Jeunet, & Lotte, 2014; Wierwille & Eggemeier, 1993). Moreover, neurophysiological techniques afford another important advantage: unlike alternative subjective assessment techniques, neurophysiological measures do not require the imposition of an additional task either concurrently (as in secondary task techniques) or subsequently (as in subjective workload assessment techniques) the primary one.
passive Brain Computer Interface (passive-BCI, please see Par. 1.3)
application in real environments.
1.2.2. The Mental workload evaluation in operational environments
In the mental workload related literature, neurophysiological measurements have been and are often used to evaluate the level of cognitive demand induced by a task (P. Arico et al., 2017; Boucsein & Backs, 2000; Desmond & Hancock, 2001).
Many neurophysiological measures have been used for the mental workload assessment, including Electroencephalography (EEG), functional Near-InfraRed (fNIR) imaging, functional
Magnetic Resonance Imaging (fMRI), Magnetoencephalography
(MEG), and other types of biosignals such as Electrocardiography (ECG), Electrooculography (EOG) and Galvanic Skin Response (GSR) (Gianluca Borghini, Astolfi, Vecchiato, Mattia, & Babiloni, 2014; Ramnani & Owen, 2004; Wood & Grafman, 2003). Among all these methods, Aricò and colleagues (Aricò, Borghini, Di Flumeri, Colosimo, Pozzi, et al., 2016) have highlighted the clear advantages of using EEG signal in passive-BCI application, also proposing a cutting-edge algorithm for the online operator’s mental workload assessment.
Basically, most part of the EEG research showed that the brain electrical activities mainly considered for the mental workload analysis are the Theta and Alpha rhythms typically gathered from the
Pre-Frontal Cortex (PFC) and the Posterior Parietal Cortex (PPC)
regions. In this regard, previous studies demonstrated as the EEG Theta rhythm over the PFC present a positive correlation with the mental workload (Gevins, A & Smith, 2003; Smit, Eling, & Coenen, 2004). Moreover, published literature stressed the inverse correlation between the EEG power in the alpha frequency band over the PPC and the mental workload (G. Borghini, Astolfi, Vecchiato, Mattia, & Babiloni, 2014; Brookings, Wilson, & Swain, 1996; Gevins, Smith, McEvoy, & Yu, 1997; Jaušovec & Jaušovec, 2012; W. Klimesch, Doppelmayr, Pachinger, & Ripper, 1997; Venables & Fairclough,
Gianluca Di Flumeri
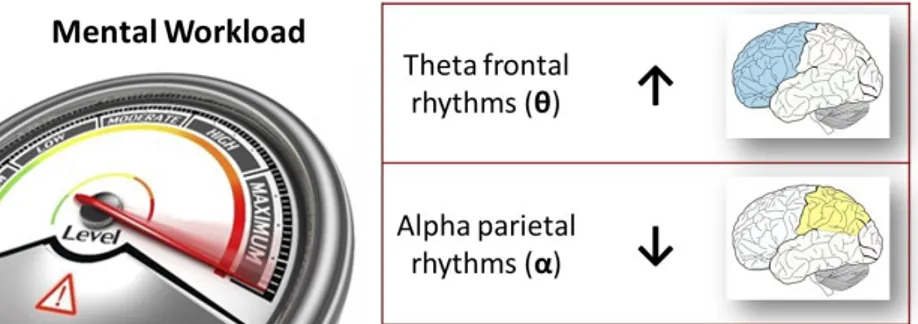
correlates of mental workload could be resumed in an increase of the theta band spectral power, especially on the frontal cortex, and a decrease in alpha band over the parietal cortex, in correspondence of mental workload increasing (G. Borghini et al., 2014; Gianluca Borghini et al., 2017) (Figure 9).
Figure 9. Schematic summary of the main EEG features variations related to the
mental workload increasing.
Several studies, in particular in the aviation domain, have highlighted the high reliability of EEG-based mental workload indexes (Brookings et al., 1996). The results showed that the effects of the task demand were evident on the EEG rhythms variations. EEG power spectra increased in the theta band, while significantly decreased in the alpha band as the task difficulty increased, over central, parietal, frontal and temporal brain sites. More recently, Shou and colleagues (Shou, Ding, & Dasari, 2012) evaluated the mental workload during an ATC experiment using a new time-frequency
Independent Component Analysis (tfICA) method for the analysis of
conditions, i.e. starting form an easy level, then increasing up to a hard one and finishing with an easy one again. The EEG-based mental workload indices showed to be directly and significantly correlated with the actual mental demand experienced by the ATCOs during the entire task. However, the algorithms proposed were affected by some weaknesses, such as parameters manual settings and performance decreasing over time, that limited their employment in real operational environments (for further information please see Par. 4.1.1).
Moreover, other studies about the mental workload estimation by using neurophysiological measurements, have been performed with other types of transport means, in particular cars (G. Borghini et al., 2014; Göhring, Latotzky, Wang, & Rojas, 2013; Kohlmorgen et al., 2007), and in the military domain (Dorneich, Ververs, Mathan, & Whitlow, 2005).
1.3 Passive Brain-Computer Interfaces and Automation
In this regard, the Neuroergonomics research field aims at developing systems that take such limitations of a human’s capacity to process information into account and avoid performance degradation by adapting the user’s interface to reduce the task demand/complexity or by intervening directly on the system (Fuchs, Hale, Stanney, Juhnke, & Schmorrow, 2007). Over the past two decades, researchers in the field of augmented cognition worked to develop novel technologies that can both monitor and enhance human cognition and performance. Most of this augmented cognition research was based on research findings coming from cognitive science and cognitive neuroscience. On the basis of such findings and the technological improvements, that have allowed to measure human biosignals in a more reliable and no-invasive way, it has been possible to evaluate the actual operator mental states by using neurophysiological indexes, and to use them as input toward the interface the operator is interacting. Such kind of application is called
Gianluca Di Flumeri
individual sends to the external world do not pass through the brain’s normal output pathways of peripheral nerves and muscles (Jonathan R Wolpaw, Birbaumer, McFarland, Pfurtscheller, & Vaughan, 2002). More recently, Wolpaw and Wolpaw (J. Wolpaw & Wolpaw, 2012) defined a Brain-Computer Interface as “a system that measures Central Nervous System (CNS) activity and converts it into artificial output that replaces, restores, enhances, supplements, or improves natural CNS output and thereby changes the ongoing interactions between the CNS and its external or internal environment”.
In the BCI community, the possibility of using the BCI systems in different contexts for communication and system control (Aloise et al., 2012; Riccio et al., 2015), developing also applications in ecological and operative environments, is not just a theory but something very closed to real applications (Blankertz et al., 2010; Müller et al., 2008; T. O. Zander, Kothe, Welke, & Roetting, 2009). In fact, in the classic BCI applications the user can modulate voluntarily its brain activity to interact with the system. In the new BCI concept, i.e. the passive BCI, the system recognizes the spontaneous brain activity of the user related to the considered mental state (e.g. emotional state, workload, attention levels), and uses such information to improve and modulate the interaction between the operator and the system itself (Aricò et al., 2017). Thus, in the context of Adaptive Automation (AA) in operational environments, the passive-BCI perfectly match the needs of the system in terms of
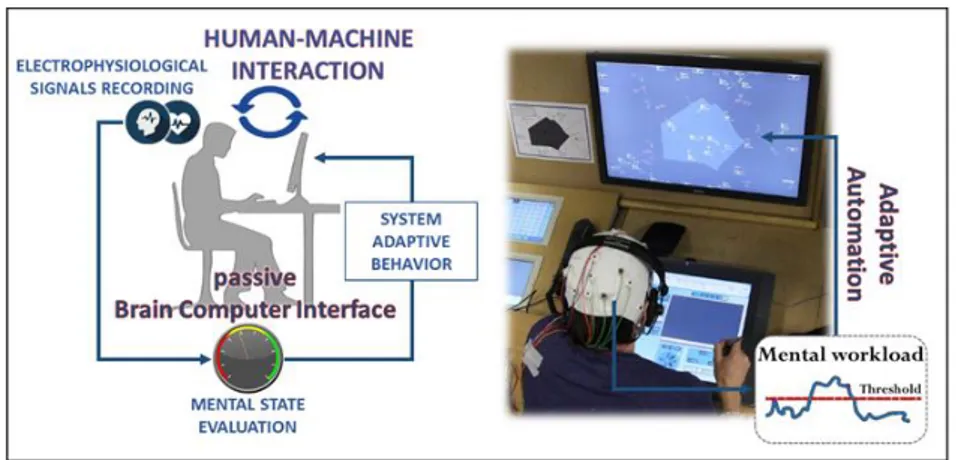
Figure 10. Representation of the passive-BCI concept applied to enhance the
Human-Machine Interaction by adapting the automation of an Air Traffic Management workstation (the application is descripted in Par. 3.3)
Even if the main limitation of the EEG is its wearability, technology improvements(Chi et al., 2012; Liao et al., 2012) have being developed and tested in terms of dry electrodes (no gel and impedances adaptation issues), comfort, ergonomic and wireless communications (no cables between EEG sensors and the recording system).
In conclusion, EEG-based passive-BCI systems appear the best candidate to be integrated in the development of AA-based systems and dynamically trigger the tasks allocation, on the basis of the user’s actual mental state, i.e. his Mental Workload, in order to support him during his working activity consequently improving his performance, thus the safety of the whole environment.
The still open issue is the development of a systematic method, in other words an algorithm, able to assess the user’s Mental Workload online, despite all the problems related to operational environments (i.e. no controlled settings, artefacts, time cost in terms of calibration and computation, invasiveness on the subject), and independently of the environment of application.
2. AIMS
Recovering the experimental problem assessed in conclusion to the Introduction chapter (please see Par. 1.3), i.e. the necessity of developing a systematic method, in other words an algorithm, able to assess the user’s Mental Workload online, despite all the problems related to operational environments (i.e. no controlled settings, artefacts, time cost in terms of calibration and computation, invasiveness on the subject), and independently of the environment of application, the main aim of my PhD research activity has been:
➢ The development and the validation of an algorithm able to produce online a robust EEG-based Mental Workload index (see Par. 4.2).
Because of the several issues related to the main experimental problem, my PhD research activity aimed also to:
• Face all the problems due to the fact that such method would be applied not in laboratory controlled settings but in real operational environments, where there are much bigger constrains and obstacles. The mitigation of this issue was fundamental for the robustness and reliability of the algorithm developed (see Par. 3.1 and 4.1);
• Develop a method not specific for a single application but equally reliable and usable in different domains (see Par. 3.2 and 4.3);
• Validate such method in a real application of passive Brain Computer Interfaces in operational environments (see Par. 3.3 and 4.4).
3. RESULTS
This Chapter has been divided in three main sections, in order to guide the reader through the application validation of all the methodology developed. Each paragraph has its correspondent paragraph within the “Material an Methods” Chapter (see Chapter 4), where all the details about experimental hypothesis, protocols and analysis are provided.
In particular, the first section (Par. 3.1) aims to show the results obtained for the validation of two innovative techniques, i.e. the
automatic-stop-StepWise Linear Discriminant Analysis (asSWLDA)
(Aricò et al., 2017; European Patent Nr. EP3143933 A1, 2017), and the Regressive Eye BLINk Correction Algorithm (REBLINCA) (Di Flumeri, Arico, Borghini, Colosimo, & Babiloni, 2016), developed to address specific issues related to the mental state evaluation in general, and in particular for online applications in real operational environments.
Once developed and tested the new algorithm for the EEG-based Mental Workload evaluation (Par. 4.2), the second section (Par. 3.2) is dedicated to the validation of such an algorithm in real operational environments: in particular three case studies have been investigated involving Air Traffic Controllers (ATCOs), car drivers in real drive conditions, and surgeons (students) managing robotic technologies in laparoscopic-surgery tasks.
The third and last section (Par. 3.3) is the final fulfilment of such PhD research activity, since it describes the application of the Mental Workload evaluation algorithm in a Passive Brain-Computer Interface with professional ATCOs in their workstation: in the operative interfaces of ATCOs adaptive automation solution have been implemented and their activation was triggered online by the Mental Workload Index of ATCOs themselves.
Also, a specific discussion paragraph is included for each experiment, whilst the Conclusions Chapter (Ch.5) aims to provide a brief overall discussion of the present Thesis work.
Gianluca Di Flumeri
3.1 Validation of two innovative techniques
3.1.1. Automatic-stop-StepWise Linear Discriminant Analysis (asSWLDA)
A modified version of the standard SWLDA, the Automatic-stop-StepWise Linear Discriminant Analysis (asSWLDA) (Aricò et al., 2017; European Patent Nr. EP3143933 A1, 2017), has been developed. Such innovative classifier is actually the core of the whole method for the EEG-based Mental Workload evaluation (described in Par. 4.2). In the followings, the results of the validation of such technique on twelve professional Air Traffic Controllers (ATCOs) performing a realistic Air Traffic Management (ATM) scenario are reported.
3.1.1.1.Comparison between neurophysiological and subjective workload evaluation
The one-way ANOVA (Figure 11) on the neurophysiological workload measures (WEEG data) highlighted a significant effect
(F(2,22)=27,4, p=0.000001) between the three levels (EASY, MEDIUM, HARD). In particular, the post-hoc test highlighted significant differences (all p<0.001) between the WEEG score related
to all the possible paired comparisons between the difficulty conditions (i.e. EASY vs MEDIUM, MEDIUM vs HARD, EASY vs HARD).
The correlation analysis (Figure 12), by means of the Pearson’s correlation coefficient, highlighted a high and positive correlation between the EEG-based workload index (WEEG) and both the ISA
indexes. In particular the correlation analyses reported R = 0.856 and
Figure 11. Error bars (CI = 0.95) related to the WEEG scores along the three difficulty conditions (EASY, MEDIUM, HARD). Results showed significant differences between all the difficulty conditions (p < 0.001).
Finally, the Fisher’s R-to-Z analysis (Figure 12) on the two correlation indexes showed no differences between them (p = 0.676).
Statistical analysis of the correlation
Pearson’s correlation index
R p 12 subjects WEEG vs SELF-ISA 0.856 0.0002 WEEG vs SME-ISA 0.797 0.0011 Fisher’s transformation Z p R1 = 0.856, R2 = 0.797 n = 13, 2 tails 0.418 0.676
Gianluca Di Flumeri
Figure 13. Shape of the three workload indexes, the neurophysiologic (WEEG) and the subjective (SELF- and SME-ISA) ones, across the experimental task. The three measures were able to follow the mental workload variation along the ATM scenarios.
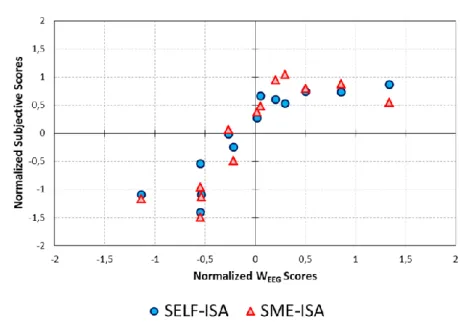
The scatterplot in the Figure 14 highlighted a high and positive correlation between the neurophysiological and the subjective workload indexes.
Figure 14. Scatterplot of the subjective workload measures (SELF-ISA and SME-ISA) with respect to the neurophysiological workload measure. On the x-axis the
normalized WEEG index, on the y-axis the normalized SELF- and SME-ISA indexes. The results of the correlation analyses showed high and significant correlation among all the workload measures (Figure 12).
3.1.1.2.Performance stability over-time
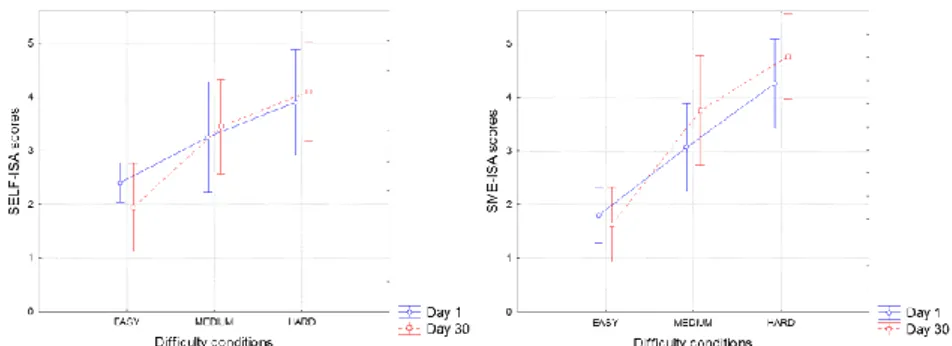
The three two–tailed paired t-test (α=0.05) did not highlighted any difference between the two sessions (Day 1 and Day 30), for each difficulty level, both in terms of SELF-ISA (EASY: p=0.19; MEDIUM: p=0.63; HARD: p=62) and SME-ISA (EASY: p=0.78; MEDIUM: p=0.22; HARD: p=0.11) scores (Figure 15). It means that, although two different scenarios have been used during the two experimental sessions (Day 1 and Day 30), these scenarios were similar in terms of difficulty levels. It was crucial to verify this hypothesis, in order to link eventual classifier performance degradations only to intrinsic limitations of the method itself, and not because of differences in the experimental tasks.
Gianluca Di Flumeri
Figure 15. Error bars related to the SELF-ISA and the SME-ISA scores for each
session (Day 1, Day 30) and difficulty condition (EASY, MEDIUM, HARD). Both the SELF-ISA (on the left) and the SME-ISA (on the right) scores did not show any significant differences between the two experimental sessions for each difficulty condition.
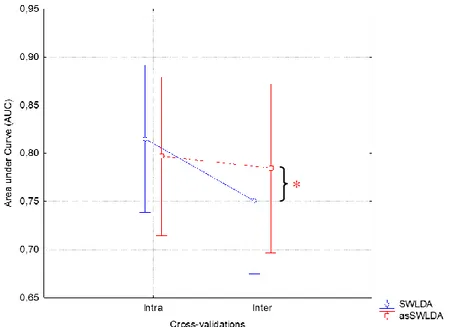
The two-way repeated measures ANOVA (CI = .95) highlighted a significant main effect between the two (classifiers and cross-validations) factors (F(1,4)=10.6, p=0.03). The post-hoc test highlighted a significant decrement (p=0.005) of the AUC values related to the SWLDA classifier between the Intra and the Inter cross-validation types. On the contrary, no significant differences (p=0.33) were highlighted for the asSWLDA between the Intra and the Inter cross-validations. In addition, a significant decrement (p=0.04) of the AUC values related to the Inter-cross-validation type was highlighted between the SWLDA and the asSWLDA classifiers. Instead, no significant differences (0.2) between the two classifiers were highlighted regarding the Intra cross-validation type (Figure 16). In other words, once calibrated both the algorithms, only the asSWLDA is able to maintain its performance stable also after one
Figure 16. Error bars (CI = .95) related to the AUC values of the SWLDA and
asSWLDA classifiers calculated on the EASY and HARD conditions over the two cross-validation types (Intra and Inter). Focusing on the Inter cross-validation type, i.e. after one month, the SWLDA performance (i.e. AUC) is significantly (p = 0.04) poorer that the asSWLDA one.
3.1.1.3.EEG features selection analysis
The 2 two–tailed paired t-test (α=0.05) highlighted that both the number of features (p=0.0007) and the related EEG channels (p=0.0003) used by the asSWLDA model were significantly lower than those used by the standard SWLDA model. In Figure 17, both the numbers of features and EEG channels are reported in terms of percentage with respect to the total number of features (72) and EEG channels (8). In particular, the asSWLDA selected the 5,2% of the available features, that means about 4 features for ATCO, by using the 37% of EEG channels, that means about 3 EEG channels in the considered study. By contrast, the standard SWLDA used the 100% of EEG channels, i.e. 8 channels, selecting the 44 % of available
3.1.1.4.Discussion
The purpose of this experiment was to investigate the effectiveness of developed method (Par. 4.2) for the user’s mental workload assessment in operational environments, in this case Air Traffic Management (ATM), by using neurophysiological measures, i.e. the measure of the operator brain activity through EEG. The brain activity (EEG) and subjective measures (SELF-ISA and SME-ISA scores) of twelve professional Air Traffic Controllers (ATCOs) have been gathered while performing a high-ecological ATM task and analyzed by a machine-learning approach.
In this experiment, the innovative automatic-stop StepWise
Linear Discriminant Analysis (asSWLDA) (Aricò et al., 2017;
European Patent Nr. EP3143933 A1, 2017), a modified version of the standard SWLDA, has been used to compute a mental workload index based on the EEG activity of the user (WEEG).
This experiment in particular aimed to investigate two important key issues to use neurophysiological measurements in operative environments: 1) the reliability over time of the measure, and 2) the accuracy in comparison with the standard (i.e. subjective) workload measures.
Regarding the first issue, results demonstrated that the proposed algorithm has been able to maintain a high reliability across a month. It has been already demonstrated the reliability of the standard SWLDA model over a week (Aricò et al., 2015). In other words, unlike the standard SWLDA algorithm, it is possible to calibrate the asSWLDA model and then using it every day without accuracy reductions in the mental workload evaluation up to a month after the calibration.
In addition, the asSWLDA model has been able to select a lower number of brain features and EEG channels (37%, that means 3 EEG channels in the specific study), to be used for the workload assessment, in comparison with the standard SWLDA (100%, that means 8 EEG channels). In the standard SWLDA algorithm it could be possible to force the model to select less features (that means less
Gianluca Di Flumeri
the asSWLDA is able to automatically select the right number of brain features to optimize the final model. In this way, it has to be stressed that one of the big limitations in using passive BCI systems in operative environments is represented by the EEG cap, that has to be wore by the operator during his/her work-shift. It is simple to conclude that the less is the number of EEG channels included in the classification model, the less intrusive will be the system for the user.
Concerning the second issue, the EEG-based workload measure has been compared with two subjective workload measures, one provided by the ATCOs (SELF-ISA scores), and the second provided by two ATC Experts (SMEs), who have been asked to fill the ISA questionnaire at the same time of the ATCOs (SME-ISA scores). Results highlighted high and significant correlations between the neurophysiological and both the subjective workload measurements. Such result is very important, because the high similarity, i.e. the correlation, between the shapes of the WEEG and both the subjective
indexes (SELF-ISA and SME-ISA), meant that the EEG-based workload index (WEEG) was able to follow the actual fluctuations of
the mental workload experienced by the ATCOs during the experimental task. In addition, the SELF-ISA scores showed a higher workload perception during the MEDIUM and the HARD conditions in comparison with the SME-ISA ones. This result highlighted the main limitation of the subjective measures, that is, they are highly operator-dependent and they cannot be used to quantify objectively the operators’ mental states (i.e. mental work-load). On the contrary, the neurophysiological measures can provide, with high resolution, an objective evaluation of the operator’s mental workload.
using other machine learning techniques. However, they have demonstrated the reliability of the developed algorithm to measure the operators’ mental workload during a real operational environment.
3.1.2. Regressive Eye BLINk Correction Algorithm (REBLINCA)
The REBLINCA is an innovative method for the blinks artefacts correction on the EEG data I developed during my PhD research activity (Di Flumeri et al., 2016). Because of its particular advantages for the online applications, it is fundamental within the whole method for the EEG-based Mental Workload evaluation (see Par. 4.1.2 and Par. 4.2).
It has been validated by comparing its performance with the best outperforming methods in this field, the Gratton, the extended InfoMax and SOBI, on a EEG dataset of ten subjects.
From a purely qualitative point of view, Figure 18 and Figure 19 show the effects of the correction by using the four methods considered in this study, in correspondence of an “eye blink epoch” randomly selected along one representative EEG channel (i.e. AF3), respectively in time and frequency domain.
Gianluca Di Flumeri
related to the AF3 channel in correspondence of one blink randomly selected. It is evident how the shape of the REBLINCA-corrected signal (dotted red line) is similar to those ones resulting from the application of other methods in correspondence of the eye-blink, and exactly equal to the Raw Signal outside the blink.
Figure 19. Graphical comparison (frequency domain) between the effects of the
four correction methods on the Raw Signal (black line) spectrum, as in Figure 18. It is evident how the shape of the REBLINCA-corrected signal spectrum (dotted red line) is similar to those ones resulting from the application of other methods, with a great reduction of the spectral components related to the blink electrical activity (< 8 Hz).
Figure 20. Application of the offline REBLINCA algorithm on an EEG dataset:
the red line represents the Raw signal, the blue line is the EEG signal after the artefacts correction.
In the following, the results of the statistical analysis are reported, with the aim to validate the offline and after the online REBLINCA algorithm.
3.1.2.1.REBLINCA offline
The table in Figure 21 reports the results obtained from the 24 ANOVAs on the signal “blink windows” after the correction. The results showed significant (p<0.05) differences, in terms of EEG correction by using the four methodologies, in the alpha band for all the frontal electrodes, in the theta band for Cz, Pz and Oz, and in the delta band on Cz. In particular, the post-hoc test highlighted significant (p<0.05) differences between, but not within the methodology types (regression-based and the ICA-based algorithms). In other words, the REBLINCA algorithm did not show significant differences with respect to the considered reference method (i.e. Gratton). No significant differences between all the methods, in terms of EEG signal PSDs, have been found in correspondence of the Theta band over the frontal sites, i.e. where the
Gianluca Di Flumeri
Figure 21. The table in figure reports the ANOVAs results on the EEG signal
PSD values in correspondence of blinks.
The ANOVAs (Figure 22) performed on the correlation coefficients of the four methodologies were all significant (p<0.05). In particular, as confirmed by the post-hoc analyses, the REBLINCA showed a significant higher correlation value than the other methods, very close to 1 for each EEG channel (Pearson’s correlation coeff. > 0.985±0.02, Figure 23). This correlation value confirms the efficiency of the threshold method for the eye blinks recognition. Although the trend was the same, for the Cz (p=0.06), Pz (p=0.16) and Oz (p=0.11) EEG channels, such difference was not significant between REBLINCA and InfoMax.
Fz AF3 AF4 F3 F4 Cz Pz Oz D el ta F(3,27 ) 2,82 2,43 2,04 2,64 2,31 3,25 2,63 1,89 p 0,05 1 0,087 0,13 0,07 0,09 0,03 7 0,07 0,15 T h et a F(3,27 ) 2,45 0,85 0,60 1,60 1,62 7,25 7,34 4,14 p 0,08 0,48 0,62 0,21 0,21 0,00 1 0,000 9 0,01 6 A lp h a F(3,27 ) 7,09 8,99 12,375 4,66 8,10 1,16 2,10 1,21 p 0,00 1 0,000 2 0,0000 3 0,00 9 0,000 5 0,34 0,12 0,32 Fz AF3 AF4 F3 F4 Cz Pz Oz F(3,27) 13,51 22,71 19,27 11,92 12,97 7,23 4,61 2,97 P 1*10-5 6*10-9 5*10-9 4*10-5 2*10-5 0,001 0,009 0,049
Figure 23. The mean correlation coefficient significantly higher (p<0.05) after the
REBLINCA application highlights the capability of this method in preserving the EEG information in blink free signal segments, in contrast to the traditional ones. This is verified for all the considered channels.
3.1.2.2.REBLINCA online
Once demonstrated the remarkable performance of the offline REBLINCA algorithm, they are used to evaluate, by comparing them, the performance of the new implementation of the online REBLINCA algorithm. Before any analysis in terms of performance, the Pearson’s correlation analysis was performed between the weights used by the REBLINCA online, thus obtained by the Training condition, and offline, thus obtained by the Testing condition, in order to validate the experimental hypothesis (see Par. 4.1.2.2). The values of the two REBLINCA implementations shew a very high and significant correlation, in particular R = 0,984 ± 0,02, with p < 10-7.
In terms of correction performance, i.e. the EEG signal PSDs in correspondence of “blink windows” after the correction, the two-tailed paired T-test analysis have shown no significant differences (p > 0,05 over all the channels) between the offline and online
Gianluca Di Flumeri
than those of the Raw signal, an intrinsic demonstration of the method effectiveness.
> 0,05 over all the channels) between the offline and online implementations of REBLINCA (please see Table in Figure 25).
Figure 25. EEG signal time-domain correlation analysis in correspondence of
“no-blink windows”. The reported T-test results compared the offline and online REBLINCA implementations.
3.1.2.3.Discussion
The results demonstrated the high efficiency of the REBLINCA application for eye blinks correction, with respect to three of the best and most used algorithms in scientific literature, i.e. the Gratton, the
Gianluca Di Flumeri
using the REBLINCA and the Gratton method, considered as the outperforming regressive method. This highlights that the two algorithms do not differ in terms of efficiency in removing eye blinks contributions. As expected, the two ICA-based methods showed significantly different behaviours with respect to the two regression-based methods, since they showed a greater reduction on the alpha band PSD over the frontal electrodes, probably a consequence of filtering the EOG/EEG channel used in the regression-based methods for the eye blink component subtraction until 7 (Hz). In addition, the REBLINCA preserved significantly better than all the other considered methods the EEG signal when blinks do not occur. This result is really important, since one of the main disadvantages of the regression-based methods, as discussed in Par. 4.1.2, is the mutual contamination between EEG and the channel used for the regression (i.e. EOG channel). Thus, this REBLINCA feature allows to use an EEG channel for the regression, on the contrary of the Gratton or similar, that in such case could deprive the EEG signal of important neural components. Of course, despite no need of an EOG channel, a frontal EEG channel is preferred, as the eye blink activity has a greater component in such sites than the other brain areas. Finally, REBLINCA does not require any minimum set of EEG channels, great computational effort, and manual components selection to reject, compared to the ICA-based methods. Last but not least, the online implementation of the REBLINCA did not show any significant performance decreasing, thus it appears as the best candidate for online applications in real environments and, for such a reason, it has been included in the whole method for the EEG-based Mental Workload evaluation (Par. 4.2).