Does The Asset Manager‟S Nationality Influence The
Occupational Pension Fund Performance?
Andrea Lippi
Università Cattolica del Sacro Cuore sede di Piacenza
Department of Scienze Economiche e Sociali
Via Emilia Parmese 84, 29122 Piacenza, Italy
E-mail: [email protected]
Received: June 22, 2016 Accepted: July 11, 2016
doi:10.5296/xxx.vxix.xxx URL: http://dx.doi.org/10.5296/xxx.vxix.xxx
Abstract
This paper examines the relationship between asset managers‟ nationality and the Italian occupational pension funds extending the existing literature on the topic. We use a double analysis methodology, targeted at single- and multiple-managers, distinguishing between Italian and/or foreign professional managers. The results obtained show how asset manager‟s nationality impacts differently on managed pension funds‟ performance according to the different investment line risk level, opening debate on asset managers‟ management skills.
JEL: G02 - G00 - G11
Keywords: Pension funds; Single-manager; Multiple-manager; Nationality bias; Pension funds performance
1. Introduction
The picture portrayed by the 2015 edition on data for 2014 of the annual report published by
the OECD “Pension markets in focus”, reveals that pension funds are still the main financing
vehicle for private pension plans, with USD 25.2 trillion of assets under management (AUM), representing 66.8% of total private pension assets in the OECD. The survey shows that sixteen of the thirty-six OECD countries have assets-to-GDP ratios of more than 20%, the minimum level for meeting the OECD‟s definition of a “mature” pension fund market. Italy, in contrast, has a ratio equal to 6.7%, and is twenty-eighth out of the thirty-six OECD countries.
In Italy, on January 2007 the Government introduced an important and wide-ranging reform of the pension system, designed primarily with employees in mind and having the aim of
increasing and developing the supplementary pension scheme. According to the reform, each Italian occupational pension fund presents its investors with a choice of various investment lines, from a minimum of two to a maximum of five, with different levels of risk, from no-risk (also called „guaranteed line‟) to higher risk. In accordance with Pension Funds Supervision Commission (COVIP) guidelines, the „guaranteed line‟ is the investment line without any risk, i.e. the expected loss by members is zero; the „very low risk line‟ is the investment line for which the expected annual loss by its members is maximum 10%; the „low risk line‟ considers the possibility of a maximum 30% expected loss per year; „balanced‟ is the investment line for which the expected loss by its members is (maximum) from 30% to 50%; „growth‟ is the investment line for which the expected loss could be even higher than 50% per year. We identify investment line types from 1 (guaranteed line: no risk) to 5 (very high risk investment line: growth).
The money collected in each investment line is managed by professional managers, Italian and/or foreign, single or multiple, through various legally-regulated bodies, by means of management agreements. When occupational pension funds are managed by more than one manager, each manager receives a mandate to manage a part of the assets collected but they are independent of each other in the choices they make and are not competing against each other. This behaviour is called coacting. The distinction between coacting and noncoacting was indicated in the discovery of social facilitation effects (Zanjonc, 1965). Zanjonc (1965) defines coacting effects as when “we observe individuals all simultaneously engaged in the
same activity and in full view of each other” (p. 270).
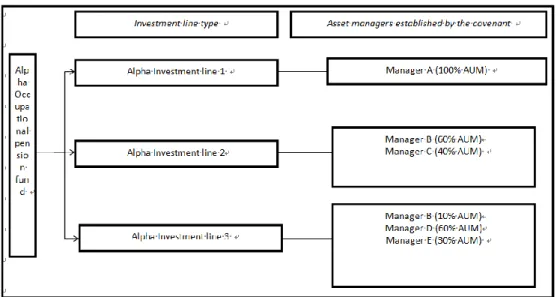
Figure 1 shows an example of Italian occupational pension fund structure, distinguishing the various investment lines established by the fund‟s statute, and the number, the name and the percentage of assets under management (AUM) assigned to each asset manager. As the figure 1 shows, Italian occupational pension funds may employ a single fund manager for each investment line, with a „balanced mandate‟ across all asset classes, or multiple-managers, each with a „specialist mandate‟ within each asset class. The practice of using multiple managers, referred to by Sharpe (1981) as „decentralized investment management‟, presents many potential benefits, especially as funds grow larger (Sharpe, 1981). For example, pension funds can use multiple managers to diversify skills of specialist active managers having superior knowledge of a particular asset class (Sharpe, 1981), potentially achieving better performance.
The managers running an Italian occupational pension fund may be Italians or foreign. Management studies have considered the impact of nationality on the performance of multinational groups (Brass, 1991) but there is no research on the relationship between asset manager nationality and mutual fund or pension fund performance. This paper investigates whether asset manager nationality affects Italian occupational pension fund performance, distinguishing between single-manager and multiple-managers. To this purpose, for each asset manager included in the sample, we gather the annual Jensen‟s alpha (Jensen, 1967, henceforth „alpha‟) as calculated by Morningstar. According to Morningstar glossary (www.morningstar.com) alpha „can be used to directly measure the value added or subtracted
statistic by running least-squared regression of the fund excess return over a risk-free rate compared with the excess returns of the index that Morningstar has selected as the index for the fund‟s broad asset class or the fund‟s category index. Morningstar‟s editorial team assigns the category index.‟ Bearing in mind that the Morningstar methodology does not use
the benchmark pension fund‟s prospectus performance, our regression analysis considers it. Moreover, in our analysis, alpha is weighted for the weight of each asset manager engaged in each investment line (e.g. 100% in the case of single-manager).
Figure 1. Italian occupational pension fund structure: an example
Source: figure created by the author
The results obtained have several implications. First, the paper expands the inadequate existing literature on pension fund performance, considering a non-mature pension fund market (Italy) which has not been adequately explored in the literature, but which may offer many developing opportunities to asset managers. Second, it makes a new contribution to the topic and should open new debate on asset manager „nationality bias‟ (Eshghi, 1985). Third, the results obtained could be taken in consideration by investors and practitioners in funds selection choice.
Section 2 presents a literature review on the relationship between multiple-managers, decentralized investment management, „nationality bias‟ and performance. Section 3 introduces the database and the variables used in the analysis and then Section 3 presents the main results obtained. Section 4 concludes. The Appendix presents a robustness check.
2. Literature Review
Many studies across management and psychology literature have examined performance differences between single- and multiple-managed funds (e.g. Sharpe, 1981; Prather and Middleton, 2002; Chen et al., 2004). In the context of portofolio management, Sharpe (1981) identifies some advantages of teams, including their ability to diversify style and judgement; on the same topic Hill (1982) and Herrenkohl (2004) also identify a broader range of specialized skills, knowledge and abilities available to a team for processing larger amounts
of information. Disadvantages include the presence of free riders (Holmstrom, 1982; Rasmusen, 1987) and delays in decision making (Sah and Stiglitz, 1988). Prather and Middleton (2002) find that there is no difference in the performances of team-managed funds and single-manager funds. Chen et al. (2004) regress future alpha (which expresses the stock selection abilities of fund managers (Jensen, 1967)) on a number of variables, including size and past returns. They find a negative relationship between alpha and size and a positive relationship with past returns. Thus, on average, they find future alpha is smaller for large funds but past returns are associated with higher future alpha, and predictability exists.
Stock (2004), after reviewing more than 100 studies on team behaviour in a variety of circumstances, finds that teams behave differently from individuals but that these differences do not necessarily translate into a superior performance, no matter how they are measured. Bliss et al. (2008), using a sample of about 3,000 equity mutual funds over a 12-year timespan, find that although the number of funds managed by teams has grown at seven times the rate of funds managed by a single manager, no significant difference in risk-adjusted performance is observed between team-managed and individually-managed funds. Bar et al. (2011), considering a sample of U.S. equity mutual funds, find that teams take less extreme decisions than singles. Bogan et al. (2013) investigate whether the gender composition of fund management team influences investment decision making behavior. They demonstrate that a male presence increase the probability of selecting a higher risk investment.
According to Sharpe (1981), especially large funds use multiple managers. Berk and Green (2004), highlight that when funds increase in size, excess return will disappear due to the resulting diseconomies of scale such as greater transaction costs and organizational diseconomies. Pollet and Wilson (2008) examine influences that could lead to diseconomies of scale. They hypothesize that management could put more money into existing stocks, therefore incurring higher transaction costs, or could increase the number of stocks in the portfolio, thereby having to select securities with lower expected returns. They show that management reacts overwhelmingly to an increase in size by increasing their ownership share in stocks already held in the portfolio rather than by increasing the number of investments: a doubling of fund size increases the number of stocks in the fund by less than 10%. Since management does not react to increasing size by adding a large number of new investments, if performance deteriorates with size it has to be due to increased transaction costs due to a larger position in the securities they hold or organizational diseconomies.
Van Binsbergen et al. (2008) highlight the fact that a decentralized investment management process can generate several misalignments of incentives between the centralized decision maker of the firm (for example the Chief Investment Officer) and the asset manager specialized in a single asset class. They show that designing appropriate return benchmarks can substantially reduce these misalignments.
Studies related to „decentralized investment management‟ and pension fund systems are lacking in the literature. On this topic, Blake et al. (2013) exame the U.K. pension fund industry from 1984 to 2004. Over this time period, most pension fund sponsors shifted from a single-manager (typically „balanced‟) to competing multiple-managers within each asset class.
They find evidence consistent with competition between multiple-managers producing better performance, and the total pension fund risk is lower under decentralized investment management. Although our study is on the same topic, it can be considered an original analysis because of some specific characteristics of Italian pension fund schemes. First, as indicated above, in the case of multiple-managers, the managers employed to manage the asset collected in each investment line are not in competition with each other but rather coact. Second, the global performance and the total risk for each occupational pension fund is not calculated. In fact, as shown in Figure 1, the occupational pension fund is a cap over different investment lines which are separate and independent of each other.
The relationship between nationality and performance has received less attention in the literature. Nationality is open to various definitions. It could refer to one‟s legal status, the identities of one‟s parents, the place of one‟s upbringing, and so on (Brass, 1991). Nationality may determine an individual‟s characteristics, influencing relationships with other people and team members (e.g. in terms of upbringing, religion, education, etc.) (Church, 1982). Eshghi‟s (1985) study established the „nationality bias‟, which can affect the performance of a multinational corporation. According to the author it seems that cultural differences and diversified approaches create a situation where some bias in performance appraisal may exist. Pope and Pope (2015) consider player match data from 12 seasons of the UEFA champions league and referee assignment policies. In the case of player and referee from the same country, the authors demonstrate the existance of own-nationality bias: players officiated by a referee from the same country receive a 10% increase in beneficial foul calls. In the field of management decision-making, Lord and Foti (1986) discuss how nationality affects one‟s cognitive schema, such as knowledge of facts, events and trends, knowledge about alternatives, and knowledge or assumptions about how consequences are attached to alternatives (Maruyama, 1980). Watson et al. (1993) demonstrate that multinational groups outperform homogenous groups in the range of perspectives and alternatives generated. Since strategic decision-making is a task characterized by high complexity, uncertainty and lack of routines, nationality diversity is likely to improve the comprehensiveness and quality of strategic decisions, which in turn influence firm performance.
Here, our concept of nationality is the country nationality of the asset manager Chief Investment Officer (CIO) engaged to manage the asset collected in each investment line. The aim of this paper is to test the following hypothesis:
H: Asset manager nationality affects Italian occupational pension fund performance.
3. Data and Methodology
3.1 The Sample
The sample used in this paper was created from the list of occupational pension funds identified and recognized by the Pension Funds Supervision Commission (COVIP) (a total of 35) at the end of 2007, the year of the introduction of Italian pension reform (Legislative Decree 252/2005) until the end of 20111. The occupational pension funds no longer operating at the end of 2011 (two) were eliminated. For each occupational pension fund, we analyzed
the balance sheets from the years 2007–2011 in order to gather information on: a) the number and the types of investment lines offered in each fund; b) the number of subscribers enrolled and the assets under management for each investment line at year-end; c) the risk level for each investment line; d) the overall benchmark for each investment line and the benchmark assigned to each asset manager in the case of multiple-managers; e) the number of asset managers engaged per investment line; f) the nationality of each asset manager and the nature of the mandate (single or multiple); g) the percentage of the asset under management assigned to each manager according to nationality and h) the annual return for each investment line.
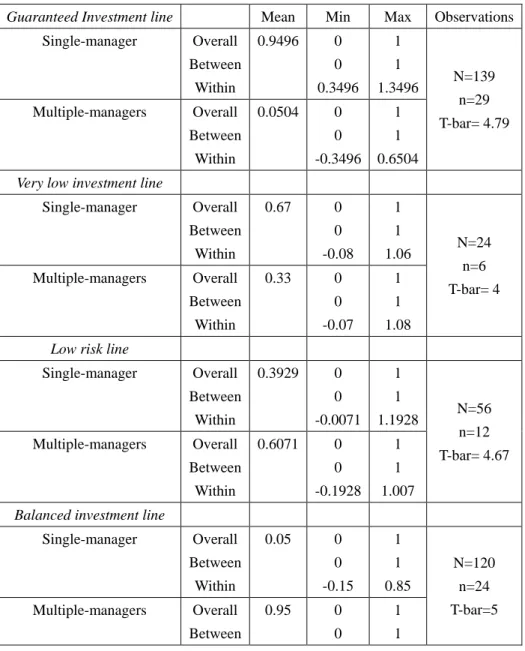
After this selection, of the original 33 Italian occupational pension funds our final sample comprised 28 occupational pension funds. Table 1 describes the sample used in this survey, distinguishing between different investment line risks and divided between single- and multiple-managers.
Table 1. Sample descriptive statistics (N=437, years 2007-2011).
Guaranteed Investment line Mean Min Max Observations Single-manager Overall Between Within 0.9496 0 0 0.3496 1 1 1.3496 N=139 n=29 T-bar= 4.79 Multiple-managers Overall Between Within 0.0504 0 0 -0.3496 1 1 0.6504
Very low investment line
Single-manager Overall Between Within 0.67 0 0 -0.08 1 1 1.06 N=24 n=6 T-bar= 4 Multiple-managers Overall Between Within 0.33 0 0 -0.07 1 1 1.08
Low risk line
Single-manager Overall Between Within 0.3929 0 0 -0.0071 1 1 1.1928 N=56 n=12 T-bar= 4.67 Multiple-managers Overall Between Within 0.6071 0 0 -0.1928 1 1 1.007
Balanced investment line
Single-manager Overall Between Within 0.05 0 0 -0.15 1 1 0.85 N=120 n=24 T-bar=5 Multiple-managers Overall Between 0.95 0 0 1 1
Within 0.15 1.15
Growth investment line
Single-manager Overall Between Within 0.6428 0 0 -0.1571 1 1 1.1429 N=98 n=22 T-bar=4.45 Multiple-managers Overall Between Within 0.3572 0 0 -0.1428 1 1 1.1571
Source: Author‟s calculation
Table 1 shows that a single-manager is engaged mainly to manage guaranteed, very low risk and growth investment lines, while multiple-managers are largely engaged in the case of low risk and balanced investment lines. According to the asset manager distribution highlighted in Table 1, it is not possible to compare single- and multiple-managers‟ activity because they are concentrated in different risk investment lines. For this reason in our analysis we consider two sub-samples related to single- and multiple-managers.
3.2 Methodology
Many studies use the Fama and French (1993) methodology to explain mutual fund (or more rarely, pension fund) performance. The purpose of this paper is not to repeat this kind of analysis for Italian occupational pension funds.
3.2.1 Single-manager
Table 2 presents the main descriptive statistics of the variables used in the survey with reference to single-managers, while the matrix correlation is shown in Table 3.
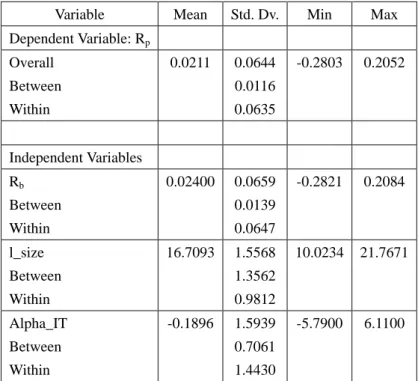
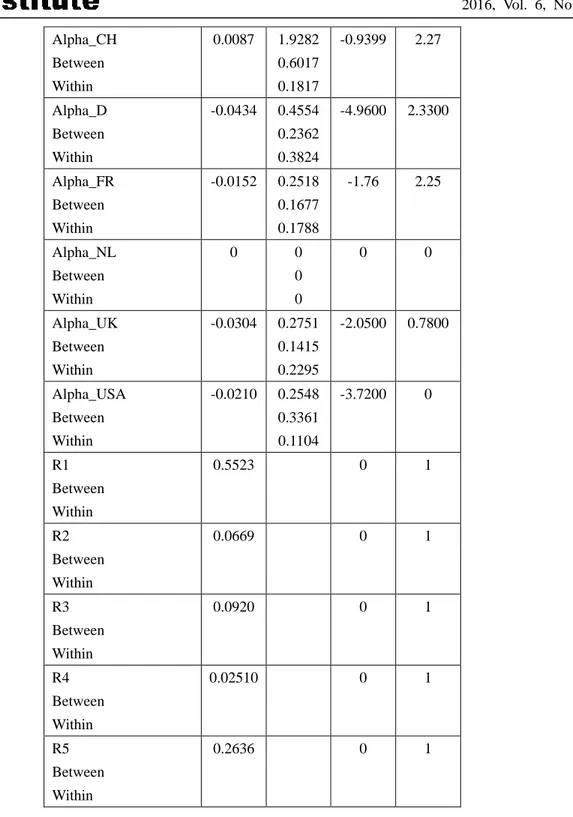
Table 2. Single-manager descriptive statistics (N=243, years 2007-2011).
Variable Mean Std. Dv. Min Max Dependent Variable: Rp Overall Between Within 0.0211 0.0644 0.0116 0.0635 -0.2803 0.2052 Independent Variables Rb Between Within 0.02400 0.0659 0.0139 0.0647 -0.2821 0.2084 l_size Between Within 16.7093 1.5568 1.3562 0.9812 10.0234 21.7671 Alpha_IT Between Within -0.1896 1.5939 0.7061 1.4430 -5.7900 6.1100
Alpha_CH Between Within 0.0087 1.9282 0.6017 0.1817 -0.9399 2.27 Alpha_D Between Within -0.0434 0.4554 0.2362 0.3824 -4.9600 2.3300 Alpha_FR Between Within -0.0152 0.2518 0.1677 0.1788 -1.76 2.25 Alpha_NL Between Within 0 0 0 0 0 0 Alpha_UK Between Within -0.0304 0.2751 0.1415 0.2295 -2.0500 0.7800 Alpha_USA Between Within -0.0210 0.2548 0.3361 0.1104 -3.7200 0 R1 Between Within 0.5523 0 1 R2 Between Within 0.0669 0 1 R3 Between Within 0.0920 0 1 R4 Between Within 0.02510 0 1 R5 Between Within 0.2636 0 1
Source: Author‟s calculation
Table 3. Single-manager matrix correlation.
Rp Rb l_size Alpha_IT Alpha_CH Alpha_D Alpha_FR Alpha_UK Alpha_USA
Rp 1
Rb 0.9656 1
l_size 0.0196 0.0526 1
Alpha_IT 0.0391 -0.2018 -0.1357 1
Alpha_ D 0.0107 -0.0550 -0.0233 -0.0155 0.0044 1
Alpha_FR -0.0529 -0.0873 -0.0071 -0.0073 0.0028 -0.0058 1
Alpha_UK -0.0141 -0.0511 0.0644 -0.0133 0.0051 -0.0107 -0.0068 1
Apha_USA -0.0240 -0.0587 -0.0237 -0.0100 0.0038 -0.0080 -0.0050 -0.0092 1 Source: Author‟s calculation
Table 2 shows that Dutch asset managers are not engaged as single-managers, while Italian asset managers are mainly engaged as single-managers. Moreover, a single-manager is predominant in the case of guaranteed lines. Table 3 highlights the fact that benchmark return has a high and positive correlation with the investment line performance; for this reason we expected a significant and positive correlation in the regression analysis.
In order to test the impact of nationality of asset managers on Italian occupational pension funds, for each investment line (from Risk1 to Risk5; Risk1 identifies the guaranteed line, Risk2 is the very low risk investment line, Risk3 is the low-risk investment line, Risk4 is the balanced-risk investment line, Risk5 is the high-level risk investment line), the panel regression analysis is as follows:
(1)
where a is the constant, Rp is the performance at the year-end of each investment line, Rb is the annual performance benchmark per investment line, l_size is the logarithm of the asset under management (multiplied by 1,000,000) collected per each investment line at year-end, Alpha_AM is the alpha generated alternatively by Italian asset managers, Swiss asset managers, German asset managers, French asset managers, British asset managers, U.S. asset managers for each investment line, and Ti are time dummies (2008-2011).
3.2.2 Multiple-managers
Table 4 presents the main descriptive statistics of the variables used in the survey with reference to multiple-managers, while the matrix correlation is shown in Table 5.
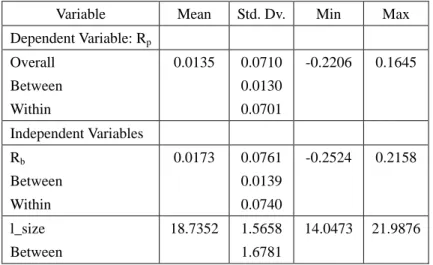
Table 4. Multiple-managers: descriptive statistics (N=194, years 2007-2011).
Variable Mean Std. Dv. Min Max Dependent Variable: Rp Overall Between Within 0.0135 0.0710 0.0130 0.0701 -0.2206 0.1645 Independent Variables Rb Between Within 0.0173 0.0761 0.0139 0.0740 -0.2524 0.2158 l_size Between 18.7352 1.5658 1.6781 14.0473 21.9876
Within 0.4234 N_Managers Between Within 3.3080 1.2709 1.1748 0.4927 2 6 Alpha_IT Between Within -0.2073 1.8420 0.9302 1.6091 -16.7400 4.7500 Alpha_CH Between Within -0.0078 0.3518 0.0635 0.3462 -1.9 3 Alpha_D Between Within -0.0820 0.5124 0.2087 0.4634 -4.67 1.62 Alpha_FR Between Within -0.01292 1.3581 0.6883 1.1663 -16.34 4 Alpha_NL Between Within 0.06454 0.4668 0.2792 0.3680 -1.9 4.39 Alpha_UK Between Within 0.0273 0.1998 0.1619 0.1035 -0.42 2.05 Alpha_USA Between Within 0.0032 0.4705 0.2111 0.4187 -6 1.29 R1 Between Within 0.0353 0 1 R2 Between Within 0.0404 0 1 R3 Between Within 0.1717 0 1 R4 Between Within 0.5758 0 1 R5 Between Within 0.1768 0 1
Source: Author‟s calculation
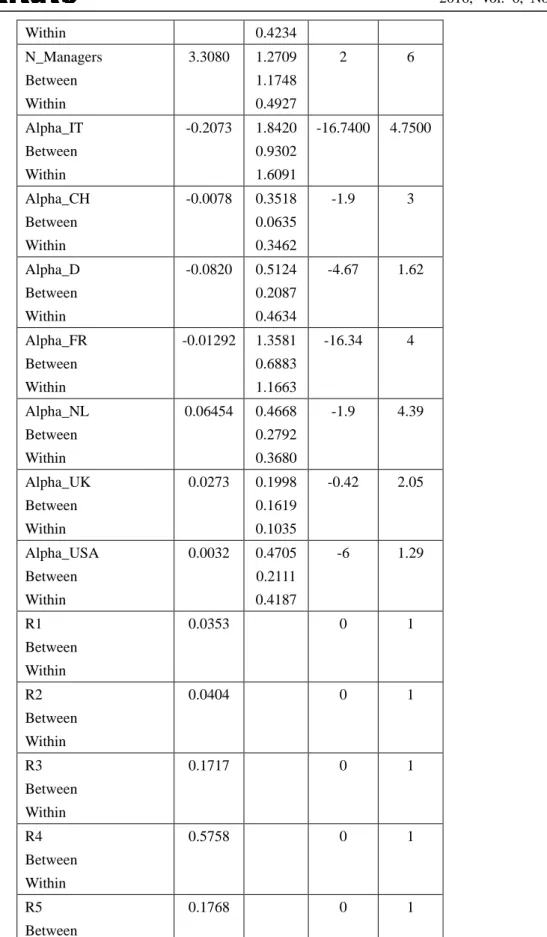
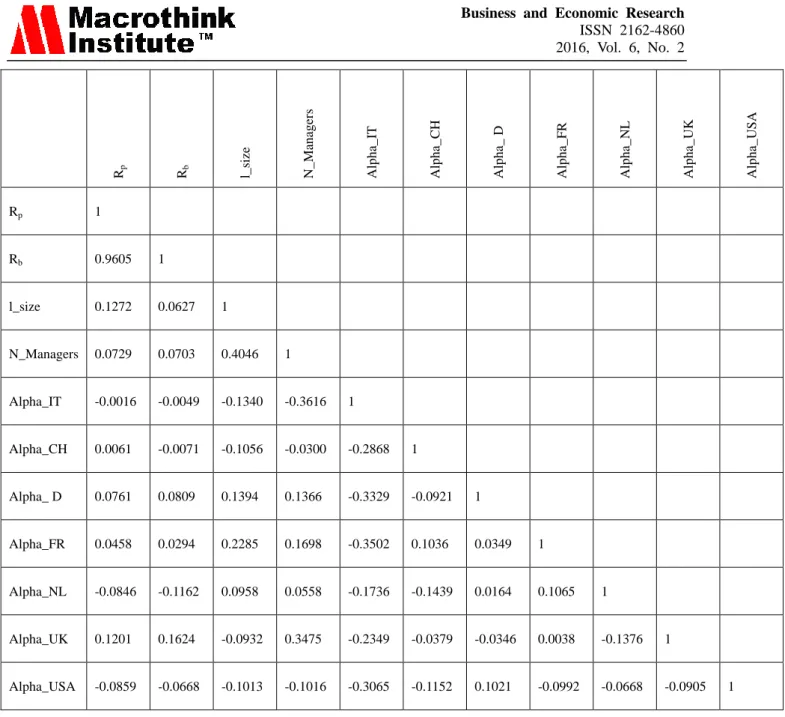
Rp Rb l_siz e N_M ana ger s Alpha_I T Alpha_CH Alpha_ D
Alpha_FR Alpha_NL Alpha_UK Alpha_USA
Rp 1 Rb 0.9605 1 l_size 0.1272 0.0627 1 N_Managers 0.0729 0.0703 0.4046 1 Alpha_IT -0.0016 -0.0049 -0.1340 -0.3616 1 Alpha_CH 0.0061 -0.0071 -0.1056 -0.0300 -0.2868 1 Alpha_ D 0.0761 0.0809 0.1394 0.1366 -0.3329 -0.0921 1 Alpha_FR 0.0458 0.0294 0.2285 0.1698 -0.3502 0.1036 0.0349 1 Alpha_NL -0.0846 -0.1162 0.0958 0.0558 -0.1736 -0.1439 0.0164 0.1065 1 Alpha_UK 0.1201 0.1624 -0.0932 0.3475 -0.2349 -0.0379 -0.0346 0.0038 -0.1376 1 Alpha_USA -0.0859 -0.0668 -0.1013 -0.1016 -0.3065 -0.1152 0.1021 -0.0992 -0.0668 -0.0905 1
Source: Author‟s calculation
Table 4 shows three interesting items: first, the number of asset managers ranges from 2 (minimum) to 6 (maximum); second, the investment lines managed by multiple-managers are mainly in the balanced risk category, and third, Dutch, British and U.S. asset managers on average achieve positive alpha. Table 5 highlights that the benchmark return has a high and positive correlation with the investment line performance; for this reason we expected a significant and positive correlation in the regression analysis.
In order to test the impact of the nationality of asset managers on Italian occupational pension funds, for each investment line (running from Risk1 to Risk5: Risk1 identifies the guaranteed line, Risk2 is the very low risk investment line, Risk3 is the low-risk investment line, Risk4 is the balanced-risk investment line, Risk5 is the high-level risk investment line), the panel regression analysis is as follows:
(2)
where a is the constant, Rp is the performance at the year-end of each investment line, Rb is the annual benchmark performance per investment line, l_size is the logarithm of the asset under management (multiplied by 1,000,000) collected per each investment line at year-end, N_Managers is the number of asset managers engaged per investment line, Alpha_IT is the alpha generated by Italian asset managers for each investment line, Alpha_CH is the alpha generated by Swiss asset managers for each investment line, Alpha_D is the alpha of German asset managers for each investment line, Alpha_FR is the alpha created by French asset managers for each investment line, Alpha_NL is the alpha of Dutch asset managers for each investment line, Alpha_UK is the alpha generated by British asset managers for each investment line, Apha_USA is the alpha of U.S. asset managers for each investment line, and Ti are time dummies (2008-2011).
4. Main Results
4.1 Single-manager
Table 6 presents the results obtained from equation (1). The Hausman test indicates consistent random effect results, and so them only are shown in this paper. The Single-manger is not engaged for the balanced investment line, and so is not presented in Table 6. As expected, Table 6 shows that the benchmark has a positive and significant impact on the investment line return managed by single-manager. In particular, Italian and British asset managers are engaged as single-managers to manage the guaranteed line. The former has a positive and significant impact on the performance achieved while the second has no impact on it. With reference to this specific investment line, Table 6 shows that time dummies are significant. 2008 and 2009, the years of the economic crisis that afflicted all countries after the Lehman Brothers incident, have a positive impact on the guaranteed line performance in the case of both Italian and UK asset managers. This is probably due to the fact that the assets collected in this investment line are invested almost totally in government securities. When the crisis extended to the debts of sovereign states, including Italy, in 2010, British asset managers probably experienced greater difficulty in managing an investment line investing mainly in Italian government securities, so this year has a negative impact on the performance achieved. Despite this, a British manager generates a positive impact in terms of guaranteed line performance achieved.
Considering the very-low risk investment line, when the asset manager is German, the benchmark and the German asset manager‟s ability positively and significantly affect the line‟s performance. In the case of Italian and French asset managers, neither their ability nor the benchmark impacted on the performance achieved.
investment line, and according to Table 6 each of them positively and significantly contributes to the performance achieved by this investment line. The benchmark also has a positive and significant impact on it.
With reference to the higher risk investment line, its performance is positively and significantly affected by the benchmark and by the management ability of Italian and French asset managers. The other asset managers engaged in this investment line (Swiss, German and US) have no impact on it.
Investment line size, in the case of the very-low risk investment line, makes a positive and significant contribution to its performance, while in the case of the very-low risk and high-risk lines it has a negative impact on it.
Bearing these results in mind, with reference to a single-manager, our hypothesis is confirmed: asset manager nationality influences Italian occupational pension fund performance.
Table 6 Single-manager regression results.
4.2 Multiple-managers
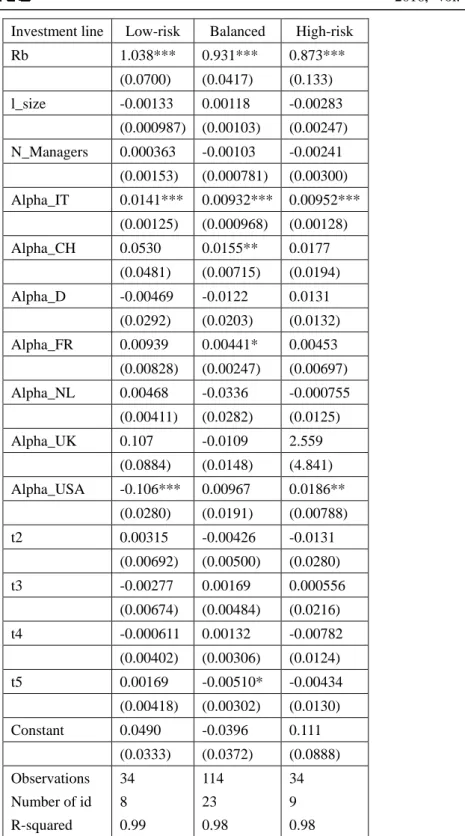
The results obtained by equation (2), related to multiple-managers, are presented in Table 7. The Hausman test indicates consistent random effect results, and so them only are shown in this paper. Multiple-managers are engaged to manage the low-risk, the balanced and the high-risk investment lines.
Investment line Low-risk Balanced High-risk Rb 1.038*** 0.931*** 0.873*** (0.0700) (0.0417) (0.133) l_size -0.00133 0.00118 -0.00283 (0.000987) (0.00103) (0.00247) N_Managers 0.000363 -0.00103 -0.00241 (0.00153) (0.000781) (0.00300) Alpha_IT 0.0141*** 0.00932*** 0.00952*** (0.00125) (0.000968) (0.00128) Alpha_CH 0.0530 0.0155** 0.0177 (0.0481) (0.00715) (0.0194) Alpha_D -0.00469 -0.0122 0.0131 (0.0292) (0.0203) (0.0132) Alpha_FR 0.00939 0.00441* 0.00453 (0.00828) (0.00247) (0.00697) Alpha_NL 0.00468 -0.0336 -0.000755 (0.00411) (0.0282) (0.0125) Alpha_UK 0.107 -0.0109 2.559 (0.0884) (0.0148) (4.841) Alpha_USA -0.106*** 0.00967 0.0186** (0.0280) (0.0191) (0.00788) t2 0.00315 -0.00426 -0.0131 (0.00692) (0.00500) (0.0280) t3 -0.00277 0.00169 0.000556 (0.00674) (0.00484) (0.0216) t4 -0.000611 0.00132 -0.00782 (0.00402) (0.00306) (0.0124) t5 0.00169 -0.00510* -0.00434 (0.00418) (0.00302) (0.0130) Constant 0.0490 -0.0396 0.111 (0.0333) (0.0372) (0.0888) Observations Number of id R-squared 34 8 0.99 114 23 0.98 34 9 0.98 Source: Author‟s calculation
Table 7 shows that the number of asset managers has no impact on the performance achieved. Italian asset managers have a positive and significant impact on each examined investment line‟s performance, while French and Swiss asset managers positively and significantly contribute in the case of a balanced-risk investment line. German, UK and Dutch asset managers have no impact on the performance of the investment line in which they are engaged as multiple-managers.
With reference to the low-risk investment line, a US asset manager has a negative and significant impact on its performance, while he or she positively and significantly affects the results of the high-risk investment line when coacting.
Size has no impact on investment line performance in the case of multiple-managers.
4. Conclusions
The aim of this paper is to verify whether asset manager nationality impacts on Italian occupational pension fund performance. The database used in this paper is a unique dataset with reference to the specific Italian pension fund scheme. The analysis divides the sample in two sub-samples: one comprising Italian occupational pension funds managed by single-managers and the other managed by coacting multiple-managers.
The results obtained highlight several considerations. First, the benchmark (and its performance) affected the results achieved in almost all the investment lines examined, hence revealing the fact that asset managers tend to mirror the benchmark. Second, from an overall point of view, some asset managers contribute to the performance achieved while others never contribute to it. For instance, Dutch asset managers, who are not engaged as single-managers, do not contribute to investment line performance even if they are engaged as multiple-managers. Italian asset managers, on the contrary, have a positive impact on the performance of the investment lines in which they are engaged either as single- or multiple-managers. This is a good result but in part only confirms expectations, taking into consideration the fact that Italian occupational pension funds invest mainly in Italian asset classes. For this reason, a positive contribution to performance due to foreign asset managers such as German, Swiss, French and British single-managers and Swiss, French and US multiple-managers should be further emphasized. Especially in the case of increasing investment line risk, U.S. and British asset managers express their capabilities.
Third, with reference to foreign asset managers, our analysis traces different asset manager capabilities in generating performance when the investment line risk increases or decreases. For example, only Italian asset managers seem to be able to contribute to guaranteed line performance, while a German asset manager is better in the case of very low risk. In the case of a high-risk investment line, Italian and French asset managers seems to be better as single-managers. Recalling our research hypothesis (Asset manager nationality affects occupational pension fund performance), we can say it is confirmed.
To conclude, our analysis generates two questions: 1) as the number of asset managers engaged has no impact on Italian occupational pension fund performance, is it necessary to maintain the multiple-manager approach? 2) bearing in mind the results obtained in this paper, could it be helpful to select asset managers on the basis of their nationality, discarding those who do not generate a positive impact in terms of performance? These could be topics for further research.
1
The data analysis deliberately considers the period 2007-2011 for some important reasons.
lines which had a limited number of members and in other cases have been merged with other types of investment lines. Despite this, from reading the annual reports, the asset manager nationality has not changed over the years. Therefore, take into account a longer period of analysis would lead to two consequences:
a) a reduction in the number of observations; b) a possible dilution of the performance caused by mergers between investment lines with different initially (2007) risk profiles.
For this reason we decided to consider the period 2007-2011 in the aim of maintain the greater informativeness and management continuity.
References
Bar, M., Kempf, A., & Ruenzi, S. (2011). Is a team different from the sum of its part? Evidence from mutual fund managers. Review of Finance, 15(2), 359-396. http://dx.doi.org/10.1093/rof/rfq014
Berk, J., & Green, R. (2004). Mutual fund flows and performance in rational markets,
Journal of Political Economy, 112, 1269-1295. http://dx.doi.org/10.1086/424739
Blake, D., Timmermann, A., Tonks, I. & Wermers, R. (2013). Decentralized investment management: Evidence from the pension fund industry, Journal of Finance, LXVIII(3), 1133-1178. http://dx.doi.org/10.1111/jofi.12024
Bliss, R., Potter, M. & Schwarz, C. (2008). Performance characteristics of individually-managed versus team-managed mutual funds, The Journal of Portfolio
Management, 34(3), 110-119. http://dx.doi.org/10.3905/jpm.2008.706248
Bogan, V.L., Just, D.R. & Dev, D.S. (2013). Team gender diversity and investment decision-making behavior, Review of Behavioral Finance, 5(2), 134-152. http://dx.doi.org/10.1108/RBF-04-2012-0003
Brass, P. Ethnicity and nationalism (1991). Newbury Park: CA: Sage.
Carhart, M. (1997). On persistence in mutual fund performance, Journal of Finance, 52, 57-82. http://dx.doi.org/10.1111/j.1540-6261.1997.tb03808.x
Chen, J., Hong, H., Huang, M. & Kubik, J. (2004). Does fund size erode mutual fund performance? The role of the liquidity and organization, American Economic Review, 94, 1276-1307. http://dx.doi.org/10.1257/0002828043052277
Church, A. (1982). Sojourner adjustment, Psychological Bulletin, 91, 540-572. http://dx.doi.org/10.1037/0033-2909.91.3.540
Eshghi, G. (1985). Nationality bias and performance evaluations in multinational corporations,
Academy Management Proceedings, 93-97.
Fama, E., & French, K. (1993). Common risk factors in the returns on stocks and bonds,
Journal of Financial Economics, 33, 3-56. http://dx.doi.org/10.1016/0304-405X(93)90023-5
Hill, G. (1982). Group vs individual performance: are N+1 heads better than one?,
Psychological Bulletin, 91, 517-539. http://dx.doi.org/10.1037/0033-2909.91.3.517
Holmstrom, B. (1982). Moral azard in teams, The Bell Journal of Economics, 13, 324-340. http://dx.doi.org/10.2307/3003457
Jensen, M.C. (1967). The performance of mutual funds in the period 1945-1964, Journal of
Finance, 23(2), 389-416. http://dx.doi.org/10.1111/j.1540-6261.1968.tb00815.x
Lord, R., & Foti, R. (1986). Schema theories, information pocessing, and organizational behavior. In H. S. Jr, & D. Gioia, The Thinking Organization (p. 20-48). San Francisco: Jossey-Brass.
Maruyama, M. (1980). Mindscapes and science theories, Current anthropology, 21, 589-599. http://dx.doi.org/10.1086/202539
Pollet, J., & Wilson, M. (2008). How does size affect mutual fund behavior?, Journal of
Finance, 63, 2941-2969. http://dx.doi.org/10.1111/j.1540-6261.2008.01417.x
Pope, B., & Pope, N. (2015). Own-nationality bias: Evidence from UEFA champions league football referees, Economic Inquiry, 53(2), 1292-1304. http://dx.doi.org/10.1111/ecin.12180
Prather, L., & Middleton, K. (2002). Are N+1 heads better than one? The case of mutual fund managers, Journal of Economic Behavior & Organization, 47, 103-120. http://dx.doi.org/10.1016/S0167-2681(01)00172-X
Rasmusen, E. (1987). Moral hazard in risk-averse teams, The RAND Journal of Economics,
18, 428-435. http://dx.doi.org/10.2307/2555607
Sah, R., & Stiglitz, J. (1988). Committees, hieratichies and polyarchies, The Economic
Journal, 98, 428-435. http://dx.doi.org/10.2307/2233377
Sharpe, W. (1981). Decentralized investment management, Journal of Finance, 36, 217-234. http://dx.doi.org/10.1111/j.1540-6261.1981.tb00436.x
Stock, R. (2004). Drivers of team performance: what do we know and what have we still to learn?, Schmalenbach Business Review, 56, 274-306.
Van Binsbergen, J., Brandt, M. & Koijen, R. (2008). Optimal decentralized investment
management, Journal of Finance, LXIII(4), 1849-1895.
http://dx.doi.org/10.1111/j.1540-6261.2008.01376.x
Watson, W., Kumar, K. & Michaelsen, L. (1993). Cultural diversity's impact on interaction process and performance: comparing homogeneuos and diverse task group, Academy of
Management Journal, 36, 590-602. http://dx.doi.org/10.2307/256593
Zanjonc, R. (1965). Social facilitation, Science, 149(3681), 269-274. http://dx.doi.org/10.1126/science.149.3681.269
Appendix - Robustness check
According to the matrix correlation shown in Tables III and V, the benchmark return has a strong impact on the Italian occupational pension funds examined in this survey. This situation is confirmed in the regression analysis presented in Tables VI and VII. For this reason, in this section, we would like to check the obtained results considering single- and multiple-managers separately but considering as a dependent variable the excess return (ER) of each investment line calculated comparing the investment line performance (Rp)and the benchmark assigned return (Rb) at the year-end.
Single-manager
In order to test the impact of the nationality of asset managers on Italian occupational pension funds, for each investment line (going from Risk1 to Risk5: Risk1 identifies the guaranteed line, Risk2 is the very low risk investment line, Risk3 is the low-risk investment line, Risk4 is the balanced-risk investment line, Risk5 is the high-level risk investment line), the panel regression analysis is as follows:
(3)
where a is the constant, ER is the excess return comparing the performance of each investment line and the benchmark assigned at the year-end, l_size is the logarithm of the asset under management (multiplied by 1,000,000) collected per each investment line at year-end, Alpha_IT is the alpha generated by Italian asset manager/s for each investment line, Alpha_CH is the alpha generated by Swiss asset managers for each investment line, Alpha_D is the alpha of German asset managers for each investment line, Alpha_FR is the alpha created by French asset managers for each investment line, Alpha_UK is the alpha generated by British asset managers for each investment line, Apha_USA is the alpha of U.S. asset managers for each investment line, and T2, T3, T4, T5 are time dummies (2008-2011). Table 8 shows Regression (3) results.
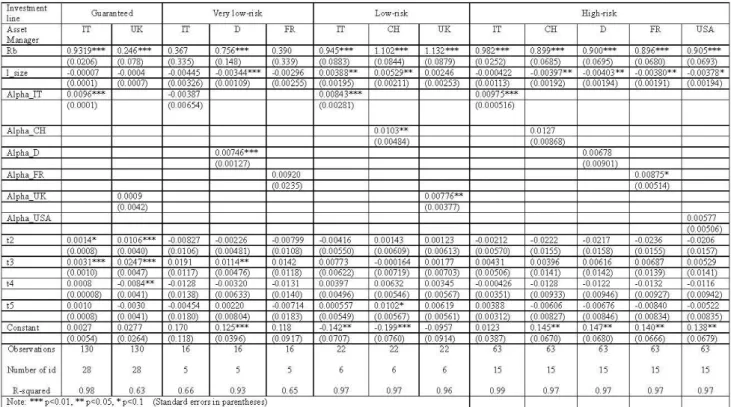
Table 8. Single-manager: regression results
Guaranteed line Very-low risk line Low-risk line High-risk
l_size -0.00220 0.0003 0.00159 -0.000340 (0.00135) (0.000109) (0.00167) (0.00166) Alpha_IT 0.00869*** 0.0102*** 0.00642*** 0.00837*** (0.00115) (0.000218) (0.00179) (0.00110) Alpha_CH 0 0 0.0125*** 0.00323 (0) (0) (0.00308) (0.00696) Alpha_D 0 0.0100*** 0 0.00897 (0) (9.33e-05) (0) (0.00696)
Alpha_FR 0 0.0102*** 0 0.00941** (0) (0.000719) (0) (0.00435) Alpha_NL 0 0 0 0 (0) (0) (0) (0) Alpha_UK 0.0101 0 0.00768*** 0 (0.00710) (0) (0.00242) (0) Alpha_USA 0 0 0 0.00920** (0) (0) (0) (0.00413) t2 -0.0110* -0.000315 0.00519 0.0175*** (0.00635) (0.000347) (0.00332) (0.00664) t3 -0.0106 -0.000561 -0.000290 -0.00353 (0.00691) (0.000443) (0.00375) (0.00673) t4 -0.00975 -0.000463 0.00318 0.00465 (0.00710) (0.000373) (0.00364) (0.00671) t5 -0.00731 -0.000477 0.00568 0.00860 (0.00705) (0.000551) (0.00386) (0.00666) Constant 0.0873* -0.000646 -0.0613 0.00398 (0.0451) (0.00381) (0.0606) (0.0577) Observations Number of id R-squared 129 28 0.39 16 5 0.99 22 6 0.83 63 15 0.67 Note: *** p<0.01, ** p<0.05, * p<0.1
(Standard errors in parentheses) Source: data elaborated by the author
Multiple-managers
In order to test the impact of the nationality of asset managers on Italian occupational pension funds, for each investment line (going from Risk1 to Risk5: Risk1 identifies the guaranteed line, Risk2 is the very low risk investment line, Risk3 is the low-risk investment line, Risk4 is the balanced-risk investment line, Risk5 is the high-level risk investment line), the panel regression analysis is as follows:
(4)
where a is the constant, ER is the excess return comparing each investment line performance and the benchmark assigned at the year-end, l_size is the logarithm of the asset under
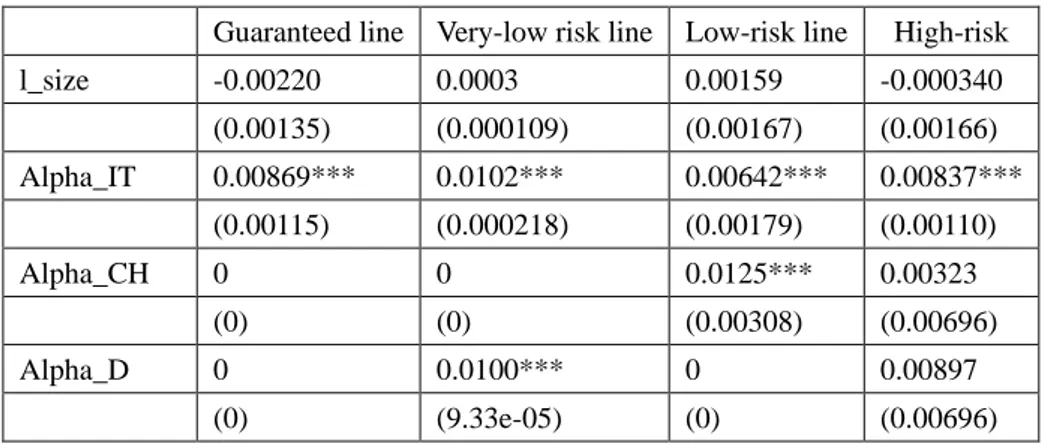
management (multiplied by 1,000,000) collected per each investment line at year-end, the N_Managers is the number of asset managers engaged per investment line, Alpha_IT is the alpha generated by Italian asset manager/s for each investment line, Alpha_CH is the alpha generated by Swiss asset managers for each investment line, Alpha_D is the alpha of German asset managers for each investment line, Alpha_FR is the alpha created by French asset managers for each investment line, Alpha_NL is the alpha of Dutch asset managers for each investment line, Alpha_UK is the alpha generated by British asset managers for each investment line, Apha_USA is the alpha of U.S. asset managers for each investment line, and T2, T3, T4, T5 are time dummies (2008-2011). Table 9 shows Regression (4) results.
Table 9. Multiple-manager: regression results
Low-risk Balanced High-risk l_size -0.00305** 0.000737 -0.00343 (0.00145) (0.00114) (0.00250) N_Managers 0.00165 -0.000811 -0.00235 (0.00229) (0.000867) (0.00304) Alpha_IT 0.0142*** 0.00795*** 0.00970*** (0.00187) (0.00107) (0.00123) Alpha_CH 0.0835 0.00947 0.0263 (0.0714) (0.00788) (0.0195) Alpha_D -0.0400 -0.0140 0.00332 (0.0428) (0.0227) (0.0132) Alpha_FR -0.000896 0.00519* 0.00884 (0.0122) (0.00276) (0.00707) Alpha_NL 0.00776 -0.0533* -0.00460 (0.00610) (0.0314) (0.0122) Alpha_UK 0.0795 -0.0111 4.354 (0.132) (0.0165) (4.878) Alpha_USA -0.117*** 0.00771 0.0199** (0.0420) (0.0209) (0.00795) t2 -0.00655 0.00302 0.0119 (0.00636) (0.00312) (0.0112) t3 -0.00828 -0.00935*** -0.0245** (0.00622) (0.00321) (0.0113) t4 -0.00628 -0.000471 -0.0116 (0.00590) (0.00322) (0.0113) t5 -0.00955 -0.00517 -0.0122 (0.00606) (0.00330) (0.0118) Constant 0.115** -0.0248 0.132 (0.0493) (0.0413) (0.0900)
Observations Number of id R-squared 34 8 0.92 114 23 0.47 34 9 0.85 Note: *** p<0.01, ** p<0.05, * p<0.1
(Standard errors in parentheses) Source: data elaborated by the author
Copyright Disclaimer
Copyright for this article is retained by the author(s), with first publication rights granted to the journal.
This is an open-access article distributed under the terms and conditions of the Creative Commons Attribution license (http://creativecommons.org/licenses/by/3.0/).