U
P
University oUniv
Ph.D. cou
PE
Dr. Vin
of Rome “Tversity
urse in “
EM fu
grid
Supervisorncenzo An
Tor Vergaty of R
Ing. F
“Materi
(c
uel cell
conne
A.A
r:ntonucci
ta”Rome
Francesc
ials for E
cycle XX
l syste
ected
A.: 2008
Ine “To
co Sergi
Environ
XII)
ems an
applic
8/2009
Pro
nstitute CNRor Ve
nment an
nalysis
cations
Directoof. Silvia L
R-TAEergata
nd Ener
for
s
or:Licoccia
a”
rgy”
Your energy could become a precedent for the world
A.P.
I
INDEX
SUMMARY ... II
CHAPTER 1 ... 1
Introduction ... 1
1.1 Introduction on proton exchange membrane fuel cells ... 1
1.2 Introduction to fuel cell systems ... 7
REFERENCES - 1 ... 10
CHAPTER 2 ... 11
PEM Fuel Cell Systems: performances and dynamic behaviour ... 11
2.1 Introduction to the developing and testing of a 5 kW PEM fuel cell system ... 11
2.1.1 Electrical efficiency ... 13
2.1.2 Lifetime ... 13
2.2 Test station and tests performed ... 14
2.2.1 The test station ... 14
2.2.2 The system tested ... 15
2.3 Tests performed ... 20
2.3.1. Start-up ... 21
2.3.2 Characteristic performance curves ... 24
2.3.3 Load-following and response time test ... 25
2.3.4 Endurance test ... 29
REFERENCES - 2 ... 40
CHAPTER 3 ... 41
Performance Degradation in grid connected applications: the effect of ripple current . 41 3.1 Introduction to ripple current noise ... 41
3.2 Fuel Cell System performance under 100 Hz dynamic loads ... 44
3.3 Fuel Cell System performance under dynamic loads with a variable frequency .. 51
REFERENCES - 3 ... 54
CHAPTER 4 ... 55
Material Degradation in grid connected applications: the effect of ripple current ... 55
4.1 Test performed on PEM single cells ... 55
4.2 PEM Single cell submitted to ripple current ... 57
4.3 PEM single cell submitted to a constant load ... 61
4.4 Comparison using physico-chemical characterization ... 63
REFERENCES - 4 ... 67
CONCLUSIONS ... 68
II
Summary
An increase in renewable energy sources (RWE) will bring about a great change in the national electric grid, which will operate intelligently (smart grid) in order to manage the supply of several energy producers and to cover the unpredictability of RWE [1].
Nevertheless, in order to become smart, the future electrical networks need active distributed units able to assure services like load following, back-up power, power quality disturbance compensation and peak shaving.
Fuel cell systems, especially those fed with hydrogen, have reached considerable performance targets in laboratory conditions. Combining high efficiency and fast regulating behaviour (power on demand), even at partial loads and on small size units, PEM fuel cell systems are more and more investigated as components of the incoming power networks.
The aim of this work is to highlight the fuel cells actual performances, their behaviour during grid connected operation and, particularly, the phenomena of materials degradation that can appear in these applications.
At first, the research activity was addressed to the investigation on a developed 5 kW PEM fuel cell system, including the start-up and warm up procedure, the analysis of the dynamic behaviour linked to temperature and load variations.
Accordingly, tests were conducted both on fuel cell systems and single cells in order to compare the performances evaluated with dc and ac loads.
In fact, power drawn by single phase grids contains a low frequency sinusoidal fluctuation that brings a large ripple on the stack output current. The tests on single cells have determined the degradation occurred on catalyst material due to the effect of this kind of dynamic loads.
III Long time tests were performed on 5 kW PEFC system, obtaining a very small decay even operating on the utility grid, by means of a dedicated inverter addressed to minimize the ripple current effect on fuel cell stack.
1
Chapter 1
Introduction
1.1 Introduction on proton exchange membrane fuel cells
Fuel cells are electrochemical devices that convert chemical energy in fuels into electrical energy directly, promising power generation with high efficiency and low environmental impact. Power supplied is a direct current and a variable voltage from a starting value OCV (Open Circuit Voltage) to a minimum value, corresponding to the maximum limit current.
The typical electrical characteristic, the polarization curve, of this kind of generator can be considered as a shifting from its ideal and theoretical potential.
Figure 1-1 Ideal and Actual Fuel Cell Voltage/Current Characteristic [1]
So the lowering of potential, corresponding to the growth of current, is a loss, that can be explained dividing the curve in three region where multiple phenomena contribute to irreversible losses [2]:
• Activation-related losses. These stem from the activation energy of the electrochemical reactions at the electrodes. These losses depend on the reactions at
2 hand, the electro-catalyst material and microstructure, reactant activities (and hence utilization), and weakly on current density.
• Ohmic losses. Ohmic losses are caused by ionic resistance in the electrolyte and electrodes, electronic resistance in the electrodes, current collectors and interconnects, and contact resistances. Ohmic losses are proportional to the current density, depend on materials selection and stack geometry, and on temperature.
• Mass-transport-related losses. These are a result of finite mass transport limitations rates of the reactants and depend strongly on the current density, reactant activity, and electrode structure.
In the V-I diagram, especially for low-temperature fuel cells, the effects of the three loss categories are often easy to distinguish, as illustrated in Figure 1-1.
There are different technologies of fuel cells, depending on the electrolyte material, the reactant gases, etc.
Polymer electrolyte membrane fuel cells (PEFC)are the most suitable for fuel cell technologies in automotive and stationary applications because are able to efficiently generate high power densities.
Hydrogen to the anode and oxygen to the cathode determine a supply of electrical energy with water production as exhaust.
Anode Reaction
3 Figure 1-2 Schematic of the cross section of a polymer electrolyte fuel cell [3].
The current, well-developed PEMFC technology, is based on perfluoro-sulphonic acid (PFSA) polymer membranes (e.g. Nafion_) as electrolyte, and has limitations due to the low temperature of operation, namely; conductivity and water management issues, slow oxygen reduction reaction (ORR), a low tolerance to fuel impurities, e.g. CO and S as well as serious cooling problems and poor heat recovery [3].
The first PEMFC used a polystyrene sulphonate polymer which through its lack of long term stability led to the downfall of the PEMFC in space exploration; the AFC was subsequently used.
However following the invention of the Nafion series of membrane by DuPont, a major breakthrough in PEMFC development occurred. The Nafion membranes consist of a polytetrafluoroethylene (PTFE) based structure which are, not electronically conducting, stable and chemically inert in the oxidising and reducing environment of the fuel cell. The structure of the Nafion ionomer material is shown in Fig. 1-3 [4].
4 Figure 1-3 Structure of Nafion polymer.
The material consists of a PTFE backbone with vinyl ether side chains which terminate with sulphonic acid groups. The PTFE results in hydrophobic regions which may be envisaged as surrounding a hydrophilic zones formed by the clustering of the sulphonic acid groups which attract water, under normal fuel cell operating conditions. These clusters of acid regions are responsible for the high ionic (proton) conductivity of the membrane and thus its use in the PEMFC. The membrane has a relatively small temperature range of stability although in operation the upper limit is dictated by the requirement for humidification. The presence of water is a prerequisite for ionic conduction through the membrane [3].
As a solid phase polymer membrane is used as the cell separator/electrolyte and the cell operates at low temperatures (about 80 °C), sealing, assembly, and handling are less complex than most other fuel cells.
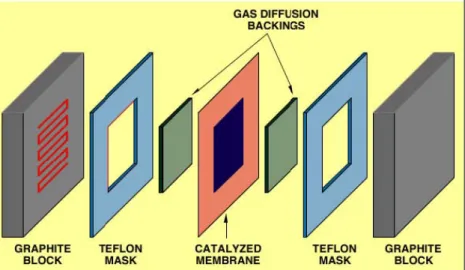
5 Figure 1-4 Single Cell Structure [2]
The cell components within a PEFC stack can be summed as follow: • the ion exchange membrane
• an electrically conductive porous backing layer
• an electro-catalyst (the electrodes) at the interface between the backing layer and the membrane
• cell interconnects and flow plates that deliver the fuel and oxidant to reactive sites via flow channels and electrically connect the cells.
Figure 1-5 PEM Stack (Ballard)
The electrolyte in this fuel cell is an ion exchange membrane (fluorinated sulfonic acid polymer or other similar polymer) that is an excellent proton conductor. The only liquid in this fuel cell is water; thus, corrosion problems are
6 minimal. Typically, carbon electrodes with platinum electrocatalyst are used for both anode and cathode, and with either carbon or metal interconnects.
Water management in the membrane is critical for efficient performance; the fuel cell must operate under conditions where the by-product water does not evaporate faster than it is produced because the membrane must be hydrated. Because of the limitation on the operating temperature imposed by the polymer, usually less than 100 °C, but more typically around 60 to 80 °C. , and because of problems with water balance, a H2-rich gas with minimal or no CO (a poison at
low temperature) is used.
For practical applications, however, operating PEMFCs at higher temperature is desired, both for hydrogen and methanol fuelled cells. When hydrogen is used as a fuel, an increase in the cell temperature above 100 ◦C produces enhanced CO
tolerance, faster reaction kinetics, easier water management, and reduced heat exchanger requirement [5].
Due to operation at less than 100 °C and atmospheric pressure, water is produced as a liquid. A critical requirement is to maintain high water content in the electrolyte to ensure high ionic conductivity.
Maintaining high water content is particularly critical when operating at high current densities (approximately 1 A/cm2) because mass transport issues
associated with water formation and distribution limit cell output. The ionic conductivity of the electrolyte is higher when the membrane is fully saturated: this impacts the overall efficiency of the fuel cell. Without adequate water management, an imbalance will occur between water production and water removal from the cell.
Water content is determined by balance of water during operation. Contributing factors to water transport are the water drag through the cell, back-diffusion from the cathode, and the back-diffusion of water in the fuel stream through the anode. Water transport is not only a function of the operating conditions but also the characteristics of the membrane and the electrodes. Water drag refers to the amount of water that is pulled by osmotic action along with the proton. One
7 estimate is that between 1 to 2.5 molecules are dragged with each proton. As a result, transported water can be envisioned as a hydrated proton, H (H2O) n.
During operation, a concentration gradient may form whereby the anode is drier than the cathode. Under these conditions, there is back-diffusion of water from the cathode to the anode. Membrane thickness is also a factor in that the thinner the membrane, the greater the transport of water back to the anode. The objective of the stack engineer is to ensure that all parts of the cell are sufficiently hydrated, and that no excessive flooding occurs. Adherence of the membrane to the electrode will be adversely affected if dehydration occurs. Intimate contact between the electrodes and the electrolyte membrane is important because there is no free liquid electrolyte to form a conducting bridge. Because this type of degradation is largely irreversible, operation under dry conditions will severely impact membrane lifetime.
Reliable forms of water management have been developed based on continuous flow field design and appropriate operating adjustments. For this reason, flow field designs often feature serpentine channels or unstructured flow passages. The flow-plates (which also serve as bipolar plates) are typically made of graphite, an injection-molded and cured carbon material, or a metal.
If more water is exhausted than produced, then humidification of the incoming anode gas becomes important. If there is too much humidification, however, the electrode floods [6], which causes problems with gas diffusion to the electrode. A temperature rise between the inlet and outlet of the flow field increases evaporation to maintain water content in the cell. There also have been attempts to control the water in the cell using external wicking connected to the membrane to either drain or supply water by capillary action.
1.2 Introduction to fuel cell systems
A fuel cell stack needs a complex system that has to be able: • to start-up
8 • to manage the water content
• to check the temperature
• to shut-down in normal and emergency condition
• to check all vital parameters (voltage cells, hydrogen leakages, current limits, etc.)
• to convert power for the final use
The system around the stack should help guarantying long life and easy operation for the end user.
The link with the final use is the power conditioning system.
Power conditioning is an enabling technology that is necessary to convert DC electrical power generated by a fuel cell into usable DC power for DC loads, AC power for stationary loads, automotive applications, and interfaces with electric utilities [7].
Power conditioning are important for the following applications: • Fuel cell power conversion to supply a dedicated load
• Fuel cell power conversion to supply backup power (UPS) to a load connected to a local utility
• Fuel cell power conversion to supply a load operating in parallel with the local utility (utility interactive)
• Fuel cell power conversion to connect directly to the local utility • Power conversion for automotive fuel cell applications
Various power conversion “building” blocks, such as DC-DC converters and DC-AC inverters, are employed in fuel cell power conditioning systems. Since the DC voltage generated by a fuel cell stack varies widely and is low in magnitude (<100V for a 5 to 10kW system, <350V for a 300kW system), a step up DC-DC converter is essential to generate a regulated higher voltage DC (400V typical for 120/240V AC output). The DC-DC converter is responsible for drawing power from the fuel cell, and therefore should be designed to match fuel cell ripple
9 current specifications. Further, the DC-DC converter should not introduce any negative current into the fuel cell. A DC-AC inverter is essential to provide the DC to useful AC power at 60Hz or 50Hz frequency. An output filter connected to the inverter filters the switching frequency harmonics and generates a high quality sinusoidal AC waveform suitable for the load. The noises due to the low frequency current ripple1 are more dangerous than the switching frequency ones [8]. In fact the back propagation of the ripple current determine, in the facts, a dynamic load for the fuel cell stack.
This phenomenon can damage the fuel cell performance and life time [9].
1 Current ripple is a noise that can born or trough the switching frequency of the power converters (high frequency), or through the frequency grid (low frequency). This kind of noise can affect the dc output of a fuel cell, causing losses in power produced.
10
References – 1
[1] L. Andaloro, M. Ferraro, G. Brunaccini, F. Sergi, V. Antonucci ECS Trans. 17 (1), 673 (2009)
[2] Fuel Cell Handbook, EG&G Technical Services, Inc. November 2004
[3] K. Scott & A.K. Shukla, Reviews in Environmental Science & Bio/Technology (2004) 3: 273–280
[4] Gierke TD & Hsu WY (1982) In: Eisenberg & Yeager HL (Eds.), Perfluorinated Ionomer membranes, ACS Symposium Ser. No 180, Ch13, 283
[5] Silvia Licoccia, Enrico Traversa, Journal of Power Sources 159 (2006) 12–20 [6] W. Vielstich, A.Lamm & H.A. Gastiger Wilkinson DP & St-Pierre J (2003) In: (Eds.), Vol. 3 Handbook of Fuel Cell Fundamentals, Technology and Applications, Part 3, 610–626.
[7] Larminie J & Dicks A (2000) Fuel Cell Systems Explained. Wiley, New York [8] R. Gemmen, Proceedings of the ASME 2001 International Mechanical Engineering Congress and Exposition, New York, NY, 2001.
11
Chapter 2
PEM Fuel Cell Systems: performances and dynamic behaviour
2.1 Introduction to the developing and testing of a 5kW PEM fuel cell system The innovative concept of distributed generation, particularly within a power range of 1–100 kW, is a decisive factor in future energy scenarios. Distributed generation is related to the power production by end-users capable of managing complex and complete services including gas supply, electricity, heat and air-conditioning. This allows to get considerable advantages in terms of costs for both suppliers and end users. Moreover, thanks to the possibility of decreasing transmission loss on the electric grid and drastic reductions in emissions of polluting gases (NOx, SO, CO2, etc.), distributed generation presents
an interesting alternative to the current centralized system of power production. Fuel cell systems ensure both high-conversion efficiency and reduced environmental impact. Therefore, they can be used for on-site generation of power to supply, in part, the ever-increasing demand for micro-generation. Fuel cell systems can support such a future scenario either in the short-to-mid term using natural gas or in the long-term by increasing the exploitation of renewable energy sources.
The objectives of this chapter are to illustrate the architecture and the operation of a 5 kW PEM fuel cell system, developed by Nuvera FC and CNR-ITAE in the framework of a national project, and to focus on both its performance and the main parameters, evaluated in endurance testing.
The present study aims to increase awareness in terms of the reliability, efficiency, and lifetime of current fuel cell systems. As a matter of fact the 5 kW PEFC system can be considered a plug and play pre-commercial product, the findings in this study will highlight both its limits and potential in the mid-to-long term for large-scale application of PEM fuel cell systems.
12 There are three main parameters that characterize the quality of a fuel cell system. The first and most important is efficiency. This parameter is easy to define; furthermore, several guidelines are available for its assessment. The second parameter is the performance in terms of power density. The third aspect is related to the decay in performance of both the stack and the whole system. These three parameters are the main features a customer usually needs to consider in terms of the investment profitability of FC systems compared to other technical solutions available. However, a good stack performance is not only related to a high power density but also to the capability to operate in terms of load following and reliability to duty cycles.
In this study, standard methods described in fuel cell literature are used to identify the two main parameters as well as additional parameters such as response time and self-operating capabilities, the latter meaning the capability of reducing human intervention.
The cost of the systems is not a distinct parameter, as both costs linked to the construction of such systems and costs to end-users are inextricably connected to political and other wide-ranging choices that require more accurate and detailed study.
For all the above mentioned reasons a series of tests have been conducted in order to identify the features and drawbacks of the PEFC system operating under real conditions: extremely variable loads, electric grid integration, indoor and outdoor operations. The goal is to develop a durable and reliable system that can be commercialized in the short-medium term. In the following paragraphs, test results of a 5 kW polymeric electrolyte fuel cell system under real dwelling load conditions are reported. To achieve this, it was necessary to define the main parameters first.
13
2.1.1 Electrical efficiency
There are numerous definitions of electrical efficiency, from among which the ASME PTC-50 standard (fuel cell performance test code) was chosen, for it resembles most the approach taken in this study.
Eq. (1) is one in which En is the net electrical energy generated by the system (equivalent to that generated by the fuel cell stack without energy used by the ancillaries) and Q total is the primary energy provided by hydrogen, corresponding to its low heat value (LHV), including:
• chemical energy + pressure level + thermal energy of the fuel; • thermal energy of any external fluid, including co-generation; • pressure level and thermal energy contained in the air feed;
• any other form of energy (i.e. mechanical work) from an external source.
2.1.2 Lifetime
Nowadays, one of the main targets in the performance of fuel cell systems is considerable lifetime, both for stationary and automotive applications.
According to its use, a system’s lifetime may vary. For stationary applications, the target is 40,000 working hours with an acceptable decline in performance. Currently, such performance levels are rarely guaranteed by operating systems in real (not in laboratory) applications and have been declared, to date, almost exclusively by Plug Power [1]. Obviously, the lifetime of a fuel cell stack is strictly linked to how it is worked. Although in literature it is possible to find lifetimes between 4000 and 13,000 h with a decay rate ranging from 0.5 to 6µVh−1 [2,3] in steady-state conditions, when more severe working conditions are
applied (with extremely stressful load profiles), the rates drop drastically, as low as 600 working hours with a decay-rate of 120 µVh−1 [4]. Nuvera claims a decay in
performance of 2.6 µVh−1 cell−1 in steady-state conditions and of 51–52 µVh−1 cell−1 Eq.(1)
14 under particularly stressful conditions (accelerating tests) of 30 cycles h−1 [5].
Nevertheless, in the literature there is no common parameter to define lifetime. Usually, the parameters used do not specify the type of application or the loads the systems tested were submitted to; therefore, necessary information is lacking. This said, there are no standards to identify the decay in performance of other competitive technologies as well, such as gas turbines and internal combustion engines.
In this study, both the voltage decay of each single cell under constant load conditions and variations in the polarization curve of the stack over time were the parameters set to make a comparison with current findings. A decrease in performance can be both unrecoverable and recoverable. In the former case, the condition is transitory and starting-level performance is regained as soon as optimal working conditions are restored; in the latter, the decay is permanent.
2.2 Test station and tests performed
2.2.1 The test station
Due to the amount of hydrogen necessary for endurance tests, the test bench is comprised of a hydrogen-production system in addition to equipment for testing data acquisition.
The system in Fig. 2-1 a) is an alkaline electrolyzer, useful for continuously feed the system being tested with pure hydrogen (i.e. simulating the hydrogen supply from a public grid).
15 Figure 2-1 a) Alkaline Electrolyzer; b) Test Station
The system in Fig. 2-1 b) manages data acquisition, simulation of electrical loads, and safety features (sensors for hydrogen, temperature, etc.), all of which can be controlled and monitored remotely through ADSL.
The management software, developed in a LABVIEW environment, allows the management and recording of data characteristic of the device being tested, from among which the following are most important:
• stack and single cell voltage; • current generated;
• input and output gases and deionized water temperatures; • a count of working hours;
• energy produced;
• hydrogen actually consumed.
The two last parameters are absolutely necessary in determining the efficiency of the system studied.
2.2.2 The system tested
The device being tested (Fig. 2-2) is a polymeric electrolyte fuel cell system able to supply power within a range of 0–5 kW and to start up and shut down automatically (plug-in) [6].
16 Figure 2-2 5 kW PEM Fuel Cell System developed
Because fuel cells are electrochemical generators that turn chemical energy contained in feeding fluids (hydrogen, methanol, natural gas, etc.) into electricity in a direct current, they are similar to electrochemical accumulators (i.e. lead acid batteries). Unlike previous FC systems to which fuel was fed from an external source, which meant autonomy was dependent on size, in this case autonomy does not depend on the size of the device. The generation of electric power occurs, therefore, without the movement of mechanical components. This leads to a high level of electrical efficiency. Nevertheless, the fuel cell stack must be provided with a far more complex system in order to work. The whole system can be described as follows:
The stack (XDS-900) component of the system is comprised of: • 40 in-series cells with bipolar steel plates;
• an active area of 500 cm2;
• MEA (Membrane Electrode Assembly) built on commercial products and in-house formulations of the anodic and cathodic electrocatalysts;
• platinum cathodic loading between 0.4 and 0.6 mg cm−2;
• variable working temperatures (between 65 and 80 ◦C);
• maximum current of 400 mA cm−2;
• _a (stoichiometric anodic gas coefficient) of 1.05;
17 A control and diagnosis board, thanks to numerous sensors that constantly provide a reading of all operational parameters necessary for management and safety, manages the functions of ancillaries (Balance of Plant).
The stack works in dead-end mode, the anode compartment is closed by a timed-valve that purges it to eliminate water produced by oxygen crossover from the cathode to the anode and migrated to the anode, due to the concentration gradient. An in-house system ensures the recirculation of purged hydrogen increasing the fuel utilization factor considerably.
As known, proton conduction (H+) within membranes is ensured by the presence of a precise amount of water. In the evaluated stack, this conduction was ensured by the water produced and the liquid water injected into the cathode from an external loop by a pump. The injected water also cools the cells that the stack is composed thanks to the latent heat absorbed during the water evaporation. In this way, two goals were achieved: (1) water still present in the anode decreased and (2) as a result, the necessity of anodic purges was reduced, thereby ensuring a more homogeneous humidification of the stack. Among active cells, in fact, some were dedicated to an air-feed humidification of the stack and, as they were homogenously distributed throughout the stack, a constant amount of water was assured.
The Balance of Plant, that assures stack operations, is composed of: • an air blower;
• a pump for water circulation;
• a fan to chill and condense re-circulated water coming out the stack’s cathode;
• a loop for off-anode hydrogen recirculation.
The blower feeds filtered air to the cathodic inlet, while hydrogen is fed at a pressure of 1.7 bar abs into the anodic inlet. The water used for humidifying and cooling, together with water produced by the electrochemical reaction on the cathode side, comes out condensed through a heat exchanger (air-water) using an appropriate fan to chill it. The water in liquid state is stored in a tank under the
18 heat exchanger (storage tank). After a deionizing stage that ensures a water conductivity of less than 5 µS cm−1, a pump picks up the water from the storage
tank and puts it in the cathode side to humidify the membranes and chill the cells of which the stack is composed.
All the ancillaries are powered by the FC stack except during the start-up and shut-down phases; in these cases an external power source provides the necessary supply. All functions are automated and managed by an electronic control board in accordance with optimal algorithms that take into account the main functional and safety parameters (temperature, pressure, cell and stack voltage, power and current produced).
Another peculiar feature is the management of ancillaries.
Unlike what is reported in literature, during ordinary operations, the air blower, the water recirculation pump, and the fan work at only two pre-determined operational power levels. This means the water and air necessary for the stack operations are not proportional to the current generated (variable stoichiometry), and in every case is more than what would be considered optimal. This implies inefficient consumption by ancillaries and affects overall efficiency, which should be better. However, this implies further that the ancillaries do not affect response time even at high-load variations because there is no relevant variation in the power supplied to the ancillaries [3].
Finally, for a grid connection or the use of electricity generated in residential units, a modification of the system’s characteristic parameters through a power-conditioning device (inverter) is necessary.
In fact, the fuel cell system produces electricity at a direct current within a voltage range of 40–26 V. A downstream inverter has to generate a voltage of 230 Vac-50 Hz (European grid). Nevertheless, for tests, a DC/DC converter (step up double half bridge H) was used to regulate and stabilize voltage at 48 Vdc in order to supply direct loads.
19 Figure 2-3 5kW DC/DC Step up Converter
Figure 2-4 DC/DC Electrical Scheme
In the second stage of tests, an inverter was used as well, and the electrical power produced was provided to the grid, thus showing operation under such conditions was possible.
20
Input (DC) DHF-1AC- 5000W/LV
Nominal voltage (V) 36
Voltage range (V) 30 ... 75
Nominal current (A) 140
Max. current (A) 160
Current limitation (A) 180
Current ripple (APk-Pk) < 1.0 Current rate of change (A/s) 33
Max. power (W) 6000
Output (AC) DHF-1AC- 5000W/LV
Nominal voltage (V) 230
Voltage range (V) 195 ... 265
Max. "gross" current (A) 28.0
Max. connector current (A) 23.0
Max. power (W) 5800
Max. connector power (W) 4800
Power factor 0.99
Frequency (Hz) (automatically synchronized) 50 + 0.1 or 60 + 0.1
Efficiency (%) > 88.5
Protection 250 V 30 A / fast acting
DC Aux Output DHF-1AC- 5000W/LV
Voltage (V) 24
Current (A) 40
Power (W) 1000
Table 2-1 DHF-1AC-5000W/LV Characteristic
2.3 Tests performed
The tests performed allowed a characterization of the system, its durability both under continuous working conditions and extreme variations of loads. Levels of efficiency, since operating conditions changed as a function of time elapsed, were recorded as well.
Experiments to determine the main features and their performance were carried out according to FCTESTnet protocol [5]:
• start-up;
• stack polarization curves and system’s performance curves; • load-following and response time;
21
2.3.1. Start-up
The start-up time is a fundamental parameter particularly for UPS applications. As a matter of fact, an Uninterruptible Power Supply, in emergency mode, have to be ready to supply the preferential load. So it is useful well know the time of intervention and, eventually, the strategies needed to assure the load, if this time is too long.
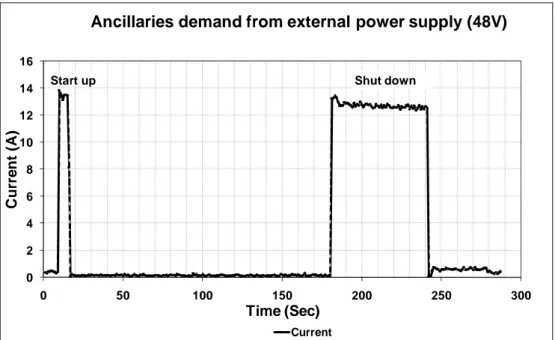
Results showed the necessity of an external power source to supply both the control board and ancillaries during start-up and shut-down operations. In these stages, the system requires a current of about 13.5 A (P=648 W) from an external source (as the stack is not yet producing).
0 2 4 6 8 10 12 14 16 0 50 100 150 200 250 300 Cu rr e n t (A ) Time (Sec)
Ancillaries demand from external power supply (48V)
Current
Start up Shut down
Figure 2-6 External Supply for Start-up and Shut-down
The minimum time needed by the FC system to generate power is ever 7 seconds. In fact, at the end of start up, the stack shows a potential of 40 V, so the ancillaries are supplied directly by the stack.
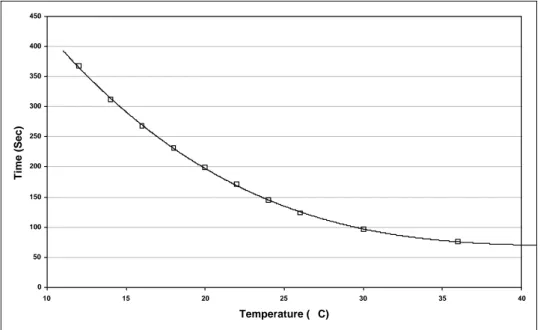
Following the start-up stage, in producing the power required the system warms up reaching a fixed working level with an output of cathodic gases at a temperature of 38 ◦C. Tests were done at different temperatures using a climatic
22 This stage lasts from a minimum of 80 s (with room temperature (humidification/cooling) at 40 ◦C) to a maximum of about 370 s, with a
corresponding water temperature of about 10 ◦C (Fig. 2-7), setting the load
demand to the maximum available during warm-up (2,5 kW) ; the maximum power (5 kW) is available after warm up. This limit is imposed to assure a sufficient humidification to the membrane according to the power demand.
0 50 100 150 200 250 300 350 400 450 10 15 20 25 30 35 40 Temperature ( C) Time ( S ec)
Figure 2-7 Warm-up Time vs Temperature @ 2,5 kW load
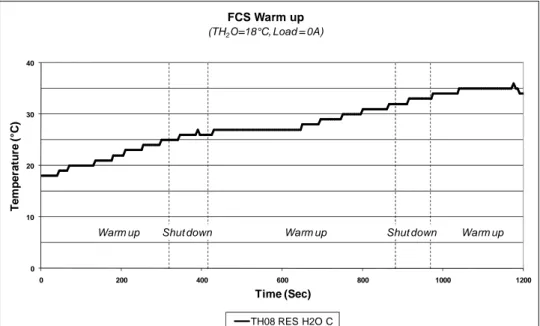
The warm up time depends on the load demand as well. In fact if no load is requested, it’s only the internal resistance to warm up the stack and it is not sufficient. In the following figure it is reported the failed warms up starting from a water temperature of 18 °C and without load demand.
23 0 10 20 30 40 0 200 400 600 800 1000 1200 T e m p er at u re ( °C ) Time (Sec) FCS Warm up
(TH2O=18°C, Load = 0A)
TH08 RES H2O C
Warm up Shut down Warm up Shut down Warm up
Figure 2-8 Warm-up (TH2O=18°C, Load = 0A)
Another test demonstrates the a little better warm up when a 20 A load is requested (about 650 W), despite the water temperature starts from a lower value (14 °C). 0 10 20 30 40 0 200 400 600 800 1000 1200 1400 Te m p e ra tur e ( °C ) Time (sec) FCS Warm up (TH2O=14°C, Load=20A) TH08 RES H2O C Warm up Shut down Warm up Shut down Warm up Normal Operation
Figure 2-9 Warm-up (TH2O=14°C, Load = 20A)
In this case the system, after about 20 min and two failed warms up, reaches the normal operation status.
24
2.3.2Characteristic performance curves
The operational curve characteristic of a stack (polarization curve) illustrates the device’s performance unambiguously. The curve of the fuel cell stack in the system tested is shown in for single cell is shown in Fig. 2-10.
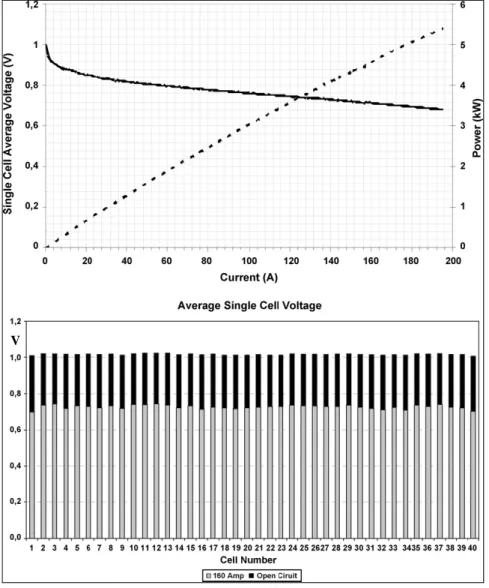
Figure 2-10 Single Cell Polarization Curve and Single Cell Voltage Distribution @ 160A load
It demonstrates how the stack works down to a minimum voltage (0.65 V cell−1). This limit is well-suited for high levels of electrical efficiency and a decrease
in stress on the cell’s materials, thereby ensuring longer durability.
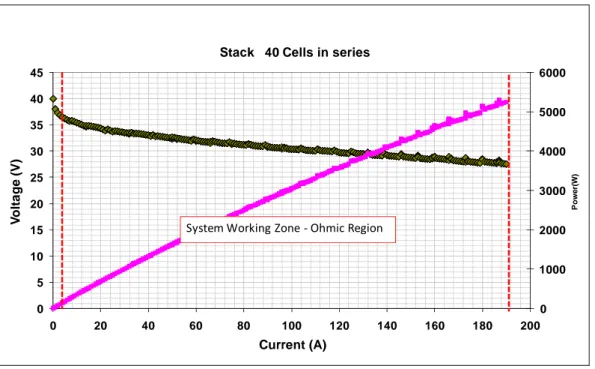
25 0 1000 2000 3000 4000 5000 6000 0 5 10 15 20 25 30 35 40 45 0 20 40 60 80 100 120 140 160 180 200 Po w e r( W ) Vo lt a g e ( V ) Current (A) Stack 40 Cells in series
System Working Zone ‐ Ohmic Region
Figure 2-11 System Working Zone
The whole system works only in the ohmic region zone because under 0.6 V the system shuts automatically down, while the range between 40 V and 36 V is occupied by the ancillaries. Therefore the system working zone is in the range between 36 V and 26 V.
2.3.3 Load-following and response time test
According to FCTESTnet TM PEFC ST 5.5 protocol (Testing the transient response of a PEFC stack), the system was tested to ensure operation in load-following mode. For this, pulse load tests were performed with 0−x% load steps, verifying both the stack and DC/DC behavior (Fig. 2-12).
As shown in Fig. 2-12, there are no relevant variations in regulated voltage (48 Vdc) after the power conditioning device; this ensures the level of efficiency required for response.
26
FCS Load Pulse Response (Regulated Voltage=48,9V) 0 5 10 15 20 25 30 35 40 45 50 55 0 200 400 600 800 Time (Sec) V o lt age ( V ) 0 50 100 150 200 250 C u rre n t ( A )
DC-DC Voltage Stack Voltage Load Current
Figure 2-12 Fuel Cell System Load Pulse Response
This parameter is closely related to the design of the regulator and is usually studied in dedicated projects, the aims of which are both to improve the quality of power (in terms of output power parameters) and to avoid the influence of power conditioning devices on the stack’s performance.
In order to evaluate the response times of a fuel cell system without power conditioning devices, the transient generated by power variations was studied using an oscilloscope (Agilent DSO 6032A).
To determine the system’s response a fall time 2 was used. In electronics, this
parameter is the time required for the amplitude of a pulse to decrease (fall) from a predetermined level (generally 90% of maximum excursion) to another level (typically 10% of maximum range).
2 fall time (pulse decay time) is the time required for the amplitude of a pulse to decrease (fall) from a specified value (usually 90 percent of the peak value exclusive of overshoot or undershoot) to another specified value (usually 10 percent of the peak value exclusive of overshoot or
undershoot). Limits on undershoot and oscillation may need to be specified when specifying fall time limits.
27 Unregulated Voltage Load Power 0-5kW 24 26 28 30 32 34 36 38 1,50 2,00 2,50 3,00 3,50 4,00 4,50 5,00 Time (sec) Un re g u la te d Vo lt a g e (V ) Unregulated Voltage (V) 10% 90%
Fall Time = 0,1 sec
Figure 2-13 Single Pulse Response
The system had a response time of about 100 ms at the highest stress levels (0–5 kW) (Fig. 2-13).
The fall-time obtained for the system tested is reassuring, especially when compared to other electrical devices already established on the market, i.e. batteries, as it shows the ability of FC devices to compete in terms of performance today. Also, its ability to respond to extreme variations in stress shows excellent potential for supplying residential and strongly variable loads. The slight oscillation of voltage after the transient is due to the intervention of the second working stage of the blower (ancillary). In fact when the system works up 4,5 kW more air is need for the reaction and so the blower, that is a load for the stack, causes a little temporary voltage decrease.
Usually, in case of high power load peaks, but much lower average power, hybrid systems are of special interest [7]. A small battery with a high peak power capability can be used for peak shaving.
Other applications, where long periods with low power demands and also periods with medium or high power exist are also of interest. In this type of application the load is operated by the battery and the fuel cell is only used to recharge
28 the battery if the state-of-charge is going below a minimum level. Another possibility is to guarantee a full recharge by use of an auxiliary energy source (in this case a fuel cell). This periodical recharge prevents sulphation. Typical applications are solar systems and SLI batteries. In case of solar systems it is assumed that a frequent full recharge can increase the typical battery lifetime [8].
Indeed, the fast response obtained with the developed system, can be used for fast recharge in hybrid applications (also automotive), extending the range to other kind of batteries as well (e.g. Lithium Ion).
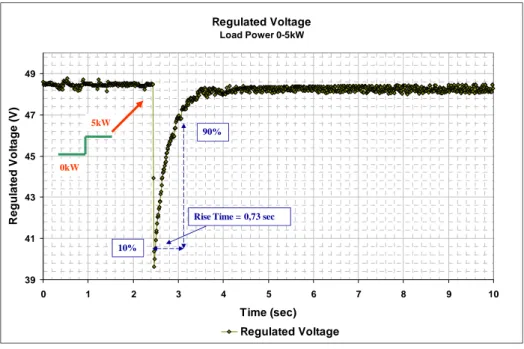
Nevertheless, in the case of regulated voltage by the dc/dc converter, if a zoom in the transient zone is done, it is possible to notice a major delay due to the inertia of the cascading of the dc/dc converter and fuel cell system.
Regulated Voltage Load Power 0-5kW 39 41 43 45 47 49 0 1 2 3 4 5 6 7 8 9 10 Time (sec) R e gul at ed V o lt a g e ( V ) Regulated Voltage 90% 10%
Rise Time = 0,73 sec 0kW
5kW
Figure 2-14 Single Pulse Response @ regulated 48 V
The dynamics of fuel cell system and of the dc/dc converter sums themselves, determining a rise time of 0.73 s. As a matter of fact, at first the system responses at once, causing an immediately decrease of the voltage. Then the dc/dc converter starts to regulate, increasing voltage to the fixed value of 48 V (regulated voltage).
29
2.3.4 Endurance test
Although the performance of the fuel cell system studied was wholly satisfactory, one of the main obstacles to commercialization is the actual lifespan of such devices. Therefore, according to FCTESTnet TM PEFC SC 5.7 (Testing
voltage as a function of current density following a dynamic profile versus time) and
ASME PTC 50, endurance tests of the system were conducted, reaching the first target of 1000 h for a total amount of 3500 kWh produced.
Three identical 5 kW fuel cell systems were used so the tests were divided into three stages: the first one in which the device was working under a load-following conditions and in which were developed performance tests; the second at constant power to verify the decay-rate in steady-state conditions, the third in grid connected configuration.
Residential load
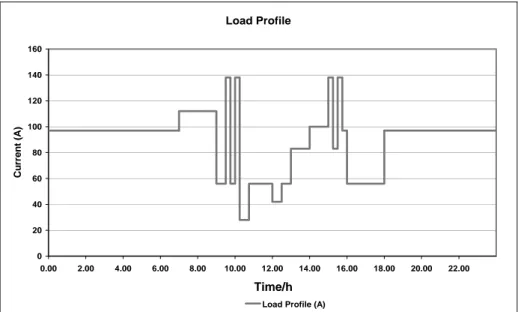
Varying electrical loads means stress, regardless of what kind of generator is used, i.e. internal combustion engine, micro-turbine, or fuel cell systems. Variations in the speed of mechanical components in terms of the rate at which heat is generated in a kinetic reaction of reagents implies that mechanical stress on materials results in reduced efficiency over time. In order to be competitive in their own markets, new generation devices, among these fuel cell systems and micro-turbines, must demonstrate a durability comparable to that found in consolidated technologies like ICE. To assess the current state of art, the system developed in earlier stages of design was submitted to variations in load profiles, very close to a residential application’s (Fig. 2-15) with 24-h cycles. The only down-times were those necessary for ordinary or out-of-the-ordinary maintenance procedures.
30
Load Profile 0 20 40 60 80 100 120 140 160 0.00 2.00 4.00 6.00 8.00 10.00 12.00 14.00 16.00 18.00 20.00 22.00 Time C u rr e n t (A )
Load Profile (A)
Figure 2-15 Load Profile during test
In this study, load variations are included in the whole working range of the system, with instant variations of up to 100% of optimal power.
The system generated power with an average efficiency of 55% and a capacity factor of 74%. The capacity factor is the ratio of the average power generated to the peak power of the device; it is useful in determining how the system can be used most effectively.
The tests allowed an outline of the performance of the main parameters, which is shown in Tab. 2-2.
Table 2-2 Main parameters for the endurance test results
Critical parameters found after the first 1000 working hours were linked, primarily, to components of the ancillaries and, to a lesser degree, to a decline in
31 the performance of the stack. 70% of failures were attributed to electronics and 30% to ancillaries (deionization cartridge and air compressor). After the first 150 h of operation, the stack was damaged by deionizing resin released from the broken cartridge, so both the air compressor and stack were repaired. Once restored to correct working order, the system was again submitted to test cycles.
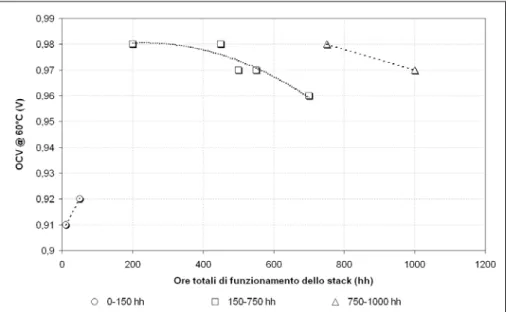
Upon reaching 1000 working hours, no significant decline in the overall performance of the system was observed. This can be seen in Fig. 2-16, in which OCV levels (Open Circuit Voltage) of the fuel cell stack versus hours in operation are shown.
Figure 2-16 Open Circuit Voltage Decay
During the first stage (0–150 h), the stack already showed OCV levels that were lower than those recorded after removing the deionizing resin.
During the second stage of the experiment, higher and slightly variable OCV levels were recorded over time, showing that a reduction in the system’s level of performance is reversible and most likely linked to the flooding and swelling of membranes. A sufficiently long pause always ensures restoration to original levels of performance. In the Fig. 2-16, OCV decreases in tests that are conducted continuously between 150 and 750 h, that is, without start-stop cycles; however,
resto 50 h Cons Fig. show disap oration to o between t stant load This tren 2-17, a tes wn. It is evid ppears as s original O the two tes
nd was not st perform dent that at soon as the Figure CV levels sts. ticed even med at the t a constan e system is 2-17 System is recorde n during st constant p nt load, th s turned of m Voltage d d after a p tart-stop c power of 3 he voltage ff and on a during 500 period of st cycles in ra 3.7 kW wi decay of t gain. hours test topping fo apid seque ith 175-h c the fuel ce 32 or about ence. In cycles is ell stack
in b duri the vers othe with mini This tran both the ca
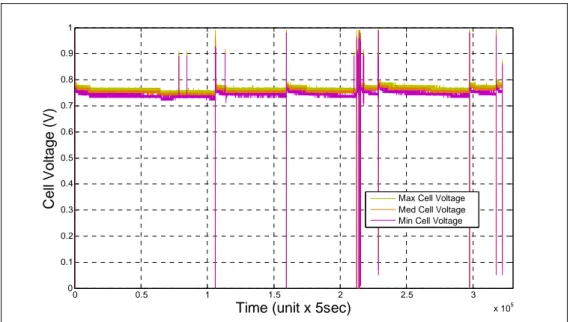
ing the star water man ion of this The deca er authors t h pulsed an In the fol imum (Min Figure nsient phen athode an rt-up stage nagement device. ay rate is q taking into nd steady l llowing fig n) cell volt 2-18 System nomenon c d anode ( e through e system cu quantified i o account t loads [2–5] gure is sho tage during m Current d can be link (flooding). extended p urrently u in 40 µV h that tests o ]. own the m g the endu during 500 ked to the Such flood purges, sug under deve h−1 Cell−1, s on the FC s maximum urance test hours test presence o ding is, in ggesting an elopment similar to d ystem wer (Max), me . of excessiv n fact, elim n improve for an ad data publis re conduct edium (Me 33 ve water minated ment to dvanced shed by ted both ed), and
34 0 0.5 1 1.5 2 2.5 3 x 10⁵ 0 0.1 0.2 0.3 0.4 0.5 0.6 0.7 0.8 0.9 1
Time (unit x 5sec)
C e ll V o lt a g e ( V )
Max Cell Voltage Med Cell Voltage Min Cell Voltage
Figure 2-19 Single Cell Voltage during 500 hours test
The flooding effects cause, together with the stack design, an unhomogeneous voltage profile for the single cells. The single cells voltage was measured thank to a CVM (Cell Voltage Monitoring) able to capture double cell voltage. The data was processed, obtaining as media.
Calculated Efficiency
All power generators, including fuel cell systems, demonstrate efficiency as a function of load; this varies, accordingly, to typical profiles of specific technologies. Fuel cells, nevertheless, are generally evaluated at a constant level of efficiency even if loads vary. This is true only if the efficiency of the stack alone (without its ancillaries) is taken into account, in a range of 30% - 70% of its optimal load. Efficiency, therefore, is also inextricably connected to the type of application to which an energy device is dedicated.
There is a considerable difference between theoretical efficiency (computed according to the most common equations in literature) and the system’s efficiency computed using Eq. (1). This is caused primarily by high levels of consumption as a result of ancillaries and anodic purges that reduce hydrogen utilization. The system efficiency curve is showed in Fig. 2-20.
35
System Electrical Efficiency
0% 10% 20% 30% 40% 50% 60% 0 1000 2000 3000 4000 5000 Power (W) Efficiency (% ) System Efficiency Ancillaries demand equal to load demand
Maximum net efficiency
Ancillaries Mean Power
350W 520W
Figure 2-20 System Electrical Efficiency
It demonstrates how actual efficiency varies considerably with low loads but remain generally constant at 50% (according to hydrogen LHV) when power levels are between 2.5 and 5.0 kW [9]. The aggregate power consumption for the ancillaries is 350 W and 520 W for the two operating steps.
0 2 4 6 8 10 12 14 0 1000 2000 3000 4000 5000 6000 7000 8000 9000 10000 11000 12000 0 2000 4000 6000 8000 10000 A n ci ll ar ies C u rr ent (A ) Pow e r( W ) Time(sec)
Ancillaries Current Loss
Load Power (W) Ancillaries Current (A)
Startup 1.5kW 2.5kW 5kW Power Loss = 350W Power Loss = 520W
36
Grid connected endurance test
5 kW PEM system was run in grid connected configuration in order to compare the performances with one operated with a constant load. The dc/dc converter regulates system voltage to 48 Vdc, while inverter allows the grid connection with an ac bus of 230 Vac, 50 Hz.
Stack SN465
AC GRID Fuel Cell
System
dc/dc converter dc/ac inverter
Figure 2-22 Grid Connected Endurance Test Scheme
Figure 2-23 Grid Connected Test Bench Fuel Cell System
Inverter
37 Thanks to a software interface developed by Delta Energy Systems, the inverter parameters can be read and set by PC. So the load current wished can be set, assuring a regulatory effect for the grid.
Figure 2-24 Software Interface
This aspect is very important for the future electrical grid (smart grid) because hydrogen produced on site, i.e. by renewable energy sources , useful for the mobility in hybrid vehicles (fuel cell, battery, supercap) can be used through a fuel cell system to compensate the uncertainty of RWEs, for mitigating the peaks loads and in back up power applications [10].
The load was fixed at the same dc-side value (3.5 kW) according to previous test and to compare the performances polarization curves were used.
38 29 30 31 32 33 34 35 36 37 38 39 40 0 5 10 15 20 25 30 35 40 45 50 55 60 65 70 75 80 85 90 95 100 105 110 115 120 125 130 135 140 145 150 155 160 165 St ac k Vo lt ag e Stack Current Polarization Curves Comparison after 1000Hrs
Stack SN465 NO GC Stack SN476 GC Stack SN476 GC_1000hrs StackSN465 NO GC_1000Hrs
Figure 2-25 Polarization Curves Comparison
The polarization curves show the photo of the two system at 0 h and after 1000 h of continuous working.
The stack SN465 was not connected to the grid, while the stack SN476 was connected to the grid.
No significant performance differences were noticed and the slight ones can be attributed to several phenomena not easily recognizable in a complex system; ( humidity, temperatures, little manufacture differences, water content in the membrane).
An important aspect is that the inverter used is characterized of a low current ripple (<1% Apk-pk), but with a low efficiency (about 89%), so the
degradation of components materials is very low, but the efficiency as well. The right balancing between material degradation, low efficiency due to the current ripple and low efficiency due to ripple filters have to be found for the power converter developers. In the next chapter these aspects will be analyzed.
Another test regarding the dynamics of whole system fuel cell system-dc/dc converter-inverter was conducted in order to determine the response rapidity. According to the former DC test, a load commutation from 0 to 5 kW was realized in the ac side. The response on the AC side is reported in the following figure.
39 Figure 2-26 AC Fast Commutation (0-5 kW Load)
Despite the fast response of the fuel cell system seen in the previous tests (100 ms), figure shows a relevant delay of about 3.5 s.
40
References - 2
[1] A.S. Feitelberg, J. Stathopoulos, Z. Qi, C. Smith, J.F. Elter, Journal of Power Sources 147 (2005) 203–207.
[2] K.Washington, Fuel Cell Seminar 2000 Proceedings, Portland, USA, 2000.
[3] S.D. Knights, K.M. Colbow, J. St-Pierre, D.P. Wilkinson, Journal of Power Sources 127 (2004) 127–134.
[4] M. Fowler, J.C. Amphlett, R.F. Mann, B.A. Peppley, P.R. Roberge, Journal of New Materials for Electrochemical Systems 5 (2002) 255
[5] O. Polevaya, 2nd Annual International Symposium Fuel Cells Durability & Performance Proceedings 2006, Miami Beach, USA, 7–8 Dicember, 2006.
[6] A. Chávez-Ramírez, L. G. Arriaga, R. Muñoz-Guerrero, M. Ferraro, G. Brunaccini, F. Sergi, S. Duron, Int. Journal of Hydrogen Energy, Ms. Ref. No.: HE-D-09-00555R1 (In press)
[7] A. Jossen, J. Garche, H. Doering, M. Goetz, W. Knaupp, L. Joerissen, Journal of Power Sources 144 (2005) 395–401.
[8] A. Jossen, J. Garche, D.U. Sauer, J. Solar Energy 76 (2004) 759–769.
[9] M. Ferraro, F. Sergi, G. Brunaccini, G. Dispenza, L. Andaloro, V. Antonucci, Journal of Power Sources 193 (2009) 342–348
[10] European Smart Grids Technologies Platform, Directorate-General for Research Directorate J – Energy Unit 2 – Energy Production and Distribution Systems
41
Chapter 3
Performance Degradation in grid connected applications: the effect
of ripple current
3.1 Introduction to ripple current noise
Coming back to the fuel cell requirements, it is strongly recommended the absorption of a low current ripple in order to increase its lifecycle and efficiency[1]. In fact, there are two possible sources of current ripple. One comes from the power converter operation and implies in high frequency current ripple related to the first-stage DC-DC converter switching frequency. The other one comes from the fact that, when power conditioners are applied in single-phase systems, the AC load absorbs an instantaneous power which has a component oscillating at twice of the applied frequency, as can be seen in the instantaneous power expression:
where p(t) is the instantaneous power, Vm is the peak voltage applied to the load, Im is the peak current flowing from the source to the load, φ is the power factor angle and ωs is the frequency applied, which in distributed generation application is the grid frequency [2].
42 Figure 3-1 Low frequency ripple current generation by a single-phase full bridge
inverter
Therefore, a second order harmonic current ripple may be absorbed by the fuel cell, which may impose a negative impact to the fuel cell performance and fuel utilization .
Fig. 3-1 shows an example in which a single-phase full-bridge dc–ac inverter circuit used in [3].The inverter is implemented with a sinusoidal pulse width modulation (PWM) method. With a linear load, the output current has the same 60 Hz frequency and sinusoidal wave shape as the output voltage. The inverter input voltage and current are dc, but the current contains high frequency switching noises and a low frequency ripple component. The ripple component is considered the rectification effect through the inverter switches, and thus it appears to be a 120 Hz pulsating current.
The PWM switching noise is filtered with a high-frequency dc bus capacitor, but the energy of the 120 Hz ripple is too high to be absorbed. A bulky dc bus capacitor can then be used to smooth the 120 Hz ripple, but a significant part of the 120 Hz ripple remains and continues to propagate through the entire dc–dc converter and back to the fuel cell (dc power source). Due to these phenomena, fuel cells are directly exposed to a dynamic load that depends on the frequency generated.
43 Instantaneous power is the sum of two parts: the first, called active power3, is the mean value of instantaneous power and is constant, the second is a floating power with a double pulse.
Therefore, considering a European grid connected fuel cell, the ripple generated has the double frequency of the grid’s frequency: 50 Hz * 2 = 100 Hz.
Figure 3-2 Ripple Voltage from a switch mode power supply (Period 10 ms for a 50 Hz grid frequency)
As a matter of fact, the first test to highlight this phenomenon, was conducted connecting a 5 kW PEM fuel cell to the electric grid by a Delta Energy DHF5000LV inverter, resulted in what reported in the following figure:
3 Active power is the mean value of the instantaneous power. It means the energy absorbed in a period and for this reason it is called active power or “true power”. It is defined as
44 Figure 3-3 Ripple Voltage and Current from a DC7DC Inverter
It is evident ripple current and voltage with a time period of 10msec that corresponds to a 100 Hz frequency
3.2 Fuel Cell System performance under 100Hz dynamic loads
Several tests were conducted to determine the decline into performance due to ripple current.
Experimental tests simulated the ripple current generated from an inverter and applied to a fuel cell system.
First, a test bench, able to manage an electronic load and to generate a variable sinusoidal load, was created.
45 Figure 3-4 Test Bench Configuration
The equipments used for these tests are: • 1.2kW Fuel Cell System, Nexa by Ballard • Agilent DS06032A Oscilloscope
• Agilent 33120A Wave Generator
• ZS 7006 Hocherl & Hockl Electronic Load • PC
Figure 3-5 Nexa Ballard Fuel Cell System Wave Generator Electronic Load Oscilloscope
46 The wave generator produces 0-10 V voltage signal that controls, by the analog I/O of the electronic load, the generation of a sinusoidal load, variable in amplitude and in frequency.
Therefore, modulating the wave generator, the study of fuel cell behaviour under different kinds of ripple currents (varying amplitude and frequency) is possible.
An oscilloscope, placed at the outlet of the fuel cell, acquires voltage and current generated from the fuel cell (Nexa Ballard).
The fuel cell system is composed of 40 cells in series, with an effective power of 1.2 kW and a polarization curve of 42 V to 24 V at 50 A.
0 200 400 600 800 1000 1200 1400 0 5 10 15 20 25 30 35 40 45 0 5 10 15 20 25 30 35 40 45 50 Po w e r ( W ) Vo lt a g e ( V ) Current (A) Nexa Ballard Polarization Curve
Voltage Power
Figure 3-5 Nexa Ballard Polarization Curve
The first tests were conducted using a constant mean current value of 25 A and changing the peak-peak current value from 0 to 100% of the mean current [4]. Frequency was fixed at 100 Hz to simulate the real condition for a 50Hz grid.
47
Tests 1 2 3 4 5 6 7 8
Pk-Pk
current 15 A 20 A 25 A 30 A 35 A 40 A 45 A 50 A
Table 3-1 Peak to peak current varied during test
Voltage and current acquired were used to calculate instantaneous power [5] and to determine its mean value, the active power for each step.
In the following figure examples at 30 A are reported.
48
Fuel Cell Current-30A pk-pk
0 5 10 15 20 25 30 35 40 45 0,00 5,00 10,00 15,00 20,00 25,00 30,00 35,00 40,00 45,00 50,00 millisec Cu rren t(A) 30A pk-pk
Figure 3-8 Sinusoidal Current generated at mean value of 25 A and 30 A amplitude
Fuel Cell Voltage-30A pk-pk
20 22 24 26 28 30 32 34 36 0,00 5,00 10,00 15,00 20,00 25,00 30,00 35,00 40,00 45,00 50,00 millisec Vo lt age (V) 30A pk-pk
49
Fuel Cell Instantaneous Power-30A pk-pk
0 200 400 600 800 1000 1200 1400 0,00 5,00 10,00 15,00 20,00 25,00 30,00 35,00 40,00 45,00 50,00 millisec Power(W) 30A pk-pk
Figure 3-10 Calculated instantaneous power
Voltage response is definitely affected by current ripple.
Instantaneous power was determined by the product point to point between voltage and current.
The mean value of instantaneous power (active power) was calculated for all tests.
Current [App] Active Power [W]
15 749,82 20 747,43 25 741,42 30 736,61 35 732,94 40 727,13 45 719,68 50 715,20 Table 3-2 Generated Active Power for each test
50 When the amplitude of peak to peak current increases (ripple growth), active power produced by the fuel cell decreases, so the performance of the fuel cell depends strongly on the amplitude of the disturbance.
A c tive P ower Drop 700 710 720 730 740 750 760 770 15 20 25 30 35 40 45 50 C urrent [A pp] Po w e r [W ]
Figure 3-11 Relationship between output power reduction and I pk-pk ripple current
obtained during test
Active power decreases up to about 5% compared to active power without ripple current.
This confirms what reported in [6] in which the obtained active power loss graph is shown in the following figure, where the output power reduction varies between 0 and 5%.
51 Figure 3-12 Relationship between output power reduction and ripple current at the
rated condition in Choi Test
3.3 Fuel Cell System performance under dynamic loads with a variable frequency
Other tests were conducted to determine if fuel cell performance depends on frequency as well.
Therefore, in this case variations to both amplitude and frequency produced a 3D graph that can highlight both phenomena. Frequency was varied from 0 to 150Hz.
52 0 50 100 150 20 25 30 35 40 45 50 660 680 700 720 740 freq [Hz]
Active Power vs frequency and amplitude- offset=25 A
ipk-pk [A] Ac ti ve P o w e r [W ] 670 680 690 700 710 720 730
Figure 3-1 a) 3D Graph with Active Power vs ipk-pk and frequency
0 50 100 150 20 25 30 35 40 45 50 660 670 680 690 700 710 720 730 740 freq [Hz] Active Power vs frequency and amplitude- offset=25 A
ipk-pk [A] Ac ti ve P o w e r [W] 670 680 690 700 710 720 730
Figure 3-2 b) 3D Graph with Active Power vs ipk-pk and frequency
The figure shows that this range of frequency determine a quite constant trend on active power losses.
53 Probably, all the fuel cell losses (activation, ohmic, concentration, ecc) contribute to a decrease in power.
The main reasons may be the following:
• Water formation during the cycling can take up catalytic sites. This can determine the flooding of the cells, which can affect the voltage response and, therefore, the power generated.
• Dynamics can generate pressure losses due to the fast consumption of hydrogen that causes voltage drops.
Using ripple filters [7,8] can decrease the overall efficiency of systems but compared to the losses in efficiency from ripple current alone, especially to the reduction of life time, the necessity of developing active or passive filters to minimize the ripple is an obligation.
The effect of current ripple can reduce the life time as well, so in the next chapter is reported a campaign of tests for determining the material degradation due to the current ripple.
54
References - 3
[1] C. Pica, M. Bollero, A. Bollero , A. Tenconi and L. Limongi, IEEE Xplore Digital Object Identifier: 10.1109/OPTIM.2008.4602433 Publication Year: 2008 , Page(s): 357 - 362
[2] W. Shireen, R. A. Kulkarni, M. Arefeen, Journal of Power Sources 156 (2006) 448–454
[3] Changrong Liu; Jih-Sheng Lai; Power Electronics Specialists Conference, 2005. PESC '05. IEEE 36th Digital Object Identifier: 10.1109/PESC.2005.1582046 Publication Year: 2005 , Page(s): 2905 - 2911
[4] L. Schindele; M.Braun; H. Spath; Power Electronics and Applications, 2005 European Conference on Digital Object Identifier: 10.1109/EPE.2005.219540 Publication Year: 2005 , Page(s): 9 pp. - P.9
[5] A. Testa, S. De Caro, D. Caniglia, V. Antonucci, M. Ferraro, F. Sergi
Power Electronics and Applications, 2009. EPE '09. 13th European Conference on 8-10 Sept. 2009 Page(s):1 – 10 IEEE CNF
[6] W. Choi, P.N. Enjeti, J.W.Howze, Applied Power Electronics Conference and Exposition, 2004. APEC '04. Nineteenth Annual IEEE Volume: 1 Digital Object Identifier: 10.1109/APEC.2004.1295834 Publication Year: 2004 , Page(s): 355 - 361 Vol.1
[7] J.Itoh, F. Hayashi, Applied Power Electronics Conference and Exposition, 2009. APEC 2009. Twenty-Fourth Annual IEEE Digital Object Identifier:
10.1109/APEC.2009.4802916 Publication Year: 2009 , Page(s): 1813 - 1818
[8] W. Shireen, H. Nene, Telecommunications Energy Conference, 2006. INTELEC '06. 28th Annual International Digital Object Identifier: