Research Article
Flavonoids in Ecuadorian Oreocallis grandiflora (Lam.) R. Br.:
Perspectives of Use of This Species as a Food Supplement
Diego Vinueza
,
1Karina Yanza,
1Massimo Tacchini,
2Alessandro Grandini,
2Gianni Sacchetti
,
2Matteo Andrea Chiurato,
2and Alessandra Guerrini
2 1Natural Products Laboratory, Sciences Faculty, Polytechnic School of Chimborazo, Panamericana Sur km 1 ½,CP 060155, Riobamba, Ecuador
2Department of Life Sciences and Biotechnology (SVeB,) University of Ferrara, Via Conca, Piazzale Chiappini 3, 44123 Ferrara (fraz. Malborghetto di Boara), Italy
Correspondence should be addressed to Gianni Sacchetti; [email protected] Received 2 October 2018; Accepted 25 November 2018; Published 11 December 2018 Academic Editor: Luigi Milella
Copyright © 2018 Diego Vinueza et al. This is an open access article distributed under the Creative Commons Attribution License, which permits unrestricted use, distribution, and reproduction in any medium, provided the original work is properly cited.
Oreocallis grandiflora (Lam.) R. Br. is an Ecuadorian species belonging to the Proteaceae family, commonly known as cucharillo (Loja
and Zamora provinces), cucharilla (Sierra region), ga˜nal (Bol´ıvar province), and algil (Chimborazo province). Its leaves and flowers, collected during blooming, are traditionally used for oral administration to treat liver diseases, vaginal bleeding, and ovary/uterus inflammation and as digestive, diuretic, and hypoglycemic remedy. Related literature does not report any scientific evidences regarding the chemical composition of the used parts of this species (leaves and flowers), while few indications are reported about the healthy properties of their preparations. Based on these premises, the present research was performed with the objectives to fill the gaps of the chemical and biological knowledge about this species, enriching the knowledge related to the plant biodiversity of Amazonian Ecuador and to the ethnobotanical tradition of Andean communities. Chemical and biological investigation (in vitro antioxidant and anti-inflammatory activity) of flower and leaf hydroalcoholic extracts shed a light on the functional metabolites putatively involved in healthy properties of the O. grandiflora traditional preparations. The chemical fingerprinting achieved by HPTLC and1HNMR analyses showed the presence of flavonoids, subsequently quantitatively estimated by AlCl3complexation assay and HPLC-DAD. Silica gel chromatography allowed the isolation of the main compounds of the flower extract: quercetin 3-O-𝛽-glucuronide and myricetin 3-O-3-O-𝛽-glucuronide. RP-HPLC-DAD-MS analyses showed the presence of quercetin 3-O-rutinoside and isorhamnetin 3-O-rutinoside, in addition to the above-mentioned molecules, in the leaf extract. Regarding the antioxidant (DPPH test, a radical scavenging assay) and anti-inflammatory (WST-1 assay, an oxidative burst test) activities, leaf extract showed the most promising results when compared to the positive controls. The same extract, however, exhibited a higher cytotoxicity compared to the flower extract, indicating the latter preparation as the most interesting anti-inflammatory crude drug.
1. Introduction
The Proteaceae family is one of the most prominent of the southern hemisphere and consists of 79 genera and over 1700 species. It has a main diversity center in Australia and secondary centers in South Africa, New Caledonia, Southeast Asia, Madagascar, New Zealand, and South America. This family, apparently of tropical origin, is characterized by a wide spectrum of variation in vegetative morphology (Proteaceae take the name from the Greek god Proteus, who had the ability to change between many forms). However, accord-ing to the latest botanical systematic profile of this family
based on traditional classification parameters, eight genera of Proteaceae can be found in South America, all within the subfamily Grevilleoideae Engl.; six of them are endemic to South America and the other two occur also in Australia and Tasmania [1].
Oreocallis grandiflora (Lam.) R. Br. (OG) is an Ecuadorian
species belonging to the Proteaceae family, commonly known as cucharillo (Loja and Zamora provinces), cucharilla (Sierra region), ga˜nal (Bol´ıvar province), and algil (Chimborazo province). Its leaves and flowers, collected during blooming, are traditionally used for oral administration to treat liver
Volume 2018, Article ID 1353129, 9 pages https://doi.org/10.1155/2018/1353129
disease, vaginal bleeding, and ovary/uterus inflammation and as digestive, diuretic, and hypoglycemic remedy [2–7]. These traditional uses drove our research, mainly focused on valorizing Andean plant biodiversity and plant health uses heritage, to study the chemical composition and the biological activities of flower and leaf hydroalcoholic extracts of OG.
To the best of our knowledge, the related literature does not report any scientific papers regarding the chemical com-position of the used parts of this species, while few indications refer to the healthy properties of their preparations [6]. Some other Proteaceae species have instead been studied for the chemical composition of their used parts. For example,
Grevillea robusta showed interesting amounts of flavonoids
[8], likewise a study on Helicia excelsa Roxb. indicated the presence of flavonoids, saponins, terpenes, and tannins [9], and Hakea salicifolia and Hakea sericea were reported to contain phenolic and flavonoids compounds and smaller amounts of terpenes [10].
Based on these premises, the present research was con-ducted with the objectives to fill the gaps of the chemical and biological knowledge about this species, which is impor-tant for both Ecuadorian plant biodiversity and traditional ethnomedical uses of Andean plants, by investigating the chemical composition and bioactivity (in vitro antioxidant, anti-inflammatory, and cytotoxic properties) of flower and leaf hydroalcoholic extracts for the presence of functional metabolites putatively involved in healthy properties of the OG traditional preparations. The importance of profiling Andean plants for their chemical and biological properties would valorize the knowledge about the botanical heritage of one of the most important biodiversity hot-spot in the world and contemporarily to shed a light on the opportunity to enrich the food supplements global market of new plant source of bioactive constituents: this paper goes towards this direction.
2. Materials and Methods
2.1. Materials. Ficoll Paque, modified Hank’s solution,
Zimosan A, Triton X-100,trolox, quercetin, gallic acid, DPPH, natural product reagent A, polyethylene glycol, ethyl acetate, acetic acid, formic acid, acetonitrile, methanol, deuterated methanol, and ethanol were purchased from Sigma-Aldrich, SL (USA), water soluble tetrazolium salt (WST-1) from Roche (USA), aspirin from J.T. Baker (USA), dimethyl sulfoxide (DMSO) and ammonium chloride from Merck (Germany),
and quercetin 3-O-𝛽-rutinoside (rutin), quercetin
𝛽-glucuronide (miquelianin), and isorhamnetin 3-O-𝛽-rutinoside (narcissin) from Extrasynthese (France); deionized water was used in all experimental procedures. All other reagents and solvents were of analytical or high-performance liquid chromatography grade as appropriate.
2.2. Collection of Plant Material. O. grandiflora (Lam.) R.
Br., Proteaceae, plants, herein after referred to as OG, were collected in Ecuador, Loja province, Olmedo town, sector
S 03∘ 56 0.172 W 079∘ 38 25.814, at 1314 meters above
sea level, during full blossom (balsamic period). The plant material was taxonomically identified by the botanist Jorge Caranqui at Escuela Superior Polit´ecnica de Chimborazo (ESPOCH) and a specimen was deposited at ESPOCH’s Herbarium (code: ESPOCH 4323). O. grandiflora leaves and
flowers were collected at balsamic period, dried at 50∘C in a
forced convection oven for 8 h, and then separately ground in a knife mill until particle size of 2-3 mm.
2.3. Extraction Procedures. The dried powdered flowers and
leaves (100 g each) were extracted by maceration with 1000 mL of 70% v/v ethanol for 72 h at room temperature and kept mixed in an orbital shaker to 100 rpm. Then, the extracts were filtered and the process was repeated on the marc until material was exhausted. The collected filtrates were pooled
and evaporated under reduced pressure (50∘C, -0.5 bar) to
obtain the dry extracts (3.02% and 1.82% for yield of leaves
and flowers, respectively). The solids were stored at 4∘C and
vacuum until use.
2.4. HPTLC Screening. HPTLC (high-performance thin layer
chromatography) was assessed to determine the main com-pounds of the two extracts. Two microliters of a hydroalco-holic solution of OG extracts (10 mg/mL) were applied to a HPTLC silica gel 60 F254 plate (Merck, Germany) as 6 mm wide bands with Linomat V (Camag, Switzerland). Then, the plate was eluted with a solvent solution (ethyl acetate/acetic acid/formic acid/water 10/0.5/0.5/2) in a chromatographic chamber. After development, the chromatogram was visual-ized at 254 nm and then was sprayed with natural product reagent A polyethylene glycol (NP/PEG) reagent and visual-ized at 366 nm to identify the phenolic fingerprinting of the two extracts. The flavonoids appeared as yellow-orange areas on a violet background [11].
2.5. NMR. The1H- and 13C-, DEPT-NMR, and 2D-NMR
spectra (COSY, HMQC, HMBC) were recorded in CD3OD
solution in 5 mm tubes, at room temperature, with a Varian Mercury Plus 400, operating at 400 (1H) and 100 MHz (13C),
respectively; the1H and13C chemical shifts referenced to the
residual solvent signal (CD3OD:𝛿 (H) 3.34 ppm and, 𝛿(C)
49.0 ppm, respectively).
2.6. Total Flavonoids Determination. The total flavonoids
were measured by a colorimetric assay modified by Boukhris, Simmonds, Sayadi, & Bouaziz [12]. An aliquot (1 mL) of the diluted sample or standard solution of quercetin (20, 40, 60, 80, and 100 mg/L) was added to a 10 mL volumetric flask
containing 4 mL of H2O. At starting time, 0.3 mL of NaNO2
(5%, w/w) was added to the flask. After 5 min, 0.3 mL of
AlCl3(10% w/w) was added, successively at 6 min and 2 mL
of NaOH (1M). Immediately, the reaction flask was diluted to
volume with the addition of 2.4 mL of H2O and thoroughly
mixed. The absorbance of the mixture, characterized by a pink color, was determined at 510 nm compared to a water control. Total flavonoids content (TFC) was expressed as mg quercetin equivalents (QE)/100 g of extract, using a calibration curve of quercetin.
2.7. Chromatographic Separation. The main compounds of
flower OG extract were purified by chromatographic
col-umn with SiO2 as stationary phase and ethyl acetate/acetic
acid/formic acid/water (10:0.5:0.5:1) as mobile phase.
Pre-coated silica gel plates (silica gel 60 F254; thickness 0.25
mm; Merck) with the same above mobile phase were used to control the fraction separations: after development, the chromatogram was visualized at 254 nm and then was sprayed with natural products-polyethylene glycol (NP/PEG) reagent and visualized at 366 nm.
2.8. HPLC-DAD-MS Analysis. The analyses were performed
using a JASCO modular HPLC system (Tokyo, Japan, model PU 2089) coupled to a diode array apparatus (MD 2010 Plus) and a FinniganMAT LCQ (ThermoQuest Corp./FinniganMAT; San Jose, CA) mass spectrometer
mod-ule linked to an injection valve with a 20𝜇l sampler loop. The
column used was an Eclipse-PLUS-C18 (25× 0.46 cm, i.d., 5
𝜇m) at a flow rate of 1.0 ml/min. The mobile phase consisted of solvent solution A (water/formic acid 99.5/0.5) and B (methanol/acetonitrile/formic acid 50/50/0.5). The gradient system adopted was chosen according to the molecules to
analyze and characterized by six steps: (1) starting point
at 90:10 v/v (A/B); (2) gradual changing to 70:30 v/v in
30 min; (3) progressive raise to 50:50 v/v up to 35 min;
(4) increase to 30:70 v/v up to 40 min; (5) achievement
of ratio 0:100 v/v up to 45 min; and (6) back to starting
point (90:10 v/v) in 10 min. Injection volume was 40 𝜇L.
The chromatograms were observed at 355 nm [13]. The mass experiments were carried out on a FinniganMAT LCQ (Ther-moQuest Corp./FinniganMAT; San Jose, CA) mass spec-trometer module, equipped with an ion trap mass analyzer and an ESI ion source electrospray, in negative ion mode.
For ESI-MS and MS2 experiments, the parameters were set
as follows: the capillary voltage was 3.5 kV, the nebulizer (N2)
pressure was 20 psi, the capillary temperature was 300∘C,
the auxiliary gas (N2) flow was 9 l/min, and the skimmer
voltage was 40 V. The mass spectrometer was operated in the negative ion mode in the m/z range 100–1500. Standard commercial molecules of quercetin 3-O-𝛽-rutinoside (rutin),
quercetin 3-O-𝛽-glucuronide (miquelianin), isorhamnetin
3-O-𝛽-rutinoside (narcissin), and isolated myricetin
3-O-𝛽-glucuronide were used to confirm the experimental data. The three commercial pure standards were also used to quantify these molecules in leaf and flower extracts through the construction of calibration curves with solutions of concentrations from 0.01 mg/mL to 0.4 mg/mL. The dried leaf and flower extracts were solubilized in hydroalcoholic solution (ethanol 70%) to obtain a final concentration of 4 mg/mL.
2.9. Spectrophotometric DPPH Assay. 1 mg of OG extracts,
quercetin 3-glucuronide, and trolox were dissolved into 0.900 mL of ethanol; then serial dilutions were assessed in order to obtain different concentrations. An aliquot (2.9 mL) of the ethanol solution of DPPH (4 mg/100 mL) was added to sample solution [14]. After 30 min incubation, in an orbital shaker at 200 rpm, in the dark at room temperature, the mixture was placed in a UV-Vis spectrophotometer (Helios
Gamma Spectrophotometer) and the absorbance was read in triplicate against a blank at 517 nm. The DPPH inhibition in percent was determined by the following formula: IDPPH%
= [1 - (A1/A2)]× 100, where A1 was the DPPH absorbance
with the sample and A2 without the extract [14]. Trolox was used as positive control. The antioxidant activity of samples
was expressed as IC50 (concentration providing DPPH 50%
inhibition), calculated from inhibition curves obtained by plotting inhibition percentage against extracts concentration. All experiments were assessed in triplicate and values were
reported as mean± SD (Standard Deviation).
2.10. Oxidative Burst Test. Heparinized fresh venous blood
sample was drawn from healthy volunteers and neutrophils were isolated [15]. Whole blood was added to Ficoll Paque; it was centrifuged for 30 minutes at 1500 rpm. After discarding the supernatant, red blood cells traces were lysed by mixing with hypotonic ammonium chloride solution (0.83% w/v). It was centrifuged again, and the neutrophils were washed with MHS (modified Hank’s solution, pH 7.4) and resuspended at
concentration of 107cells/mL in a MHS appropriate volume
[16]. Anti-inflammatory activity was determined by using a modified in vitro assay based on the reduction of WST-1 in the presence of activated neutrophils [17]. Oxidative burst assay
was determined in a total volume of 250𝜇L MHS (pH 7.4)
containing 107neutrophils/mL, 500𝜇M WST-1, and various
concentrations of test extracts. Control contained buffer, neutrophils, and WST-1. All compounds were equilibrated
at 37∘C and the reaction was initiated by adding opsonized
Zymosan A (15 mg/mL), which was prepared by mixing it with human pooled serum, followed by centrifugation at 3000 rpm and pellet was suspended in phosphate buffer solu-tion (PBS). Absorbance was measured at 450 nm [16]. Aspirin was used as positive control since it is utilized as nonsteroidal anti-inflammatory drugs (NSAIDs) for treatment of several inflammatory diseases [18, 19]. DMSO was used as blank and the anti-inflammatory activity was expressed as produced superoxide anions inhibition percent.
2.11. Cell Viability Assay (Cytotoxicity). Metabolically active
cells reduce tetrazolium salts into colored formazan com-pounds. Therefore, tetrazolium salt-based colorimetric assays detect only viable cells. These sensitive assays can readily be performed in a microtiter plate with relatively few cells by using modified method [20]. In this study, the human
isolated neutrophils (107cells/mL) were incubated with test
extracts for 30 minutes and then WST-1 (250𝜇M) was added
and incubated in shaking water bath at 37∘C for 3 h. The
absorbance was measured at 450 nm. Triton X-100 (0.1% v/v) and DMSO (0.5% v/v) were used as controls showing 0.00% and 100% cell viability, respectively [16]. The OD (optical density) is the mean of five replicates. Cell viability percent was calculated by using the following formula:
% Cell viability= (ODTEST
ODDMSO) × 100 (1)
2.12. Data Analysis. The results are expressed as mean± SD.
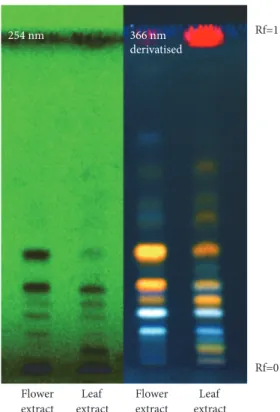
254 nm 366 nm derivatised Flower extract Flower extract Leaf extract Leaf extract Rf=0 Rf=1
Figure 1: HPTLC of two extracts, visualized at 254 nm before derivatization and at 366 nm after derivatization. F. extract: flower extract and L. extract: leaf extract.
where applicable, were used to analyze level of statistical significance between groups. P value less than 0.05 was considered statistically significant.
3. Results and Discussion
3.1. Chemical Characterization. With the aim of chemically
characterizing leaves and flowers of OG for determining their bioactive constituents, a qualitative preliminary screening was performed on the two OG hydroalcoholic extracts. The choice of the hydroalcoholic solvent has been guided by the ethnobotanical knowledge about OG traditional preparations [6] and by the need to perform an effective strategy to extract phenols, polyphenols, and flavonoids, reported as abundant secondary metabolites in the studied plant species belonging to Proteaceae family. In the first preliminary approach with HPTLC analyses, OG flower extract (F. extract) showed two main spots (Rf = 0.3 and 0.4) at 254 nm, evidenced also as orange fractions at 366 nm after selective derivatization for flavonoids class. The leaf extract (L. extract) showed instead a more complex composition and a red spot at 366 nm on the front of the solvent due to chlorophylls (Figure 1).
The proton nuclear magnetic resonance is an appropriate technique to make a chemical fingerprinting, allowing at the same time a semiquantitative evaluation of a complex mixture [21]. In fact, the high signals between 3 and 4 ppm evidenced for both extracts the relevant abundance of sugars, probably corresponding to observable spots at Rf = 0 in HPTLC test at 254 nm, with respect to the flavonoids that
showed resonances of lower intensity in the range of 6-8 ppm. Moreover, the flower mixture highlighted a simpler profile than to the leaf one at 6-8 ppm, confirming the results visualized with HPTLC assay (Figure 2).
Quantitative flavonoid content, measured by a colorimet-ric assay modified by Boukhris et al. [12], suggested that OG possessed appreciable quantity. Leaf extract was found to contain higher amounts of flavonoids than flower extract:
406.1 ± 1.73 mg of QE/g for the first and 158.5 ± 1.53 mg
of QE/g for the second. A direct relationship was observed comparing these data with the extraction yields (%): 3.02% and 1.82% (% w/w), respectively, for leaf and flower extracts.
A separation through silica gel chromatographic column allowed successfully separating the two main fractions of
O. grandiflora flower extract that successively were
charac-terized by 1H, 13C, and bidimensional NMR experiments
to determine their chemical structure. COSY and HMBC experiments confirmed the aglycone structure of quercetin, evidencing the coupling of protons 2’, 5’, 6’, and 5, 7 at short and long distance, respectively; likewise, for myricetin structure the coupling of protons 2’, 6’ and 5, 7 was observed. As previously indicated by Rashed, Said, Abdo, and Selim [22] and Moon, Tsushida, Nakahara, and Terao [23] our mono-and bidimensional spectra showed also the couplings on the sugar moiety linked to quercetin and myricetin, respectively, allowing the complete elucidation of the chemical struc-tures: quercetin glucuronide and myricetin 3-O-𝛽-glucuronide. Based on the results deriving by bidimensional spectra, we reported the assignments of chemical shifts to
relative protons and carbons in1H,13C NMR experiments.
3.1.1. Quercetin 3-O-𝛽-Glucuronide. 1H-NMR (CD3OD, 400
MHz):𝛿 ppm 7.67 (1H, d, J = 2.1 Hz, H-2’), 7.62 (1H, dd, J = 8,4, 2.1 Hz, H-6’), 6.86 (1H, d, J = 8.4 Hz, H-5’), 6.40 (1H, d, J = 2.1 Hz, H-8), 6.20 (1H, d, J = 2.1 Hz, H-6), 5.31 (1H, d, J = 7.5 Hz, H-1”), 3.57 (1H, m, H-4”), 3.55 (1H, m, H-5”), 3.51 (1H, d, J = 7.5 Hz, 2”), 3.48 (1H, m, H-3”).13C-NMR (CD3OD, 400 MHz):𝛿 178.05 (C-4), 175.00 (C- 6”), 164.64 (C-7), 161.60 5), 158.80 2), 158.08 9), 148.43 4’), 144.49 (C-3’), 134.96 (C-3), 121.37 (C-6’, C1’), 116.56 (C-2’), 114.73 (C-5’), 102.94 (C- 10), 101.09 (C-1”), 98.67 (C-6), 93.26 (C-8), 76.61 (C-3”), 76.23 (C-5”), 74.10 (C-2”), 71.93 (C-4”).
3.1.2. Myricetin 3-O-𝛽-Glucuronide. 1H-NMR (CD3OD, 400
MHz):𝛿 ppm 7.37 (2H, s, H-2’, 6’), 6.40 (1H, d, J = 2.1 Hz, H-8), 6.20 (1H, d, J = 2.1 Hz, H-6), 5.28 (1H, d, J = 7.5 Hz, H-1”), 3.57 (1H, m, H-4”), 3.55 (1H, m, H-5”), 3.51 (1H, d, J = 7.5 Hz, 2”), 3.48 (1H, m, H-3”).13C-NMR (CD3OD, 400 MHz):𝛿 177.98 (C-4), 175.00 (C- 6”), 164.37 (C-7), 161.56 (C-5), 158.35 (C-2), 157.87 (C-9), 145.06 (C-3’,5’), 136.59 (C-4’), 134.61 (C-3), 120.13 1’), 108.56 2’,6’), 104.21 10), 103.18 1”), 98.51 (C-6), 93.25 (C-8), 76.68 (C-3”), 76.40 (C-5”), 74.06 (C-2”), 71.92 (C-4”).
The two extracts were then analyzed by HPLC-DAD and HPLC-MS. From the data analysis it results that quercetin 3-O-𝛽-glucuronide and myricetin 3-O-𝛽-glucuronide were the main components of flower extract, while isorhamnetin 3-O-rutinoside and quercetin 3-O-rutinoside resulted in the
0.25 0.20 0.15 0.10 0.05 0.25 0.20 0.15 0.10 0.05 Chemical Shift Chemical Shift
O. grandiflora leaf extract O. grandiflora flower extract
0 1 2 3 4 5 6 7 8 0 1 2 3 4 5 6 7 8 N o rm alized in te n si ty N o rm alized in te n si ty
Figure 2:1HNMR of two crude extracts. The zone of 6-8 ppm is typical for signals of phenolic protons (flavonoids), while the zone between 3 and 4 ppm evidences for both extracts a relevant abundance of sugars.
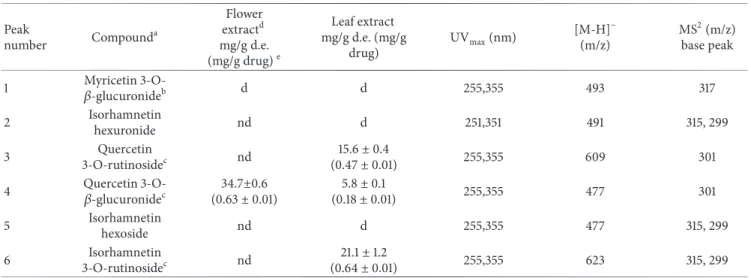
Table 1: Flavonoids identified in leaf extract of O. grandiflora by HPLC-UV/DAD, HPLC-ESI-MS, and MS2.
Peak number Compound a Flower extractd mg/g d.e. (mg/g drug)e Leaf extract mg/g d.e. (mg/g drug) UVmax(nm) [M-H]− (m/z) MS2(m/z) base peak
1 𝛽-glucuronideMyricetin 3-O-b d d 255,355 493 317
2 Isorhamnetin hexuronide nd d 251,351 491 315, 299 3 Quercetin 3-O-rutinosidec nd 15.6± 0.4 (0.47± 0.01) 255,355 609 301
4 Quercetin 3-O-𝛽-glucuronidec (0.6334.7±0.6± 0.01) (0.185.8± 0.01)± 0.1 255,355 477 301
5 Isorhamnetin hexoside nd d 255,355 477 315, 299 6 Isorhamnetin 3-O-rutinosidec nd 21.1± 1.2 (0.64± 0.01) 255,355 623 315, 299
aCompounds are listed in order of elution,bconfirmed with injection of isolated compound,cconfirmed with commercially standard compound,ddetected =
d, not detected = nd, anded.e. = dried extract.
most abundant compounds of leaf extract. The results of the identification and the quantification of flavonoids are shown in Table 1, while the relative chromatograms are reported in Figure 3.
The ion negative mode ESI-MS gave information about
the molar mass, MS2 spectra indicated the cleavage of the
glycosidic bond that led to the elimination of the sugar residue, resulting in strong fragments at m/z 317, 315, and 301, corresponding to myricetin, isorhamnetin, and quercetin, respectively. The MS and UV spectra were in accord with literature data and pure compounds were used to confirm the identification [24, 25].
3.2. DPPH Radical Scavenging Activity. The oxidative stress
plays a crucial role in the development and perpetuation of inflammation [26]. In order of demonstrating the traditional use of OG as anti-inflammatory crude drug we performed a
Table 2: DPPH activity of the two extracts and quercetin 3-glucuronide.
Samples IC50 𝜇g/mL
O. grandiflora flower extract 14.39± 1.43
O. grandiflora leaf extract 6.69± 1.39
quercetin 3-glucuronide 3.73± 0.11
trolox 4.02± 0.25
preliminary evaluation of antioxidant activity through DPPH assay to support the data of more specific anti-inflammatory tests. As shown in Table 2, the leaf extract highlighted an interesting scavenging ability if compared to trolox, used as positive control. Quercetin 3-glucuronide, used as potential bioactive compound, was the best performing compound
myricetin-3-O--glucuronide myricetin-3-O--glucuronide quercetin-3-O--glucuronide quercetin-3-O--glucuronide isorhamnetin hexuronide quercetin-3-O--rutinoside isorhamnetin hexoside isorhamnetin-3-O--rutinoside
Flower extract max absorbance Flower extract 355 nm
Leaf extract max absorbance 1000000
500000
0
0.0 10.0 20.0 30.0 40.0 50.0 60.064.0
Retention Time [min]
Leaf extract 355 nm
Int
en
sit
y
Figure 3: RP-HPLC-DAD chromatograms of leaf and flower extracts. For each extract the chromatogram recorded at the maximum absorbance (top) and at 355 nm (below) was reported.
Regarding the antioxidant activity, it must be emphasized that quercetin and quercetin glycosides are well known as radical scavenging molecules: chlorophylls also, evidenced in leaf extract through HPTLC analysis and contribute to the efficacy [27, 28]. Therefore, our results confirmed the literature data and could suggest potential application of OG as antioxidant food supplement or agent to control oxidative stress linked to several diseases.
3.3. Evaluation of Cytotoxicity and In Vitro Anti-Inflammatory Activity. The inhibitory effect of different concentrations of
OG leaf and flower extracts on isolated activated neutrophils model using stable tetrazolium salt (WST-1) is summarized in Table 3.
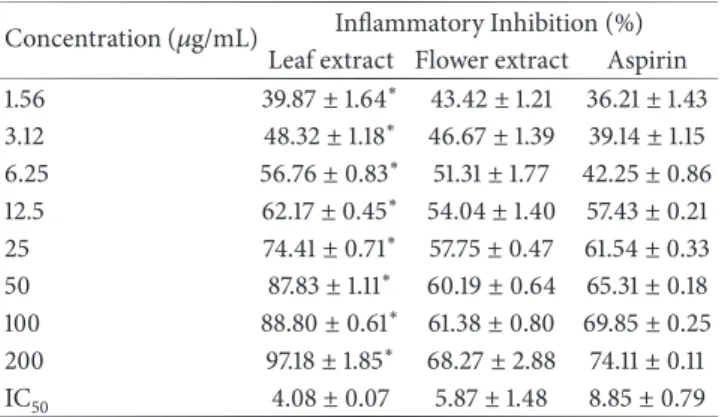
Both extracts (from 12.5 to 200𝜇g/mL) showed significant
inhibition of inflammation on isolated neutrophils (activated with opsonized Zymosan A) in a dose-dependent manner. The in vitro anti-inflammatory activity was comparable to the aspirin, a reference anti-inflammatory drug at the same dose levels of extracts. A significant difference in the inflammatory inhibition was observed in case of leaf extract when compared with the flower extract at every tested concentration.
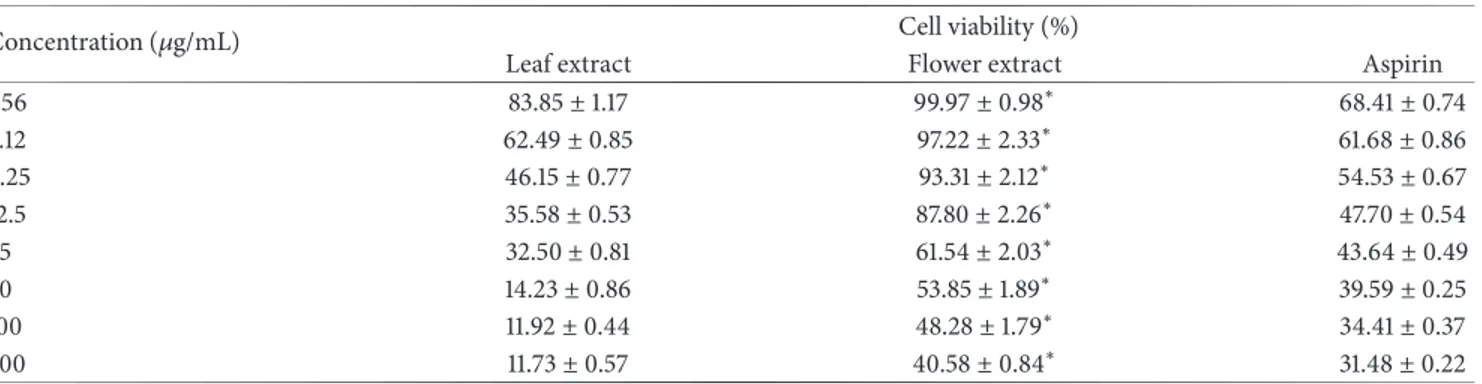
The cytotoxicity was evaluated in terms of cell viability using freshly isolated neutrophils as cellular model. The results of the cytotoxicity are shown in Table 4.
The cell viability decreased with the increase of the concentration of OG leaf and flower extracts. The cytotoxicity of OG leaf extract on isolated neutrophils is remarkable.
Table 3: In vitro anti-inflammatory effect of OG leaf and flower extracts by isolated neutrophils model using stable tetrazolium salt (WST-1).
Concentration (𝜇g/mL) Inflammatory Inhibition (%) Leaf extract Flower extract Aspirin 1.56 39.87± 1.64∗ 43.42± 1.21 36.21 ± 1.43 3.12 48.32± 1.18∗ 46.67± 1.39 39.14 ± 1.15 6.25 56.76± 0.83∗ 51.31± 1.77 42.25 ± 0.86 12.5 62.17± 0.45∗ 54.04± 1.40 57.43 ± 0.21 25 74.41± 0.71∗ 57.75± 0.47 61.54 ± 0.33 50 87.83± 1.11∗ 60.19± 0.64 65.31 ± 0.18 100 88.80± 0.61∗ 61.38± 0.80 69.85 ± 0.25 200 97.18± 1.85∗ 68.27± 2.88 74.11 ± 0.11 IC50 4.08± 0.07 5.87± 1.48 8.85± 0.79
Values are mean± SD, n=5. Significant values, P<0.05, using Student’s t-test; leaf extract versus flower extract.
The results of the inflammatory inhibition assay, with particular reference to the oxidative burst pathway, showed a proportional relation between the concentration of OG crude drugs extracts and the anti-inflammatory activity. Genus
Oreocallis has not been widely studied for its biological
activity and phytochemicals. In this context, the present research, highlighting the noteworthy inhibition of the oxida-tive burst pathway, and the high amount of flavonoids in the OG extracts (especially quercetin derivatives) consolidated
Table 4: Cell viability percentage of OG leaf and flower extracts at different concentrations.
Concentration (𝜇g/mL) Cell viability (%)
Leaf extract Flower extract Aspirin
1.56 83.85± 1.17 99.97± 0.98∗ 68.41± 0.74 3.12 62.49± 0.85 97.22± 2.33∗ 61.68± 0.86 6.25 46.15± 0.77 93.31± 2.12∗ 54.53± 0.67 12.5 35.58± 0.53 87.80± 2.26∗ 47.70± 0.54 25 32.50± 0.81 61.54± 2.03∗ 43.64± 0.49 50 14.23± 0.86 53.85± 1.89∗ 39.59± 0.25 100 11.92± 0.44 48.28± 1.79∗ 34.41± 0.37 200 11.73± 0.57 40.58± 0.84∗ 31.48± 0.22
Values are mean± SD, n=5.∗Significant values, P<0.05, using Student’s t-test; leaf extract versus flower extract. Note. Triton X-100 (0.1%) was used as negative control, showing 0.00% cell viability.
the idea that this particular class of compounds could be responsible for the anti-inflammatory activity of the studied phytocomplexes. Flavonoids have various biological activities, which are mainly related to its ability to inhibit enzymes and its effects on immune responses [29]. The pharmacological effects of quercetin, such as its antioxidant, anti-inflammatory, antiallergic, antiaging, and anticancer activities, as well as its regulating effect on interleukin- (IL-) 6, IL-8, tumor necrosis factor (TNF), histamine, and tryptase release in mast cells, are well known [30].
Recently, Lesjak et al. [31] demonstrated that quercetin and its derivatives show a notable concentration-dependent inhibitory potential towards synthesis of inflammatory medi-ators, which was comparable with aspirin, drug used as reference in that study. Likewise, Lesjak et al. [31] estab-lished that overall order of anti-inflammatory activity to
quercetin derivatives is quercetin 4-methyl ether> quercetin
= quercetin-3,4-di-O-glucoside> isorhamnetin =
quercetin-3-O-glucuronide> isorhamnetin-3-O-glucoside >
quercetin-3,5,7,3,4-penthamethylether, and it set up clear that the
number of free hydroxyl groups was not the only charac-teristic which could define potential of quercetin conjugates to inhibit COX-1 and 12-LOX pathway of AA metabolism [31]. In the same sense, other researches mention that the number of free hydroxyl groups of flavonoids is not directly proportional with their anti-inflammatory activity, specifi-cally for their COX-2 inhibition potential [32–34]. The exact mechanism of how flavonoids inhibit COX and LOX activity is not known [35].
When comparing the anti-inflammatory activity of OG flower extract with the anti-inflammatory capacity of aspirin, they do not have a statistically significant difference
(t-Student p<0.072); on the other side, the potential of OG
leaf extract as an anti-inflammatory agent is evident (around 97% inflammatory inhibition) and it differs to aspirin
(t-Student p<0.002). Nevertheless, it should be stressed that
the concentrations of OG leaf extract considered are highly cytotoxic and therefore it could be possible that the anti-inflammatory data might be altered by this bioactivity, even so, the traditional medicine reports the traditional use of leaf extract. It should be interesting to explore the anti-inflammatory potential of leaf extracts also at lower and
noncytotoxic concentrations. In light of this consideration, the flower extract appears to be more interesting for health applications, in particular for those concentrations that did
not evidence cytotoxicity (1.56-6.25 𝜇g/mL). In fact, the
OG flower extract showed an anti-inflammatory activity equivalent to that of aspirin with a considerable advantage, since the cytotoxicity of the aspirin was much higher than that of flower extract (Table 4), which implies an important safety of use of this crude drug and makes it a relatively safe alternative for its use as an anti-inflammatory. Finally, the research carried out is a contribution to valorize the forgotten ancient use of this resource (for example, the preparation of “horchata” beverage), currently underutilized. The results of this study could become an opportunity for the local development of the communities through the planting, conservation and rational use of this species and, in this way, improve their economy.
4. Conclusions
In this work, for the first time, flavonoids have been iden-tified in OG leaf and flower hydroalcoholic extracts. In particular, quercetin 𝛽-glucuronide and myricetin 3-O-𝛽-glucuronide have been isolated through silica gel chro-matography and fully characterized through NMR and mass spectrometry. In the leaf extract other two flavonoids were identified and quantified by HPLC-MS-DAD: quercetin
3-O-𝛽-rutinoside (rutin) and isorhamnetin 3-O-𝛽-rutinoside
(narcissin). Moreover, based on the in vitro results of this study, it can be concluded that OG is a very interesting source of natural antioxidant and anti-inflammatory compounds that could be used to prevent many chronic disorders and could be suggested as food supplement. Further in depth investigations on flavonoids responsible for the biological properties should be performed as well as experiments to discover their potential mechanism of action as single molecules and their mixtures.
Data Availability
The data of chemical characterization and bioactivity evalu-ation used to support the findings of this study are included within the article.
Disclosure
An early version of the present manuscript was presented
as short oral communication in the 113th Congress of
the Italian Botanical Society (Fisciano, Salerno, Italy, 12-15 September 2018), in the section “Secondary Metabolites in Plant-Organism Interactions”, with the title “Leaves and flowers of Oreocallis grandiflora (Lam) R.Br. from Ecuador: a new herbal remedy?”.
Conflicts of Interest
The authors declare that there are no conflicts of interest regarding the publication of this paper.
Authors’ Contributions
Matteo Andrea Chiurato and Alessandra Guerrini equally contributed to this work.
Acknowledgments
This research was developed under Agreement MAE-DNB-CM-2018-0086. Thanks are due to Polytechnic School of Chimborazo for giving facilities for development of this research and grant of FAR 2017, University of Ferrara, Italy.
References
[1] A. Magnin, J. Grosfeld, D. Barth´el´emy, and J. Puntieri, “Bud and shoot structure may relate to the distribution area of South American Proteaceae tree species,” Flora, vol. 207, no. 8, pp. 599–606, 2012.
[2] M. Rios, M. J. Koziol, H. Borgtoft, and G. Granda, Plantas ´utiles
del Ecuador aplicaciones, retos y perspectivas, A. Yala, Ed., Quito
(Ecuador), 2007.
[3] M. Alejandro-Espinosa, X. Jaramillo-Fierro, S. Ojeda-Riascos, O. Malag´on-Aviles, and J. Ram´ırez-Robles, “Antioxidant and antihyperglycemic activity of the medicinal specie Oreocallis grandiflora (Lam.) R. Br., in southern Ecuador,” Boletin
Lati-noamericano y del Caribe de Plantas Medicinales y Aromaticas,
vol. 12, no. 1, pp. 59–68, 2013.
[4] M. Monigatti, R. W. Bussmann, and C. S. Weckerle, “Medicinal plant use in two Andean communities located at different altitudes in the Bol´ıvar Province, Peru,” Journal of
Ethnophar-macology, vol. 145, no. 2, pp. 450–464, 2013.
[5] G. M. de La Cruz, S. B. Malpartida, H. B. Santiago, V. Jullian, and G. Bourdy, “Hot and cold: medicinal plant uses in Quechua speaking communities in the high Andes (Callejon de Huaylas, Ancash, Peru),” Journal of Ethnopharmacology, vol. 155, no. 2, pp. 1093–1117, 2014.
[6] M. Rios, F. Tinitana, P. Jarr´ın-v, N. Donoso, and J. C. Romero-Benavides, ““Horchata” drink in Southern Ecuador: Medicinal plants and people’s wellbeing,” Journal of Ethnobiology and
Ethnomedicine, vol. 13, no. 1, pp. 1–20, 2017.
[7] D. Vinueza, D. Cajamarca, K. Acosta, and G. Pilco, “Oreo-callis grandiflora photoprotective effect against ultraviolet B radiation-induced cell death,” Asian Journal of Pharmaceutical
and Clinical Research, vol. 11, no. 2, pp. 276–280, 2018.
[8] H. Wang, D. N. Leach, P. I. Forster, and P. G. Waterman, “Secondary metabolites from Grevillea robusta,” Biochemical
Systematics and Ecology, vol. 36, no. 5-6, pp. 452-453, 2008.
[9] K. Lalrinzuali, M. Vabeiryureilai, and J. Ganesh Chandra, “Ethnomedicinal Use and Phytochemical Analysis of Selected Medicinal Plants of Mizoram, India,” Trends in Green
Chem-istry, vol. 1, no. 18, pp. 1–8, 2015.
[10] A. M. Madureira, A. Duarte, and G. Teixeira, “Antimicrobial activity of selected extracts from Hakea salicifolia and H. sericeae (Proteaceae) against Staphylococcus aureus multiresis-tant strains,” South African Journal of Botany, vol. 81, pp. 40–43, 2012.
[11] H. Wagner and S. Bladt, Plant Drug Analysis: A Thin Layer
Chromatography Atlas, Springer, 2nd edition, 1996.
[12] M. Boukhris, M. S. J. Simmonds, S. Sayadi, and M. Bouaziz, “Chemical composition and biological activities of polar extracts and essential oil of rose-scented geranium, pelargo-nium graveolens,” Phytotherapy Research, vol. 27, no. 8, pp. 1206–1213, 2013.
[13] M. Tacchini, A. Spagnoletti, M. Marieschi et al., “Phytochemical profile and bioactivity of traditional ayurvedic decoctions and hydro-alcoholic macerations of Boerhaavia diffusa L. and Cur-culigo orchioides Gaertn,” Natural Product Research (Formerly
Natural Product Letters), vol. 29, no. 22, pp. 2071–2079, 2015.
[14] A. Nostro, A. Guerrini, A. Marino et al., “In vitro activity of plant extracts against biofilm-producing food-related bacteria,”
International Journal of Food Microbiology, vol. 238, pp. 33–39,
2016.
[15] R. A. Siddiqui, D. English, K. Harvey et al., “Phorbol ester-induced priming of superoxide generation by phosphatidic acid-stimulated neutrophils and granule-free neutrophil cyto-plasts,” Journal of Leukocyte Biology, vol. 58, no. 2, pp. 189–195, 1995.
[16] M. I. Choudhary, Azizuddin, S. Jalil, and Atta-ur-Rahman, “Bioactive phenolic compounds from a medicinal lichen, Usnea longissima,” Phytochemistry, vol. 66, no. 19, pp. 2346–2350, 2005.
[17] A. S. Tan and M. V. Berridge, “Superoxide produced by activated neutrophils efficiently reduces the tetrazolium salt, WST-1 to produce a soluble formazan: a simple colorimetric assay for measuring respiratory burst activation and for screening anti-inflammatory agents,” Journal of Immunological Methods, vol. 238, no. 1-2, pp. 59–68, 2000.
[18] T. M. MacDonald, K. Beard, R. Bruppacher et al., “The safety of drugs for OTC use: What evidence is required for an NSAID switch?” Pharmacoepidemiology and Drug Safety, vol. 11, no. 7, pp. 577–584, 2002.
[19] C. Martin, A. Connelly, T. O. Keku et al., “Nonsteroidal anti-inflammatory drugs, apoptosis, and colorectal adenomas,”
Gastroenterology, vol. 123, no. 6, pp. 1770–1777, 2002.
[20] M. V. Berridge, A. N. S. Tan, K. D. Mccoy, and R. U. I. Wang, “The Biochemical and Cellular Basis of Cell Proliferation Assays That Use Tetrazolium Salts,” Biochemica, vol. 4, pp. 14–19, 1996. [21] A. Guerrini, G. Sacchetti, M. Muzzoli et al., “Composition of the volatile fraction of Ocotea bofo Kunth (Lauraceae) calyces by GC-MS and NMR fingerprinting and its antimicrobial and antioxidant activity,” Journal of Agricultural and Food
Chemistry, vol. 54, no. 20, pp. 7778–7788, 2006.
[22] K. Rashed, A. Said, A. Abdo, and S. Selim, “Antimicrobial activity and chemical composition of Pistacia chinensis Bunge leaves,” International Food Research Journal, vol. 23, no. 1, pp. 316–321, 2016.
[23] J.-H. Moon, T. Tsushida, K. Nakahara, and J. Terao, “Identi-fication of quercetin 3-O-𝛽-D-glucuronide as an antioxidative metabolite in rat plasma after oral administration of quercetin,”
Free Radical Biology & Medicine, vol. 30, no. 11, pp. 1274–1285,
2001.
[24] Y. Chen, H. Yu, H. Wu et al., “Characterization and quan-tification by LC-MS/MS of the chemical components of the heating products of the flavonoids extract in Pollen typhae for transformation rule exploration,” Molecules, vol. 20, no. 10, pp. 18352–18366, 2015.
[25] F. P. Prencipe, R. Bruni, A. Guerrini, D. Rossi, S. Benvenuti, and F. Pellati, “Metabolite profiling of polyphenols in Vaccinium berries and determination of their chemopreventive proper-ties,” Journal of Pharmaceutical and Biomedical Analysis, vol. 89, pp. 257–267, 2014.
[26] J. Lugrin, N. Rosenblatt-Velin, R. Parapanov, and L. Liaudet, “The role of oxidative stress during inflammatory processes,”
biological chemistry, vol. 395, no. 2, pp. 203–230, 2014.
[27] C. Hsu, P. Chao, S. Hu, and C. Yang, “The Antioxidant and Free Radical Scavenging Activities of Chlorophylls and Pheophytins,” Journal of Food and Nutrition Sciences, vol. 04, no. 08, pp. 1–8, 2013.
[28] A. Massi, O. Bortolini, D. Ragno et al., “Research progress in the modification of quercetin leading to anticancer agents,”
Molecules, vol. 22, no. 8, 2017.
[29] P. C. H. Hollman, J. H. M. de Vries, S. D. van Leeuwen, M. J. B. Mengelers, and M. B. Katan, “Absorption of dietary quercetin glycosides and quercetin in healthy ileostomy volunteers,”
American Journal of Clinical Nutrition, vol. 62, no. 6, pp. 1276–
1282, 1995.
[30] V. Karuppagounder, S. Arumugam, R. A. Thandavarayan, R. Sreedhar, V. V. Giridharan, and K. Watanabe, “Molecular targets of quercetin with anti-inflammatory properties in atopic dermatitis,” Drug Discovery Therapy, vol. 21, no. 4, pp. 632–639, 2016.
[31] M. Lesjak, I. Beara, N. Simin et al., “Antioxidant and anti-inflammatory activities of quercetin and its derivatives,” Journal
of Functional Foods, vol. 40, pp. 68–75, 2018.
[32] Y.-C. Chen, S.-C. Shen, W.-R. Lee, W.-C. Hou, L.-L. Yang, and T. J. F. Lee, “Inhibition of nitric oxide synthase inhibitors and lipopolysaccharide induced inducible NOS and cyclooxygenase-2 gene expressions by rutin, quercetin, and quercetin pentaacetate in RAW 264.7 macrophages,” Journal of
Cellular Biochemistry, vol. 82, no. 4, pp. 537–548, 2001.
[33] A. During and Y. Larondelle, “The O-methylation of chrysin markedly improves its intestinal anti-inflammatory properties: structure-activity relationships of flavones,” Biochemical
Phar-macology, vol. 86, no. 12, pp. 1739–1746, 2013.
[34] Y. Takano-Ishikawa, M. Goto, and K. Yamaki, “Structure-activity relations of inhibitory effects of various flavonoids on lipopolysaccharide-induced prostaglandin E2production in rat peritoneal macrophages: comparison between subclasses of flavonoids,” Phytomedicine, vol. 13, no. 5, pp. 310–317, 2006. [35] M. D. Catarino, O. Talhi, A. Rabahi, A. M. S. Silva, and S.
M. Cardoso, “The Antiinflammatory Potential of Flavonoids: Mechanistic Aspects,” Studies in Natural Products Chemistry, vol. 48, pp. 65–99, 2016.
Stem Cells
International
Hindawi www.hindawi.com Volume 2018 Hindawi www.hindawi.com Volume 2018 INFLAMMATIONEndocrinology
International Journal of Hindawi www.hindawi.com Volume 2018 Hindawi www.hindawi.com Volume 2018Disease Markers
Hindawi www.hindawi.com Volume 2018 BioMed Research InternationalOncology
Journal of Hindawi www.hindawi.com Volume 2013 Hindawi www.hindawi.com Volume 2018Oxidative Medicine and Cellular Longevity
Hindawi
www.hindawi.com Volume 2018
PPAR Research
Hindawi Publishing Corporation
http://www.hindawi.com Volume 2013 Hindawi www.hindawi.com
The Scientific
World Journal
Volume 2018 Immunology Research Hindawi www.hindawi.com Volume 2018 Journal ofObesity
Journal of Hindawi www.hindawi.com Volume 2018 Hindawi www.hindawi.com Volume 2018 Computational and Mathematical Methods in Medicine Hindawi www.hindawi.com Volume 2018Behavioural
Neurology
Ophthalmology
Journal of Hindawi www.hindawi.com Volume 2018Diabetes Research
Journal ofHindawi
www.hindawi.com Volume 2018
Hindawi
www.hindawi.com Volume 2018
Research and Treatment
AIDS
Hindawi
www.hindawi.com Volume 2018
Gastroenterology Research and Practice
Hindawi www.hindawi.com Volume 2018