The Rockefeller University Press $30.00 J. Gen. Physiol. Vol. 145 No. 2 127–153
www.jgp.org/cgi/doi/10.1085/jgp.201411250 127
I N T R O D U C T I O N
This Methods and Approaches article describes a new method for determining the concentration of total cal-cium in a tissue sample. The technique involves releas-ing Ca into a solution containreleas-ing the Ca chelator 1,2-bis (2-aminophenoxy)ethane-N,N,N,N-tetraacetic acid (BAPTA), present at a concentration severalfold greater than that needed to capture all of the released Ca. The amount of Ca bound by BAPTA is determined by the Ca-dependent change in BAPTA’s UV absorbance spectrum.
One motivation for this study was to determine the physiological concentration of total Ca in whole skeletal
C.R.H. Lamboley and S.A. Kake Guena contributed equally to this paper. Correspondence to Paul C. Pape: P a u l . P a p e @ U S h e r b r o o k e . c a
Abbreviations used in this paper: AAS, atomic absorption spectroscopy; BAPTA, 1,2-bis(2-aminophenoxy)ethane-N,N,N,N-tetraacetic acid; CSQ, calsequestrin; EDL, extensor digitorum longus; KO, knockout; SERCA, sar-coplasmic/endoplasmic reticulum Ca2+-ATPase; TCA, trichloroacetic acid.
muscles including fast- and slow-twitch muscles from mice and rats and twitch muscles from frog. Because experiments aimed at understanding excitation–contrac-tion coupling and its regulaexcitation–contrac-tion and other quesexcitation–contrac-tions involving Ca homeostasis are often performed with iso-lated single muscle cells or portions of such cells, such as cut fibers or skinned fibers, one reason for these mea-surements was to establish to what extent the range of total Ca concentrations previously published for some of these isolated preparations (e.g., Pape et al., 1995, and Fryer and Stephenson, 1996) agree with the physiologi-cal range in whole muscle reported here. As shown in the Discussion, the results with whole twitch muscles from
New method for determining total calcium content in tissue applied
to skeletal muscle with and without calsequestrin
Cédric R.H. Lamboley,1 Sandrine A. Kake Guena,2 Fatou Touré,2 Camille Hébert,2
Louiza Yaddaden,2 Stephanie Nadeau,2 Patrice Bouchard,3 Lan Wei-LaPierre,4 Jean Lainé,2
Eric C. Rousseau,2 Jérôme Frenette,3 Feliciano Protasi,5 Robert T. Dirksen,4 and Paul C. Pape2
1Institute of Sport, Exercise and Active Living, Victoria University, Melbourne, Victoria 8001, Australia
2Département de physiologie et biophysique, Université de Sherbrooke Faculté de Médicine et des Sciences de la Santé, Sherbrooke, Québec J1H5N4, Canada
3Département de Réadaptation, Université Laval, Québec G1K 7P4, Canada
4Department of Pharmacology and Physiology, University of Rochester Medical Center, Rochester, NY 14642
5Center for Research on Aging and Department of Neuroscience, Imaging and Clinical Sciences, “G. d’Annunzio” University of Chieti-Pescara, I-66100 Chieti, Italy
We describe a new method for determining the concentration of total Ca in whole skeletal muscle samples ([CaT]WM
in units of mmoles/kg wet weight) using the Ca-dependent UV absorbance spectra of the Ca chelator BAPTA (1,2-bis(2-aminophenoxy)ethane-N,N,N,N-tetraacetic acid). Muscle tissue was homogenized in a solution con-taining 0.15 mM BAPTA and 0.5% sodium dodecyl sulfate (to permeabilize membranes and denature proteins) and then centrifuged. The solution volume was adjusted so that BAPTA captured essentially all of the Ca. [CaT]WM
was obtained with Beer’s law from the absorbance change produced by adding 1 mM EGTA to capture Ca from BAPTA. Results from mouse, rat, and frog muscles were reasonably consistent with results obtained using other methods for estimating total [Ca] in whole muscles and in single muscle fibers. Results with external Ca removed before determining [CaT]WM indicate that most of the Ca was intracellular, indicative of a lack of bound Ca in the
extracellular space. In both fast-twitch (extensor digitorum longus, EDL) and slow-twitch (soleus) muscles from mice, [CaT]WM increased approximately linearly with decreasing muscle weight, increasing approximately twofold
with a twofold decrease in muscle weight. This suggests that the Ca concentration of smaller muscles might be in-creased relative to that in larger muscles, thereby increasing the specific force to compensate for the smaller mass. Knocking out the high capacity Ca-binding protein calsequestrin (CSQ) did not significantly reduce [CaT]WM in
mouse EDL or soleus muscle. However, in EDL muscles lacking CSQ, muscle weights were significantly lower than in wild-type (WT) muscles and the values of [CaT]WM were, on average, about half the expected WT values, taking
into account the above [CaT]WM versus muscle weight relationship. Because greater reductions in [CaT]WM would
be predicted in both muscle types, we hypothesize that there is a substantial increase in Ca bound to other sites in the CSQ knockout muscles.
© 2015 Lamboley et al. This article is distributed under the terms of an Attribution– Noncommercial–Share Alike–No Mirror Sites license for the first six months after the publi-cation date (see http://www.rupress.org/terms). After six months it is available under a Creative Commons License (Attribution–Noncommercial–Share Alike 3.0 Unported license, as described at http://creativecommons.org/licenses/by-nc-sa/3.0/).
The Journal of General Physiology
on January 26, 2015
jgp.rupress.org
Downloaded from
Supplemental Material can be found at:
on January 26, 2015 jgp.rupress.org Downloaded from on January 26, 2015 jgp.rupress.org Downloaded from on January 26, 2015 jgp.rupress.org Downloaded from on January 26, 2015 jgp.rupress.org Downloaded from on January 26, 2015 jgp.rupress.org Downloaded from on January 26, 2015 jgp.rupress.org Downloaded from on January 26, 2015 jgp.rupress.org Downloaded from on January 26, 2015 jgp.rupress.org Downloaded from on January 26, 2015 jgp.rupress.org Downloaded from on January 26, 2015 jgp.rupress.org Downloaded from on January 26, 2015 jgp.rupress.org Downloaded from on January 26, 2015 jgp.rupress.org Downloaded from on January 26, 2015 jgp.rupress.org Downloaded from
a full or partial explanation for the lack of effect of CSQ KO on the twitch response. Decreases in negative
feed-back mechanisms controlling SR Ca2+ release, in
partic-ular Ca inactivation, would also help explain the mostly unaltered twitch response (in a manner well explained in Discussion section in Posterino and Lamb, 2003). Even with the apparently contradictory result with the twitch response, CSQ is still expected to play an important role
on SR Ca2+ release as evidenced, in part, by faster
fa-tigue development with CSQ knocked out (Paolini et al., 2011). In regards to the Ca-storage function of CSQ and its loss with CSQ KO, we hypothesize that this func-tion is replaced by the up-regulafunc-tion of one or more other Ca-binding proteins and/or other Ca-binding sites in the SR.
One unexpected new finding in this study was the ob-servation of significant increases in the concentration of total Ca content with decreasing muscle weight in both fast- and slow-twitch muscles from mice. This re-sult suggests the presence of a physiological mechanism that increases the concentration of Ca in the SR in re-sponse to increased specific work demands, thereby in-creasing the specific force that the muscle can generate with a twitch.
The technique described here should be useful for determining total Ca levels in almost any tissue.
A preliminary report of some of these results was pre-sented to the Biophysical Society (Kake-Guena et al., 2014).
M A T E R I A L S A N D M E T H O D S
Absorbance measurements (250–340 nm) were made at room tem-perature (22–23°C) with a spectrophotometer (Ultraspec 2000; Pharmacia). The quartz cuvette generally used had 1-cm path length, a height of 2.5 cm, and a chamber width of 3 mm, allowing a somewhat small sample volume, typically 0.45 ml. Unless indicated, experiments were performed in a solution containing 120 mM KCl and 2 mM HEPES, pH 8.0, and a nominal concentration of 0.15 mM BAPTA. The value of pH 8.0 was chosen to give a negli-gible value for the protonated form of BAPTA (see Fig. S1 and Sections 1 and 2 of the supplemental text). This solution is re-ferred to as the “usual measurement solution” or the “measure-ment solution.” The only other solution used for the measure“measure-ments was one that contained 2 mM [Mg] in addition to the constituents of the usual measurement solution (see last section of Results). The term “final solution” refers to the measurement solution with SDS and muscle added and processed as described below; muscle-sample absorbance values were obtained with this final solution.
All absorbance values shown in this Methods and Approaches article were corrected for the blank, i.e., by taking the difference between the sample absorbance and that measured with distilled water in the same cuvette. (There was no detectable difference between the absorbance values with just water and those with a solution that was the same as the usual measurement solution but without BAPTA.)
Composition of solutions other than the measurement solutions
Muscle samples were generally placed in a physiological or modi-fied physiological solution for some period of time (usually just
frog in this study are in close agreement with the total amount of releasable Ca from the SR in cut fibers under nominally physiological conditions. However, in con-trast to an earlier report that less than half of the total Ca in whole muscle from frog is intracellular, indicating a very large amount of bound Ca in the extracellular space (Kirby et al., 1975), results in this study indicate a relatively small extracellular Ca component.
A second motivation for this study relates to the cur-rent understanding of the role of calsequestrin (CSQ) as a high capacity Ca-binding protein in skeletal muscle. Starting with the discovery of CSQ by MacLennan and Wong (1971), almost all researchers have suggested that this protein acts as a major buffer of total Ca in the SR. In support of this view, based on experiments with Ca indicators introduced into voltage-clamped cut fi-bers from frog, Pape et al. (2007) reported that almost all of the Ca in the SR is in the bound form in resting muscle; similarly, almost all of the Ca released by a voltage-clamp step comes from the bound pool (Fénelon et al., 2012). Further, the Ca-binding curve relating bound to free Ca in the SR is largely consistent with a single, co-operative Ca-binding component. This curve was inter-preted as indirect evidence that a single Ca-binding entity, presumably CSQ, is responsible for 80% or more of the Ca binding in the SR (Fénelon et al., 2012). This possi-bility is consistent with earlier, more direct evidence in-dicating that the maximal Ca-binding capacity of the SR in skinned mammalian muscle fibers is accounted for by CSQ (Murphy et al., 2009). These findings—combined with the knowledge that CSQ is localized near the SR
Ca2+ release channels in the luminal SR, tethered there
by triadin and junctin (Zhang et al., 1997)—strongly
suggest that CSQ plays an important role in SR Ca2+
re-lease. In apparent contradiction to this idea, the ampli-tude of the twitch response is about the same or slightly greater in both fast- and slow-twitch muscle with CSQ knocked out (Paolini et al., 2007, 2011).
Another question arising from studies of muscles with the skeletal isoform of CSQ (type 1 CSQ, CSQ1) knocked out is whether or not the loss of CSQ results in the ex-pected large reduction in the Ca content in muscle. One indirect approach for assessing total releasable Ca in permeabilized single extensor digitorum longus (EDL) fibers indicated an 70% decrease in readily releasable Ca in CSQ1-knockout (KO) fibers compared with con-trol fibers (Fig. 8, B and E, of Paolini et al., 2007; discussed further in the Discussion). In contrast, results for EDL muscle in Table 1 of Sztretye et al. (2011) indicated only a modest (25%) decrease in the total SR Ca in fibers from CSQ1-KO versus WT mice. A main motivation for developing the new technique described in this Meth-ods and Approaches article was to try to help resolve this controversy.
We found that knocking out CSQ had little effect on the concentration of total Ca in whole muscles, providing
on January 26, 2015
jgp.rupress.org
[Ca2+] from the known values of [CaT] and the adjustable pa-rameters [BT] and Kd; the nonlinear, horizontal axis at the top of Fig. 1 shows the values of [Ca2+] corresponding to those of [CaT] shown on the bottom axis. The good fit of the red solid curve to the data in Fig. 1 is consistent with the conclusion of Tsien (1980) of a simple 1:1 stoichiometry, which he observed for the full tested ranges of BAPTA concentrations (0.01–1 mM) and concen-trations of free Ca2+ (up to 1 mM). As [BT] was <0.15 mM for all of the experiments reported here, the simple 1:1 stoichiometry should apply to all of the results reported in this Methods and Approaches article, assuming the addition of tissue does not af-fect this Ca-BAPTA reaction. The extinction coefficients at 292 nm of the Ca-free and Ca-bound forms of BAPTA, B and CaB, were obtained with Beer’s law from the best-fit values of Azero and Ainf, respectively, and [BT]. The best-fit values of Kd, [BT], B, and CaB were, respectively, 0.22 µM, 0.127 mM, 5,009 M1 cm1, and 320 M1 cm1. This value of Kd, which applies to the ionic strength of this study (0.12 M), is reasonably close to the value of 0.18 µM estimated from data in Harrison and Bers (1987). Because the nominal concentration of total BAPTA was 0.15 mM, the value of 0.127 mM for [BT] indicates a purity of 85% (100 × 0.127 ÷ 0.15). This lack of 100% purity is probably caused by the presence of water, as Harrison and Bers (1987) reported a purity of 79% and determined that the impurity was caused by the presence of water. Our estimated values of 320 and 5,009 M1 cm1 for CaB and B, respectively, are in very good agreement with the values of 339 and 5,052 M1 cm1 at 292 nm estimated from Fig. 1 of Tsien (1980). Of particular interest for this Methods and Approaches article is the difference in extinction coefficients between the Ca-bound and Ca-free forms at 292 nm, denoted “,” given by the value 4,689 M1 cm1 (4,689 = 320 5,009). In conclusion, the properties of BAPTA estimated in this study agree with pub-lished values, and the reaction of Ca with BAPTA follows a simple 1:1 stoichiometry, at least in the absence of tissue.
The sloped dashed line shown in blue in Fig. 1 gives the least-squares best-fit line to the first six points, and the horizontal dashed line in green reflects the best-fit value of Ainf. As expected from the underlying relationships (not depicted), the value of [CaT] at the intersection of these two lines is very close to the best-fit value of [BT]. It is clear that the relationship between BAPTA absor-bance and [CaT] is essentially linear over the range of [CaT] values from zero to 0.11 mM, which is 87% of the best-fit (measure-ment-derived) value of 0.127 mM for [BT] given above. With the exception of the intentional addition of higher saturating levels of [CaT], the total concentration of Ca from all sources (calcium from the muscle, the background solution, and the known amount from a Ca standard) was generally <75% of the measured concen-tration of BAPTA in the muscle experiments, so that the relation-ship between absorbance and total Ca concentration should be approximately linear for wavelengths such as 292 nm once back-ground absorbance from muscle components is subtracted. Al-though the relationships derived below for determining [CaT] in a tissue sample do not assume a linear relationship between [CaT] and BAPTA absorbance for this range of [CaT] values, the final results presented for [CaT] do neglect any contribution of [Ca2+] to [CaT]. This is justified because the calculated values of [Ca2+] were no more than 0.4% of [CaT] over this range of [CaT] values, this maximum value occurring when [CaT] was 62% of [BT] (from results associated with Fig. 1).
Processing of muscle samples
A whole muscle (from tendon to tendon) was removed from the animal. Unless indicated, the sample was placed in the mamma-lian Ringer’s solution (for mice or rat) or normal Ringer’s solu-tion (for frog) for a short period (generally <10 min), and then gently blotted dry and weighed. Because most experiments did not require living tissue, muscle samples were often weighed and briefly) before being blotted dry and weighed (see below). The
mammalian Ringer’s solution used for the mammalian muscle samples contained 146 mM NaCl, 5 mM KCl, 2 mM CaCl2, 1 mM MgCl2, and 10 mM HEPES titrated with NaOH to pH 7.4.
The composition of the normal Ringer’s solution used for frog muscle is given in Table 1 of Irving et al. (1987); this solution contained 1.8 mM Ca. The 0 Ca Ringer’s solution for the frog muscle contained (mM): 107 NaCl, 2.5 KCl, 2.15 Na2HPO4, 0.85 NaH2PO4, and 10 MgCl2, pH 7.1.
Properties of Ca binding to BAPTA
The experiment described in this section gives properties of the lot of BAPTA used in this study, done in part to confirm that these properties agree with published values. Fig. 1 plots BAPTA-re-lated absorbance at 292 nm versus different concentrations of total Ca (denoted “[CaT]”) in addition to the usual constituents of the usual measurement solution. The different values of [CaT] were obtained by adding Ca from another solution containing the usual measurement solution with a known amount of total Ca (to give 100 mM CaCl2) added from a known CaCl2 standard. The red (solid) curve in Fig. 1 shows the least-squares best fit to the data of predicted absorbance values assuming a one-to-one binding reac-tion between Ca and BAPTA. The adjustable parameters for this fit were the Kd, the concentration of total BAPTA ([BT]; total de-fined as the sum of Ca-free plus Ca-bound forms of BAPTA), and the absorbance values with no Ca present (Azero) and with infinite Ca (Ainf), i.e., with all of the BAPTA in the Ca-bound form. An intermediate step of the fitting process was to determine values of
Figure 1. BAPTA absorbance at 292 nm versus [CaT]. See the de-scription of this figure in the text for details of the experimental results and how the measured absorbance values were obtained. The text also describes how the solid red curve was obtained based on a 1:1 binding relationship for Ca to BAPTA. The best-fit value of Azero associated with the red curve was 0.6375. The best-fit value of Ainf associated with the red curve was 0.0407, plotted as the horizontal hashed line (in green). The sloped hashed line shown (in blue) gives the least-squares best fit to the first six points. The slope and y intercept for this line are 4.625 mM1 and 0.6362, respectively. The experiment ID was 821131. Experiment IDs are provided as an aid to the authors should access to the data and associated material be required.
on January 26, 2015
jgp.rupress.org
supernatant was then transferred to another tube for later use in the different aliquots described below.
It is noted that it was not considered necessary to correct Vsolution for the part of the processed sample in which BAPTA might be excluded, namely the solid part of the muscle in the pellet after centrifugation. This excluded volume is negligible as indicated by the following calculation. Considering typical values of a mouse muscle sample weighing 10 mg and 1.2 ml for Vsolution and assum-ing that 80% of a muscle is water (Baylor et al., 1983), the pellet would contain 2 mg of solids, giving an excluded volume of 0.002 ml, which is <0.2% of Vsolution.
The method assumes that BAPTA was able to complex all of the Ca, leaving none bound to muscle components and none in the pellet except for that present in any aqueous part of the pellet. Although no attempt was made to measure Ca in the pellet, calcu-lations discussed later indicate that BAPTA should have been able to compete Ca off all muscle components with the possible excep-tion of Ca/Mg-binding sites on parvalbumin, troponin, and myosin. Experiments to be discussed—with 2 mM Mg to mostly eliminate Ca binding to such sites—indicate that BAPTA was able to com-pete Ca off these sites probably because of decreases in the affini-ties of these proteins for Ca binding caused by the denaturing effect of SDS on proteins.
Absorbance measurements used to determine the amount of total Ca in a tissue sample
Four absorbance measurements, AM, A0, AS, and A, were generally made with the supernatant solution after the centrifugation step described above. AM was determined with the supernatant alone, i.e., with no further processing. For the A0 measurement, EGTA was added to an aliquot of supernatant solution (usually added to the quartz cuvette with the same aliquot used for the AM measure-ment) to capture the Ca from BAPTA. With the nominal concen-tration of 1 mM EGTA used for A0, calculations indicate that EGTA should complex >99.5% of the total Ca present (second to last sec-tion of the Appendix). For the AS measurement, a known amount of Ca from a calcium standard was added to another aliquot of the supernatant solution (i.e., the AM solution). A was obtained by adding excess Ca (to give a concentration of 1 mM Ca) to another aliquot of the supernatant or to the AS aliquot so that essentially all of the BAPTA present was in the Ca-bound form.
Assumptions and equations used for interpreting absorbance data
This section gives the equations used to analyze the absorbance data, equations based on the following assumptions:
Assumption 1. BAPTA binds essentially all of the Ca initially present in the muscle sample and any background Ca present in the solution, which includes possible Ca leached from the cen-trifuge tubes. We denote the corresponding concentrations of CaBAPTA from these sources as “[CaB]M” and “[CaB]background,” re-spectively. As justified above, the level of free [Ca] is negligible compared with the Ca bound to BAPTA. In addition, with its high affinity and relative large concentration (0.13 mM), BAPTA should be able to capture Ca from essentially all of the large-ca-pacity, Ca-binding proteins in the muscle, including CSQ, sarco-plasmic/endoplasmic reticulum Ca2+-ATPase (SERCA), and the Ca-regulatory sites on troponin (see Table 2 in the first section of the Appendix and its associated text). A possible exception to this was Ca bound to the Ca/Mg-binding sites on parvalbumin and the high affinity Ca/Mg-binding sites on troponin and myosin. As shown in the last section of Results, experiments with added Mg indicate that Ca was not lost by this route, so that BAPTA did apparently capture almost all of the Ca initially present in the muscle samples.
then frozen before further processing. The solution used in the further processing was either the usual measurement solution or the measurement solution with Mg added. For both mice and rats, soleus (slow-twitch) and EDL (fast-twitch) muscles were used. For frog, the muscles used were semitendinosus (all twitch fibers) and ileofibularis, with the latter composed of almost all twitch fi-bers with a very small fraction of slow fifi-bers. Care was taken to take as little tendon as possible without damaging the muscle.
Much or all of the processing of the samples described below was performed with the samples in the tubes used for centrifuga-tion, using weight to keep track of the total volume of measure-ment solution added. In the case of frog and rat muscles (ranges of muscle weights: 60–120 mg and 120–300 mg, respectively), the high density polyethylene centrifuge tubes (Sarstedt) used had vol-umes of 15 and 50 ml, respectively. In the case of mouse muscles (4–13 mg), 1.5-ml Eppendorf tubes (made from “homo-polymer”; MCT-150-C; Axygen) were used. As described below, background levels of Ca were determined in the same manner as described here, except with no muscle present. Early studies with polycar-bonate centrifuge tubes gave background Ca levels that differed from tube-to-tube, consistent with Ca leaching from the tubes at different rates. If Ca leaching did occur with the centrifuge tubes described above used for this study, these rates were small and, more importantly, there was no detectable tube-to-tube variability so that any contribution of Ca leaching to background Ca would have been correctly estimated and subtracted.
After weighing, a muscle was homogenized in a centrifuge tube with either an electrical homogenizer (PowerGen 125 grinder with a 10 × 95–mM saw tooth stator; Thermo Fischer Scientific) or a manual tissue grinder (Kontes Duall Tissue Grinder with PTFE pestle of appropriate size for the centrifuge tube; Thermo Fischer Scientific). For a muscle sample from a frog, rat, or mouse, ho-mogenization was typically performed with, respectively, 1, 1, or 0.2 ml of measurement solution added to the muscle. In the case of frog muscle, the muscle was ground with the electric homogenizer running for 1 min at 14,000 rpm and 20 s or more at 8,000 rpm. For a rat or mouse muscle, the muscle was ground manually for 3–5 or 1–2 min, respectively. In every case, the aim was to com-pletely homogenize the non-tendon part (i.e., fleshy part) of the muscle. After homogenization, additional measurement solution was added to give a final volume of 10 or 14 ml for frog (for ileo-fibularis or semitendinonus muscles, respectively), 40 ml for rat, and 0.5–1.2 ml for mouse muscle samples. For the most common muscle weights from mice, 7–13 mg, the final volume was gener-ally 1.2 ml. For mouse muscles weighing <7 mg, the final solution volume was 0.5 or 0.6 ml, in which case the A and the optional AS aliquots were not done. As described below for this case, a very close estimate of the concentration of total Ca in the muscle sam-ple could still be obtained, with an error generally <2%. Much of the measurement solution added to reach the final volume was used to rinse the material off of the grinding instrument into the centrifuge tube. The detergent SDS was added to give a concen-tration of 0.5% (wt/vol) in the final solution. In the case of the electric grinder, the SDS was added after the grinding to avoid excessive foaming. For the manual homogenization, 0.5% SDS was present throughout. In addition to dissolving the surface and T-system membranes, SDS greatly reduced the intrinsic absor-bance associated with proteins, presumably by its ability to dena-ture the proteins so that they were more readily removed with the next step, centrifugation. The volume of the final solution includ-ing the added SDS (denoted “Vsolution” below) was determined by weight (subtracting off the previously measured weight of the cen-trifuge tube), assuming a density of 1 g/ml for the mostly aqueous solution at this point.
To remove proteins and other insoluble muscle components that would produce unwanted absorbance or light scattering, samples were centrifuged at 14,000 rpm for 45 min at 6°C. The
on January 26, 2015
jgp.rupress.org
and A A l CaB S M S − ⋅ =[ ] ∆ε , (7)
where ∆ε ε≡ CaB−εB. It is noted that AS AM in combination with the amount of Ca added from the standard can be used as a check on the product · l. Therefore, the method does not require the use of the standard measurement. In particular, the essential value [BT] can be determined from Eq. 6 or from the following relationship obtained by combining Eqs. 6 and 7:
B A A A A CaB T S M S [ ]= − − [ ] ∞ 0 . (8)
It is useful to express binding in terms of the fraction of BAPTA bound with Ca, denoted “f,” and given by
f CaB CaB
B
M background
T
≡[ ] +[ ] . (9)
The value of f can be considered as the sum of two parts depend-ing on the source of Ca, i.e., muscle (M) or background, given by the following relationships:
f =fM+fbackground, (10) where f CaB B M M T ≡[ ] [ ] (11) and f CaB B background background T ≡[ ] [ ] . (12)
From Eqs. 5, 6, and 9, f is determined from the absorbance values by
f A A A A M = − − ∞ 0 0 . (13)
The value of fbackground was determined in the same way as f, except that muscle was not present, using the relationship
f S S S S background= M − − ∞ 0 0 , (14)
where S (which designates solution only) replaces A to denote absorbance values with no muscle present. Because the back-ground Ca could come from one or more of several sources—in-cluding the KCl used for the measurement solution, the detergent (SDS), and possibly the HEPES buffer and from Ca leaching from the centrifuge tubes—the absorbance measurements without muscle were obtained from solutions treated the same way as the muscle samples, including the addition of SDS followed by cen-trifugation. From Eqs. 10, 13, and 14,
f f f A A A A S S S S M = − background = M M − − − − − ∞ ∞ 0 0 0 0 . (15)
The value of [CaB]M was obtained from the relationship CaBM fM BT
[ ] = ⋅[ ], (16a)
Assumption 2. Binding of ions other than Ca to BAPTA is negli-gible because of the binding properties of BAPTA and the maxi-mum expected concentration of other ions (e.g., Mg2+) present in the muscle sample. This assumption is justified for protons at the value of 8 for the pH for the measurement solution (Sec-tion 1 of the supplemental text) and for Mg (last sec(Sec-tion of the Appendix, “The contribution of Mg from muscle samples is neg-ligible”). The contribution of other possible ions should also be negligible.
Assumption 3. The reaction of Ca with BAPTA has a simple 1:1 stoichiometry in the concentration range of interest for BAPTA, i.e., 0.04–0.15 mM. (The justification for this assumption is given above.)
Assumption 4. The intrinsic absorbance of the sample (denoted “AINTR”; see below)—defined as non-BAPTA–related absorbance—is not affected by changes in the concentration of free Ca2+ or by the addition of EGTA. It will be seen that AINTR becomes quite pronounced at shorter wavelengths and that almost all of it is caused by muscle components remaining in the solution after the centrifugation.
Assumption 5. BAPTA and CaBAPTA do not bind to the intrinsic muscle components or any other components in the solution (spe-cifically the pH buffer, HEPES), or such binding, if it does occur, does not affect the results.
With these assumptions, the equation for AM is given by
A A CaB CaB B CaB CaB M INTR CaB M background B T M b = +
(
+)
+ − − ε ε [ ] [ ] [ ] [ ] [ ]aackground l(
)
⋅ , (1)where the contributions of Ca-free and Ca-bound BAPTA are given by the Beer–Lambert law, where l is the path length in the cuvette (always 1 cm), and CaB and B are the extinction coeffi-cients of the Ca-bound and Ca-free forms of BAPTA, respectively. Likewise, with all of the BAPTA in the Ca-free form,
A0=AINTR +εB[ ]BT ⋅l, (2) With all of the BAPTA in the Ca-bound form
A∞=AINTR+ε [ ] .CaB BT ⋅l (3)
The absorbance value of the aliquot with the added standard is given by
A A CaB CaB CaB
B CaB S INTR CaB M background S B T M = +
(
+ +)
+ − ε ε [ ] [ ] [ ] [ ] [ ] −− −(
)
⋅ [CaB]background [CaB]S l,(4)where [CaB]S denotes the increase in the concentration of total
Ca caused by the addition of Ca from the standard. With AINTR assumed to be the same for all four absorbance values (Assump-tion 4), one obtains the following rela(Assump-tionships:
A A l CaB CaB M M background − ⋅ 0 =[ ] +[ ] ∆ε , (5) A A l BT ∞− ⋅ 0 =[ ] ∆ε , (6) on January 26, 2015 jgp.rupress.org Downloaded from
so that the corrected A0 value refers to the concentration of BAPTA that was present in AM. When comparing absorbance measure-ments with muscle samples present to those without muscle sam-ples present (Eqs. 13 and 14), a similar correction was made for the fact that the BAPTA was diluted by the volume of the muscle added. For example, with a mouse muscle weighing 8 mg added to a volume 1.2 ml of measurement solution, the volume of the muscle added is assumed to be 0.00755 ml (0.008 g divided by the assumed density of muscle, 1.06 g/ml; Mendez and Keys, 1960). To refer to the concentration of BAPTA present in the AM mea-surement, the absorbance values with no muscle present (S val-ues) were scaled by 0.994 (0.994 = 1.2 ml ÷ (1.2 ml + 0.00755 ml)).
A model protocol with practical suggestions for adapting it to other tissues
The first part of this section summarizes the protocol currently used in our laboratory for a 7–13-mg mouse muscle sample (re-ferred to below as the 10-mg tissue sample). This protocol could serve as a model for adapting the BAPTA method to other size tissue samples, a process that would likely require scaling some of the variables involved if tissue samples are outside of the 7–13-mg range. Some practical suggestions are given for this process and for some of the steps in the method.
After extraction and weighing of the 10-mg tissue sample, the tissue is put into a 1.5-ml Eppendorf tube. The sample is option-ally frozen for later processing, with the latter all done on the same day to minimize possible slow leaching of Ca into the sam-ple once aqueous solution has been added. For the same reason, the measurement solution with 2 mM Mg is made on the same day, and 0.5% SDS is added. About 0.2 ml of this solution is added to the Eppendorf tube, and the tissue is manually homogenized. After homogenization, more of the measurement solution with Mg and SDS is added to give a volume of 1.2 ml, the actual vol-ume (Vsolution) determined by weight as described above. After a period of 30 min to assure complete redistribution of Ca to BAPTA (no tests were performed to establish this waiting period, and it is unknown if any time beyond a few minutes is actually re-quired), the sample is centrifuged and the supernatant is removed and placed in another Eppendorf tube. For the AM measurement, 0.45 ml of this supernatant is introduced into the quartz cuvette (see above). For the A0 measurement, 9 µl of a 50-mM EGTA solu-tion is added to the cuvette to give 1 mM EGTA. For the AS mea-surement, the quartz cuvette is then thoroughly rinsed and dried, and another 0.45 ml of the supernatant is added followed by the addition of 9 µl of a 1.5-mM CaCl2 standard solution (made by multiple dilutions from a 0.1-M CaCl2 standard) to give an addi-tional 0.03 mM of Ca ([CaB]S). (For reasons described later, glass Pasteur pipettes should not be used for mixing the As aliquot, as these introduce Ca. Our current method for mixing is to cover the cuvette with a small square of Parafilm, grasp the cuvette be-tween fingers on the top and bottom of the cuvette, and turn it over several times. The finger pressure on the Parafilm helps seal the cuvette.) For the A measurement, 9 µl of a 50-mM CaCl2 stan-dard solution is added to the cuvette with the AS aliquot to give an additional 1 mM of Ca. Glass Pasteur pipettes can be used for mixing the A0 and A aliquots because the Ca contamination would not be a problem for these aliquots.
Although absorbance measurements made over a range of wave-lengths have the advantage of confirming well-behaved spectral properties (see Figs. 3–5), measurements are only needed at one wavelength. A wavelength of 292 nm would be a good choice be-cause: (a) information about is provided in this Methods and Approaches article for this wavelength, (b) a local peak in the differ-ence spectra occurs near this wavelength, and (c) there should be relatively little intrinsic absorbance at this wavelength (Figs. 2–5).
The main variables when considering modifying the protocol and/or adapting it to different tissue masses are the concentration where [BT] can be determined by Eq. 6 or by Eq. 8, as indicated
above. Substituting Eqs. 6 and 15 into Eq. 16a gives:
CaB A A S S A A S S l M M M [ ] = ( − )−( − ) − − ⋅ ⋅ ∞ ∞ 0 0 0 0 1 ∆ε .. (16b)
As indicated later, with Eq. 18 in Results, the ratio (A A0)/ (S S0) gives the ratio of [BT] in the solution with the muscle sample to that without the muscle sample. As shown in Results shortly after Eq. 18, the average value for this ratio was 0.961, which is close to 1, indicating that there was almost no loss of BAPTA caused by interaction with muscle components. The main things to note from this are: (a) the AM A0 and SM S0 are the most important measurements, (b) AS and SS are not needed, and (c) A and S are almost not important at all. In fact, as seen next, a very good approximation of [CaB]M can be made without A and S.
If one assumes a value of 1 for (A A0)/(S S0), a very good approximation of [CaB]M is given by
[CaB] A A S S .
l M ≅( M− 0)−( M− 0) ⋅ ⋅
1
∆ε (16c)
This approximation was used for some measurements with small muscle samples where enough supernatant was not available to make the AS and A measurements (see above). The degree to which this approximation agrees with Eq. 16b can be assessed by dividing Eq. 16c by Eq. 16b, giving:
CaB from eqn c
CaB from eqn b
S S A A S S M M M M M [ ] [ ] = − − − − − _ _ _ _ _ _ 16 16 1 1 0 0 0 A A A A A S S M− ⋅ − − ∞ ∞ 0 0 0 . (16d)
Because the ratio (A A0)/(S S0) was generally <1, the ap-proximation generally results in an underestimation. As an ex-ample of the error, with a value of 0.3 for the ratio (SM S0)/(AM A0), which is near the maximum measured, and with the value above of 0.961 for the ratio (A A0)/(S S0), Eq. 16d gives a value of 0.984 ((1 0.3) ÷ (1 (0.3 × 0.961))), i.e., only a 1.6% error. Because the error is almost negligible, no attempt was made to correct for it, for example by assuming a value of 0.961 instead of 1 for the ratio (A A0)/(S S0).
The main value of interest is the concentration of total Ca from the muscle in units of mmoles/kg (denoted “[CaT]WM”, where the subscript “WM” refers to whole muscle):
Ca V
W CaB
T WM solution
muscle M
[ ] = [ ] , (17)
where Vsolution is the volume of the solution and muscle combined before the centrifugation step (see description of Vsolution above), and Wmuscle is the wet weight of the muscle in grams (muscles blot-ted dry and weighed).
Correcting for small differences in BAPTA concentration in the different samples
Unless indicated, all of the absorbance values (except AM) were corrected for small differences in BAPTA concentration, so that all of the absorbance values refer to the concentration of BAPTA in the AM solution. As an example, for the results from muscles from mice, AM was measured first with 0.45 ml in a cuvette fol-lowed by A0 obtained with 9 µl of 50 mM EGTA added to the same solution to give a final concentration of 1 mM EGTA. The A0 data were therefore scaled by 1.02 (1.02 = (0.45 ml + 0.009 ml) ÷ 0.45 ml),
on January 26, 2015
jgp.rupress.org
that an apparent non-reproducibility in [CaT]WM results was almost certainly caused by contamination by aluminum ions as a result of the fact that the muscles were dried on aluminum foil. Section 6 describes criteria used to reject the outlier points in this study and possible explanations for these outlier points. (Only 2 out of the almost 200 data points in this study were rejected, neither of which was in the main set of results.) Section 7 gives predicted values for [CaT]WM with CSQ KO in EDL and soleus muscles if the only effect of the KO was to remove Ca bound to CSQ. The online supplemen-tal material is available at http://www.jgp.org/cgi/content/full/ jgp.201411250/DC1.
R E S U L T S
The Materials and methods section describes how the con-centration of total Ca in a muscle sample can be deter-mined from the four absorbance measurements with the following solutions: (a) the processed muscle sample itself (AM), the same AM solution with (b) EGTA added so that essentially all of the Ca is displaced from BAPTA (A0), (c) a known amount of Ca from a Ca standard added (AS), and (d) enough Ca added so that essentially all the BAPTA is in the Ca-bound form (A). Although this determina-tion only requires informadetermina-tion at a single wavelength, it is of interest to make measurements over a range of wave-lengths to confirm that assumptions made for the deter-mination of Ca content are valid. For example, problems with the spectra could be indicative of various possibilities including a Ca/BAPTA stoichiometry other than 1:1 (in-validating Assumption 3 in Materials and methods) and/ or a substantial interaction of BAPTA with muscle compo-nents (invalidating Assumption 5), and/or Ca depen-dence of the absorbance of residual muscle components, components not removed by the centrifugation proce-dure (invalidating Assumption 4). These issues are ad-dressed in the Figs. 2–5 by assessing UV absorbance spectra measured between 250 and 340 nm.
Test of Assumption 4 that Aintr is constant and EGTA
lacks absorbance
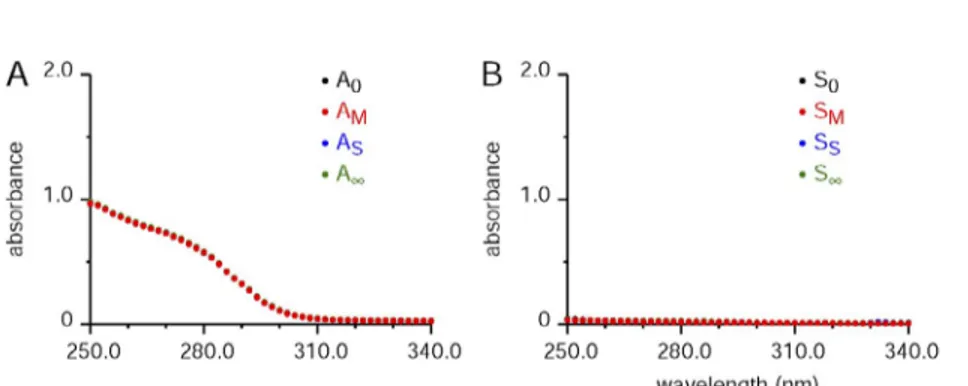
Fig. 2 A shows the four absorbance spectra (AM, A0, AS, and A) with an EDL muscle from a mouse processed
of BAPTA in the measurement solution, the volume of measure-ment solution added (a value very close to Vsolution), and the size of the cuvette. (The size of the centrifuge tubes used would depend on Vsolution.) With a 1-cm path length for the quartz cuvette, the nominal BAPTA concentration of 0.15 mM should provide rea-sonably high maximum absorbance values without being too high. If smaller tissue samples are required, one option would be to decrease the cuvette volume by using a quartz cuvette with a shorter path length, in which case the BAPTA concentration can be proportionally increased. Otherwise, the BAPTA concentra-tion can be considered as a fixed variable. The only other main variable is Vsolution. As a first estimate, Vsolution could be chosen to give 1.2 ml per 10 mg of tissue, with Vsolution adjusted for each tis-sue sample or kept constant over a range of perhaps ±30% as done above (we use Vsolution values of 1.2 ml for samples ranging from 7 to 13 mg). The aim would be for fM values to be some-where in the range of 0.1 to 0.5. The low end of the range is to provide resolution above fbackground, which was typically 0.06 or less. The high end is to keep the absorbance measurements in the lin-ear range of BAPTA absorbance versus [CaT], as seen with Fig. 1.
Statistical significance
The difference between two sets of results was considered statisti-cally significant if P was <0.05 with the Student’s two-tailed t test. For least-squares best-fit lines, the slopes were considered signifi-cantly different from zero with p-values <0.05 (determined with GraphPad software package).
Online supplemental material
Section 1 of the supplemental text gives the relationships used for assessing Ca2+, Mg2+, and proton binding to BAPTA and EGTA. Sec-tion 2 shows the absorbance spectra of BAPTA at different pH val-ues. In addition to yielding information about how protons interact with BAPTA, the results led to our choice of pH 8.0 for the mea-surement solution. Section 3 gives the relationship used for assess-ing stray light in the spectrophotometer and the relationship used to correct for this stray light component. Section 4 gives evidence of Ca leaching from some of the labware used in the study and re-sults indicating that this leaching does not affect [CaT]WM values reported in this study. Section 5 gives results for the one set of mice for which dried muscle weights were determined in addition to the usual measurements. Mouse weights were also recorded with this set of mice. Unless indicated, these results were not included in the main text. Results in Section 5a indicate that the inverse relation-ships between [CaT]WM and wet muscle weight in Fig. 6 are not caused by differences in the fractional water content. Results in Section 5b indicate that smaller muscles are associated with frac-tionally greater mouse body weights. Results in Section 5c indicate
Figure 2. Absorbance spectra with no BAPTA present: justification of the assumption of con-stant “intrinsic” absorbance, Aintr. (A) Plots of the absorbance spectra for the A0, AM, AS, and A aliquots for an 8.9-mg EDL muscle from a mouse in 1.2 ml of final solution volume (including homogenized muscle) processed in the usual way, except that BAPTA was not present in the usual measurement solution. In this and B, only one set of values is visible, as the other points are covered by the last spectrum plotted (the AM values in red for A). (B) The same format as A, with the results processed in the same way (including the ad-dition of SDS and centrifugation), except that muscle was not present. The experiment IDs for A and B were, respectively, 310131_E2no-Ball and 310131_Lno310131_E2no-Ball.
on January 26, 2015
jgp.rupress.org
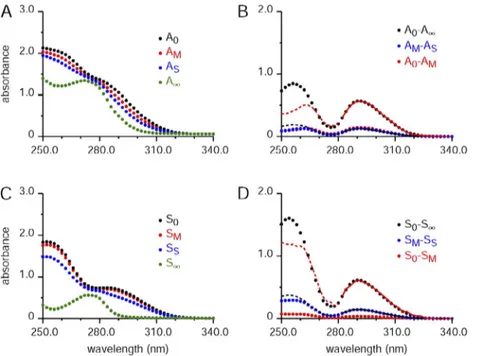
The shapes of the uncorrected difference spectra with BAPTA present do not match over the full spectral range Fig. 3 shows typical spectra with BAPTA present. A and B were obtained with an EDL mouse muscle sample, and C and D were obtained in the same way but without muscle. The spectra of AM, A0, AS, and A are shown in A. Fig. 3 B plots the following difference spectra: A0 A (black circles), AM AS (blue circles), and A0 AM (red circles). (Note that for clarity, absorbance differ-ences in equations and associated text in Materials and methods were given by the absorbance with the greater level of Ca present minus that with the lower amount of Ca, whereas the inverse was used here and elsewhere in Results to give positive values. For example, AM A0 is used in Materials and methods, whereas A0 AM is used in Results. This small inconvenience is because the Ca-free form of BAPTA has a higher absorbance than the Ca-bound form.) In Fig. 3 B, the A0 A difference spectrum between 282 and 340 nm (black circles) has been least-squares best fitted with a scaled version of the A0 AM difference spectrum; this scaled spectrum is shown as the superimposed solid red curve. The hashed curve (between 250 and 282 nm) shows the same scal-ing factor applied to the rest of the A0 AM spectrum, i.e., from the data not included in the least-squares best fit. (This convention of solid and hashed lines, respec-tively, for the fitted and nonfitted parts applies to simi-lar such fitted spectra shown in the rest of this article.) and measured in the usual way, except that no BAPTA
was present. The purpose of this experiment was to test Assumption 4 that the intrinsic absorbance (Aintr)— arising mainly from “intrinsic” muscle components still present after the centrifugation step—was un-changed in the four conditions. Only one spectrum is clearly visible because all four spectra were almost identical. The results from this and similar experi-ments with muscle from other species (frog and rat) indicate that the intrinsic absorbance does not de-pend on the presence of EGTA used for A0 or the presence of saturating Ca used for A, thereby verify-ing Assumption 4. It is noted that this result does not rule out the possibility that BAPTA interacts somehow with the remnant muscle components, a possibility that is evaluated below.
In Fig. 2, B is identical to A, except that no muscle sample was present. There was a small, nonzero absor-bance at shorter wavelengths of unknown origin, but overall the absorbance values are essentially negligible compared with those attributable to muscle in A. Be-cause the S0 spectrum was not different from the others, the results indicate that EGTA does not exhibit absor-bance over the full spectral range measured. Our un-published results suggest that the EGTA does have significant absorbance between 250 and 280 nm when pH is close to 7, which is one reason for carrying out the experiments at pH 8.
Figure 3. Absorbance spectra for a muscle sample and associated spectra without mus-cle for determining background Ca. The for-mat of panels A and C is the same as Fig. 2 (A and B, respectively), except that BAPTA was present at the usual, nominal concentration of 0.15 mM. A and B were obtained with a 9.8-mg EDL muscle from a mouse in 1.36 ml of final solution volume. The Ca standard aliquot (AS) was obtained in the usual way of adding 9 µl of a solution containing 1.5 mM CaCl2 made from a 1-M CaCl2 standard to 0.45 ml of the supernatant (or AM aliquot), giving a concentration of added standard of 0.03 mM (concentration referred to volume before adding standard). (A) As indicated, the highest to the lowest spectra for the four aliquots are in the order A0, AM, AS, and A; this is the order because the absorbance of the Ca-free form of BAPTA is higher than that of the Ca-bound form. (B) Shows differ-ences of spectra in A. As indicated in the text describing this figure, the solid red curve shows the least-squares best fit of the A0 AM difference spectra from 282 to 340 nm to the corresponding A0 A data. The best-fit scaling factor for the ratio (A0 A)/(A0 AM) was 3.895. For the corresponding fit of the A0 A data to the AM AS difference spectrum (solid black curve), the best-fit scaling factor for the ratio (AM AS)/(A0 A) was 0.2244. The hashed lines show the part of the scaled spectra from the wavelength range not used for the fit (i.e., wavelengths below 282 nm). (C and D) Obtained in the same way as A and B, except that muscle was not present. For D, the best-fit ratios (S0 S)/ (S0 SM) and (SM SS)/(S0 S) were, respectively, 17.00 and 0.2339. The experiment ID for A and B was 012214_E6, and that for C and D was 012214_LnoMg.
on January 26, 2015
jgp.rupress.org
the results in this article, with the exception of some small variation in the extrapolated fits near the peak at 254 nm. This variation is attributable to small variations in the stray-light component that plays a much larger role at the higher absorbance values near 254 nm. Whether the stray light component is mostly removed by reduc-ing the overall absorbance or by the correction proce-dure, the good matches of the difference spectra over the measured full wavelength range indicate that the BAPTA spectra are not distorted as might occur if BAPTA were significantly bound to muscle components.
An example of the determination of the concentration of total Ca in a muscle sample
This section provides a specific example of how the con-centration of total Ca in a mouse EDL muscle sample was obtained from the absorbance data with the BAPTA method, Fig. 4 (B and D) in this case. According to Eq. 13, the fraction of BAPTA complexed with Ca (f ) is given by (AM A0)/(A A0) (which equals (A0 AM)/(A0 A)), determined here by the reciprocal of the best-fit scaling factor relating the A0 AM difference spectrum to that of A0 A in Fig. 4 B. The value of f in this case was 0.263. Correspondingly, the best fit of S0 SM to S0 S in Fig. 4 D gives a value for fbackground (see Eq. 14) of
0.060. As seen in Eq. 15, the difference between f and fbackground gives fM, the fraction of BAPTA with Ca that originated from the muscle sample, which has a value of 0.203 in this case.
The next step was to determine [BT] from Eq. 6 using
the values of 1 cm for l and 4,689 M1 cm1 for at
292 nm, as given in Materials and methods. The value of 0.6008 for A0 A at this wavelength is from the point indicated by the top arrow in Fig. 4 B. The value Although the scaled A0 AM difference spectrum is
close to that of A0 A for the spectral region included in the fit, it is obviously a poor fit for much of the spec-tral region below 282 nm. A similar poor fit is seen with the corresponding difference spectra without muscle present, i.e., the fit of S0 SM to S0 S in Fig. 3 D. The difference spectra match if corrected for stray light component
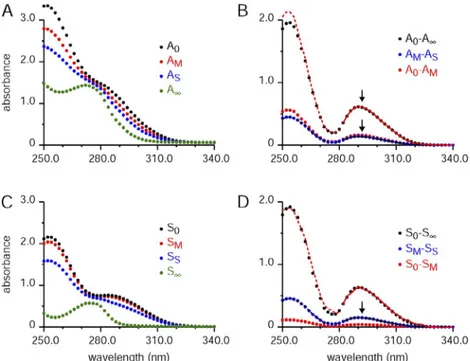
Fig. 4 shows the same absorbance spectra from Fig. 3 corrected for stray light using the procedure described in Section 3 of the supplemental text. As in Fig. 3 B, the solid red curve shows the least-squares best fit of the A0 AM spectrum to the A0 A spectrum over the wave-length range of 282 to 340 nm. In contrast to Fig. 3, the A0 AM difference spectrum matches well with that of A0 A over the nonfitted region of the spectrum (250–282 nm). The solid and dashed black curves give the corresponding fit of A0 A to the AM AS differ-ence spectrum. These black curves are difficult to see because, again, the fit is excellent for the full wavelength range. Likewise, the corresponding fits without muscle present in Fig. 4 D are excellent for the full measured wavelength range. Similar good matches were obtained in other experiments with uncorrected spectra if the ef-fects of stray light were greatly decreased by decreasing the magnitude of the absorbance signals. The lower ab-sorbance values were achieved by either diluting the muscle and BAPTA concentrations by a factor of 3 or by using quartz cuvettes with shorter path lengths (1 or 3 mm) compared with that used for all of the data given in this article (path length of 1 cm).
Similarly good fits were observed over the full wave-length range for all of the difference spectra used for
Figure 4. Absorbance spectra corrected for stray light used to determine [CaT]WM with the BAPTA method. (A–D) The absorbance spectra in this figure are from the same ex-periment shown in Fig. 3, except that they are corrected for the stray light component. Details of this correction are given in the text associated with this figure and Section 3 of the supplemental text. The format of the figure is the same as that used for Fig. 3. For B, the best-fit ratios (A0 A)/(A0 AM) and (AM AS)/(A0 A) were, respectively, 3.809 and 0.2275. For D, the best-fit ratios (S0 S)/ (S0 SM) and (SM SS)/(S0 S) were, respec-tively, 16.73 and 0.2368.
on January 26, 2015
jgp.rupress.org
close match of the magnitude of the AM AS difference spectrum to that of SM SS indicates that the presence of muscle components did not significantly change the response to the same amount of Ca added, [CaB]S, as seen by Eq. 7.
The next two sections give additional details includ-ing quantification of the degree to which the magnitudes
of A0 A match S0 S and those of AM AS match
SM SS in all of the experiments in this study by com-paring their values at 292 nm.
The presence of muscle has almost no effect on the measured value of [BT]
From Eq. 6 and the analogous equation for solution-only measurements, the ratio of the estimated concentration of total BAPTA ([BT]) with muscle present to that with-out muscle, denoted “,” is given by
γ = − − ∞ ∞ A A S S 0 0 . (18)
(Values of S0 S used with this ratio were reduced to ac-count for the reduction of BAPTA concentration caused by the addition of muscle to the measurement solu-tion, as described in “Correcting for small differences in BAPTA concentration...” in Materials and methods.) A value of 1 for would indicate that [BT] is not affected by either of the following two cases: (1) loss of BAPTA caused by binding to muscle components in the pellet after centrifugation (which would result in a decrease in [BT] and a value of < 1), or (2) a combination of BAPTA binding to muscle components in the superna-tant and changes in BAPTA’s absorbance properties (which would also likely give a value of < 1). For the 148 mouse muscle samples reported in this article, the average value of was 0.961 (SEM = 0.002). Although significantly <1 (P < 0.0001), the results indicate only a loss of 3.9% on average of the reported BAPTA concen-tration. A loss of BAPTA caused by case 1 (loss in the pellet) would not present a problem for the method of detecting Ca in a tissue sample, as it depends on the value of [BT] present in the supernatant (see Eqs. 6 and 16a). However, binding of BAPTA to muscle components in the supernatant (case 2) could present a problem. For example, the 3.9% loss could be caused by a much larger percentage of Ca-free BAPTA bound to muscle compo-nents if this binding were accompanied by a partial loss of its ability to absorb light (e.g., the 3.9% loss could be caused by the binding of 39% of BAPTA to muscle com-ponents with a 10% decrease in absorptivity).
The presence of muscle has almost no effect on the responsiveness of BAPTA to Ca
This section considers the change in BAPTA absorbance (AM AS or SM SS) upon the addition of a presumably known amount of Ca. The important question addressed
of [BT] in this case is 0.128 mM (0.6008 ÷ (4.689 mM1
cm1 × 1 cm)). The concentration of Ca bound to BAPTA,
which originated from the muscle sample, [CaB]M, is given by the product of fM and [BT] (see Eq. 16a); [CaB]M in this case is 0.0260 mM (0.203 × 0.128 mM).
The estimated concentration of total Ca in the original muscle sample ([CaT]WM; concentration referred to the whole-muscle mass) is given by Eq. 17. For this equation, the weight of the EDL muscle sample in this experiment, Wmuscle, was 0.0098 g (9.8 mg), and the final volume of the solution with the homogenized muscle, Vsolution, was 1.36 ml, giving a value for [CaT]WM of 3.61 mmoles/kg (3.61 mmoles/kg = 1.36 ml × 0.0260 mM ÷ 0.0098 g). Difference spectra match with and without muscle
Fig. 5 plots difference spectra with (symbols) and with-out (curves) muscle present; these are the same as four of the difference spectra in Fig. 4 (B and D). The very close matches of the forms of the difference spectra in-dicate that BAPTA absorbance was not altered by possi-ble binding to muscle components. With the exception of the problematic spectral region near the higher peak at 254 nm caused by stray light (see above), similar close matches were found for all of the experiments in this study. As described near the end of Materials and meth-ods, the difference spectra without muscle were scaled by 0.995 to take into account the dilution of the BAPTA concentration by the muscle sample so that all absor-bance values refer to the concentration of BAPTA in the AM solution. Because no other scaling factor was
ap-plied, the very close match of the magnitude of the A0 A
difference spectrum to that of S0 S indicates that the presence of muscle components did not signif-icantly change the estimate of the concentration of total BAPTA, [BT], using Eq. 6 above and the analogous equa-tion for soluequa-tion-only measurements. Likewise, the very
Figure 5. [BT] and the response of BAPTA to an added amount of known Ca were very similar with and without muscle present. The difference spectra plotted as symbols (A0 A and AM AS) were obtained with muscle present and are the same as those shown in Fig. 4 B. The difference spectra plotted as lines (S0 S and SM SS) were obtained without muscle present and are the same as those shown in Fig. 4 D.
on January 26, 2015
jgp.rupress.org
versus muscle weight. All of the results were with con-trol muscles from 3–6-mo-old mice. A and B show results with EDL muscle samples, and C and D show results with soleus muscle samples. All of the mice in A and C and most of the mice in B and D were C57BL/6 mice, whereas some of the mice in B and D were from hybrid mixes, as indicated in the figure legend. The results in A and C are from the largest set of control mice done with a single set of mice obtained in the same shipment and studied to-gether over a 2-d period. In each of the panels, the line is the least-squares best fit to the [CaT]WM versus muscle weight results in that panel. The slopes of all of these lines were significantly different from zero with the ex-ception of that in C, which was almost significantly differ-ent (P = 0.0539; this and the other p-values are given in the figure legend). The results in Fig. 6 indicate that [CaT]WM increases with decreasing muscle weight in both EDL and soleus muscles.
These inverse relationships suggest the existence of a physiological mechanism that up-regulates the cellular Ca load to somehow compensate for the lower muscle weights. In particular, if the lower muscle weights were required to move a heavier load (a greater weight of mouse) with respect to the size of the muscle, this could activate a signaling pathway that stimulates Ca entry into the cell, thereby increasing Ca storage in the SR to somehow increase the specific force generated by the muscle. We assessed the first part of this hypothesis, namely whether the smaller muscles were associated with a relatively greater load, using a parameter (denoted “R”) given by the ratio of the weight of the mouse from which a muscle was taken to the weight of the muscle.
As shown in Fig. S5 (E and F), R versus muscle weight
values are well described by a linear, inverse relation-ship, i.e., confirming that R does, in fact, increase with decreasing muscle weight.
To show how [CaT]WM varies with R, the horizontal scales at the tops of the panels in Fig. 6 show R values corresponding to the muscle weights shown on the ab-scissa, generated using the equations for the least-squares best-fit lines of the R versus muscle weight data in E (EDL) or F (soleus) in Fig. S5. (As indicated in Section 5b of the supplemental text, the linear relations used for the R scales are expected to apply to the results in Fig. 6, even though mouse weights, and therefore R val-ues, were not determined for most of the data in Fig. 6.) As seen in all of the panels in Fig. 6, [CaT]WM increases with increasing R values, results consistent with the idea that increasing the relative workload of a muscle in-creases Ca loading of the SR.
Knocking out CSQ reduced muscle weight and [CaT]WM
in EDL but not soleus muscle
Fig. 7 plots measurements of [CaT]WM versus muscle weight from EDL (A) and soleus (B) muscle samples with either just the skeletal-muscle form of CSQ (CSQ1) is whether the presence of muscle affects this response
and, thereby, the ability of the method to accurately de-tect the concentration of Ca in a muscle sample. The measured value of [CaB]S is given by Eq. 7, reproduced here in slightly different forms:
CaB A A l A A l S S M M S [ ] = − ⋅ = − − ⋅ ∆ε ∆ε , (19a)
or, in the absence of muscle,
CaB S S l S S l S S M M S [ ] = − ⋅ = − − ⋅ ∆ε ∆ε . (19b)
As seen in Section 4 of the supplemental text, values of [CaB]S were always greater, both with and without muscle present, than the expected amounts, a problem attrib-utable to Ca leaching from the labware used for the standard measurements. For the purposes of comparing whether muscle affects the response to Ca, the Ca-leach-ing problems can be ignored because the errors associ-ated with the Ca leaching should have been the same with and without muscle present. For this purpose, it is helpful to define a parameter, denoted “,” that gives the ratio of the measured value of [CaB]S with muscle present to that measured with no muscle present, obtained by taking the ratio of Eqs. 19a and 19b and given by the relationship
ρ = − − = − − A A S S A A S S S M S M M S M S . (20)
A value of 1 for would indicate that muscle does not affect the responsiveness of BAPTA to Ca. It is noted that the values of SM SS should not be corrected for the small difference in BAPTA concentration in the solution compared with the muscle sample, as done with Fig. 5, as the change in absorbance upon the addition of the stan-dard does not depend on [BT] (see Eq. 7). For the ex-ample in Figs. 4 and 5, the values of AM AS and SM SS were, respectively, 0.1371 and 0.1458 (from the points labeled with the bottom arrow in Fig. 4 B and the arrow in Fig. 4 D, respectively), giving a value for of 0.940.
All of the data in this Methods and Approaches article were obtained in 11 sets of 8–20 samples with muscle pres-ent and an associated single sample with solution only; all samples in each set were processed and measured on the same day. The average value of , including experi-ments with CSQ knocked out and their controls, was 0.967 (SEM = 0.004; n = 164). Although significantly <1, the difference is small (only 3.3%), indicating that possi-ble binding of BAPTA to muscle components is small or, if a significant amount of such binding does occur, it has only a minor effect on the ability of BAPTA to detect Ca. Values of [CaT]WM in mice increase with decreasing
muscle weight
All four panels in Fig. 6 plot the concentration of total Ca in whole muscles ([CaT]WM; determined with Eq. 17)
on January 26, 2015
jgp.rupress.org
assessment, the point indicated by the arrow in Fig. 7 A is not included; it is one of the two outlier points men-tioned in Section 6 of the supplemental text that were rejected with the criterion that its value is more than three standard deviations above the mean of the other points in its group. The degree to which [CaT]WM is lower than the control muscles was assessed by taking the ratio, for each point, of the measured value of [CaT]WM and the expected control value for the muscle weight of the point, given by the value of the line. The average (SEM) values for this ratio for the EDL muscle results in Fig. 7 A are 0.559 (0.047; n = 6), 0.686 (0.043; n = 5), and 0.616 (0.037; n = 11) for, respectively, the CSQ1-KO muscles, double-KO muscles, and the com-bined data from both groups. All three averages are sig-nificantly <1. The mean for the CSQ1-KO muscles is not significantly less than that for the double-KO muscles, knocked out (red circles) or with both the skeletal and
cardiac forms of CSQ (CSQ1 and CSQ2) knocked out (B, blue triangles). The associated control results mea-sured at the same time are plotted as open triangles. The control results and the lines in A and B are the same as those shown in Fig. 6 (B and D, respectively). The lines indicate the expected average value of [CaT]WM for that particular muscle weight for control muscle samples. For both EDL and soleus muscle sam-ples, there were no significant differences in the aver-age values of [CaT]WM for both the single and double CSQ KOs.
It is evident from the results for EDL muscle samples in Fig. 7 A that the CSQ-KO muscles tended to weigh less than the control muscle, and that the values of [CaT]WM for 11 of the 12 KO muscles were significantly below the line for the control muscles. In the following
Figure 6. Inverse relationship between [CaT]WM and muscle weight in muscles from mice. (A–D) The open circles in A and C plot [CaT]WM versus mus-cle weight for EDL and soleus muscles, respectively, from a set of 4–6-mo-old C57BL/6 mice. B and D plot these same results in A and C, respectively, along with several other sets of muscles. Each set of mus-cles is plotted with a different symbol, and all muscles in a set were processed together on the same day or, in one case, a 2-d period. As for the set plotted with open circles from A and C, the sets plotted with open squares and open diamonds were also obtained with 4–6-mo-old C57BL/6 mice. All of the other four sets were genetically modified to allow for selective deletion of normally expressed genes. Because the genes function normally and because the mice were crossbred on back-ground C57BL/6 or C57BL/ 6J mice, results for these other four sets would not be expected to differ from those with the C57BL/6 mice. For the two sets plotted with + and symbols, the mice (RANKfloxed/floxed) were genetically modified to allow for deletion of the gene for the receptor activator of nuclear factor B (RANK), an enzyme involved in regulating bone remodeling. These mice also underwent mock surgical experiments involving exposing the sciatic nerve without cutting it, and then closing the wound 2 wk before the measurements here. Because this would not be expected to alter [CaT]WM, it seems reasonable to include these sets. For the two sets plotted with open triangles and open-inverted triangles, the mice were modified to allow for deletion of CSQ (results given in Fig. 7). The RANKfloxed/floxed mice were 3–4 mo old, somewhat younger than the range of 4 to 6 mo for the mice in the other sets. The lines in each panel were obtained with least-squares best fits to the data. The best-fit slopes in units of millimoles/kilogram per milli-gram of muscle weight (y intercepts in millimoles/kilomilli-gram; p-values) for the lines in A–D are, respectively, 0.2866 (5.13; P = 0.0072), 0.2347 (4.92; P < 0.0001), 0.2489 (4.48; P = 0.0539), and 0.3102 (5.46; P < 0.0001). The average values (and n values) of [CaT]WM in A–D are, respectively, 2.30 (16), 2.71 (54), 2.02 (16), and 2.62 (54). For EDL muscles in A and B, the horizontal scales on top were calculated with the linear least-squares best-fit line of R versus muscle weight in Fig. S5 E given by R = 0.187 × muscle weight + 4.59. The corresponding relationship for soleus muscles in C and D is given by R = 0.239 × muscle weight + 5.14.
on January 26, 2015
jgp.rupress.org
![Figure 1. BAPTA absorbance at 292 nm versus [CaT]. See the de- de-scription of this figure in the text for details of the experimental results and how the measured absorbance values were obtained](https://thumb-eu.123doks.com/thumbv2/123dokorg/4973164.53724/3.918.97.424.544.892/figure-absorbance-scription-details-experimental-measured-absorbance-obtained.webp)

![Fig. 7 plots measurements of [CaT]WM versus muscle weight from EDL (A) and soleus (B) muscle samples with either just the skeletal-muscle form of CSQ (CSQ1) is whether the presence of muscle affects this response](https://thumb-eu.123doks.com/thumbv2/123dokorg/4973164.53724/11.918.84.402.195.307/measurements-versus-muscle-samples-skeletal-presence-affects-response.webp)
![Figure 6. Inverse relationship between [CaT]WM and muscle weight in muscles from mice](https://thumb-eu.123doks.com/thumbv2/123dokorg/4973164.53724/12.918.88.656.427.899/figure-inverse-relationship-cat-muscle-weight-muscles-mice.webp)
![Figure 7. Effect of knocking out CSQ on [CaT]WM. The solid lines in A and B for EDL and soleus muscles, respectively, are the same best-fit lines obtained for all of the control re-sults shown in Fig](https://thumb-eu.123doks.com/thumbv2/123dokorg/4973164.53724/13.918.80.520.898.1097/figure-effect-knocking-soleus-muscles-respectively-obtained-control.webp)