Journal of
Personalized
Medicine
Article
Increased Expression of VANGL1 Is Predictive of Lymph Node
Metastasis in Colorectal Cancer: Results from a 20-Gene
Expression Signature
Noshad Peyravian1, Stefania Nobili2 , Zahra Pezeshkian1 , Meysam Olfatifar1, Afshin Moradi3,
Kaveh Baghaei1, Fakhrosadat Anaraki4, Kimia Nazari1, Hamid Asadzadeh Aghdaei1 , Mohammad Reza Zali5,
Enrico Mini6,* and Ehsan Nazemalhosseini Mojarad5,*
!"#!$%&'(!
!"#$%&'
Citation: Peyravian, N.; Nobili, S.;
Pezeshkian, Z.; Olfatifar, M.; Moradi, A.; Baghaei, K.; Anaraki, F.; Nazari, K.; Aghdaei, H.A.; Zali, M.R.; et al. Increased Expression of VANGL1 Is Predictive of Lymph Node Metastasis in Colorectal Cancer: Results from a 20-Gene Expression Signature. J. Pers. Med. 2021, 11, 126. https://doi.org/ 10.3390/jpm11020126
Academic Editor: Lisa Salvatore Received: 26 December 2020 Accepted: 7 February 2021 Published: 14 February 2021
Publisher’s Note: MDPI stays neutral
with regard to jurisdictional claims in published maps and institutional affil-iations.
Copyright: © 2021 by the authors.
Licensee MDPI, Basel, Switzerland. This article is an open access article distributed under the terms and conditions of the Creative Commons Attribution (CC BY) license (https:// creativecommons.org/licenses/by/ 4.0/).
1 Basic and Molecular Epidemiology of Gastrointestinal Disorders Research Center, Research Institute for Gastroenterology and Liver Diseases, Shahid Beheshti University of Medical Sciences,
Tehran 19875-17411, Iran; [email protected] (N.P.); [email protected] (Z.P.); [email protected] (M.O.); [email protected] (K.B.); [email protected] (K.N.); [email protected] (H.A.A.)
2 Department of Neurosciences, Imaging and Clinical Sciences, “G. D’Annunzio” University of Chieti-Pescara, 66100 Chieti, Italy; [email protected]
3 Department of Pathology, Shohada Hospital, Shahid Beheshti University of Medical Sciences, Tehran 19875-17411, Iran; [email protected]
4 Colorectal Division of Department of Surgery, Taleghani Hospital, Shahid Beheshti University of Medical Sciences, Tehran 19875-17411, Iran; [email protected]
5 Gastroenterology and Liver Diseases Research Center, Research Institute for Gastroenterology and Liver Diseases, Shahid Beheshti University of Medical Sciences, Yaman Street, Chamran Expressway, Tehran 19857-17411, Iran; [email protected]
6 Department of Health Sciences, University of Florence, Viale Pieraccini 6, 50139 Firenze, Italy
* Correspondence: [email protected] (E.M.); [email protected] or [email protected] (E.N.M.)
Abstract: This study aimed at building a prognostic signature based on a candidate gene panel whose expression may be associated with lymph node metastasis (LNM), thus potentially able to predict colorectal cancer (CRC) progression and patient survival. The mRNA expression levels of 20 candidate genes were evaluated by RT-qPCR in cancer and normal mucosa formalin-fixed paraffin-embedded (FFPE) tissues of CRC patients. Receiver operating characteristic curves were used to evaluate the prognosis performance of our model by calculating the area under the curve (AUC) values corresponding to stage and metastasis. A total of 100 FFPE primary tumor tissues from stage I–IV CRC patients were collected and analyzed. Among the 20 candidate genes we studied, only the expression levels of VANGL1 significantly varied between patients with and without LNMs (p = 0.02). Additionally, the AUC value of the 20-gene panel was found to have the highest predictive performance (i.e., AUC = 79.84%) for LNMs compared with that of two subpanels including 5 and 10 genes. According to our results, VANGL1 gene expression levels are able to estimate LNMs in different stages of CRC. After a proper validation in a wider case series, the evaluation of VANGL1 gene expression and that of the 20-gene panel signature could help in the future in the prediction of CRC progression.
Keywords: colorectal cancer; gene signature; mRNA expression;VANGL1; FFPE
1. Introduction
Radical surgery and adjuvant chemotherapy improve the clinical outcome of stage III and high-risk stage II colorectal cancer (CRC) patients. However, it is known that 5-year overall survival (OS) highly varies according to important prognostic factors, such the pTs stage (stages II and III) and the involvement of lymph nodes (pN1 and pN2 stage III) [1–3]. Overall, lymph node metastasis (LNM) is a key prognostic factor for the determination of
J. Pers. Med. 2021, 11, 126 2 of 21
CRC outcomes and significantly relates to poorer prognosis, disease-free survival (DFS), and OS [4,5].
Available clinical data suggest that the accurate diagnosis of LNM is not only im-portant for the prediction of the prognosis of patients but also useful for further thera-peutic management, such as for the selection of patients who would benefit from adju-vant/neoadjuvant chemotherapy or chemo-radiotherapy [2,6,7]. In fact, the number and sites of lymph nodes involved have a direct impact on the stage of disease as established by the AJCC tumor-node-metastasis (TNM) staging classification for colon cancer [8].
However, it should be noted that pathological methods are not able to diagnose occult LNMs (micrometastases). Thus, the use of advanced methodologies (e.g., gene expression profiling (GEP)), the investigation of specific biomarkers (e.g., microsatellite instability (MSI)), CpG island methylator phenotype (CIMP), the application of the immune score recommended for increasing the detection power of disease recurrence, and in this regard the use of genes associated with lymph node involvement are very useful to enhance this evaluation [9–12]. In this regard, GEP has been used to discover biomarkers associated with lymph nodes in epithelial neoplasms, such as pancreatic cancer [13], oral squamous cell carcinoma [14], invasive breast cancer [15], and CRC [16]. However, the power of diagnosis may vary based on gene selection.
High-throughput studies in which biomarkers of tumor suppressor genes and onco-genes are potentially able to predict the prognosis of CRC patients at different stages of disease and according to the lymph node involvement are available [4,8,17].
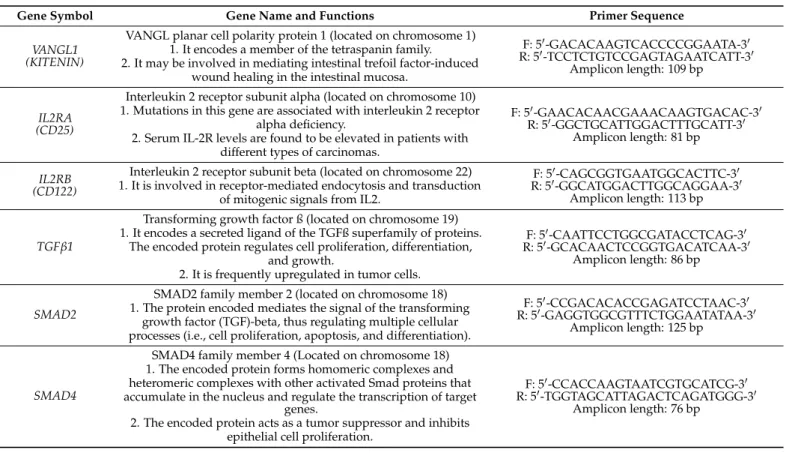
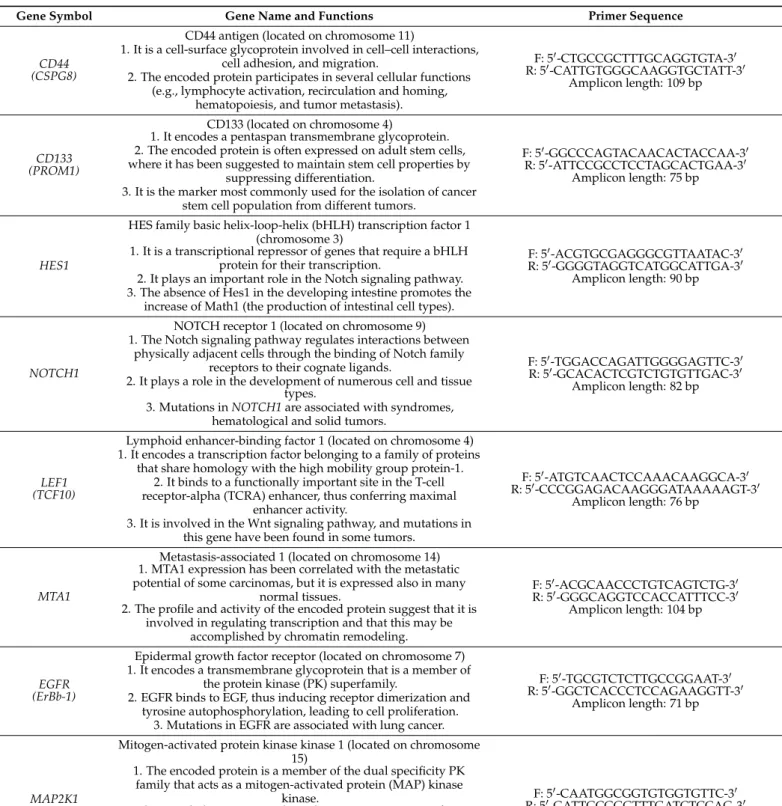
In order to find a suitable biomarker to predict LNM involvement, we evaluated gene expression profiling studies and selected 20 genes (VANGL1, SMAD2, BUB1, EGFR, HES1, MAP2K1, NOTCH1, ANXA3, SMAD4, MTA1, LEF1, RHOA, TGF-ß, CD44, CD133, IL2RA, IL2RB, PITX2, PCSK7, and FOLH1) that play a key role in carcinogenesis, tumor growth, LNM development tumor invasion, and metastasis by regulating a variety of cellular processes (Table1) [4,16–20].
Table 1. Information * on the biological functions of 20 candidate genes and on the primer sequences used for RT-qPCR
Gene Symbol Gene Name and Functions Primer Sequence
VANGL1 (KITENIN)
VANGL planar cell polarity protein 1 (located on chromosome 1) 1. It encodes a member of the tetraspanin family. 2. It may be involved in mediating intestinal trefoil factor-induced
wound healing in the intestinal mucosa.
F: 50-GACACAAGTCACCCCGGAATA-30 R: 50-TCCTCTGTCCGAGTAGAATCATT-30
Amplicon length: 109 bp
IL2RA (CD25)
Interleukin 2 receptor subunit alpha (located on chromosome 10) 1. Mutations in this gene are associated with interleukin 2 receptor
alpha deficiency.
2. Serum IL-2R levels are found to be elevated in patients with different types of carcinomas.
F: 50-GAACACAACGAAACAAGTGACAC-30 R: 50-GGCTGCATTGGACTTTGCATT-30
Amplicon length: 81 bp IL2RB
(CD122)
Interleukin 2 receptor subunit beta (located on chromosome 22) 1. It is involved in receptor-mediated endocytosis and transduction
of mitogenic signals from IL2.
F: 50-CAGCGGTGAATGGCACTTC-30 R: 50-GGCATGGACTTGGCAGGAA-30
Amplicon length: 113 bp TGFb1
Transforming growth factor ß (located on chromosome 19) 1. It encodes a secreted ligand of the TGFß superfamily of proteins.
The encoded protein regulates cell proliferation, differentiation, and growth.
2. It is frequently upregulated in tumor cells.
F: 50-CAATTCCTGGCGATACCTCAG-30 R: 50-GCACAACTCCGGTGACATCAA-30
Amplicon length: 86 bp
SMAD2
SMAD2 family member 2 (located on chromosome 18) 1. The protein encoded mediates the signal of the transforming
growth factor (TGF)-beta, thus regulating multiple cellular processes (i.e., cell proliferation, apoptosis, and differentiation).
F: 50-CCGACACACCGAGATCCTAAC-30 R: 50-GAGGTGGCGTTTCTGGAATATAA-30
Amplicon length: 125 bp
SMAD4
SMAD4 family member 4 (Located on chromosome 18) 1. The encoded protein forms homomeric complexes and heteromeric complexes with other activated Smad proteins that accumulate in the nucleus and regulate the transcription of target
genes.
2. The encoded protein acts as a tumor suppressor and inhibits epithelial cell proliferation.
F: 50-CCACCAAGTAATCGTGCATCG-30 R: 50-TGGTAGCATTAGACTCAGATGGG-30
J. Pers. Med. 2021, 11, 126 3 of 21
Table 1.Cont.
Gene Symbol Gene Name and Functions Primer Sequence
CD44 (CSPG8)
CD44 antigen (located on chromosome 11)
1. It is a cell-surface glycoprotein involved in cell–cell interactions, cell adhesion, and migration.
2. The encoded protein participates in several cellular functions (e.g., lymphocyte activation, recirculation and homing,
hematopoiesis, and tumor metastasis).
F: 50-CTGCCGCTTTGCAGGTGTA-30 R: 50-CATTGTGGGCAAGGTGCTATT-30 Amplicon length: 109 bp CD133 (PROM1) CD133 (located on chromosome 4)
1. It encodes a pentaspan transmembrane glycoprotein. 2. The encoded protein is often expressed on adult stem cells, where it has been suggested to maintain stem cell properties by
suppressing differentiation.
3. It is the marker most commonly used for the isolation of cancer stem cell population from different tumors.
F: 50-GGCCCAGTACAACACTACCAA-30 R: 50-ATTCCGCCTCCTAGCACTGAA-30
Amplicon length: 75 bp
HES1
HES family basic helix-loop-helix (bHLH) transcription factor 1 (chromosome 3)
1. It is a transcriptional repressor of genes that require a bHLH protein for their transcription.
2. It plays an important role in the Notch signaling pathway. 3. The absence of Hes1 in the developing intestine promotes the
increase of Math1 (the production of intestinal cell types).
F: 50-ACGTGCGAGGGCGTTAATAC-30 R: 50-GGGGTAGGTCATGGCATTGA-30
Amplicon length: 90 bp
NOTCH1
NOTCH receptor 1 (located on chromosome 9) 1. The Notch signaling pathway regulates interactions between
physically adjacent cells through the binding of Notch family receptors to their cognate ligands.
2. It plays a role in the development of numerous cell and tissue types.
3. Mutations in NOTCH1 are associated with syndromes, hematological and solid tumors.
F: 50-TGGACCAGATTGGGGAGTTC-30 R: 50-GCACACTCGTCTGTGTTGAC-30
Amplicon length: 82 bp
LEF1 (TCF10)
Lymphoid enhancer-binding factor 1 (located on chromosome 4) 1. It encodes a transcription factor belonging to a family of proteins
that share homology with the high mobility group protein-1. 2. It binds to a functionally important site in the T-cell receptor-alpha (TCRA) enhancer, thus conferring maximal
enhancer activity.
3. It is involved in the Wnt signaling pathway, and mutations in this gene have been found in some tumors.
F: 50-ATGTCAACTCCAAACAAGGCA-30 R: 50-CCCGGAGACAAGGGATAAAAAGT-30
Amplicon length: 76 bp
MTA1
Metastasis-associated 1 (located on chromosome 14) 1. MTA1 expression has been correlated with the metastatic potential of some carcinomas, but it is expressed also in many
normal tissues.
2. The profile and activity of the encoded protein suggest that it is involved in regulating transcription and that this may be
accomplished by chromatin remodeling.
F: 50-ACGCAACCCTGTCAGTCTG-30 R: 50-GGGCAGGTCCACCATTTCC-30
Amplicon length: 104 bp
EGFR (ErBb-1)
Epidermal growth factor receptor (located on chromosome 7) 1. It encodes a transmembrane glycoprotein that is a member of
the protein kinase (PK) superfamily.
2. EGFR binds to EGF, thus inducing receptor dimerization and tyrosine autophosphorylation, leading to cell proliferation.
3. Mutations in EGFR are associated with lung cancer.
F: 50-TGCGTCTCTTGCCGGAAT-30 R: 50-GGCTCACCCTCCAGAAGGTT-30
Amplicon length: 71 bp
MAP2K1 (MEK1)
Mitogen-activated protein kinase kinase 1 (located on chromosome 15)
1. The encoded protein is a member of the dual specificity PK family that acts as a mitogen-activated protein (MAP) kinase
kinase.
2. The encoded protein stimulates the enzymatic activity of MAP kinases upon a wide variety of extra- and intracellular signals. 3. As a component of the MAP kinase signal transduction pathway,
the encoded protein is involved in many cellular processes (e.g., proliferation, differentiation, and transcription regulation).
F: 50-CAATGGCGGTGTGGTGTTC-30 R: 50-GATTGCGGGTTTGATCTCCAG-30
Amplicon length: 91 bp
FOLH1 (PSMA)
Folate hydrolase 1 (located on chromosome 11) 1. It encodes a type II transmembrane glycoprotein belonging to
the M28 peptidase family.
2. Also known as prostate-specific membrane antigen (PSMA), it is expressed in many tissues, including the prostate. 3. In the prostate, the FOLH1/PSMA protein is upregulated in cancer cells and is used as an effective diagnostic and prognostic
indicator of prostate cancer.
F: 50-AGAGGGCGATCTAGTGTATGTT-30 R: 50-TGATTTTCATGTCCCGTTCCAAT-30
J. Pers. Med. 2021, 11, 126 4 of 21
Table 1.Cont.
Gene Symbol Gene Name and Functions Primer Sequence
BUB1
BUB1 mitotic checkpoint serine/threonine kinase (located on chromosome 2)
1. It encodes a protein that plays a central role in mitosis. 2. This protein may also function in the DNA damage response. 3. Mutations in this gene have been associated with aneuploidy
and several forms of cancer.
F: 50-AGCCCAGACAGTAACAGACTC-30 R: 50-GTTGGCAACCTTATGTGTTTCAC-30
Amplicon length: 136 bp
RHOA
Ras homolog family member A (located on chromosome 3) 1. It encodes a member of the Rho family of small GTPases that
function as molecular switches in signal transduction cascades. 2. Overexpression of this gene is associated with tumor cell
proliferation and metastasis.
F: 50-GGAAAGCAGGTAGAGTTGGCT-30 R: 50-GGCTGTCGATGGAAAAACACAT-30
Amplicon length: 118 bp
PCSK7
Proprotein convertase subtilisin/kexin type 7 (located on chromosome 11)
1. It encodes a type 1 membrane-bound protease that is expressed in many tissues, including the neuroendocrine, liver, gut, and
brain.
2. It has been implicated in the transcriptional regulation of housekeeping genes.
3. A chromosomal translocation associated with B-cell lymphoma occurs between this gene and its inverted counterpart.
F: 50-GCAGCGTCCACTTCAACGA-30 R: 50-GCCCAGTCACATTGCGTTC-30
Amplicon length: 117 bp
PITX2 (ARP1)
Paired-like homeodomain 2 (located on chromosome 4) 1. It encodes a member of the RIEG/PITX homeobox family, which
is in the bicoid class of homeodomain proteins. 3. The encoded protein acts as a transcription factor and regulates
procollagen lysyl hydroxylase gene expression.
F: 50-GCCAAGGGCCTTACATCCG-30 R: 50-GGTGGGGAAAACATGCTCTG-30
Amplicon length: 101 bp
ANXA3 (annexin) A3
Annexin A3 (located on chromosome 4) 1. It encodes a member of the annexin family. 1. Members of this calcium-dependent phospholipid-binding protein family play a role in the regulation of cellular growth and
in signal transduction pathways.
2. The encoded protein functions in the inhibition of phospholipase A2 and cleavage of inositol 1,2-cyclic phosphate to
form inositol 1-phosphate.
F: 50-TTAGCCCATCAGTGGATGCTG-30 R: 50-CTGTGCATTTGACCTCTCAGT-30
Amplicon length: 104 bp
B2M 2-microglobulin (located on chromosome 15) – Housekeepinggene F: 5
0-TGCTGTCTCCATGTTTGATGTATCT-30 R: 50-TCTCTGCTCCCCACCTCTAAGT-30
Amplicon length: 86 bp ACTB -actin (located on chromosome 7) – Housekeeping gene F: 5
0- GCCGGGACCTGACTGACTAC-30 R: 50- TTCTCCTTAATGTCACGCACGAT-30
Amplicon length: 100 bp * Information available athttps://www.ncbi.nlm.nih.gov/(accessed on 10 February 2021).
Thus, the aim of this study was to identify at the mRNA level and to validate at the protein level the potential prognostic role of these candidate genes in relation to the LNM of CRC patients.
2. Materials and Methods
2.1. Patients and Sample Collection
This retrospective study was performed in 100 formalin-fixed paraffin-embedded (FFPE) tumor tissues of CRC patients at stage I or II (n = 52) and at stage III or IV (n = 48) and 10 FFPE samples of normal tissues (colonic mucosa) as calibrators in RT-qPCR, as well as paired samples of normal colonic tissues from the same CRC patients. All samples were anonymized. Patients underwent surgical resection for CRC from February 1998 to December 2018 at Taleghani Hospital, Shahid Beheshti University of Medical Sciences, Tehran, Iran. They were chemo- and radiotherapy naïve, and none of them experienced previous neoplastic disease. Clinical information, such as colonoscopy/pathology report, follow-up data, and cause of death, was collected from medical records. All patients were carefully followed up to confirm their clinical outcomes.
This study was approved by the ethical committee (IR.SBMU.RIGLD.REC.1396.947) of the Research Institute for Gastroenterology and Liver Disease, Shahid Beheshti University of Medical Sciences, Tehran, Iran. Written informed consent was obtained from all patients.
J. Pers. Med. 2021, 11, 126 5 of 21
The inclusion criteria for the patients were the following: (1) signed informed consent; (2) availability of the pathology report to confirm the tumor histology; (3) nonresident in an institution, such as a prison, nursing home, or shelter; (4) no severe illness in the intensive care unit; and (5) no preoperative chemotherapy and radiotherapy. The exclusion criteria were the following: patients affected by familial adenomatous polyposis (FAP), hereditary nonpolyposis CRC (HNPCC), cancer at any site at the time of selection, and patients who received neoadjuvant chemotherapy or radiotherapy. The FFPE tissue blocks were cut 10–15 µm and 4–7 µm in thickness for mRNA extraction and immunohistochemistry (IHC), respectively.
To ensure the quality of the presence of tumor and normal cells in FFPE tissue blocks, before performing the laboratory process, each section was evaluated for tumor and normal cells (>80% representative) by the pathologist using hematoxylin and eosin (H&E) staining. 2.2. RNA Isolation
Ten–fifteen micrometer thick sections were cut from the FFPE blocks, and each section was transferred into a microcentrifuge tube. Deparaffinization was performed with 1 mL xylene, incubating twice for 10 min, and 1 mL absolute ethanol, also incubating twice for 10 min.
2.3. Quantitative and Qualitative Analysis of the Isolated RNA Samples
Total RNA was extracted from the target tissues using the Rneasy Kit (Qiagen, Chatsworth, CA) according to the company’s protocol. To avoid genomic DNA con-tamination, RNA samples were treated with Dnase I according to the manufacturer’s protocol (Invitrogen, Carlsbad, CA, USA). RNA concentration was measured by a Nan-oDrop ND-1000 spectrophotometer (NanNan-oDrop Technologies Inc., Rockland, DE, USA). An A260/A280 ratio was used to evaluate the RNA purity, and values in the range of 1.8–2.0 were accepted.
2.4. Real-Time PCR Analysis
cDNAs were generated with a PrimeScript RT Reagent kit (Takara, Shiga, Japan) according to the manufacturer’s protocol.
The mRNA levels of 20 candidate genes (i.e., VANGL1, IL2RA, IL2RB, TGF-ß, SMAD2, SMAD4, CD44, CD133, HES1, NOTCH1, LEF1, MTA1, EGFR, MAP2K1, FOLH1, BUB1, RHOA1, PCSK7, PITX2, and ANXA3) (Table1) and of the housekeeping gene 2-microglobulin (B2M) were analyzed by RT-qPCR using the SYBR Fast qPCR Mix Kit (Takara). The cDNA samples were amplified by the 7500 Real-Time PCR System (Applied Biosystems, Foster City, CA, USA) with an initial denaturation at 95 C for 30 s, followed by 40 cycles each at 95 C for 5 s and 60 C for 34 s. Relative expression abundances of the target genes were determined by normalizing to B2M and b-actin using the 2 DDCtmethod. Each measurement was performed in triplicate. B2M was utilized to calculate the relative quantitation (RQ) of mRNA transcripts using the 2 DDCtmethod.
2.5. Unsupervised Hierarchical Clustering
An unsupervised hierarchical clustering was used to graphically display the expres-sion levels of 20 candidate genes in CRC samples. Dendrograms and clustering were generated by using the Gene Cluster version 3.0 software and visualized with the Java TreeView version 3.0, available athttp://rana.lbl.gov/EisenSoftware.htm(accessed on 1 February 2021) andhttp://jtreeview.sourceforge.net(accessed on 1 February 2021), re-spectively. The color of each square box represents the ratio of gene expression. Green boxes indicate upregulated genes, while red boxes represent downregulated genes. 2.6. Immunohistochemistry and Evaluation of Staining
To investigate the expression levels of candidate proteins, an IHC analysis was per-formed on slices of FFPE tissues ranging from 4 to 7 µm in thickness. For deparaffinization,
J. Pers. Med. 2021, 11, 126 6 of 21
the slides were incubated at 37 C for 24 h and then washed with xylene (100%), ethanol (100%, 85%, and 75%), and distilled water, respectively. After deparaffinization, slides were incubated in a solution of 10% H2O2and methanol at a ratio of 1:9 for 15 min and subsequently washed with the distilled water. Next, the slides were treated in the 10 mM citrate buffer solution (pH = 6) and microwaved with 800 W for 24 min and washed with the Tris-buffered saline (TBS). After treating with the blocking serum for 15 min, the slides were immunostained with mouse anti-human MoAbs for 45 min and later washed with TBS. Later, by treating with the EnVision + visualization system (Dako) for 30 min, followed by DAB (Master Diagnosis, LOT. No 090517C1-01) as the chromogen substrate for 10 min, the bound primary antibody was visualized. Finally, the slides were washed with distilled water, dehydrated with ethanol, and stained in hematoxylin. All the slides were indepen-dently checked by investigators who had no knowledge of the patients’ characteristics and clinical outcome using a microscope (Nikon, Tokyo, Japan).
The analysis of immunostaining intensity was performed using a qualitative scale and ocular observation. Sections were first scanned at low-power magnification (10x) and were quantitatively assessed as follows: under a light microscope at 400x magnifications, five high-power fields (HPFs) were randomly selected, and the immunostaining intensity was determined.
Mean values were estimated through the scanning of the entire tissue sections of all samples using two graded scales: negative, <10%, and positive, >10%. The positive controls were the following: (a) a normal colonic tissue was taken as an internal control for ß-catenin IHC, and (b) a histologically diagnosed section of colon carcinoma tissues for nuclear positivity by ß-catenin IHC. Negative control was achieved by omitting the primary antibody. The MoAbs used in this study were VANGL1 (Abcam, Anti-VANGL1 antibody ab69227), SMAD4 (Abcam, Phospho-SMAD4 antibody T277), EGFR (Master Diagnosis, Anti-EGFR antibody Lot No. 0664000), and LEF1 (Master Diagnosis, Anti-EGFR antibody Lot No. 07430003).
2.7. Statistical Analysis
Tumors were divided into lymph node metastases (LNMs) and non-lymph node metastases (non-LNMs) based on the histopathological results. The mRNA expression levels of tumor tissues were represented as the mean±standard deviation (SD). The Mann– Whitney U and Kruskal–Wallis tests were used to assess the differences of the mRNA expressions of 20 genes between the established groups (i.e., presence/absence of LNMs; stage (I–II vs. III–IV), tumor differentiation grade (well vs. poor differentiated), sex (male vs. female), and age (<50 vs. 50)). All statistical analyses were performed by the IBM SPSS Statistics software version 22 (IBM, SPSS, Chicago, IL, USA) and Stata analyzer.
For receiver operating characteristic (ROC) curve analysis, the R 3.6.1 software was used to evaluate the sensitivity and specificity of the prognosis prediction (evaluated by OS) according to the mRNA gene expression by analyzing the area under the curve (AUC). Stratification of patients in high and low tumor gene expression was established according to the cutoff obtained for each gene by ROC analysis. OS analysis was per-formed by plotting Kaplan–Meier (log-rank test) curves. p-Values < 0.05 were considered statistically significant.
3. Results
3.1. Clinical and Pathological Characteristics of Patients
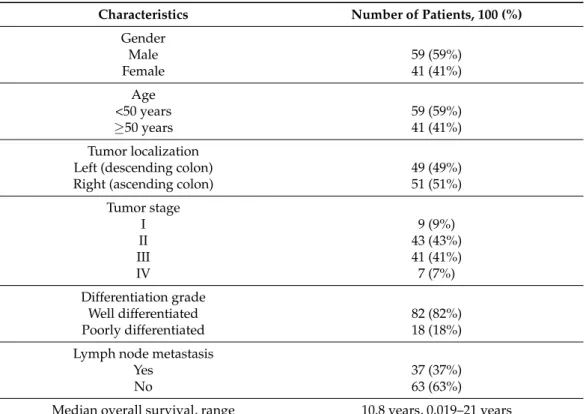
The population study consisted of 100 FFPE tissues from CRC patients (59 men and 41 women with an average age of 52.17 years, 20–78 range). The clinical features of the study population are shown in Table2. Information on age, sex, stage, tumor differentiation, and tumor location is available for all patients. Among patients, 52% had stage I or II CRC, while 48% of the cases had stage III or IV. Of 100 patients, 37 were positive and 63 were negative for LNM.
J. Pers. Med. 2021, 11, 126 7 of 21
Table 2. Clinical and pathological characteristics of patients.
Characteristics Number of Patients, 100 (%) Gender Male 59 (59%) Female 41 (41%) Age <50 years 59 (59%) 50 years 41 (41%) Tumor localization
Left (descending colon) 49 (49%)
Right (ascending colon) 51 (51%)
Tumor stage I 9 (9%) II 43 (43%) III 41 (41%) IV 7 (7%) Differentiation grade Well differentiated 82 (82%) Poorly differentiated 18 (18%)
Lymph node metastasis
Yes 37 (37%)
No 63 (63%)
Median overall survival, range 10.8 years, 0.019–21 years
3.2. Gene Expression Analysis
To identify molecular determinants of LNMs, gene expression profiles from patients with or without LNMs and at different stages of disease were compared. Based on literature data, we selected 20 genes that relate to the lymphatic metastatic process and evaluated their expression levels in 100 FFPE blocks.
Relationships of tumor gene expression with demographic (sex, age), clinical (tumor location), and pathological (stage, LNM, grade) features are reported in Tables3and4. Table 3. Relationships between the expression of 20 CRC study genes and age and sex.
Gene Symbol Fold Change of Age Fold Change of Sex
<50 50 p-Value Male Female p-Value
VANGL1 4.910±7.56 7.155±10.54 0.44 5.706±9.02 6.972±10.08 0.36 IL2RA 0.603±0.640 1.509±1.83 0.02 1.148±1.61 1.098±1.37 0.93 IL2RB 0.699±1.10 0.635±1.24 0.88 0.870±1.37 0.351±0.71 0.02 TGFb 1.056±1.61 1.285±2.02 0.79 1.308±2.14 1.010±1.34 0.90 SMAD2 1.313±2.20 0.855±1.45 0.74 0.942±1.64 1.205±2.06 0.30 SMAD4 2.157±2.36 2.425±2.21 0.41 2.417±2.20 2.157±2.37 0.34 CD44 0.596±0.814 0.537±0.87 0.44 0.478±0.85 0.687±0.82 0.10 CD133 0.832±1.77 1.329±2.83 0.62 0.870±2.43 1.495±2.44 0.07 HES1 2.830±3.52 2.134±3.28 0.36 2.685±3.39 0.955±3.38 0.44 NOTCH1 1.088±2.18 0.953±2.22 0.58 0.795±2.36 1.332±1.89 0.02 LEF1 1.178±1.80 1.038±1.19 0.58 0.988±1.14 1.260±1.86 0.86 MTA1 1.045±1.01 1.012±0.98 0.85 0.947±0.93 1.144±1.06 0.37
J. Pers. Med. 2021, 11, 126 8 of 21
Table 3.Cont.
Gene Symbol Fold Change of Age Fold Change of Sex
<50 50 p-Value Male Female p-Value
EGFR 2.272±2.60 2.937±4.65 0.75 2.439±3.43 2.986±4.58 0.87 MAP2K1 1.722±2.47 1.235±2.23 0.02 1.495±2.65 1.355±1.78 0.49 FOLH1 0.797±0.70 0.814±0.91 0.65 0.809±0.85 0.804±0.81 0.78 BUB1 0.656±1.65 0.610±1.46 0.18 0.731±1.53 0.476±1.56 0.27 RHOA 0.510±0.621 0.562±1.19 0.11 0.625±1.11 0.414±0.75 0.50 PCSK7 6.590±7.74 3.069±4.48 0.19 4.196±5.12 5.076±6.02 0.42 PITX2 0.976±2.00 0.663±1.13 0.57 0.720±1.13 0.906±2.05 0.58 ANXA3 3.533±4.70 4.399±6.65 0.60 4.298±6.06 3.641±5.71 0.12
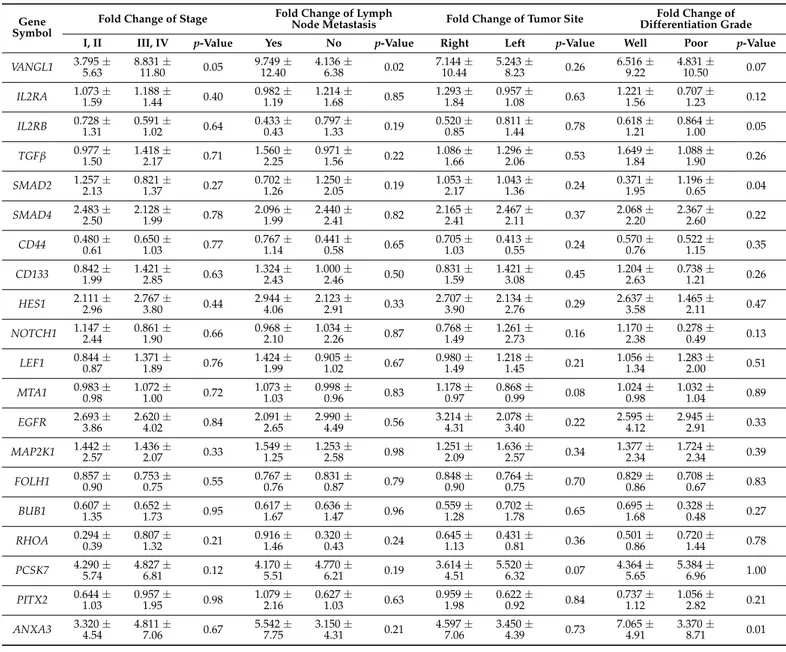
Table 4. Relationships between the expression of 20 CRC study genes and clinical and pathological characteristics of patients.
Gene
Symbol Fold Change of Stage
Fold Change of Lymph
Node Metastasis Fold Change of Tumor Site Differentiation GradeFold Change of
I, II III, IV p-Value Yes No p-Value Right Left p-Value Well Poor p-Value
VANGL1 3.795 ±5.63 8.831 ±11.80 0.05 9.749 ±12.40 4.136 ±6.38 0.02 7.144 ±10.44 5.243 ±8.23 0.26 6.516 ±9.22 4.831 ±10.50 0.07 IL2RA 1.073 ±1.59 1.188 ±1.44 0.40 0.982 ±1.19 1.214 ±1.68 0.85 1.293 ±1.84 0.957 ±1.08 0.63 1.221 ±1.56 0.707 ±1.23 0.12 IL2RB 0.728 ±1.31 0.591 ±1.02 0.64 0.433 ±0.43 0.797 ±1.33 0.19 0.520 ±0.85 0.811 ±1.44 0.78 0.618 ±1.21 0.864 ±1.00 0.05 TGFb 0.977 ±1.50 1.418 ±2.17 0.71 1.560 ±2.25 0.971 ±1.56 0.22 1.086 ±1.66 1.296 ±2.06 0.53 1.649 ±1.84 1.088 ±1.90 0.26 SMAD2 1.257 ±2.13 0.821 ±1.37 0.27 0.702 ±1.26 1.250 ±2.05 0.19 1.053 ±2.17 1.043 ±1.36 0.24 0.371 ±1.95 1.196 ±0.65 0.04 SMAD4 2.483 ±2.50 2.128 ±1.99 0.78 2.096 ±1.99 2.440 ±2.41 0.82 2.165 ±2.41 2.467 ±2.11 0.37 2.068 ±2.20 2.367 ±2.60 0.22 CD44 0.480 ±0.61 0.650 ±1.03 0.77 0.767 ±1.14 0.441 ±0.58 0.65 0.705 ±1.03 0.413 ±0.55 0.24 0.570 ±0.76 0.522 ±1.15 0.35 CD133 0.842 ±1.99 1.421 ±2.85 0.63 1.324 ±2.43 1.000 ±2.46 0.50 0.831 ±1.59 1.421 ±3.08 0.45 1.204 ±2.63 0.738 ±1.21 0.26 HES1 2.111 ±2.96 2.767 ±3.80 0.44 2.944 ±4.06 2.123 ±2.91 0.33 2.707 ±3.90 2.134 ±2.76 0.29 2.637 ±3.58 1.465 ±2.11 0.47 NOTCH1 1.147 ±2.44 0.861 ±1.90 0.66 0.968 ±2.10 1.034 ±2.26 0.87 0.768 ±1.49 1.261 ±2.73 0.16 1.170 ±2.38 0.278 ±0.49 0.13 LEF1 0.844 ±0.87 1.371 ±1.89 0.76 1.424 ±1.99 0.905 ±1.02 0.67 0.980 ±1.49 1.218 ±1.45 0.21 1.056 ±1.34 1.283 ±2.00 0.51 MTA1 0.983 ±0.98 1.072 ±1.00 0.72 1.073 ±1.03 0.998 ±0.96 0.83 1.178 ±0.97 0.868 ±0.99 0.08 1.024 ±0.98 1.032 ±1.04 0.89 EGFR 2.693 ±3.86 2.620 ±4.02 0.84 2.091 ±2.65 2.990 ±4.49 0.56 3.214 ±4.31 2.078 ±3.40 0.22 2.595 ±4.12 2.945 ±2.91 0.33 MAP2K1 1.442 ±2.57 1.436 ±2.07 0.33 1.549 ±1.25 1.253 ±2.58 0.98 1.251 ±2.09 1.636 ±2.57 0.34 1.377 ±2.34 1.724 ±2.34 0.39 FOLH1 0.857 ±0.90 0.753 ±0.75 0.55 0.767 ±0.76 0.831 ±0.87 0.79 0.848 ±0.90 0.764 ±0.75 0.70 0.829 ±0.86 0.708 ±0.67 0.83 BUB1 0.607 ±1.35 0.652 ±1.73 0.95 0.617 ±1.67 0.636 ±1.47 0.96 0.559 ±1.28 0.702 ±1.78 0.65 0.695 ±1.68 0.328 ±0.48 0.27 RHOA 0.294 ±0.39 0.807 ±1.32 0.21 0.916 ±1.46 0.320 ±0.43 0.24 0.645 ±1.13 0.431 ±0.81 0.36 0.501 ±0.86 0.720 ±1.44 0.78 PCSK7 4.290 ±5.74 4.827 ±6.81 0.12 4.170 ±5.51 4.770 ±6.21 0.19 3.614 ±4.51 5.520 ±6.32 0.07 4.364 ±5.65 5.384 ±6.96 1.00 PITX2 0.644 ±1.03 0.957 ±1.95 0.98 1.079 ±2.16 0.627 ±1.03 0.63 0.959 ±1.98 0.622 ±0.92 0.84 0.737 ±1.12 1.056 ±2.82 0.21 ANXA3 3.320 ±4.54 4.811 ±7.06 0.67 5.542 ±7.75 3.150 ±4.31 0.21 4.597 ±7.06 3.450 ±4.39 0.73 7.065 ±4.91 3.370 ±8.71 0.01
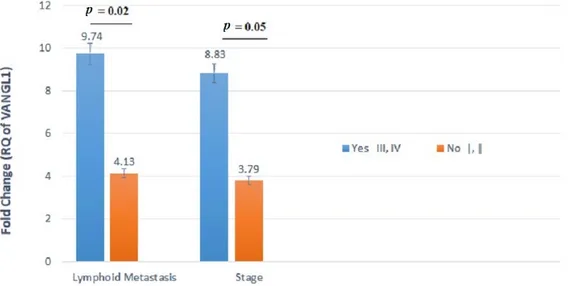
In particular, the gene expression levels of VANGL1 varied significantly between patients with and without LNMs. The tumors of patients with LNMs displayed twofold
J. Pers. Med. 2021, 11, 126 9 of 21
higher levels of VANGL1 mRNA expression compared with those of patients without LNMs (p = 0.02) (Table4and Figure1). Additionally, the expression levels of this gene varied between patients with stages I-II and III-IV, showing the highest mean level (i.e., 8.831) for stages III and IV. This difference reached a good level of significance, although not fully significant (p = 0.05) (Table4and Figure1).
J. Pers. Med. 2021, 11, x FOR PEER REVIEW 9 of 22
SMAD4 2.483 ± 2.50 2.128 ± 1.99 0.78 2.096 ± 1.99 2.440 ± 2.41 0.82 2.165 ± 2.41 2.467 ± 2.11 0.37 2.068 ± 2.20 2.367 ± 2.60 0.22 CD44 0.480 ± 0.61 0.650 ± 1.03 0.77 0.767 ± 1.14 0.441 ± 0.58 0.65 0.705 ± 1.03 0.413 ± 0.55 0.24 0.570 ± 0.76 0.522 ± 1.15 0.35 CD133 0.842 ± 1.99 1.421 ± 2.85 0.63 1.324 ± 2.43 1.000 ± 2.46 0.50 0.831 ± 1.59 1.421 ± 3.08 0.45 1.204 ± 2.63 0.738 ± 1.21 0.26 HES1 2.111 ± 2.96 2.767 ± 3.80 0.44 2.944 ± 4.06 2.123 ± 2.91 0.33 2.707 ± 3.90 2.134 ± 2.76 0.29 2.637 ± 3.58 1.465 ± 2.11 0.47 NOTCH1 1.147 ± 2.44 0.861 ± 1.90 0.66 0.968 ± 2.10 1.034 ± 2.26 0.87 0.768 ± 1.49 1.261 ± 2.73 0.16 1.170 ± 2.38 0.278 ± 0.49 0.13 LEF1 0.844 ± 0.87 1.371 ± 1.89 0.76 1.424 ± 1.99 0.905 ± 1.02 0.67 0.980 ± 1.49 1.218 ± 1.45 0.21 1.056 ± 1.34 1.283 ± 2.00 0.51 MTA1 0.983 ± 0.98 1.072 ± 1.00 0.72 1.073 ± 1.03 0.998 ± 0.96 0.83 1.178 ± 0.97 0.868 ± 0.99 0.08 1.024 ± 0.98 1.032 ± 1.04 0.89 EGFR 2.693 ± 3.86 2.620 ± 4.02 0.84 2.091 ± 2.65 2.990 ± 4.49 0.56 3.214 ± 4.31 2.078 ± 3.40 0.22 2.595 ± 4.12 2.945 ± 2.91 0.33 MAP2K1 1.442 ± 2.57 1.436 ± 2.07 0.33 1.549 ± 1.25 1.253 ± 2.58 0.98 1.251 ± 2.09 1.636 ± 2.57 0.34 1.377 ± 2.34 1.724 ± 2.34 0.39 FOLH1 0.857 ± 0.90 0.753 ± 0.75 0.55 0.767 ± 0.76 0.831 ± 0.87 0.79 0.848 ± 0.90 0.764 ± 0.75 0.70 0.829 ± 0.86 0.708 ± 0.67 0.83 BUB1 0.607 ± 1.35 0.652 ± 1.73 0.95 0.617 ± 1.67 0.636 ± 1.47 0.96 0.559 ± 1.28 0.702 ± 1.78 0.65 0.695 ± 1.68 0.328 ± 0.48 0.27 RHOA 0.294 ± 0.39 0.807 ± 1.32 0.21 0.916 ± 1.46 0.320 ± 0.43 0.24 0.645 ± 1.13 0.431 ± 0.81 0.36 0.501 ± 0.86 0.720 ± 1.44 0.78 PCSK7 4.290 ± 5.74 4.827 ± 6.81 0.12 4.170 ± 5.51 4.770 ± 6.21 0.19 3.614 ± 4.51 5.520 ± 6.32 0.07 4.364 ± 5.65 5.384 ± 6.96 1.00 PITX2 0.644 ± 1.03 0.957 ± 1.95 0.98 1.079 ± 2.16 0.627 ± 1.03 0.63 0.959 ± 1.98 0.622 ± 0.92 0.84 0.737 ± 1.12 1.056 ± 2.82 0.21 ANXA3 3.320 ± 4.54 4.811 ± 7.06 0.67 5.542 ± 7.75 3.150 ± 4.31 0.21 4.597 ± 7.06 3.450 ± 4.39 0.73 7.065 ± 4.91 3.370 ± 8.71 0.01
Figure 1. VANGL1 mRNA relative quantification (RQ) established by RT-qPCR analysis according
to lymph node metastasis (LNMs) involvement or stage. Gene expression levels of VANGL1 differed
significantly between patients with and without LNMs.
Figure 1.VANGL1 mRNA relative quantification (RQ) established by RT-qPCR analysis according to lymph node metastasis (LNMs) involvement or stage. Gene expression levels of VANGL1 differed significantly between patients with and without LNMs.
The mRNA expression levels of three genes (i.e., IL2RB, SMAD, and ANXA3) were significantly (p < 0.05) different between well-differentiated (i.e., G1 and G2) and poorly differentiated (i.e., G3 and G4) tumors (Table4and Figure2).
J. Pers. Med. 2021, 11, x FOR PEER REVIEW 10 of 22
Figure 2. ANXA3 and SMAD2 mRNA relative quantification (RQ) established by RT-qPCR analysis
according to histological grade. Gene expression levels of these genes differed significantly between
well- and poorly differentiated cancers.
Figure 3. IL2RA and MAP2K1 mRNA relative quantification established by RT-qPCR analysis
according to age. Gene expression levels of these genes differed significantly between patients
younger than 50 years and patients older than or equal to 50 years.
Figure 4. IL2RB and NOTCH1 mRNA relative quantification (RQ) established by RT-qPCR analysis
according to gender. Gene expression levels of these genes differed significantly between males and
females.
Figure 2.ANXA3 and SMAD2 mRNA relative quantification (RQ) established by RT-qPCR analysis according to histological grade. Gene expression levels of these genes differed significantly between well- and poorly differentiated cancers.
We found significant associations between tumor mRNA expression of IL2RB and NOTCH1 genes and gender and between tumor mRNA expression of IL2RA and MAP2K1 genes and age. In particular, the IL2RA gene was significantly downregulated in patients younger than 50 years old compared with patients older than 50 years (Figure3). Addi-tionally, an increased expression of the MAP2K1 gene was observed in patients older than
J. Pers. Med. 2021, 11, 126 10 of 21
50 years in comparison with patients younger than 50 years old (p = 0.02). IL2RB exhibited lower expression in females compared with males (p = 0.02) (Table3and Figure4). Con-versely, the NOTCH1 gene was significantly upregulated in female patients as compared with male CRC cases (p = 0.02).
J. Pers. Med. 2021, 11, x FOR PEER REVIEW 10 of 22
Figure 2. ANXA3 and SMAD2 mRNA relative quantification (RQ) established by RT-qPCR analysis
according to histological grade. Gene expression levels of these genes differed significantly between
well- and poorly differentiated cancers.
Figure 3. IL2RA and MAP2K1 mRNA relative quantification established by RT-qPCR analysis
according to age. Gene expression levels of these genes differed significantly between patients
younger than 50 years and patients older than or equal to 50 years.
Figure 4. IL2RB and NOTCH1 mRNA relative quantification (RQ) established by RT-qPCR analysis
according to gender. Gene expression levels of these genes differed significantly between males and
females.
Figure 3. IL2RA and MAP2K1 mRNA relative quantification established by RT-qPCR analysis according to age. Gene expression levels of these genes differed significantly between patients younger than 50 years and patients older than or equal to 50 years.
J. Pers. Med. 2021, 11, x FOR PEER REVIEW 10 of 22
Figure 2. ANXA3 and SMAD2 mRNA relative quantification (RQ) established by RT-qPCR analysis
according to histological grade. Gene expression levels of these genes differed significantly between
well- and poorly differentiated cancers.
Figure 3. IL2RA and MAP2K1 mRNA relative quantification established by RT-qPCR analysis
according to age. Gene expression levels of these genes differed significantly between patients
younger than 50 years and patients older than or equal to 50 years.
Figure 4. IL2RB and NOTCH1 mRNA relative quantification (RQ) established by RT-qPCR analysis
according to gender. Gene expression levels of these genes differed significantly between males and
females.
Figure 4.IL2RB and NOTCH1 mRNA relative quantification (RQ) established by RT-qPCR analysis according to gender. Gene expression levels of these genes differed significantly between males and females.
3.3. Heat Maps of Real-Time PCR Data
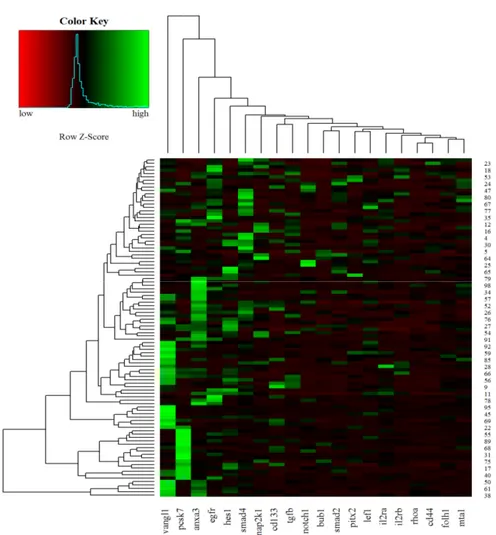
Hierarchical clustering of 100 CRC samples is reported in Figure5. According to the diagram, the VANGL1, PCSK7, and ANXA3 genes showed the highest expression levels in most CRC samples.
J. Pers. Med. 2021, 11, 126 11 of 21
J. Pers. Med. 2021, 11, x FOR PEER REVIEW 11 of 22
3.3. Heat Maps of Real-Time PCR Data
Hierarchical clustering of 100 CRC samples is reported in Figure 5. According to the
diagram, the VANGL1, PCSK7, and ANXA3 genes showed the highest expression levels
in most CRC samples.
Figure 5. Heat maps of real-time RT-qPCR data representing gene expression variations of the 20
analyzed transcripts in FFPE CRC samples. Green indicates upregulation, and red indicates downregulation.
3.4. ROC Analysis
The predictive performance of the 20-gene signature was assessed by computing the
AUC value of the ROC curve. A logistic regression model was built based on the
comparison of tumor samples (n = 100) in relation to the following study patient
characteristics: stage I–II vs. III–IV and presence vs. absence of LNM. We selected two
panels including 5 and 10 genes based on the genes that had the highest AUC and showed
a more effective role in CRC progression. One panel included 5 genes (VANGL1, IL2RA,
SMAD2, RHOA1, and HES), and the other 10 genes (previous 5 plus MTA1, CD133,
FOLH1, NOTCH1, and TGF-ß). The total number of genes (i.e., 20-gene panel) was also
analyzed.
Figure 6 summarizes the performances of the study gene panels for the prediction of
stage in the patient cohort, with the 20-gene panel achieving the highest performance. The
AUC value for the 5-gene panel was 68.39%, along with 95% CI, 57.81%–78.97%; 67.30%
sensitivity; and 66.66% specificity (Figure 6A); for the 10-gene panel, the AUC was 71.67%
(95% CI, 61.51%–81.84%; sensitivity, 61.53%; and specificity, 72.91%) (Figure 6B). The
analysis of the total 20 genes resulted in AUC = 78.85% (95% CI, 69.94%–87.75%; sensitivity,
75%; and specificity, 77.08%) (Figure 6C). In Figure 6D, the AUCs of 20-, 10-, and 5-gene
panels in relation to stage are reported. When all the three AUCs (5-/10-/total-gene panels)
were compared together, these results showed a trend towards significance (p = 0.055).
Figure 5. Heat maps of real-time RT-qPCR data representing gene expression variations of the 20 analyzed transcripts in FFPE CRC samples. Green indicates upregulation, and red indicates downregulation.
3.4. ROC Analysis
The predictive performance of the 20-gene signature was assessed by computing the AUC value of the ROC curve. A logistic regression model was built based on the compari-son of tumor samples (n = 100) in relation to the following study patient characteristics: stage I–II vs. III–IV and presence vs. absence of LNM. We selected two panels including 5 and 10 genes based on the genes that had the highest AUC and showed a more effective role in CRC progression. One panel included 5 genes (VANGL1, IL2RA, SMAD2, RHOA1, and HES), and the other 10 genes (previous 5 plus MTA1, CD133, FOLH1, NOTCH1, and TGF-ß). The total number of genes (i.e., 20-gene panel) was also analyzed.
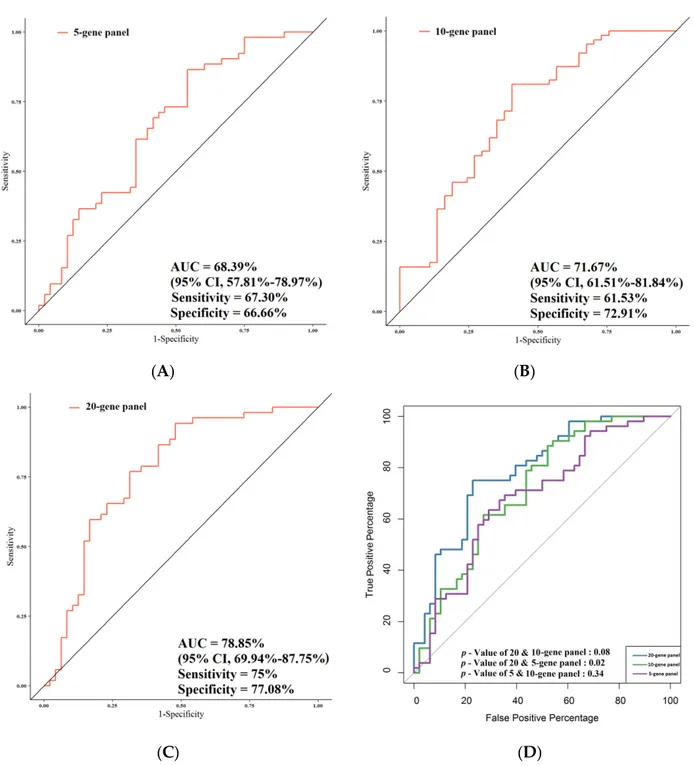
Figure6summarizes the performances of the study gene panels for the prediction of stage in the patient cohort, with the 20-gene panel achieving the highest performance. The AUC value for the 5-gene panel was 68.39%, along with 95% CI, 57.81%–78.97%; 67.30% sensitivity; and 66.66% specificity (Figure6A); for the 10-gene panel, the AUC was 71.67% (95% CI, 61.51%–81.84%; sensitivity, 61.53%; and specificity, 72.91%) (Figure6B). The analysis of the total 20 genes resulted in AUC = 78.85% (95% CI, 69.94%–87.75%; sensitivity, 75%; and specificity, 77.08%) (Figure6C). In Figure6D, the AUCs of 20-, 10-, and 5-gene panels in relation to stage are reported. When all the three AUCs (5-/10-/total-gene panels) were compared together, these results showed a trend towards significance (p = 0.055). When the AUC of the total number of genes was compared with that of the 5 genes, the difference was highly significant (p = 0.02). A statistical trend was observed between the AUC of the total panel and that of the 10-gene panel (p = 0.08), while no significant
J. Pers. Med. 2021, 11, 126 12 of 21
difference between the AUC of the 10-gene panel and that of the 5-gene panel was noted (p = 0.34).
J. Pers. Med. 2021, 11, x FOR PEER REVIEW 12 of 22
When the AUC of the total number of genes was compared with that of the 5 genes, the
difference was highly significant (p = 0.02). A statistical trend was observed between the
AUC of the total panel and that of the 10-gene panel (p = 0.08), while no significant
difference between the AUC of the 10-gene panel and that of the 5-gene panel was noted
(p = 0.34).
Figure 7 summarizes the performances of the study gene panels for the prediction of
LNMs in CRC patients, and also in this case, the 20-gene panel achieved the highest
performance. The AUC value was 70.19% (95% CI, 59.18%–81.02%; sensitivity, 84.12%;
specificity, 57.86%) when the gene expression of the 5-gene panel was compared in
relation to LNM and non-LNM CRC patients (Figure 7A). Comparison of the gene
expression of the 10-gene panel in relation to LNM and non-LNM CRC patients resulted
in AUC = 71.47% (95% CI, 60.62%–82.32%; sensitivity, 80.95%; specificity, 59.45%) (Figure
7B). The AUC of the total genes in LNM vs. non-LNM CRC patients was the highest of the
three AUCs obtained (i.e., 79.84% (95% CI, 70.38%–89.30%; sensitivity, 74.60%; specificity,
75.67%) (Figure 7C). As far as the association with LNMs was concerned, the comparison
between all the AUCs together (5-/10-/total-gene panels) pointed out a nearly significant
difference (p = 0.05). In particular, the AUC of the total-gene panel was significantly higher
compared with that of the 5-gene panel (p = 0.03) in relation to LNM and non-LNM CRC
patients (Figure 7D). A high statistical trend was observed between the AUC of the total
gene panel and that of the 10-gene panel (p = 0.06), although no statistical difference was
observed between the AUC of the 10-gene panel and that of the 5-gene panel (p = 0.38).
We also analyzed the predictive performance of single genes according to stage and LNM
(Tables S1 and S2). Data showed that the VANGL1 gene was a significant predictor for
LNMs with an AUC of 63.99 (95% CI, 52.41%–75.56%; sensitivity, 80.95%; specificity,
45.94).
(A)
(B)
J. Pers. Med. 2021, 11, x FOR PEER REVIEW 13 of 22
(C)
(D)
Figure 6. Comparison of the predictive performance by receiver operating characteristic (ROC) curve analysis for stage.
(A) The AUC assessment of the logit(p) value for the panel of 5 genes. (B) The AUC assessment of the logit(p) value for the panel of 10 genes. (C) The AUC assessment of the logit(p) value for the panel of total genes. (D) Comparison of the predictive performance for the panel of 5, 10, and 20 genes.
(A)
(B)
Figure 6. Comparison of the predictive performance by receiver operating characteristic (ROC) curve analysis for stage. (A) The AUC assessment of the logit(p) value for the panel of 5 genes. (B) The AUC assessment of the logit(p) value for the panel of 10 genes. (C) The AUC assessment of the logit(p) value for the panel of total genes. (D) Comparison of the predictive performance for the panel of 5, 10, and 20 genes.
Figure7summarizes the performances of the study gene panels for the prediction of LNMs in CRC patients, and also in this case, the 20-gene panel achieved the highest performance. The AUC value was 70.19% (95% CI, 59.18%–81.02%; sensitivity, 84.12%; specificity, 57.86%) when the gene expression of the 5-gene panel was compared in relation to LNM and non-LNM CRC patients (Figure7A). Comparison of the gene expression of the 10-gene panel in relation to LNM and non-LNM CRC patients resulted in AUC = 71.47%
J. Pers. Med. 2021, 11, 126 13 of 21
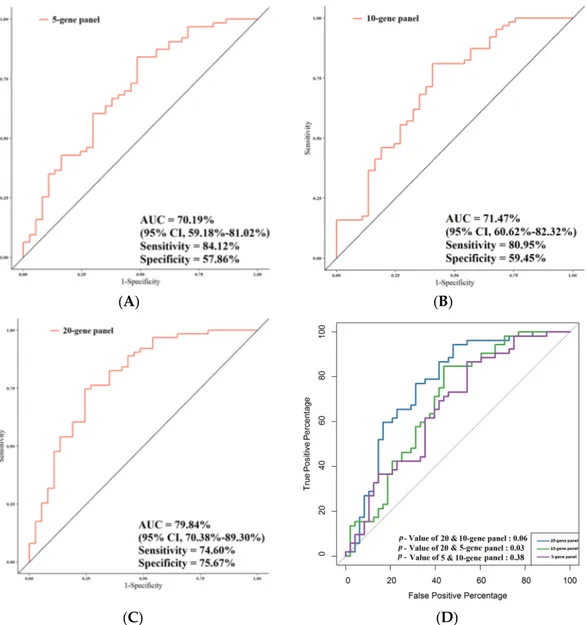
(95% CI, 60.62%–82.32%; sensitivity, 80.95%; specificity, 59.45%) (Figure7B). The AUC of the total genes in LNM vs. non-LNM CRC patients was the highest of the three AUCs obtained (i.e., 79.84% (95% CI, 70.38%–89.30%; sensitivity, 74.60%; specificity, 75.67%) (Figure7C). As far as the association with LNMs was concerned, the comparison between all the AUCs together (5-/10-/total-gene panels) pointed out a nearly significant difference (p = 0.05). In particular, the AUC of the total-gene panel was significantly higher compared with that of the 5-gene panel (p = 0.03) in relation to LNM and non-LNM CRC patients (Figure7D). A high statistical trend was observed between the AUC of the total gene panel and that of the 10-gene panel (p = 0.06), although no statistical difference was observed between the AUC of the 10-gene panel and that of the 5-gene panel (p = 0.38). We also analyzed the predictive performance of single genes according to stage and LNM (Tables S1 and S2). Data showed that the VANGL1 gene was a significant predictor for LNMs with an AUC of 63.99 (95% CI, 52.41%–75.56%; sensitivity, 80.95%; specificity, 45.94).
J. Pers. Med. 2021, 11, x FOR PEER REVIEW 13 of 22
(C) (D)
Figure 6. Comparison of the predictive performance by receiver operating characteristic (ROC) curve analysis for stage. (A) The AUC assessment of the logit(p) value for the panel of 5 genes. (B) The AUC assessment of the logit(p) value for the panel of 10 genes. (C) The AUC assessment of the logit(p) value for the panel of total genes. (D) Comparison of the predictive performance for the panel of 5, 10, and 20 genes.
(A) (B)
J. Pers. Med. 2021, 11, x FOR PEER REVIEW 14 of 22
(C) (D)
Figure 7. Comparison of the predictive performance by receiver operating characteristic (ROC) curve analysis for lymph node metastasis (LNMs). (A) The AUC assessment of the logit(p) value for the panel of 5 genes. (B) The AUC assessment of the logit(p) value for the panel of 10 genes. (C) The AUC assessment of the logit(p) value for the panel of total genes. (D) Comparison of the predictive performance for the panel of 5, 10, and 20 genes.
3.5. Correlation of Gene Expression with Overall Survival
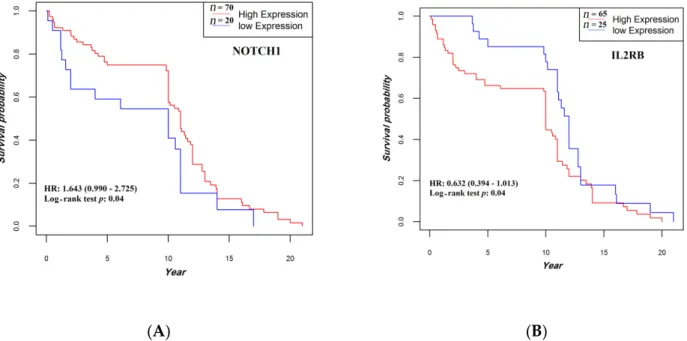
All patients completed their follow-up by 20 December 2018 (median, 10.8 years, and range, 0.019–21 years). Patients whose tumors expressed higher levels of NOTCH1 mRNA or lower levels of IL2RB mRNA showed a statistically significant prolonged OS compared with their respective counterparts (p = 0.042 and p = 0.043, respectively) (Figure 8). No other statistically significant correlation was found between OS and expression levels of the other study genes.
(A) (B)
Figure 8. Association between NOTCH1 (A) and IL2RB (B) expression and overall survival. The median follow-up was 10.8 (0.95LCL–0.95UCL; 10–11) years. HR, hazard ratio.
Figure 7. Comparison of the predictive performance by receiver operating characteristic (ROC) curve analysis for lymph node metastasis (LNMs). (A) The AUC assessment of the logit(p) value for the panel of 5 genes. (B) The AUC assessment of the logit(p) value for the panel of 10 genes. (C) The AUC assessment of the logit(p) value for the panel of total genes. (D) Comparison of the predictive performance for the panel of 5, 10, and 20 genes.
J. Pers. Med. 2021, 11, 126 14 of 21
3.5. Correlation of Gene Expression with Overall Survival
All patients completed their follow-up by 20 December 2018 (median, 10.8 years, and range, 0.019–21 years). Patients whose tumors expressed higher levels of NOTCH1 mRNA or lower levels of IL2RB mRNA showed a statistically significant prolonged OS compared with their respective counterparts (p = 0.042 and p = 0.043, respectively) (Figure8). No other statistically significant correlation was found between OS and expression levels of the other study genes.
J. Pers. Med. 2021, 11, x FOR PEER REVIEW 14 of 22
(C)
(D)
Figure 7. Comparison of the predictive performance by receiver operating characteristic (ROC) curve analysis for lymph
node metastasis (LNMs). (A) The AUC assessment of the logit(p) value for the panel of 5 genes. (B) The AUC assessment of the logit(p) value for the panel of 10 genes. (C) The AUC assessment of the logit(p) value for the panel of total genes. (D) Comparison of the predictive performance for the panel of 5, 10, and 20 genes.
3.5. Correlation of Gene Expression with Overall Survival
All patients completed their follow-up by 20 December 2018 (median, 10.8 years, and
range, 0.019–21 years). Patients whose tumors expressed higher levels of NOTCH1 mRNA
or lower levels of IL2RB mRNA showed a statistically significant prolonged OS compared
with their respective counterparts (p = 0.042 and p = 0.043, respectively) (Figure 8). No
other statistically significant correlation was found between OS and expression levels of
the other study genes.
(A)
(B)
Figure 8. Association between NOTCH1 (A) and IL2RB (B) expression and overall survival. The median follow-up was
10.8 (0.95LCL–0.95UCL; 10–11) years. HR, hazard ratio.
Figure 8. Association betweenNOTCH1 (A) and IL2RB (B) expression and overall survival. The median follow-up was 10.8 (0.95LCL–0.95UCL; 10–11) years. HR, hazard ratio.
3.6. Immunohistochemistry Analysis
The protein expression levels of four genes that play a critical role in cancer develop-ment and progression was evaluated by using IHC. Twenty-five percent of CRC FFPE and normal matched tissues were used in this regard. In particular, we were interested in the evaluation of the expression levels of the products of VANGL1, EGFR, and SMAD4 based on literature data and on the relationships we observed between the expression of their respective encoding genes and the clinical/pathological characteristics of the study CRC patients. The fourth protein we selected was LEF1. Although we did not find relationships between LEF1 gene expression and the clinical/pathological parameters of CRC patients, we were interested in evaluating the potential role of LEF1 as an early biomarker of colorec-tal carcinogenesis since its activation by MYC has been associated with the activation of the WNT pathway signaling. The protein expression of VANGL1, EGFR, LEF1, and SMAD4 via their antibodies were examined. Results showed that VANGL1 and EGFR proteins were overexpressed (more than 50% of the stained cells in colon adenocarcinoma tissues compared with the normal tissues) (Figures9and10). Additionally, immunohistochemical staining revealed a predominantly nuclear localization of SMAD4 and LEF1, and they showed higher expression in CRC tissues compared with normal colonic mucosa with more than 50% and 20% of the stained cells, respectively (Figures10and11).
J. Pers. Med. 2021, 11, 126 15 of 21
J. Pers. Med. 2021, 11, x FOR PEER REVIEW 15 of 22
3.6. Immunohistochemistry Analysis
The protein expression levels of four genes that play a critical role in cancer development and progression was evaluated by using IHC. Twenty-five percent of CRC FFPE and normal matched tissues were used in this regard. In particular, we were interested in the evaluation of the expression levels of the products of VANGL1, EGFR, and SMAD4 based on literature data and on the relationships we observed between the expression of their respective encoding genes and the clinical/pathological characteristics of the study CRC patients. The fourth protein we selected was LEF1. Although we did not find relationships between LEF1 gene expression and the clinical/pathological parameters of CRC patients, we were interested in evaluating the potential role of LEF1 as an early biomarker of colorectal carcinogenesis since its activation by MYC has been associated with the activation of the WNT pathway signaling. The protein expression of VANGL1, EGFR, LEF1, and SMAD4 via their antibodies were examined. Results showed that VANGL1 and EGFR proteins were overexpressed (more than 50% of the stained cells in colon adenocarcinoma tissues compared with the normal tissues) (Figures 9 and 10). Additionally, immunohistochemical staining revealed a predominantly nuclear localization of SMAD4 and LEF1, and they showed higher expression in CRC tissues compared with normal colonic mucosa with more than 50% and 20% of the stained cells, respectively (Figures 10 and 11).
(A) (B)
#
Figure 9. (A) Immunohistochemical staining of VANGL1 in colorectal adenocarcinoma with an intensity score of 3+ with more than 70% of the stained cells. (B) Immunohistochemical staining of VANGL1 in normal sample.
(A) (B)
Figure 9. (A) Immunohistochemical staining of VANGL1 in colorectal adenocarcinoma with an intensity score of 3+ with more than 70% of the stained cells. (B) Immunohistochemical staining of VANGL1 in normal sample.
J. Pers. Med. 2021, 11, x FOR PEER REVIEW 15 of 22
3.6. Immunohistochemistry Analysis
The protein expression levels of four genes that play a critical role in cancer development and progression was evaluated by using IHC. Twenty-five percent of CRC FFPE and normal matched tissues were used in this regard. In particular, we were interested in the evaluation of the expression levels of the products of VANGL1, EGFR, and SMAD4 based on literature data and on the relationships we observed between the expression of their respective encoding genes and the clinical/pathological characteristics of the study CRC patients. The fourth protein we selected was LEF1. Although we did not find relationships between LEF1 gene expression and the clinical/pathological parameters of CRC patients, we were interested in evaluating the potential role of LEF1 as an early biomarker of colorectal carcinogenesis since its activation by MYC has been associated with the activation of the WNT pathway signaling. The protein expression of VANGL1, EGFR, LEF1, and SMAD4 via their antibodies were examined. Results showed that VANGL1 and EGFR proteins were overexpressed (more than 50% of the stained cells in colon adenocarcinoma tissues compared with the normal tissues) (Figures 9 and 10). Additionally, immunohistochemical staining revealed a predominantly nuclear localization of SMAD4 and LEF1, and they showed higher expression in CRC tissues compared with normal colonic mucosa with more than 50% and 20% of the stained cells, respectively (Figures 10 and 11).
(A) (B)
#
Figure 9. (A) Immunohistochemical staining of VANGL1 in colorectal adenocarcinoma with an intensity score of 3+ with more than 70% of the stained cells. (B) Immunohistochemical staining of VANGL1 in normal sample.
(A) (B)
Figure 10. (A) Immunohistochemical staining of EGFR in colorectal adenocarcinoma with an intensity score of 2+ with more than 50% of the stained cells. (B) Immunohistochemical staining of LEF1 in colorectal adenocarcinoma with a positive expression of more than 20% of the stained cells.
J. Pers. Med. 2021, 11, x FOR PEER REVIEW 16 of 22
Figure 10. (A) Immunohistochemical staining of EGFR in colorectal adenocarcinoma with an intensity score of 2+ with more than 50% of the stained cells. (B) Immunohistochemical staining of LEF1 in colorectal adenocarcinoma with a positive expression of more than 20% of the stained cells.
(A) (B)
Figure 11. (A) Immunohistochemical staining of SMAD4 in colorectal adenocarcinoma with an intensity score of 2+ with more than 50% of the stained cells. (B) Immunohistochemical staining of SMAD4 in normal sample.
4. Discussion
The prediction of CRC progression risk and the identification of novel biomarkers predictive of this risk could represent a relevant advancement [6]. In this study, we evaluated the expression levels of several genes that are involved in LNM and malignant transitions in CRC tissues via RT-qPCR and IHC methods.
Previous investigations showed a high tumor expression level of the VANGL-1 gene in CRC patients compared with normal tissues [21–24]. Additionally, VANGL1 gene expression levels have been suggested to play a critical role in CRC progression and to be notably related to tumor stages and LNM [21–24]. These findings are in substantial agreement with our results. Lee and et al. showed that VANGL1 gene knockdown can decrease the mRNA expression level of CYKLIND1, COX2, MMP3, and ERK1/2 and reduce tumor growth and invasion. In addition, they found that a high expression level of the VANGL1 gene was associated with the overexpression of AP-1 target genes, which have an important role in MAPK signaling in CRC [22]. Oh et al. indicated that VANGL1 silencing reduced vascular endothelial growth factor A (VEGF-A) and hypoxia-inducible factor 1-alpha (HIF1A). They suggested that the VANGL1 gene can increase angiogenesis and CRC malignancy [21]. Additionally, our past investigations showed that angiogenesis and the angiogenic factors VEGF-A and HIFA play an important role in CRC initiation and progression [25–27]. Thus, it seems that the VANGL1 gene may interact with VEGF-A and HIF1A signaling and enhance tumor malignancy.
In this study, we showed that the VANGL1 gene was an independent prognostic biomarker for CRC patients. Taken together, these results indicate that the VANGL1 gene may have a key role in the regulation of several genes, including those involved in angiogenesis. Thus, VANGL1 could be suggested as a potential biomarker for the prediction of tumor malignancy and targeted therapy in CRC.
TGF-β has been suggested to be a tumor suppressor gene able to stop the cell cycle at
early stages of tumor, and SMAD proteins, being transcriptional mediators of TGF-β signaling, play a critical role in it [28]. In particular, SMAD2 is located at 18q21 and plays a role as a tumor suppressor gene [29–31]. As a result of the loss of heterozygosity (LOH) in the 18q21 region, SMAD2 gene expression is reduced in several cancers and increases cancer progression [31]. However, our findings showed a significant downregulation of
Figure 11. (A) Immunohistochemical staining of SMAD4 in colorectal adenocarcinoma with an intensity score of 2+ with more than 50% of the stained cells. (B) Immunohistochemical staining of SMAD4 in normal sample.
J. Pers. Med. 2021, 11, 126 16 of 21
4. Discussion
The prediction of CRC progression risk and the identification of novel biomarkers predictive of this risk could represent a relevant advancement [6]. In this study, we evaluated the expression levels of several genes that are involved in LNM and malignant transitions in CRC tissues via RT-qPCR and IHC methods.
Previous investigations showed a high tumor expression level of the VANGL-1 gene in CRC patients compared with normal tissues [21–24]. Additionally, VANGL1 gene expres-sion levels have been suggested to play a critical role in CRC progresexpres-sion and to be notably related to tumor stages and LNM [21–24]. These findings are in substantial agreement with our results. Lee and et al. showed that VANGL1 gene knockdown can decrease the mRNA expression level of CYKLIND1, COX2, MMP3, and ERK1/2 and reduce tumor growth and invasion. In addition, they found that a high expression level of the VANGL1 gene was associated with the overexpression of AP-1 target genes, which have an important role in MAPK signaling in CRC [22]. Oh et al. indicated that VANGL1 silencing reduced vascular endothelial growth factor A (VEGF-A) and hypoxia-inducible factor 1-alpha (HIF1A). They suggested that the VANGL1 gene can increase angiogenesis and CRC malignancy [21]. Additionally, our past investigations showed that angiogenesis and the angiogenic fac-tors VEGF-A and HIFA play an important role in CRC initiation and progression [25–27]. Thus, it seems that the VANGL1 gene may interact with VEGF-A and HIF1A signaling and enhance tumor malignancy.
In this study, we showed that the VANGL1 gene was an independent prognostic biomarker for CRC patients. Taken together, these results indicate that the VANGL1 gene may have a key role in the regulation of several genes, including those involved in angiogenesis. Thus, VANGL1 could be suggested as a potential biomarker for the prediction of tumor malignancy and targeted therapy in CRC.
TGF-b has been suggested to be a tumor suppressor gene able to stop the cell cycle at early stages of tumor, and SMAD proteins, being transcriptional mediators of TGF-signaling, play a critical role in it [28]. In particular, SMAD2 is located at 18q21 and plays a role as a tumor suppressor gene [29–31]. As a result of the loss of heterozygosity (LOH) in the 18q21 region, SMAD2 gene expression is reduced in several cancers and increases cancer progression [31]. However, our findings showed a significant downregulation of SMAD2 in well-differentiated tumors. Although this finding is substantial in contrast with most of the available data, the complexity of the mutational profile of SMAD2 [32], its relationships with the other SMAD proteins [33], and the potential role of specific miRNAs on the regulation of SMAD2 [34] could have contributed to this result.
SMAD4 that forms a heterotrimer with SMAD2 and SMAD3 to exert transcriptional activity plays a crucial role in carcinogenesis [35], and loss of the SMAD4 gene occurs in about 30% of CRC [36]. It was reported that loss of SMAD4 was significantly related to CRC progression and metastasis and occurred in late stages [29,37–40]. Previous studies revealed that in colon cancer, the activation of TGF- signaling induced ERK and P38 signaling and stimulated angiogenesis by VEGF upregulation when SMAD4 was knocked down [36]. Our findings are in agreement with previous investigations [41,42] and indicate that the expression level of the SMAD4 gene in stage III-IV CRC was lower than that in stage I-II, although this difference did not reach a statistically significant level.
We observed an upregulation of the TGF-b gene in stage III-IV CRC samples, although these results were not statistically significant. According to these data, loss of the SMAD4 gene and upregulation of TGF-b may be associated with a more advanced tumor stage and can promote cancer initiation, progression, and metastasis [35].
The NOTCH signaling pathway activity has been reported in several cancers, such as CRC and hepatocarcinoma [43–46]. NOTCH signaling consists of several receptors (NOTCH1–4) and targets genes including the transcription factor HES1 (HES family basic helix-loop-helix (bHLH) transcription factor 1) [43,47,48]. In addition, HES1 has several functions, such as intestinal cell stability and apoptosis control [43,49]. Our study showed a downregulation of NOTCH1 in stage III-IV CRC and a significant correlation between