Contents lists available atScienceDirect
Global and Planetary Change
journal homepage:www.elsevier.com/locate/gloplachaPlanktic foraminiferal response to early Eocene carbon cycle perturbations
in the southeast Atlantic Ocean (ODP Site 1263)
Valeria Luciani
a,⁎, Roberta D'Onofrio
a, Gerald R. Dickens
b, Bridget S. Wade
caDepartment of Physics and Earth Sciences, Ferrara University, via G. Saragat 1, 44122, Italy
bDepartment of Earth Sciences, Rice University, Houston, TX 77005, USA
cDepartment of Earth Sciences, University College London, Gower Street, London, United Kingdom
A R T I C L E I N F O
Keywords:
Early Eocene Climatic Optimum Planktic foraminiferal changes Eocene carbon cycling Bulk carbon isotopes
A B S T R A C T
At low latitude locations in the northern hemisphere, striking changes in the relative abundances and diversity of the two dominant planktic foraminifera genera, Morozovella and Acarinina, are known to have occurred close to the Early Eocene Climatic Optimum (EECO; ~ 49–53 Ma). Lower Eocene carbonate-rich sediments at Ocean
Drilling Program (ODP) Site 1263 were deposited on a bathymetric high (Walvis Ridge) at ~ 40° S, and afford an
opportunity to examine such planktic foraminiferal assemblage changes in a temperate southern hemisphere setting. We present here quantified counts of early Eocene planktic foraminiferal assemblages from Hole 1263B, along with bulk sediment stable isotope analyses and proxy measurements for carbonate dissolution. The bulk
sedimentδ13C record at Site 1263 resembles similar records generated elsewhere, such that known and inferred
hyperthermal events can be readily identified. Although some carbonate dissolution has occurred, the
well-preserved planktic foraminiferal assemblages mostly represent primary changes in environmental conditions. Our results document the permanent decrease in Morozovella abundance and increase in Acarinina abundance at the beginning of the EECO, although this switch occurred ~ 165 kyr after that at low-latitude northern hemi-sphere locations. This suggests that unfavourable environmental conditions for morozovellids at the start of the EECO, such as sustained passage of a temperature threshold or other changes in surface waters, occurred at
lower latitudesfirst. The remarkable turnover from Morozovella to Acarinina was widely geographically
wide-spread, although the causal mechanism remains elusive. In addition, at Site 1263, we document the virtual disappearance within the EECO of the biserial chiloguembelinids, commonly considered as inhabiting inter-mediate water depths, and a reduction in abundance of the thermocline-dwelling subbotinids. We interpret these changes as signals of subsurface water properties, perhaps warming, and the associated contraction of ecological niches.
1. Introduction
From a paleoclimate perspective, the early Paleogene represents an exceptionally interesting and dynamic time of Earth's history. Beginning about 59 million years ago (Ma), temperatures across Earth's surface slowly rose toward the Early Eocene Climatic Optimum (EECO), an extended interval of peak Cenozoic global warmth (Zachos et al., 2008). Average high-latitude and deep ocean temperatures during the EECO likely exceeded those at present day by at least 10 °C (Zachos et al., 2008; Bijl et al., 2009; Huber and Caballero, 2011; Hollis et al., 2012; Pross et al., 2012; Inglis et al., 2015). However, during the long-term early Paleogene warming and also within the EECO, our planet experienced several short-term (~ 40–200 kyr) global warming epi-sodes, now referred to as hyperthermals (e.g.,Kennett and Stott 1991;
Thomas, et al., 2000; Lourens et al., 2005; Nicolo et al., 2007; Zachos et al., 2010; Coccioni et al., 2012; Kirtland-Turner et al., 2014; Littler et al., 2014; Lauretano et al., 2016).
Considerable scientific study has focused on understanding the early Paleogene hyperthermals, especially the most prominent example, the Paleocene-Eocene thermal maximum (PETM, ~ 56 Ma). This is because several of the hyperthermals were clearly associated with massive input of carbon to the ocean and atmosphere, as well as profound turnovers in various biotic ecosystems. The PETM has even been suggested as an outstanding past analogue for understanding current and future climate change (e.g.,Dickens et al., 1997; Pagani et al., 2006; McInerney and Wing, 2011; Zeebe and Zachos, 2013). Less attention has been dedi-cated to the EECO and the long-lasting impacts of extraordinary global warmth, especially in terms of biotic response. In fact, a formal
http://dx.doi.org/10.1016/j.gloplacha.2017.09.007
Received 8 June 2017; Received in revised form 13 September 2017; Accepted 13 September 2017
⁎Corresponding author.
E-mail addresses:[email protected](V. Luciani),[email protected](R. D'Onofrio),[email protected](G.R. Dickens),[email protected](B.S. Wade).
Available online 15 September 2017
0921-8181/ Published by Elsevier B.V. This is an open access article under the CC BY license (http://creativecommons.org/licenses/BY/4.0/).
definition of EECO, first widely introduced by Zachos et al. (2001) based on the pronounced warming trend as expressed by a 1.5‰ de-crease in the compiledδ18O curve, remains problematic (Luciani et al., 2016). Recent workers (Slotnick et al., 2015; Lauretano et al., 2015; Luciani et al., 2016) have suggested resolving the terminology and stratigraphic issues by defining the EECO as the interval comprised between a significant carbon cycle perturbation known as the “J event” (Cramer et al., 2003) and the appearance of Discoaster sublodoensis, a well-calibrated and easily recognizable calcareous nannofossil biohor-izon. The EECO thus spans from approximately 53 to 49 Ma, although average surface temperaturesfluctuated during this time.
Significant plant and mammal turnovers occurred on land during the EECO (Wing et al., 1991; Zonneveld et al., 2000; Wilf et al., 2003; Falkowski et al., 2005; Woodburne et al., 2009; Figueirido et al., 2012). In the marine realm, evolutionary turnover happened as well, in par-ticular the origin of modern calcareous nannofossil community struc-ture (Agnini et al., 2006, 2014; Schneider et al., 2011; Shamrock et al., 2012) and possibly similarly for diatoms (Sims et al., 2006; Oreshkina, 2012). These observations, both from continents and the oceans, sup-port a hypothesis that long-term climate change during the EECO may have impacted biotic evolution (Ezard et al., 2011).
Planktic foraminifera represent a fantastic class of organisms in which to examine links between past climate and evolution (e.g., Corfield, 1987; Kelly et al., 1996, 1998; Quillévéré and Norris, 2003; Ezard et al., 2011; Fraass et al., 2015). This is because they include numerous species, they precipitate carbonate tests, and they form a common component of many marine sediment records. A major turn-over in planktic foraminifera occurred near the onset of the EECO (Luciani et al., 2016). This turnover involved two genera, Morozovella and Acarinina, which were important calcifiers of the tropical and subtropical early Paleogene oceans. More specifically, the abundance and diversity of Morozovella decreased significantly while the abun-dance and diversity of Acarinina increased significantly (e.g.,Norris, 1991; Schmidt et al., 2004a; Berggren et al., 2006; Pearson et al., 2006; Aze et al., 2011; Fraass et al., 2015; Luciani et al., 2016). At multiple low-latitude locations in the northern hemisphere (Fig. 1), this“switch” in Morozovella and Acarinina genera happened rapidly and very close to the J event (Frontalini et al., 2016; Luciani et al., 2016). While tempting to suggest that the evolution of planktic foraminifera was crucially
affected by the crossing of some critical threshold in surface water conditions at the start of the EECO, such as sustained elevated tem-perature, detailed records of planktic foraminiferal assemblages across this interval remain scarce (Fig. 1).
In this study, we examine planktic foraminiferal assemblages in lower Eocene sediment at Ocean Drilling Program (ODP) Site 1263 on Walvis Ridge in the southeast Atlantic Ocean (Fig. 1). Previous work on the lower Eocene interval at this site provides a solid and fairly detailed stratigraphic framework (e.g.,Lourens et al., 2005; Westerhold et al., 2007; Stap et al., 2009, 2010a, 2010b; Lauretano et al., 2015, 2016), and shows that the carbonate-rich interval contains abundant and well-preserved planktic foraminifera (Shipboard Scientific Party, 2004). However, the planktic foraminiferal assemblages have not been studied at high-resolution. Site 1263 was probably located at ~ 40° S during the early Eocene (Van Hinsbergen et al., 2015). Consequently, the site presents an opportunity to view early Eocene planktic foraminiferal assemblage changes, especially the putative switch between mor-ozovellids and acarininids, at a southern temperate location.
2. Materials and methods
2.1. ODP Site 1263: location, lithology and samples
Site 1263 is located in the southeast Atlantic (28°31.98′ S, 2°46.77′ E) and, at 2717 m below sea level (mbsl), a few hundred meters below the crest of Walvis Ridge (Zachos et al., 2004). Both the latitude and water depth of this site likely have changed over the Cenozoic. During the early Eocene, the location probably was positioned ~ 10° further south (Van Hinsbergen et al., 2015) (Fig. 1) and at a shallower depth of ~ 1500 mbsl (Zachos et al. 2004).
Three characteristics make the upper Paleocene and lower Eocene succession at Site 1263 especially amenable for foraminifera study. First, it was cored in four adjacent holes (1263A–1263D), so that core gaps and core overlaps can be ascertained (Shipboard Scientific Party, 2004; Westerhold et al., 2007, 2015). Second, for an open ocean setting, it is relatively thick but with minimal burial below the seafloor (Zachos et al. 2004). Third, it mainly consists of nannofossil ooze with good planktic foraminiferal preservation (Zachos et al. 2004). In short, the location contains an apparently complete and relatively expanded early
Fig. 1. Approximate location of the studied site (star) during the early Eocene. Also shown are other successions where detailed planktic foraminiferal records show a major change in
genera across the EECO (red circles). We place two other locations because they have detailedδ13C records across the EECO (green circles). Base map is fromhttp://www.odsn/de/
services/paleomap.htmlwith paleolatitudes modified for Sites 577, 1051 and 1263 according towww.paleolatitude.orgmodel version 1.2 (Van Hinsbergen et al., 2015). Early Eocene
latitude for the Possagno section is based on thehttp://www.odsn.de/odsn/services/paleomap/adv_map.htmlmode, since they are not yet available atwww.paleolatitude.org. (For
Eocene record with planktic foraminifera, one that accumulated with sedimentation rates between 10 and 30 m/Myr (Lauretano et al., 2016). Consistent with a lower-bathyal open ocean depositional environ-ment, lower Paleogene sediment at Site 1263 generally has high car-bonate content (CaCO3~ 90–95% by weight) (Fig. 2). However, these
sediments also show pronounced variability at the dm- to m-scale, as clearly expressed in high-resolution magnetic susceptibility (MS) and colour reflectance data. These variations in physical properties princi-pally relate to changes in carbonate content, with highs in MS reflecting lows in carbonate content. Some of the intervals with very high MS/low carbonate represent volcanic ash horizons, as confirmed by smear slide examination (Zachos et al., 2004). Importantly, though, other such intervals mark the established or suggested hyperthermal events (Zachos et al., 2005; Lourens et al., 2005; Stap et al., 2009, 2010a), which furthermore relate to extremes in eccentricity and precession (Westerhold et al., 2007; Zachos et al., 2010; Lauretano et al., 2015, 2016).
We adopt the revised composite depth (rmcd) scale provided by Westerhold et al. (2007, 2015)that combines depth records from cores at different holes. We thus sampled the interval between 297.16 and 240.21 rmcd at Hole 1263B. Given previous work at Site 1263, in-cluding alignment of physical property and stable isotope data (Lourens et al., 2005; Westerhold et al., 2007, Stap et al. 2009, 2010a, 2010b; Lauretano et al., 2015, 2016) and calcareous nannofossil and benthic foraminifera information across various hyperthermals (Dedert et al., 2012, 2014; Gibbs et al., 2012; D'haenens et al., 2014), our sampling
spans several million years of the early Paleogene, especially including the J event and the start of the EECO.
2.2. Bulk sediment stable isotopes
A set of 140 samples, with a sampling resolution varying from ~ 30 cm to ~ 50 cm, were used to generate bulk sediment stable isotope records at Hole 1263B (Table S1). Samples werefirstly freeze-dried and then pulverized manually in a mortar. Amounts of ~ 0.5 g of powdered samples were acidified at 50 °C to be analyzed. Bulk isotope analyses were performed at the UCL Bloomsbury Environmental Isotope Facility using the Gas Bench II and Cardiff University (UK) using a Thermo Finnigan MAT 252 mass spectrometer coupled with a Kiel III carbonate preparation device. Results are reported in conventional delta notation (δ13C and δ18O) with reference to the Vienna Pee Dee Belemnite
(VPDB) standard. An internal standard (with δ18O =−2.43‰ and δ13C = 2.43‰ versus VPDB) was measured between every sixth sample
ensuring an analytical precision within 0.04 and 0.08‰ for δ13C and
δ18
O respectively. Additional duplicate analyses were conducted on 9 selected samples giving reproducibility better than 0.1 forδ13C and
0.2‰ for δ18O.
2.3. Proxies for carbonate dissolution
Extreme global warming episodes that characterized the early Eocene were marked by low carbonate contents in deep-sea settings
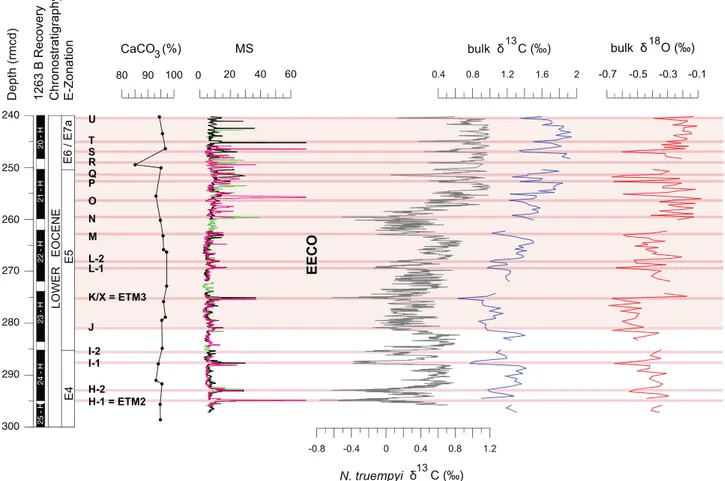
Fig. 2. Early Eocene carbonate content, magnetic susceptibility (MS) and stable isotope records at ODP Site 1263 on a revised composite depth (rmcd) scale. The bulk sedimentδ13C and
δ18O records are from this study (blue, light red) while the benthic foraminiferal (N. truempyi)δ13C record comes fromLauretano et al. (2016)(grey). The magnetic susceptibility (MS)
and the CaCO3content from theShipboard Scientific Party (2004). The green, black and pink colors in the MS profile come from Holes 1263A, 1263B and 1263C, respectively. Planktic
foraminiferal E-zonation followsWade et al. (2011)as partly modified byLuciani and Giusberti (2014); the modifications are discussed in the text. Main carbon isotope excursions (CIEs)
are labelled according toLauretano et al. (2016). Pink lines help to identify the position of CIEs. The light pink shaded band defines the Early Eocene Climatic Optimum (EECO) interval as
defined in recent papers (Lauretano et al., 2016; Luciani et al., 2016). (For interpretation of the references to colour in thisfigure legend, the reader is referred to the web version of this
(e.g., Zachos et al., 2005; Stap et al., 2009; Leon-Rodriguez and Dickens, 2010). This correspondence, which is apparent in MS records from Walvis Ridge sections (Fig. 2), once ash horizons are discounted, has been attributed principally to carbonate dissolution relating to massive and rapid carbon into the ocean and atmosphere during the hyperthermals, because this would reduce carbonate saturation hor-izons (Dickens et al., 1997; Kump et al., 2009; Zeebe et al., 2009). This is important to realize when examining early Paleogene planktic for-aminiferal assemblages, because their tests are differentially prone to dissolution and more so than both benthic foraminifera tests and most calcareous nannofossils (Berger, 1970; Bé et al., 1975; Thunell and Honjo, 1981; Hancock and Dickens, 2005; Petrizzo et al., 2008; Nguyen et al., 2009, 2011; Leon-Rodriguez and Dickens, 2010; Nguyen and Speijer, 2014). Dissolution can therefore modify the composition of planktic foraminiferal assemblages significantly. On the other hand, the decreases in carbonate content may also relate to decreased carbonate production in surface waters and ensuing carbonate rain to the seafloor, as highlighted recently for the PETM (Luo et al., 2016).
To evaluate possible dissolution effects across the studied section at Site 1263, we chose three different proxies (detailed below). These proxy measurements were determined on 75 samples. The sample spacing varied between 30 and 40 cm across several major carbon cycle perturbations, and from 40 cm to 1 m through remaining intervals (Table S1). The proxies are:
(1) The fragmentation index (F index). Planktonic foraminifera tend to break into fragments when they begin to dissolve (Berger, 1970, 1973; Bé et al., 1975; Leon-Rodriguez and Dickens, 2010; Nguyen and Speijer, 2014). Consequently, fragmentation is a commonly adopted proxy for planktic foraminiferal dissolution. The F index (expressed as a percentage) was calculated here according toBerger (1970): the ratio between fragments or partially dissolved planktic foraminiferal tests versus entire tests on ~ 300 elements. Amongst the fragmented tests, we included all planktic foraminiferal speci-mens showing missing or deteriorated chambers and substantial breakage.
(2) The planktic over benthic (P/B) ratio. Most planktic foraminifera preferentially dissolve relative to benthic foraminifera. The P/B ratio, often adopted for paleobathymetric estimates (e.g.,Murray, 1976; Van der Zwaan et al., 1990), therefore also can be applied as a dissolution index (e.g.,Hancock and Dickens, 2005; Nguyen et al., 2009; Nguyen and Speijer, 2014). The P/B index was here calcu-lated on ~ 300 whole specimens and is expressed as 100∗ P / (P + B).
(3) The weight percent coarse fraction (WPCF). Planktic foraminifera, including “juvenile” specimens, generally exceed 38 μm. Dissolution of planktic foraminifera, such as observed with seafloor sediment within the lysocline, thus modifies bulk sediment grain size (e.g.,Berger et al., 1982). The WPCF was calculated as the ratio between the weights of the dry fraction≥38 μm and the bulk dry sediment (Hancock and Dickens, 2005).
All three parameters come with caveats (Hancock and Dickens, 2005). For example, an increase in calcareous nannofossil production will affect the WPCF, and an increase in planktic foraminiferal pro-duction will affect the WPCF and P/B index.
2.4. Planktic foraminiferal distribution and abundances
We collected data on planktic foraminifera for the same 75 samples at Hole 1263B used to generate dissolution proxies (Table S1). Planktic foraminifera were studied on washed residues using a stereomicroscope with an incident light beam. The residues were prepared by immersing previously freeze-dried bulk samples in deionized water. Disaggregation occurred in a time varying from few hours to three days, depending on the compactness of the sediments. When disaggregated,
samples were washed over stacked > 63 and > 38μm sieves. After each washing, sieves were immerged in a methylene blue bath in order to colour planktic foraminifera potentially trapped in the sieve mesh (e.g.,Green, 2001). This is an easy method to exclude possible con-taminations amongst different samples. The separated fractions of each washed residue were dried at < 50 °C.
The taxonomic criteria adopted to identify planktic foraminiferal genera and species followPearson et al. (2006, and references therein). Relative abundances of planktic foraminiferal genera were generated at Site 1263 by counting at least 300 complete specimens in random splits from the≥63 μm size fractions and are expressed in percentages. Some foraminiferal genera were grouped according to their similar depth habitat as reported byPearson et al. (2006, and references therein). Accordingly, the Subbotina group includes the genera Subbotina and Parasubbotina, and the chiloguembelinids comprise the genera Chilo-guembelina and Zeauvigerina. We keep separate the species Subbotina senni, since this taxon occupied a different habitat with respect to the other subbotinids. Specifically, this species is considered a mixed-layer form that sank to middle mixed-layer or deeper depths during game-togenesis (Pearson et al., 1993; Pearson et al., 2006and references therein).
2.5. Chronology
Using high-resolution variations in sediment composition, including benthic foraminifera stable isotopes,Lauretano et al. (2016)presented a detailed astronomically tuned age model for the lower Eocene interval at Site 1263. We use this age model, which places the J event (280.85 rmcd) at 53.27 Ma.
3. Results and discussion 3.1. Bulk carbon isotope records
The bulk sediment δ13C record (Fig. 2, Table S1) exhibits both
trends and excursions. In the basal part of the studied interval (297.16 to 281.87 rmcd),δ13C values average ~ 1.2‰ with no clear trend. Bulk sediment carbon isotope values generally decrease by ~ 0.25‰ be-tween 280.77 and 274.25 rmcd. Theδ13C values gradually increase
above this interval, reaching a maximum of ~ 1.9‰ in the uppermost part of the investigated interval. High-frequencyδ13C variations are superimposed on these basic trends, most obviously multiple negative carbon isotope excursions (CIEs) with magnitudes ranging from 0.4‰ to 0.7‰ (Fig. 2, Table S1).
Although the absolute values ofδ13C vary, both the trends and CIEs
have been observed in otherδ13C records spanning all or part of the
EECO. This includes bulk sedimentδ13C records at the neighbouring ODP Site 1262 (Walvis Ridge, Zachos et al. 2010), ODP Site 1258 (Demerara Rise, west equatorial Atlantic,Kirtland-Turner et al., 2014), ODP Site 1051 (Blake Nose, northwest Atlantic,Luciani et al., in press), DSDP Site 577 (Shatsky Rise, northwest Pacific,Luciani et al., 2016), and the Branch and Mead Stream sections in New Zealand (Slotnick et al. 2012, 2015). Importantly, the correspondence also can be ob-served in the benthic foraminiferal (Nuttallides truempyi)δ13C record at Site 1263 (Lauretano et al., 2016) (Figs. 2, 3). The variations inδ13C
through the early Eocene are truly global and signify changes in the composition of dissolved inorganic carbon (DIC) pools of the ocean. We note the ~ 1‰ offset in absolute δ13C values between the bulk and
benthic foraminifera records, which principally reflects differences between surface and deep ocean DIC composition as well as differences between carbon isotope fractionation by calcareous nannofossils and benthic foraminifera.
We interpret and label the primary CIEs followingCoccioni et al. (2012)andLauretano et al. (2016), who extended the alphabetic or-dering scheme initiated byCramer et al. (2003)to a bulk sedimentδ13C
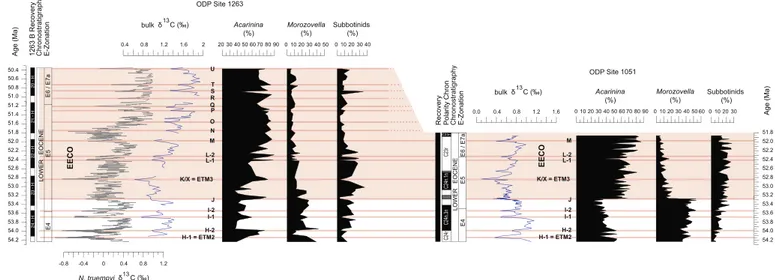
Fig. 3. Correlation of carbon isotope records spanning the early Eocene from several global sites (see Fig. 1 ). These are: Branch Stream (New Zealand, Slotnick et al., 2015 ), ODP Site 1051 (Blake Nose, Cramer et al., 2003; Luciani et al., 2016, in press ), Site 1258 (Demerara Rise, Kirtland-Turner et al., 2014 ), Site 1263 (Walvis Ridge, Lauretano et al., 2016 , this study), Site 1262 (Walvis Ridge, Zachos et al., 2010 ), DSDP Site 577 (Shatsky Rise, Cramer et al., 2003; Luciani et al., 2016 ), Contessa Road (central Italy, Coccioni et al., 2012 ) and Possagno (north-eastern Italy, Luciani et al., 2016 ). Where possible, magnetostratigraphy, lithology and planktic foraminiferal zonation are given. Zonal schemes are from Wade et al. (2011) as modi fi ed by Luciani and Giusberti (2014 ; see text) for Blake Nose, Walvis Ridge, Shatsky Rise, Possagno section and from Wade et al. (2011) for the Contessa CHW-CR. Records from Sites 577 and 1051 are in two colors: black ( Cramer et al., 2003 ), which ended at the start of the EECO, and orange/red for newer data ( Luciani et al., 2016 , unpublished) that extended the records through the EECO. Carbon isotope excursions (CIEs) are highlighted with pink lines and labelled following Lauretano et al. (2016) . Original labels used by di ff erent authors are shown in brackets. Dashed bands indicate events not consistently correlated. Correlation problems are mainly related to di ff erent resolution of δ 13 C records and sedimentation rates. The light pink shaded band de fi nes the Early Eocene Climatic Optimum (EECO) interval as denoted in Fig. 2 . Main planktic foraminiferal events are shown as light-blue triangles (bases), dark-blue triangles (bases rare) and red triangles (tops). M. form .= Morozovella formosa ; M. arag .= Morozovella aragonensis ; A. cune .= Acarinina cuneicamerata ; A. asp. = Acarinina aspensis ; M. sub. = Morozovella subbotinae ; As. pal. = Astrorotalia palmerae ; G. nutt. = Guembelitrioides nuttalli ; T. fron. = Turborotalia frontosa . Modi fi ed from Luciani et al. (unpublished). (For interpretation of the references to colour in this fi gure legend, the reader is referred to the web version of this article.)
The minimum value of ~ 0.6‰ at 275.22 rmcd corresponds to the K/X (or ETM3) event. We recognize below this horizon the Eocene Thermal Maximum 2 (ETM2 or H-1), H-2, I-1, I-2, and J events, and above this horizon the L to U events (Fig. 2). This template allows us to accurately identify the stratigraphic position of biotic events, even where core gaps exist in Hole 1263B, such as proximal to the ETM2, I-2, M, R and the U events.
Most of the documented CIEs at Site 1263 correspond to peaks in MS (Shipboard Scientific Party, 2004), although the magnitudes of peaks in MS are not proportional to the magnitudes of CIEs because some MS peaks correspond to ash horizons (Fig. 2). The O and T events, for ex-ample, have relatively small CIEs, but marked peaks in MS (> 60), whereas the J, M and L-1 events display low values in MS (< 30), despite relatively large CIEs.
3.2. Bulk oxygen isotope records
The bulk sediment oxygen isotopes at Hole 1263B (Fig. 2, Table S1) vary between−0.1‰ and −0.7‰, with an average value of −0.36‰. Oxygen isotope values show a slight and gradual decrease in values from the base of the investigated interval to the K/X event. Immediately above the K/X event, bulk sediment δ18O values increase by about
0.4‰. The δ18O values then oscillate around a mean value of ~−0.3‰
through the top of the investigated interval. Superimposed on these general trends are a series of negativeδ18O excursions that reach values
of ~−0.7‰. These appear to strictly correlate with the identified CIEs (Fig. 2).
Similar trends have been observed in other bulk δ18O profiles
(Possagno section,Luciani et al., 2016; Site 1258,Kirtland-Turner et al., 2014; Site 577,Luciani et al., 2016; Site 1051,Luciani et al., in press), although they have different absolute values. As noted below, planktic foraminifera at Site 1263 exhibit a“frosty” texture (sensuSexton et al., 2006). Moreover, discoasterids in the studied section commonly have calcite overgrowths (Shipboard Scientific Party, 2004). These ob-servations imply some degree of recrystallization in bulk sediment, which presumably occurred at or beneath the seafloor (e.g.,Pearson et al. 2001; Sexton et al. 2006; Pearson, 2012). Bulk sediment δ18O records are complicated as a proxy for temperature because they re-present mixtures of different components that fractionate18O di
ffer-ently (e.g., Reghellin et al., 2013). Moreover, diagenetic alteration impacts the complex original18O signal further, because temperatures on the seafloor and over the upper few hundred meters of seafloor are generally colder than near surface waters where most tests precipitated (Schrag et al., 1995; Pearson et al., 2001; Stap et al., 2010a; Kozdon et al., 2011).
Absolute temperature estimates made from the bulkδ18O record at
Site 1263 would be difficult to justify. Nevertheless, even though re-crystallization may have shifted ourδ18O values, the CIEs manifest in
ourδ18O data so that the main patterns remain. This can be explained
by a twofold mechanism. First, the CIEs represent hyperthermals, when surface water temperatures were significantly warmer than surrounding time intervals, or biological constituents with lower δ18O were
sig-nificantly more abundant than surrounding time intervals. Second, di-agenesis involving carbonate dissolution and recrystallization occurred at a very local scale (< 1 m) (Schlanger and Douglas, 1974; Matter et al., 1975; Arthur et al., 1984; Kroenke et al., 1991; Borre and Fabricus, 1998; Frank et al., 1999; Slotnick et al., 2015), so that the short-termδ18O anomalies remain.
3.3. Variations in dissolution and productivity proxies
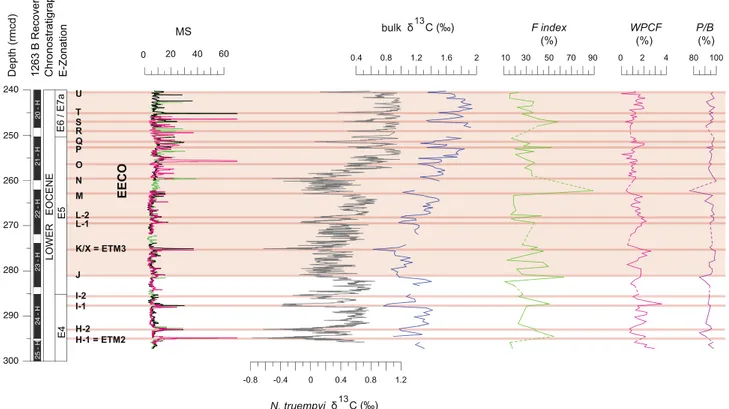
The F index record exhibits minimum values of ~ 10% and oscillates around a mean value of ~ 32% (Fig. 4, Table S2). Importantly, the major peaks in F index coincide with the prominent CIEs. In our record, the ETM2, I1, J, K/X, L, M, P and S events have, respectively, F index values of 54%, 52%, 63%, 45%, 44%, 90%, 51% and 58%. However,
the magnitudes of the CIEs and MS peaks are not proportional with the amplitudes of the F index peaks, in the latter case because the peaks are linked to ash layers (Shipboard Scientific Party, 2004).
The P/B index profile shows relatively constant values throughout the early Eocene, averaging ~ 97%. Minor reductions to 92% and 88% coincide with the J and the M events, respectively (Fig. 4, Table S2).
The WPCFfluctuates between ~0.02% and ~2.6%, varying around a mean value of ~ 1.4% (Fig. 4, Table S2). However, a modest decrease in mean WPCF occurs through the investigated interval, so that values move from ~ 1.6% in the interval below the paired L events to ~ 1.2% within the main phase of the EECO. High-frequency changes in the WPCF record do not correlate very well with the CIEs, although a de-crease of ~ 1% happens across the M event, which coincides with the highest F index.
3.4. Planktic foraminiferal biostratigraphy
Planktic foraminifera generally comprise < 5% of the total sedi-ment, consistent withZachos et al. (2004), but numerous and diverse specimens were extracted from all samples investigated. Although the tests show classic“frosty” preservation, sensuSexton et al. (2006), they are well preserved, allowing unambiguous identification at the species level. The main early Eocene planktic foraminiferal biohorizons, as defined by bases (B) or tops (T) of species in theWade et al. (2011) zonal scheme, can be identified at Site 1263 (Plate 1). However, there are some differences, as noted by Luciani and Giusberti (2014) and described below.
Base of Morozovella aragonensis: This datum, that identifies the E4/ E5 boundary (Wade et al., 2011), is found at 285.69 ± 0.45 rmcd, slightly above the I-2 event (Fig. 3) as in the Tethyan Contessa section (Coccioni et al., 2012). At ODP Site 1051, DSDP Site 577 and the Tethyan Possagno section, this horizon also lies above the I-2 event, although perhaps slightly higher (Lu and Keller, 1995; Luciani et al., 2016; unpublished). Some uncertainty may lie with the B of M. arago-nensis because of subtle differences between the identification of true M. aragonensis and its ancestor M. lensiformis, that could give rise to ap-parent diachronism (Pearson et al., 2006). We recognize here M. ara-gonensis from M. lensiformis by its truly plano-convex test, truncated-cone shape, and rounded peripheral outline (Plate 1). We noted that typical M. aragonensis mainly presents 5.5–6 chambers in the last whorl, according to what observed byLuciani and Giusberti (2014).
Base of Acarinina cuneicamerata: This datum, which is supposed to mark the E6/E7a boundary (Wade et al., 2011), is found at 256.32 ± 0.30 rmcd, just above the O CIE and below the T of M. subbotinae (Fig. 3). Thus, there is a stratigraphic problem, because the B of A. cuneicamerata should occur above the T of M. subbotinae according to theWade et al. (2011)zonal scheme and consistent with the record from the Contessa section (Coccioni et al., 2012). The data at Site 1263 confirms the record from the Possagno section and Atlantic Site 1051 (Luciani and Giusberti, 2014) where the B of A. cuneicamerata and the T of M. subbotinae also occur in reversed order. Conversely, at Site 1051 and at the Possagno section the B of A. cuneicamerata occurs earlier with respect to Site 1263 as it is recorded between the K/X and L events (at the CIE labelled as CIE6b) and just above the O event respectively (Fig. 3). Given the diachroneity of this bioevent,Luciani and Giusberti (2014)tentatively proposed the B of Astrorotalia (Planorotalites) pal-merae as an alternative marker for the E6/E7a boundary. However, A. palmerae is absent at Site 1263 and therefore we combine together Zones E6 and E7a. Thefirst specimens of A. cuneicamerata at Site 1263 are rare but typical specimens (Plate 1) and evenly distributed through adjacent samples.
Base of Guembelitrioides nuttalli: This datum, which should set the E7b/E8 boundary, somewhat above the base of the middle Eocene
(Wade et al., 2011; Molina et al., 2011), is found at
251.55 ± 0.29 rmcd and slightly above the Q CIE. Again, there is a stratigraphic issue at the studied section. However, the observation at
Site 1263 confirms the early first appearance of this species as docu-mented by Luciani and Giusberti (2014) for the Tethyan Possagno section. Luciani and Giusberti (2014)noticed that, at Possagno, the abundance of Guembelitroides nuttalli varied significantly, such that there is a Base of rare specimens (Br, < 1%) and a Base of common (Bc, ~ 4%) specimens, where the latter coincides with the base of Zone E8. The Br of G. nuttalli at Site 1263 is, however, seemingly at a sig-nificantly higher stratigraphic position than recorded at Possagno (Fig. 3) (Luciani and Giusberti, 2014). Guembelitroides nuttalli at Site 1263 are typical specimens (Plate 1) but very rare up to the top of the studied succession (Fig. 5).
Top of Morozovella subbotinae: This event, which marks the base of Zone E6 (Wade et al., 2011), occurs at 251.00 ± 0.27 rmcd and slightly above the Q CIE. At the Contessa section, this bioevent occurs within chron C23n.1n, and between the O and P events (Coccioni et al., 2012) similarly to the Possagno section. At Site 1051, the T of M. subbotinae was recorded in a significantly lower position, as it coincides with the L2 event, at the base of C23r (Luciani et al., 2016) (Fig. 3). At Site 577, the top of M. subbotinae occurs even earlier, in the middle of C24n (Lu and Keller, 1995), so the E5–E6 boundary was tentatively positioned at the lowest occurrence of Acarinina aspensis (Luciani et al., 2016), according to the original definition of Zone E5 (Berggren and Pearson, 2005).Luciani et al. (2016)emphasized the significant dia-chronism of this event. However, in absence of a revision of theWade et al. (2011) zonal scheme, the T of M. subbotinae is still the present marker for the base of Zone E6. At Site 1263, the specimens of this taxon are relatively small in thefinal interval of their occurrence. 3.5. Variations in planktic foraminiferal abundances
The early Eocene planktic foraminiferal assemblages display both long-term and transient changes across the investigated interval at Site 1263 (Fig. 5, Table S3). Major changes involve the mixed-layer dwelling warm-index acarininids and morozovellids (e.g., Boersma
et al., 1987; Pearson et al., 1993, 2006), which collectively represent the most abundant planktic foraminiferal taxa throughout. The most prominent change, which occurs between the J and K/X events, in-volves a strong and permanent reduction in morozovellid abundances from a mean value of ~ 23% in samples below ~ 278 rmcd to a mean value of ~ 9% in samples above (Fig. 5). Moreover, qualitative ob-servation regarding the Morozovella species distribution reveals that, in the pre-EECO interval, M. aequa and M. subbotinae were the dominant taxa, M. lensiformis and M. crater were relatively common, and M. for-mosa, M. gracilis and M. marginodentata were quite rare. Within the EECO, M. aragonensis and M. crater become the most common taxa along with moderate occurrences of M. aequa, M. formosa, and M. len-siformis. The species M. gracilis, M. marginodentata and M. subbotinae progressively decrease in abundance and disappear within the EECO. On the basis of these evidences, the reductions in abundance of M. aequa, M. subbotinae and secondarily of M. lensiformis and M. crater, mainly contributed to the morozovellid collapse, although a quantita-tive count for the Morozovella species is necessary to confirm this ob-servation. A rather different pattern has been recorded at the northern Atlantic Site 1051 where M. gracilis, M. lensiformis, M. marginodentata and M. subbotinae were dominant before the J event, and large reduc-tion in the abundance of these four species, which ultimately dis-appeared within the EECO, give rise to the major morozovellid collapse (Luciani et al., unpublished). This pattern is interesting because shows that the permanent morozovellid decline in abundance involved dif-ferently the Morozovella species at different sites.
Notably, the morozovellid test size appears reduced within the EECO at Site 1263 above the major drop in abundance. This is espe-cially evident in the > 250μm fraction for M. lensiformis, M. subbotinae, M. aequa and secondarily for M. gracilis and M. marginodentata. A de-crease in test size has also been recorded for M. lensiformis, M. mar-ginodentata and M. gracilis at the tropical Atlantic Site 1051 above their permanent decline in abundance (Luciani et al., unpublished).
In contrast to the morozovellid trend, the relative abundance and
Fig. 4. Early Eoceneδ13C, dissolution proxy and MS records at ODP Site 1263. Bulk sedimentδ13C from this study (blue), and benthic foraminiferal N. truempyiδ13C fromLauretano et al.
(2016)(grey). Dissolution proxy records: fragmentation index (F index), weight percent coarse fraction (WPCF), and planktic over benthic ratio (P/B). Other information is consistent withFig. 2. MS record fromShipboard Scientific Party (2004). (For interpretation of the references to colour in thisfigure legend, the reader is referred to the web version of this article.)
diversity of acarininids increases upward. Acarinina comprise ~ 53% of assemblages in the pre-EECO interval below the K/X event, but com-prise ~ 75% above this event. The species A. coalingensis and A. solda-doensis are the dominant taxa throughout. However, A. interposita, A. esnaensis and A. wilcoxensis are relatively common in the pre-EECO interval, whereas A. cuneicamerata, A. primitiva and A. quetra become more common in the upper part of the investigated interval.
In the studied interval at Site 1263, a long-term reduction in sub-botinid abundance (dominated by Subbotina with respect to Parasubbotina) happens across the EECO, whereby the mean value of their abundance in assemblages drops from ~ 16% to ~ 9%. Much of this change occurs above the paired L events, specifically around 266.63 rmcd (Fig. 5, Table S3).
The three dominant taxa also display high-frequency variations in abundance superimposed on long-term trends. At a basic level, short-term fluctuations in the abundance of Acarinina coincide with con-trasting abundance changes of Morozovella and subbotinids. This re-lationship is particularly evident across the CIEs, where acarininid abundances generally increase to comprise > 70% of the total assem-blage. Most prominent is the peak of ~ 90% acarininid abundance across the paired L events. Interestingly, abundances of morozovellids and subbotinids often recover rapidly above the CIEs (Fig. 5). Here, of
course, it should be recognized that the above changes in abundances reflect a closed-sum effect, where the drop in one genus necessarily relates to a rise in one or more other genera. However, the acarininid dominance across the CIEs appears as a real response to the hy-perthermals in the mixed layer, as documented also in several Tethyan successions (see discussion inSection 3.6).
A major and permanent drop in the chiloguembelinid group (dominated by Chiloguembelina with respect to Zeauvigerina) occurs at the start of the EECO (Fig. 5, Table S3). Mean abundances of this group are ~ 10% in the pre-EECO interval but approach zero above the K/X event. The genera Igorina, Planorotalites, Globanomalina, Catapsydrax and the species Guembelitriodes nuttalli are very rare in the assemblages throughout the early Eocene, and never exceed 5% in terms of total planktonic foraminifera abundance. These forms do not display sig-nificant variations within the investigated interval.
3.6. The foraminiferal record across the EECO at Site 1263
3.6.1. Low carbonate dissolution and decreased planktic foraminiferal productivity
The minor long-term variability displayed by the three dissolution proxies (Fig. 4) suggests that broad features in the evolution of Plate 1. Scanning electron micrograph (SEM) images of the zonal markers from the early Eocene interval here analyzed at Site 1263. 1–3: Morozovella aragonensis (Nuttal, 1930); 1 sample 251.28 rmcd (Hole 1263B, 21H-1, 90–92 cm), 2–4 sample 251.01 rmcd (Hole 1263B, 21H-1, 60–62 cm). 4–5: Morozovella subbotinae (Morozova, 1939), 4 sample 251.01 rmcd (Hole 1263B, 21H-1, 60–62 cm), 5 sample 258.09 rmcd (Hole 1263B, 21H-6, 30–32 cm). 6–8: Acarinina cuneicamerata (Blow, 1979); 6–7 sample 255.42 rmcd (Hole 1263B, 21H-4, 60–62 cm), 8 sample 251.01 rmcd (Hole 1263B, 21H-1, 60–62 cm). 9–14: Guembelitrioides nuttalli (Hamilton, 1953); 9 sample 251.28 rmcd (Hole 1263B, 21H-1, 90–92 cm), 10 sample 251.01 rmcd (Hole 1263B, 21H-1, 60–62 cm), 11 sample 242.61 rmcd (Hole 1263B, 20H-3, 100–102 cm), 12–13 sample 251.01 rmcd (Hole 1263B, 21H-1, 60–62 cm), 14 sample 242.61 rmcd (Hole 1263B, 20H-3, 100–102 cm). Scale bars: 100 μm.
foraminiferal assemblages represent genuine biotic trends rather than selective dissolution. The F-index rises across some of CIEs, although these increases do not proportionally correspond to CIE intensity. In fact, the highest F-index value corresponds with the relatively modest M CIE (Fig. 4). A small decrease in the P/B index across the M CIE may denote that this horizon experienced some dissolution. Variations in the abundances of planktic foraminiferal genera at Site 1263 do not clearly correspond to dissolution indices. Thisfinding is consistent with loca-tions where CIEs have with low F-index and major increases of Acarinina (Luciani et al., 2016). For example, at the Tethyan Terche section in northern Italy,D'Onofrio et al. (2014, 2016)noted pronounced spikes in Acarinina abundance at the ETM2, H1 and I-2 events where planktic foraminiferal assemblages do not seem biased by dissolution. We sug-gest that carbonate dissolution at or beneath the seafloor at Site 1263 may have partly amplified changes in planktic foraminiferal assem-blages, but that the changes mainly reflect variations in the rain of tests from surface water. This makes sense, given the shallow setting of Site 1263 during the early Eocene and the limited burial depth since.
Given the low impact of dissolution inferred by the F-index and P/B index, the long-term decease in WPCF (Fig. 4) can be interpreted as a signal of decreased planktic foraminiferal productivity, relative to cal-careous nannoplankton productivity. Here we note that the total car-bonate content averages about 95%, the WPCF averages about 1.4%, and shipboard smear slides show that calcareous nannofossils dominate the bulk sediment (typically > 90%). This implies that the vast ma-jority (> 90%) of the total sediment and total carbonate reaching the seafloor consisted of calcareous nannofossils. Thus, a 50% change in the flux of calcareous nannofossils to the seafloor would significantly change the sedimentation rate and moderately affect the carbonate content, whereas a 50% change in theflux of foraminiferal tests to the seafloor would mostly affect the WPCF.
The overall long-term sedimentation rate decreased from ~ 20 m/ Myr to ~ 10 m/Myr at about 52 ± 1 Ma (Zachos et al., 2004). The simplest explanation for the above observations is that carbonatefluxes to the seafloor at the location of Site 1263 decreased within the EECO, but this was more pronounced (on a percentage basis) for the plank-tonic foraminifera. The long-term reduction in foraminifera supply may
be linked to the drop in Morozovella abundance, since the decline in subbotinids was somewhat balanced by an increase in the abundance of Subbotina senni (Fig. 5). A similar decrease in planktic foraminiferal productivity has been suggested for the Tethyan Possagno section during the EECO and also related to the decrease in morozovellid abundance (Luciani et al., 2016).
3.6.2. The permanent Morozovella and Acarinina switch in abundances at the EECO onset
Our records provide new insight on the impact of the EECO upon planktic foraminiferal genera that characterized early Paleogene as-semblages. The integrated biotic and δ13C stratigraphy allows us to relate the planktic foraminiferal assemblage fluctuations with major carbon-cycle perturbations through the early Eocene. Such correlation reveals that the remarkable planktic foraminiferal changes observed at Site 1263 are strongly related to the EECO and, at higher frequency, with the CIEs that preceded and continued to occur within the EECO (Fig. 5).
Comparisons to other locations where detailed foraminifera as-semblage information and δ13C records exist across the EECO
(Frontalini et al., 2016; Luciani et al., 2016) shows some similarities and some differences. Specifically, we document a permanent drop in Morozovella abundance at Site 1263 (> 50%) slightly above the J event. We confirm, therefore, that the morozovellid decline recorded at low-latitude locations in the northern hemisphere (Frontalini et al., 2016; Luciani et al., 2016) can be found as well at a temperate latitude site in the southern hemisphere. However, the switch between the two dominant surface-dwellers, Acarinina and Morozovella, appears more gradual at Site 1263 and slightly delayed with respect to several other locations, where it occurs precisely at the J event (Luciani et al., 2016, in press). On the basis of the age model provided byLauretano et al. (2016)for the Site 1263, we estimate the time of the decline began at ~ 53.05 Ma, or ~ 165 kyr after the J event (Fig. 6,Table 1). The pre-EECO mean relative abundance of the Morozovella at Site 1263 is lower (~ 23%,Fig. 5) than that recorded at the tropical Atlantic Site 1051 (~ 40%) and the tropical Pacific Site 577 (~30%) (Luciani et al., 2016). The lower morozovellid abundance at Site 1263 is probably related to Fig. 5. Relative abundances of planktic foraminiferal genera across the early Eocene interval at ODP Site 1263. Subbotinids include the genera Subbotina (dominant) and Parasubbotina
that are known as having similar depth habitat (e.g.,Pearson et al. 2006, and references therein). Chiloguembelinids include the genera Chiloguembelina (dominant) and Zeauvigerina (very
rare). Note: (1) the major switch in Morozovella abundance slightly above the J event; (2) the decrease in subbotinids above the paired L events; (3) the virtual disappearance of
mid-paleolatitude and relatively lower surface water temperature, given the surmised affinity for warm water of this genus (Boersma et al., 1987; Pearson et al., 2006and reference therein). The slightly delayed drop in morozovellid abundance at Site 1263 demonstrates that during the EECO, when global temperatures peaked and other features changed in surface waters, unfavourable environmental conditions for morozovellids occurred at lower latitudesfirst.
3.6.3. Decline in chiloguembelinids and subbotinids and ecological niche reduction
The diverse planktic foraminiferal assemblages at Site 1263 include also relatively common occurrences of chiloguembelinids in the lower portion of the interval investigated. This supports the existence of a stratified water column in the pre-EECO interval with diverse ecological niches occupied. (Figs. 5, 7A). Chiloguembelinids decreased from ~ 10% of total foraminifera assemblages to become virtually and per-manently absent above the K/X event. Multiple possible explanations for the chiloguembelinid disappearance can be forwarded. A possible interpretation involves the ecological behaviour of this group. Many Cenozoic biserial planktic foraminifera record light δ13C values in
conjunction with heavyδ18O values compared to non-biserial surface
dwelling planktic foraminifera (e.g.,Boersma and Premoli Silva, 1989). This has led to the hypothesis that biserial planktic foraminifera were low‑oxygen tolerant, meso- to eutrophic thermocline dwellers thriving in upwelling areas or were revealing the presence of a well-developed oxygen minimum zone (OMZ; Boersma et al., 1987; Boersma and Premoli Silva, 1989). These views were commonly accepted and adopted in paleoceanographic interpretations (e.g.,Hallock et al., 1991; Luciani et al. 2007, 2010). The virtual chiloguembelinid disappearance within the EECO could therefore suggest a weakening of the OMZ (Fig. 7B), even though recent stable isotope analyses across the PETM suggest a higher than OMZ habitat within the lower mixed layer habitat for Chiloguembelina wilcoxensis and Zeauvigerina (D'haenens et al., 2012). Other analyses on Chiloguembelina cubensis from upper Eocene and Oligocene also indicate a surface or lower mixed layer (Poore and Matthews, 1984; Barrera and Huber, 1991, 1993; Zachos et al., 1992). New stable isotope data on early Eocene chiloguembelinids, yet absent, will help to clarify the true habitat preference of this group during this time interval.
Another possible explanation is that intermediate water tempera-tures also rose significantly during the EECO and conditions may have become too warm for this genus. A reduction in the thermocline-dwelling cold-index subbotinids (e.g., Boersma et al., 1987; Pearson et al., 1993, 2006), occurring above the paired L events, appears in line with the notion of thermocline warming at the EECO. It is unlikely that an increase in the relative abundance of Subbotina senni, whichfirst appeared at the K/X event, counter-balanced the decrease in sub-botinids in terms of ecological replacement, because the former taxon occupied a different habitat (Pearson et al., 1993; Pearson et al., 2006 and references therein). It is instead possible that this species, con-sidered as a mixed-layer form that sank to middle mixed-layer or deeper depths during gametogenesis (above references), might have partly occupied the ecological niches released by morozovellids and/or chi-loguembelinids.
The chiloguembelinids and subbotinids decline may have been a consequence of destratification of the upper water-column, whereby intermediate waters warmed relatively more than the surface waters. Interestingly, John et al. (2013, 2014), analyzing stable isotopes of lower and middle Eocene planktic foraminifera from Tanzania and Gulf of Mexico, conclude that there was a much greater temperature at
Fig. 6. Early Eoceneδ13C and primary planktic foraminiferal relative abundances from ODP sites 1263 and 1051 plotted versus Age (Ma). Age model is from option 2c ofLauretano et al.
(2016)which is based on the tuning of two cycles of the long-eccentricity extracted from the orbital solution La2010d (Laskar et al. 2011). Theδ13C bulk sediment record at Site 1263 is
from this study (blue) and benthic foraminiferal N. truempyi record comes fromLauretano et al. (2016)(grey). Bulk sedimentδ13C composition and planktic foraminiferal abundances
from Site 1051 are from Luciani et al. (unpublished). Subbotinids include for both the sites the genera Subbotina (dominant) and Parasubbotina (very rare) that are known as having similar
depth habitat (e.g.,Pearson et al., 2006and references therein). Other information is consistent withFig. 2. Note the good correspondence between the two sites of the E4/E5 boundary,
that is the B of Morozovella aragonensis and the marked diachronous E6/E7a boundary, that is the T of Morozovella subbotinae. Note also the slightly delayed decline of Morozovella
abundance at Site 1263. (For interpretation of the references to colour in thisfigure legend, the reader is referred to the web version of this article.)
Table 1
Depth tie points between ODP Sites 1263B to 1051A and their relative ages according to
the age model option 2c ofLauretano et al. (2016)which is based on the tuning of two
long-eccentricity cycles extracted from the orbital solution La2010d (Laskar et al., 2011).
Tie points coincide with the main negative carbon isotope excursions except for the basal
and top points that correspond to positiveδ13C shifts.
CIE Site 1263 B (rmcd) Site 1051 A (mbsf) Age (Kyr)
Positiveδ13C shift 261.05 390.60 51,866 M 262.90 396.10 51,988 L-2 268.20 406.70 52,335 L-1 269.08 409.80 52,392 K/X 275.08 417.30 52,831 J 280.80 428.34 53,270 I-2 285.22 439.08 53,538 I-1 287.72 443.13 53,685 H-2 292.92 450.67 53,986 H-1/ETM2 294.82 452.73 54,139 Positiveδ13C shift 295.76 454.18 54,228
depths below the mixed layer. A further factor that may have inhibited the sub-surface taxa is related to the fact that elevated ocean tem-peratures enhanced the rate of bacterial respiration and remineraliza-tion significantly resulting in more efficient recycling of carbon and nutrients higher in the water column (John et al., 2013, 2014; Pearson and Coxall, 2014). This is consistent with the carbon isotope gradients that were steeper and larger through the upper thermocline during the early and middle Eocene than in the modern ocean (John et al., 2013, 2014). A more rapid and shallower bacterial remineralization would have contributed to an upward shift in the OMZ while food supply at depth was restricted which consequent cut out of the deeper dwelling niches in the lower thermocline (above references). Both subbotinids and chiloguembelinids, which are recognized as eutrophic taxa, thus may have suffered of reduced food supply besides the warmer tem-peratures (Fig. 7C). In this view, the new trophic and warmer state of the water column at the EECO damagingly prevailed on the presumed capacity to adapt to low‑oxygen condition of chiloguembelinids and affected their abundance.
In conclusion, a contraction of the ecological niches may have oc-curred at Site 1263 in the sub-surface water and thermocline mainly driven by temperature increase.
3.6.4. High-frequency planktic foraminiferal variations during prominent CIEs
Short-term fluctuations in the relative abundances of the most common genera– Acarinina, Morozovella and Subbotina – coincide with the main CIEs (Fig. 5) and display anti-phase trends. Specifically, acarininids generally increase across the CIEs whereas morozovellids and subbotinids usually decrease and then suddenly recover above the events (Fig. 5). A different behaviour between the surface-dwelling acarininids and the thermocline-dwelling subbotinids might be ex-pected. The opposing behaviour of Morozovella and Acarinina, which are known to share similar ecological affinities (e.g.,Boersma et al., 1987; Pearson et al., 1993, 2006and references therein), is intriguing. The striking dominance of Acarinina over Morozovella has been docu-mented previously for the known early Eocene hyperthermals (PETM, ETM2/H-1 and K/X events) at several low-latitude successions from the Tethyan domain (Arenillas et al., 1999; Molina et al., 1999; Ernst et al., 2006; Guasti and Speijer, 2007; Luciani et al., 2007; Agnini et al., 2009; D'Onofrio et al., 2016; Luciani et al., 2016). This signal has been related to a transient rise in global temperature coupled with an increase in surface-water nutrient availability (above references). In turn, the latter has been attributed to an accelerated hydrological cycle and enhanced riverine discharge to continental margin settings during these events (e.g.,Schmitz and Pujalte, 2007; Giusberti et al., 2007; Schulte et al., 2011; Slotnick et al., 2012, 2015; Pujalte et al., 2015). At Site 1263, well away from the continental margin, there is no evidence for greater terrigenous input or increased eutrophy. Our data highlight, therefore, that the anti-phase variation in Acarinina and Morozovella abundances is not restricted to the Tethyan domain or continental margin settings. Seemingly, it derives from a competition within the same mixed-layer, where acarininids tolerate the atypical conditions better (e.g.,Luciani et al., 2007; Agnini et al., 2009; D'Onofrio et al., 2016; Luciani et al., 2016).
3.6.4.1. Causes of the permanent Morozovella decline. The triggering mechanism(s) of the permanent and widespread Morozovella decline at the EECO onset remain unknown. Increasingly, and as noted above, evidence suggests that competition between Morozovella and Acarinina played a significant role. We briefly summarize some hypotheses below. The loss of algal photosymbionts has been thought to represent a potential mechanism to explain the rapid morozovellid decline at the start of the EECO (Luciani et al., 2016). This is because endosymbionts play an important role in certain planktic foraminifera, including cal-cification, longevity and growth, which allow the host to succeed in an oligotrophic environment (e.g.,Bé, 1982; Bé et al., 1982; Hemleben Fig. 7. Cartoons illustrating environmental changes across the EECO at Site 1263 in the
upper water column as interpreted according to our record of changes in planktic for-aminiferal assemblages. (A) Pre-EECO environment showing a well-stratified water column with morozovellids, chiloguembelinids and subbotinids still relatively abundant, stable food supply at depth and a relatively deep OMZ below the thermocline. (B) Basal EECO scenario showing increased acarininid and reduced subbotinid abundance. This may imply weakened water-column stratification related to enhanced warming in the thermocline. The virtual absence of chiloguembelinids could indicate weakening of the
OMZ, according to the hypothesis that this group was low‑oxygen tolerant (e.g.,Boersma
et al., 1987; Boersma and Premoli Silva, 1989). The possible causes for morozovellid decrease in abundance are discussed in the text. (C) Another option for the basal EECO scenario where contraction of the sub-surface and deeper dwelling niches of the eutrophic subbotinids and chiloguemeblinids was triggered by rapid and shallower bacterial re-mineralization due to intense warming causing an upward shift in the OMZ and reduced
et al., 1989). Bleaching events have been suggested for large species of Acarinina and the genus Morozovelloides.
(morphologically and ecologically comparable with Morozovella) during the middle Eocene (Wade et al., 2008; Edgar et al., 2012).
A number of stressors that occurred during the long-lasting EECO may have caused the loss of endosymbionts (i.e., bleaching). These include prolonged and extreme warmth (Zachos et al., 2008; Bijl et al., 2009; Huber and Caballero, 2011; Hollis et al., 2012; Hönisch et al., 2012; Pross et al., 2012; Inglis et al., 2015) or possibly high pCO2and
low surface-water pH (Pearson and Palmer, 2000; Fletcher et al., 2008; Lowenstein and Demicco, 2006; Zeebe et al., 2009; Smith et al., 2010; Hyland and Sheldon, 2013; Anagnostou et al., 2016). A bleaching hy-pothesis has been tested recently at the northwest Atlantic Site 1051 (Fig. 1) by measuring stable isotopes of different size fractions of multiple planktic foraminiferal genera and species (Luciani et al., un-published). The results demonstrate that morozovellids indeed reduced their algal-symbiont relationships at the beginning of the EECO, but this was a transitory effect. Moreover, evidence for bleaching also occurred in the acarininids, but their relative abundance increased. Permanent loss of photosymbionts does not seem to be the main cause of the de-finitive morozovellid decline. Independent of bleaching, persistent changes in mixed-layer conditions, such as high temperature and dif-ferent chemistry, may have contributed to an extended unfavourable habitat for morozovellid life and calcification. Interestingly, the decline in abundance is associated, for the morozovellids that mainly con-tributed to the decrease in abundance, with a test size reduction both at Site 1263 and Site 1051 (Luciani et al., unpublished). Several potential stressors may explain the reduced size and they may include, beside algal photosymbiont inhibition, changes in temperature, primary pro-duction, salinity and decrease in oxygen levels (e.g.,Schmidt et al., 2004b, 2006). The concentrations of dissolved oxygen decreases in warm waters while protists require more life resources, such as oxygen and nutrients, because their metabolism accelerates when temperature increases (e.g., O'Connor et al., 2009). Thus, a strategy to optimize resource uptake is to enlarge surface area/volume ratio by reducing the cell mass and therefore the test-size (e.g.,Atkinson et al., 2003). The species M. lensiformis, M. aequa, M. subbotinae and M. marginodentata may have reacted with morphological changes through their ecophe-notypic plasticity to face the critical environmental imposed conditions, resulting in the observed test-size reduction.
An alternative explanation for the morozovellid decline includes competition with other microfossil groups (Luciani et al., 2016) or strengthened competition between Morozovella and Acarinina. As con-firmed by the data at Site 1263, the anti-phase variations in Acarinina and Morozovella abundances are now recorded in different settings during the early Eocene hyperthermal events, as well as within and across the EECO. This strongly suggests competition between these two genera in the mixed-layer habitat during conditions of extreme warmth. Interestingly, most Morozovella species usually exhibit less extreme high δ13
C and lowδ18O values with respect to most acarininids. This feature has been found in examinations of Late Paleocene and Eocene for-aminiferal assemblages (e.g.,Shackleton et al., 1985; Boersma et al., 1987; Pearson et al., 2001; Quillévéré et al., 2001; John et al. 2013, 2014; Luciani et al., unpublished). Most morozovellids may have thus lived slightly deeper in the mixed-layer habitat or they may have sunk there at gametogenesis as suggests the occurrence of a late stage crust in the test and by the isotope values. These features are especially evident in M. aragonensis, M. lensiformis (John et al., 2013, 2014) and possibly in M. aequa and M. subbotinae (Luciani et al., unpublished). This is particular interesting because M. aequa, M. subbotinae and M. lensiformis appears to be as the species that largely contributed to the morozovellid decline at Site 1263. A more intense warming in the middle-lower mixed-layer with respect to the upper mixed-layer may have affected morozovellid reproduction at depth and reduced their abundance. This effect, transient during the relatively short-term hyperthermals, may have turned out to be detrimental during the prolonged extreme
warming condition at the EECO. We can hypothesize therefore that the persisting EECO perturbation may have exceeded the optimal condi-tions over a sufficient duration of time to allow morozovellid pro-liferation and thus permitting acarininids to dominate the mixed-layer habitat.
4. Summary and conclusions
Our multiproxy records at Site 1263 provide new insights on planktic foraminiferal changes at the basal EECO from a temperate southern hemisphere setting. Quantitative analyses of planktic for-aminiferal assemblages, carbon isotope based stratigraphy and dis-solution proxies allow us to present new views on both long-term and short-term planktic foraminiferalfluctuations during the early Eocene. The main results can be summarized as follows.
(1) A distinct decline in the abundance of Morozovella and rise in the abundance of Acarinina happens at the beginning of the EECO, similar to as recorded at locations across low-latitudes in the northern hemi-sphere (Luciani et al., 2016; unpublished). This fundamental turnover in the dominant planktic foraminiferal genera was truly widely geo-graphically widespread.
(2) The Morozovella-Acarinina switch is somewhat complicated in detail in terms of abundances and timing. Before the start of the EECO, mean abundances of Morozovella at Site 1263 are lower than those re-corded at the tropical northern hemisphere sites (Luciani et al., 2016). Given the affinity of morozovellids to warm surface waters, this prob-ably reflects paleo-latitude. The morozovellid decline at Site 1263 is also more gradual and delayed by ~ 165 kyr suggesting that un-favourable environmental conditions for morozovellids at the start of the EECO, such as sustained passage of a temperature threshold or other changes in surface waters, occurred at lower latitudesfirst.
(3) Three proxies for carbonate dissolution indicate that early Eocene planktic foraminiferal assemblages at Site 1263 are marginally affected by selective dissolution. Rather, the assemblage changes should mostly be interpreted in terms of changes in the mixed-layer. On this basis, we interpret the long-term decrease in WPCF values as re-lating to a reduction of planktic foraminiferal productivity across the EECO, which likely was associated with the decline in morozovellid abundance. Notably, the significant and permanent modifications to foraminiferal assemblages across the long-lasting EECO contrast to ephemeral changes during the hyperthermals earlier in the Eocene.
(4) The triggering mechanism for the striking planktic foraminiferal turnover remains elusive, because both Morozovella and Acarinina ex-isted in the mixed-layer. The two genera may have had biological dif-ferences in their tolerance to temperature and ocean chemistry, such as pH. Reproduction of most morozovellids, that sank slightly deeper in the mixed-layer differently from most acarininids, may have hindered by warmer temperatures. Our data showing anti-phase variations in abundances during early Paleogene hyperthermals before the EECO strongly suggest that there was competition between Morozovella and Acarinina. In any case, and unlike the early Eocene hyperthermal events, the prolonged EECO perturbation may have exceeded optimal conditions for morozovellids, such that acarininids dominated surface-water habitats afterward.
(5) Along with the changes in the dominant planktic foraminiferal genera, changes occur in other, minor genera. There is a virtual dis-appearance of the biserial chiloguembelinids across the EECO, and a reduction in the abundance of the subbotinids. As these genera are linked to the sub-surface waters and thermocline, we interpret the en-vironmental changes across the EECO as impacting the entire upper water-column, and producing contraction of ecological niches. Acknowledgments
Data supporting this paper are available as in Tables S1–S3 in the supplementary information. Funding for this research was provided for