ScienceDirect
Available online at www.sciencedirect.com
Transportation Research Procedia 31 (2018) 108–120
2352-1465 2018 The Authors. Published by Elsevier Ltd.
This is an open access article under the CC BY-NC-ND license (https://creativecommons.org/licenses/by-nc-nd/4.0/) Selection and peer-review under responsibility of the Association for European Transport.
10.1016/j.trpro.2018.09.050
www.elsevier.com/locate/procedia
10.1016/j.trpro.2018.09.050 2352-1465
© 2018 The Authors. Published by Elsevier Ltd.
This is an open access article under the CC BY-NC-ND license (https://creativecommons.org/licenses/by-nc-nd/4.0/) Selection and peer-review under responsibility of the Association for European Transport.
ScienceDirect
Transportation Research Procedia 00 (2016) 000–000www.elsevier.com/locate/procedia
2214-241X© 2015 The Authors. Published by Elsevier B.V.
Selection and peer-review under responsibility of Association for European Transport.
45
thEuropean Transport Conference 2017, ETC 2017
AGW for efficient freight transport in container yard:
models and costs
Domenico Gattuso
a,, Gian Carla Cassone
aaMediterranea University, Engineering Department of Information Infrastructure and Sustainable Energy (DIIES), Reggio Calabria, Italy
Abstract
Different modes of transport are frequently used to transfer goods from origin to destination, especially on medium-long distances, in relation to the network supply, the available services, the costs. The transfer from one carrier to another, in an interchange node such as a port, a rail station, a logistics terminal, often implicates an increase of monetary and temporal costs, connected to material and immaterial operations. The principal aim is to minimize the overall cost of transport, but the freight interchange node can represent critical steps in logistics chain and for this reason much attention is now committed to actions to make efficient the functional organization of the terminal. In the last years an increasing interest is directed to the use of vehicles technologically advanced with automation of functions. The paper focuses on a particular technology, conceived recently, otherwise an intelligent rail wagon called AGW (Automated Guided Wagon) for handling of containers in a port.
The use of intelligent system AGW as handling unit of containers in the yard, would allow the overcoming of diseconomies of scale and the reduction of the handling times and costs through a flexible management in relation to the characteristics of the transport supply and demand, the latter subject to a high variability. In the paper, after a brief description of the AGW technology and the advantages connected to the use of this handling system in a freight interchange node, the attention is focused on a comparative analysis between the handling system now operating in the container port (RTG, Straddle Carrier, AVG, etc.) and the system that involves the use of AGW. This analysis is made on the operational characteristics of the different handling systems, through the use of: functional schemes, with the aim to carry out evaluations related to the spatial, organizational and relational structure of container yard equipped with different handling unit; network models (graphical representation of links and paths; basic cost parameters) for the schematization and simulation of container handling in the yard; cost models for quantitative evaluation of monetary and temporal impacts, that derive from the use of different handling unit in the yard.
© 2015 The Authors. Published by Elsevier B.V.
Selection and peer-review under responsibility of Association for European Transport. Keywords:container handling system, Automated Guided Wagon, Comparative Cost analysis
Corresponding author:
E-mail address: [email protected]
2 First Author name/ Transportation Research Procedia00 (2016) 000–000
1. Introduction
Technological processes have favored the automation of many functions in the field of rail transport. The general interest is to reduce operative management costs (less personnel components), as well as to increase safety and reliability levels. In some cases, for the reserved and protected railway, there are driverless systems, autonomous metro lines in the world. Computers have replaced manpower and often the performance has significantly improved. The automatic drive of the trains is more difficult to implement because the integral protection of the railways is not easy. In metro lines the railway has a track completely free of external influences, generally in tunnels and viaducts; the system is simplified and the driving action only takes into account the interaction between the vehicles on line and the diagrams of the motion mechanisms between the different phases (starting, regime, slowing and braking, stop in the station). For a vehicle moving in an open environmental context, such as an ordinary train, things get more complicated; the vehicle must interact with different stationary or moving objects, and it must be able to recognize them and adapt its behavior. Some research results, in particular in the rail freight industry and in computer science, are very promising from the technological and economic feasibility point of view. Some of them have been carried out in Germany: an experimental freight train was developed and tested by the DB in cooperation with some Transport Industries and research Units. It was tested in 1994. In 2003, Siemens introduced the CargoMover Siemens, 2002; Rijsenbrij et alii, 2006), designed for local and regional freight transport, which can reach up to 150 km/h with a top speed of 90 km/h. The vehicle was controlled by the central computer and directed by wireless communication. In 2013, a project named FlexCargoRail (Savelsberg, 2008) was concluded. However, in some contexts such as modal interchange nodes, highly-automated rail handling may be an opportunity to explore.
In the literature sector, the analysis of handling means used in ports, is carried out by distinguishing between two macro-categories: the cranes and the horizontal transport means (Steenken et alii, 2004). Concerning cranes, different types are operative in container terminals: the quay (or gantry) cranes for loading and unloading ships and the cranes applied to stacks (RMG-Rail Mounted Gantry crane, RTG – Rubber Tired Gantry crane, OBC – Overhead Bridge Cranes). Instead, the second category of means is employed for the horizontal transport both for the ship-to-shore transportation and the landside operation.
In this paper the focus is on horizontal transport means. In general, the study of handling vehicles is dealt with from two different points of view. Some authors focus on the analysis of the technological features of the means, while others focus on operational performance. For example Ioannou et alii, in several contributions (2000, 2001, 2002), provides a detailed overview of current state of the art handling technologies for terminal operations, with specific reference to automated means like AGVs – Automated Guided Vehicles. Instead many studies (Khoshnevis et alii, 2000; Asef Vazinri et alii, 2003; Zhu et alii; 2010; van Gils et alii, 2013), propose performance analysis through simulation approaches. Comparisons between different types of container terminals, based on specific equipments, are provided and the effectiveness of automated systems is compared with performance of current conventional systems by simulation experiments.
In the simulation studies the reference parameters are often design parameters such as the number of handling means. There were no significant contributions in terms of handling costs and times that are the subject of this paper
This paper offers a comparative analysis of various experimented container handling systems in an interchange node, as well as innovative rail technology (AGW – Automated Guided Wagon). Some handling technologies are illustrated, including common vehicles (Straddle Carrier, Fork Lift, Reach Stacker, Transtainer, Multi-trailer Train) and some of the latest types of automated vehicles. It explains the significance of handling vehicle operations in intermodal transport competitiveness, with rail transport replacing road transport. The AGW is presented, highlighting its technological features and performance, as well as its potentialities for reducing modal transfer costs.
The paper focuses, therefore, a simulation methodological approach, based on transportation models applied to the intermodal sites, to valuate times and costs to move a container between different port areas. Finally, the results of the analysis are discussed, concerning container transfer from maritime quay to train, and applying different handling technologies.
Domenico Gattuso et al. / Transportation Research Procedia 31 (2018) 108–120 109
ScienceDirect
Transportation Research Procedia 00 (2016) 000–000
www.elsevier.com/locate/procedia
2214-241X© 2015 The Authors. Published by Elsevier B.V.
Selection and peer-review under responsibility of Association for European Transport.
45
thEuropean Transport Conference 2017, ETC 2017
AGW for efficient freight transport in container yard:
models and costs
Domenico Gattuso
a,, Gian Carla Cassone
aaMediterranea University, Engineering Department of Information Infrastructure and Sustainable Energy (DIIES), Reggio Calabria, Italy
Abstract
Different modes of transport are frequently used to transfer goods from origin to destination, especially on medium-long distances, in relation to the network supply, the available services, the costs. The transfer from one carrier to another, in an interchange node such as a port, a rail station, a logistics terminal, often implicates an increase of monetary and temporal costs, connected to material and immaterial operations. The principal aim is to minimize the overall cost of transport, but the freight interchange node can represent critical steps in logistics chain and for this reason much attention is now committed to actions to make efficient the functional organization of the terminal. In the last years an increasing interest is directed to the use of vehicles technologically advanced with automation of functions. The paper focuses on a particular technology, conceived recently, otherwise an intelligent rail wagon called AGW (Automated Guided Wagon) for handling of containers in a port.
The use of intelligent system AGW as handling unit of containers in the yard, would allow the overcoming of diseconomies of scale and the reduction of the handling times and costs through a flexible management in relation to the characteristics of the transport supply and demand, the latter subject to a high variability. In the paper, after a brief description of the AGW technology and the advantages connected to the use of this handling system in a freight interchange node, the attention is focused on a comparative analysis between the handling system now operating in the container port (RTG, Straddle Carrier, AVG, etc.) and the system that involves the use of AGW. This analysis is made on the operational characteristics of the different handling systems, through the use of: functional schemes, with the aim to carry out evaluations related to the spatial, organizational and relational structure of container yard equipped with different handling unit; network models (graphical representation of links and paths; basic cost parameters) for the schematization and simulation of container handling in the yard; cost models for quantitative evaluation of monetary and temporal impacts, that derive from the use of different handling unit in the yard.
© 2015 The Authors. Published by Elsevier B.V.
Selection and peer-review under responsibility of Association for European Transport. Keywords:container handling system, Automated Guided Wagon, Comparative Cost analysis
Corresponding author:
E-mail address: [email protected]
ScienceDirect
Transportation Research Procedia 00 (2016) 000–000www.elsevier.com/locate/procedia
2214-241X© 2015 The Authors. Published by Elsevier B.V.
Selection and peer-review under responsibility of Association for European Transport.
45
thEuropean Transport Conference 2017, ETC 2017
AGW for efficient freight transport in container yard:
models and costs
Domenico Gattuso
a,, Gian Carla Cassone
aaMediterranea University, Engineering Department of Information Infrastructure and Sustainable Energy (DIIES), Reggio Calabria, Italy
Abstract
Different modes of transport are frequently used to transfer goods from origin to destination, especially on medium-long distances, in relation to the network supply, the available services, the costs. The transfer from one carrier to another, in an interchange node such as a port, a rail station, a logistics terminal, often implicates an increase of monetary and temporal costs, connected to material and immaterial operations. The principal aim is to minimize the overall cost of transport, but the freight interchange node can represent critical steps in logistics chain and for this reason much attention is now committed to actions to make efficient the functional organization of the terminal. In the last years an increasing interest is directed to the use of vehicles technologically advanced with automation of functions. The paper focuses on a particular technology, conceived recently, otherwise an intelligent rail wagon called AGW (Automated Guided Wagon) for handling of containers in a port.
The use of intelligent system AGW as handling unit of containers in the yard, would allow the overcoming of diseconomies of scale and the reduction of the handling times and costs through a flexible management in relation to the characteristics of the transport supply and demand, the latter subject to a high variability. In the paper, after a brief description of the AGW technology and the advantages connected to the use of this handling system in a freight interchange node, the attention is focused on a comparative analysis between the handling system now operating in the container port (RTG, Straddle Carrier, AVG, etc.) and the system that involves the use of AGW. This analysis is made on the operational characteristics of the different handling systems, through the use of: functional schemes, with the aim to carry out evaluations related to the spatial, organizational and relational structure of container yard equipped with different handling unit; network models (graphical representation of links and paths; basic cost parameters) for the schematization and simulation of container handling in the yard; cost models for quantitative evaluation of monetary and temporal impacts, that derive from the use of different handling unit in the yard.
© 2015 The Authors. Published by Elsevier B.V.
Selection and peer-review under responsibility of Association for European Transport. Keywords:container handling system, Automated Guided Wagon, Comparative Cost analysis
Corresponding author:
E-mail address: [email protected]
2 First Author name/ Transportation Research Procedia00 (2016) 000–000
1. Introduction
Technological processes have favored the automation of many functions in the field of rail transport. The general interest is to reduce operative management costs (less personnel components), as well as to increase safety and reliability levels. In some cases, for the reserved and protected railway, there are driverless systems, autonomous metro lines in the world. Computers have replaced manpower and often the performance has significantly improved. The automatic drive of the trains is more difficult to implement because the integral protection of the railways is not easy. In metro lines the railway has a track completely free of external influences, generally in tunnels and viaducts; the system is simplified and the driving action only takes into account the interaction between the vehicles on line and the diagrams of the motion mechanisms between the different phases (starting, regime, slowing and braking, stop in the station). For a vehicle moving in an open environmental context, such as an ordinary train, things get more complicated; the vehicle must interact with different stationary or moving objects, and it must be able to recognize them and adapt its behavior. Some research results, in particular in the rail freight industry and in computer science, are very promising from the technological and economic feasibility point of view. Some of them have been carried out in Germany: an experimental freight train was developed and tested by the DB in cooperation with some Transport Industries and research Units. It was tested in 1994. In 2003, Siemens introduced the CargoMover Siemens, 2002; Rijsenbrij et alii, 2006), designed for local and regional freight transport, which can reach up to 150 km/h with a top speed of 90 km/h. The vehicle was controlled by the central computer and directed by wireless communication. In 2013, a project named FlexCargoRail (Savelsberg, 2008) was concluded. However, in some contexts such as modal interchange nodes, highly-automated rail handling may be an opportunity to explore.
In the literature sector, the analysis of handling means used in ports, is carried out by distinguishing between two macro-categories: the cranes and the horizontal transport means (Steenken et alii, 2004). Concerning cranes, different types are operative in container terminals: the quay (or gantry) cranes for loading and unloading ships and the cranes applied to stacks (RMG-Rail Mounted Gantry crane, RTG – Rubber Tired Gantry crane, OBC – Overhead Bridge Cranes). Instead, the second category of means is employed for the horizontal transport both for the ship-to-shore transportation and the landside operation.
In this paper the focus is on horizontal transport means. In general, the study of handling vehicles is dealt with from two different points of view. Some authors focus on the analysis of the technological features of the means, while others focus on operational performance. For example Ioannou et alii, in several contributions (2000, 2001, 2002), provides a detailed overview of current state of the art handling technologies for terminal operations, with specific reference to automated means like AGVs – Automated Guided Vehicles. Instead many studies (Khoshnevis et alii, 2000; Asef Vazinri et alii, 2003; Zhu et alii; 2010; van Gils et alii, 2013), propose performance analysis through simulation approaches. Comparisons between different types of container terminals, based on specific equipments, are provided and the effectiveness of automated systems is compared with performance of current conventional systems by simulation experiments.
In the simulation studies the reference parameters are often design parameters such as the number of handling means. There were no significant contributions in terms of handling costs and times that are the subject of this paper
This paper offers a comparative analysis of various experimented container handling systems in an interchange node, as well as innovative rail technology (AGW – Automated Guided Wagon). Some handling technologies are illustrated, including common vehicles (Straddle Carrier, Fork Lift, Reach Stacker, Transtainer, Multi-trailer Train) and some of the latest types of automated vehicles. It explains the significance of handling vehicle operations in intermodal transport competitiveness, with rail transport replacing road transport. The AGW is presented, highlighting its technological features and performance, as well as its potentialities for reducing modal transfer costs.
The paper focuses, therefore, a simulation methodological approach, based on transportation models applied to the intermodal sites, to valuate times and costs to move a container between different port areas. Finally, the results of the analysis are discussed, concerning container transfer from maritime quay to train, and applying different handling technologies.
2. Handling units for modal transfer
Handling Units (HUs) are dedicated means used at cargo interchange nodes in order to handle transiting cargo, that is, to transfer the Cargo Units (CUs) from one area to another, and from one means of transport to another. The HUs can be divided into two categories: common and automated. The main difference between the two types of vehicles is that the common vehicles are “passive”, not able to lift containers by themselves.
General information concerning the technical and performance characteristics of the handling means have been found through a specific survey in engineering oriented journals as well as web site of the manufacturers (www.liebherr.com; www.konecranes.com; www.kalmarglobal.com).
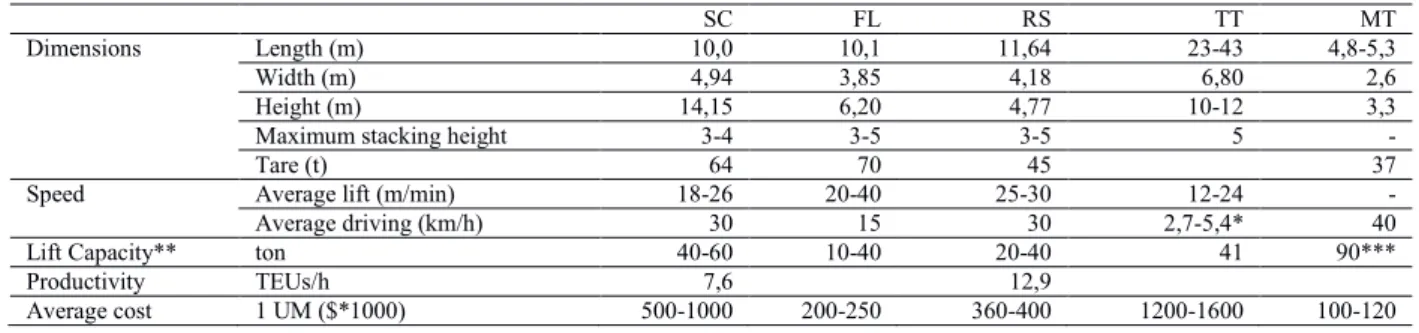
The most common HUs are Straddle Carrier (SC), Fork Lift (FL), Reach Stacker (RS), Transtainer (TT), Multi-trailer Train (MT); however, over the last few years innovative types of HU are being used, characterized by more or less advanced automated functions (Gattuso and Cassone, 2013). The dimensions and performance of common HUs are shown in table 1.
Table 1. Dimensions and performance of common HUs
SC FL RS TT MT
Dimensions Length (m) 10,0 10,1 11,64 23-43 4,8-5,3
Width (m) 4,94 3,85 4,18 6,80 2,6
Height (m) 14,15 6,20 4,77 10-12 3,3
Maximum stacking height 3-4 3-5 3-5 5 -
Tare (t) 64 70 45 37
Speed Average lift (m/min) 18-26 20-40 25-30 12-24 -
Average driving (km/h) 30 15 30 2,7-5,4* 40
Lift Capacity** ton 40-60 10-40 20-40 41 90***
Productivity TEUs/h 7,6 12,9
Average cost 1 UM ($*1000) 500-1000 200-250 360-400 1200-1600 100-120
* Trolley speed; **Lift capacity is a function of stacking height and of the container weight; ***Load capacity of HU
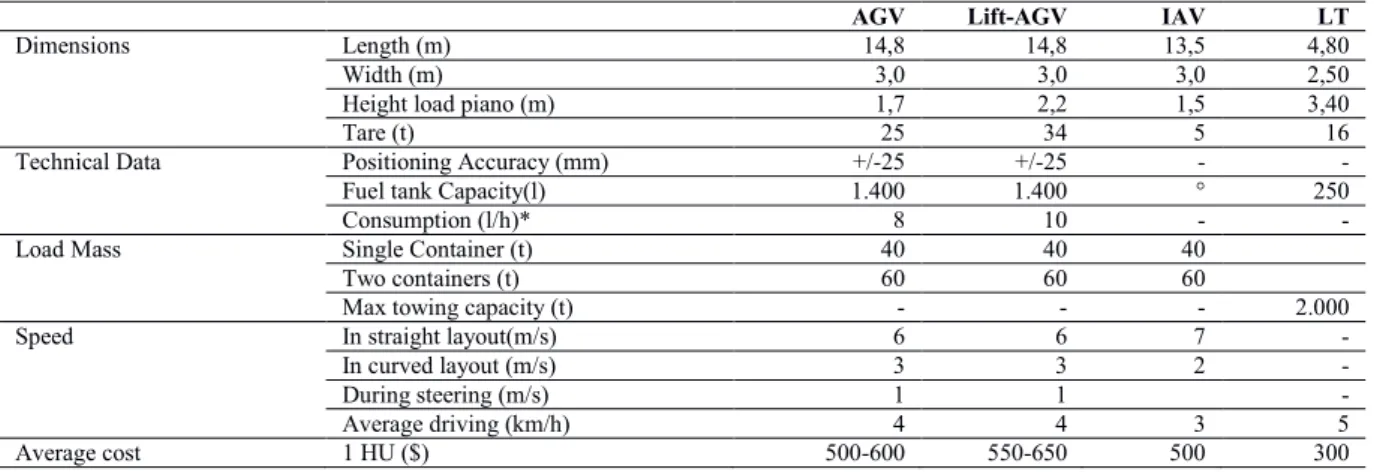
Cargo handling inside the terminals can also be carried out by highly automated vehicles such as the Automated Guided Vehicle (AGV), the Intelligent Autonomous Vehicle (IAV), the Loco-Tractor (LT), the Automated Straddle Carrier (ASC), the Automated Transtainer (ATT).
AGVs, presently used in the ports of Rotterdam, Hamburg and Singapore, allow horizontal cargo handling; a specific version is called Lift-AGV because load lifting occurs thanks to special mobile platforms placed in correspondence to the loading platform. In both cases, they are simple, flexible vehicles, with a reduced mass, low consumption, and high loading capacity (about 60 t). An AGV is generally used instead of the straddle carrier for transfers to and from the quay and the loading yard. It is placed at the buffer crane and when the container has been loaded, it moves along guides traced on the terminal surface, until it reaches the pre-defined position where a gantry crane retrieves and stores the container. At the yard blocks there are racks where the automated vehicle can deposit the container without waiting for the crane to pick it up; in this way downtime is avoided, and the vehicle’s productivity is enhanced. AGVs are controlled and supplied with data and orders by management and navigation software.
An interesting type of HU in loading areas is the IAV (Intelligent Autonomous Vehicle); it is still a prototype and it was developed in the European Project INTRADE (Intelligent Transportation for Dynamic Environment) coordinated by Lille Polytechnic (Merzouki, 2014). It is like the AGV but, instead of moving along a fixed track on the yard surface thanks to an incorporated transponder, GPS systems and other sensors allow it to move freely. The remote navigation system operates in a virtual environment, therefore the vehicle can move in any direction within a defined area; so it is possible to form self-driven or tractor-driven ‘trains’. The connection between the two IAVs is not physical, it is virtual and works via specific sensors placed on the vehicles.
In some contexts where rail transport is privileged, tractors with automatic gear control that can move both on rails and rubber tyres are used. These HUs, named Loco Tractors, are flexible and offer good performance.
There are also cases of Automated Straddle Carrier (ASC) and Automated Transtainers (ATR), controlled by advanced computer systems; their unit cost increases considerably (about 2.2M€ for ATR), but the driverless activity gives interesting lower management costs. Table 2 illustrates technical data related to the above HUs.
Table 2. Dimensions and performance of automated HUs
AGV Lift-AGV IAV LT
Dimensions Length (m) 14,8 14,8 13,5 4,80
Width (m) 3,0 3,0 3,0 2,50
Height load piano (m) 1,7 2,2 1,5 3,40
Tare (t) 25 34 5 16
Technical Data Positioning Accuracy (mm) +/-25 +/-25 - -
Fuel tank Capacity(l) 1.400 1.400 ° 250
Consumption (l/h)* 8 10 - -
Load Mass Single Container (t) 40 40 40
Two containers (t) 60 60 60
Max towing capacity (t) - - - 2.000
Speed In straight layout(m/s) 6 6 7 -
In curved layout (m/s) 3 3 2 -
During steering (m/s) 1 1 -
Average driving (km/h) 4 4 3 5
Average cost 1 HU ($) 500-600 550-650 500 300
3. AGW technology. Potential impact of modal shift on transport cost
Over the last few years, an experimentation has focused on the design, equipping and testing an AGW.. AGW is a typical traditional wagon, transformed into a “smart” wagon by introducing a high automation level. The classical designing process has been integrated with advanced virtual animation techniques, to highlight the relative characteristics of production, functioning, and assembling. This approach was especially adopted for the designing of the traction system with an electric engine and of the automatic hook (Gattuso et alii, 2017). If the wagon is transformed from a passive element into an intelligent autonomous element, such as the AGW, it can lead to a reduction in costs and greater handling efficiency. The challenge is to remotely operate railway wagon movements from any suitably equipped area to an adjacent station for the final composition of the convoy and for its placing on the line.
The research proposes a comparison between the operational performances of the AGW system and the performance of the handling systems currently used in the container terminal. Specifically, the cost and time, deriving from the use of a specific chain of handling vehicles to move the containers from the quay to the storage area and from the storage area to the intermodal area dedicated to train formation, have been analyzed.
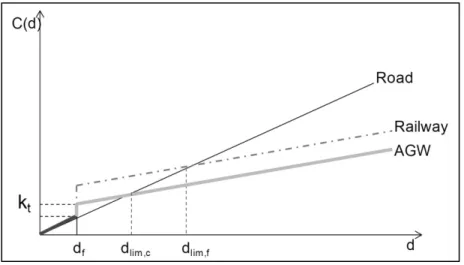
The evaluation of costs at the intermodal exchange nodes is important; in fact, these costs represent an important component of the total transport costs. For example, we shall consider road transport, combined road-rail transport and intermodal transport which involves the use of AGW at the interchange node; it is possible to make a generalized distance-cost diagram as Fig.1 illustrates. In the case of road transport, there is a linear increase in transport costs in proportion to distance. As regards rail transport, there is high access impedance (via road) due to the fact that the railway is not able to guarantee a widespread network over the whole territory and wagon handling and train composition in a station entail high costs (in the figure this incremental cost corresponding to road-rail modal transport is represented by the jump Kt); these factors limit railway competitiveness compared to on-road
freight. There is also a linear rise in rail transport costs according to distance, but the unit cost is lower compared to road transport. The break-even distance, that is, the distance from which rail transport is cheaper, is calculated to be around 400-500 km from departure point today. In order to make rail transport more competitive and appealing to the market, reducing the jump in the original cost Kt can be made possible by acting on the organization and
exchange terminal operation and for this reason great attention is paid to the choice of efficient and economically advantageous HUs (McLaurin, 2015).
The expected effects, connected with the use of AGW, should be considerable and lead to the reduction of generalized transport costs (Kt), due to a significant reduction in both handling times and costs at the interchange
2. Handling units for modal transfer
Handling Units (HUs) are dedicated means used at cargo interchange nodes in order to handle transiting cargo, that is, to transfer the Cargo Units (CUs) from one area to another, and from one means of transport to another. The HUs can be divided into two categories: common and automated. The main difference between the two types of vehicles is that the common vehicles are “passive”, not able to lift containers by themselves.
General information concerning the technical and performance characteristics of the handling means have been found through a specific survey in engineering oriented journals as well as web site of the manufacturers (www.liebherr.com; www.konecranes.com; www.kalmarglobal.com).
The most common HUs are Straddle Carrier (SC), Fork Lift (FL), Reach Stacker (RS), Transtainer (TT), Multi-trailer Train (MT); however, over the last few years innovative types of HU are being used, characterized by more or less advanced automated functions (Gattuso and Cassone, 2013). The dimensions and performance of common HUs are shown in table 1.
Table 1. Dimensions and performance of common HUs
SC FL RS TT MT
Dimensions Length (m) 10,0 10,1 11,64 23-43 4,8-5,3
Width (m) 4,94 3,85 4,18 6,80 2,6
Height (m) 14,15 6,20 4,77 10-12 3,3
Maximum stacking height 3-4 3-5 3-5 5 -
Tare (t) 64 70 45 37
Speed Average lift (m/min) 18-26 20-40 25-30 12-24 -
Average driving (km/h) 30 15 30 2,7-5,4* 40
Lift Capacity** ton 40-60 10-40 20-40 41 90***
Productivity TEUs/h 7,6 12,9
Average cost 1 UM ($*1000) 500-1000 200-250 360-400 1200-1600 100-120
* Trolley speed; **Lift capacity is a function of stacking height and of the container weight; ***Load capacity of HU
Cargo handling inside the terminals can also be carried out by highly automated vehicles such as the Automated Guided Vehicle (AGV), the Intelligent Autonomous Vehicle (IAV), the Loco-Tractor (LT), the Automated Straddle Carrier (ASC), the Automated Transtainer (ATT).
AGVs, presently used in the ports of Rotterdam, Hamburg and Singapore, allow horizontal cargo handling; a specific version is called Lift-AGV because load lifting occurs thanks to special mobile platforms placed in correspondence to the loading platform. In both cases, they are simple, flexible vehicles, with a reduced mass, low consumption, and high loading capacity (about 60 t). An AGV is generally used instead of the straddle carrier for transfers to and from the quay and the loading yard. It is placed at the buffer crane and when the container has been loaded, it moves along guides traced on the terminal surface, until it reaches the pre-defined position where a gantry crane retrieves and stores the container. At the yard blocks there are racks where the automated vehicle can deposit the container without waiting for the crane to pick it up; in this way downtime is avoided, and the vehicle’s productivity is enhanced. AGVs are controlled and supplied with data and orders by management and navigation software.
An interesting type of HU in loading areas is the IAV (Intelligent Autonomous Vehicle); it is still a prototype and it was developed in the European Project INTRADE (Intelligent Transportation for Dynamic Environment) coordinated by Lille Polytechnic (Merzouki, 2014). It is like the AGV but, instead of moving along a fixed track on the yard surface thanks to an incorporated transponder, GPS systems and other sensors allow it to move freely. The remote navigation system operates in a virtual environment, therefore the vehicle can move in any direction within a defined area; so it is possible to form self-driven or tractor-driven ‘trains’. The connection between the two IAVs is not physical, it is virtual and works via specific sensors placed on the vehicles.
In some contexts where rail transport is privileged, tractors with automatic gear control that can move both on rails and rubber tyres are used. These HUs, named Loco Tractors, are flexible and offer good performance.
There are also cases of Automated Straddle Carrier (ASC) and Automated Transtainers (ATR), controlled by advanced computer systems; their unit cost increases considerably (about 2.2M€ for ATR), but the driverless activity gives interesting lower management costs. Table 2 illustrates technical data related to the above HUs.
Table 2. Dimensions and performance of automated HUs
AGV Lift-AGV IAV LT
Dimensions Length (m) 14,8 14,8 13,5 4,80
Width (m) 3,0 3,0 3,0 2,50
Height load piano (m) 1,7 2,2 1,5 3,40
Tare (t) 25 34 5 16
Technical Data Positioning Accuracy (mm) +/-25 +/-25 - -
Fuel tank Capacity(l) 1.400 1.400 ° 250
Consumption (l/h)* 8 10 - -
Load Mass Single Container (t) 40 40 40
Two containers (t) 60 60 60
Max towing capacity (t) - - - 2.000
Speed In straight layout(m/s) 6 6 7 -
In curved layout (m/s) 3 3 2 -
During steering (m/s) 1 1 -
Average driving (km/h) 4 4 3 5
Average cost 1 HU ($) 500-600 550-650 500 300
3. AGW technology. Potential impact of modal shift on transport cost
Over the last few years, an experimentation has focused on the design, equipping and testing an AGW.. AGW is a typical traditional wagon, transformed into a “smart” wagon by introducing a high automation level. The classical designing process has been integrated with advanced virtual animation techniques, to highlight the relative characteristics of production, functioning, and assembling. This approach was especially adopted for the designing of the traction system with an electric engine and of the automatic hook (Gattuso et alii, 2017). If the wagon is transformed from a passive element into an intelligent autonomous element, such as the AGW, it can lead to a reduction in costs and greater handling efficiency. The challenge is to remotely operate railway wagon movements from any suitably equipped area to an adjacent station for the final composition of the convoy and for its placing on the line.
The research proposes a comparison between the operational performances of the AGW system and the performance of the handling systems currently used in the container terminal. Specifically, the cost and time, deriving from the use of a specific chain of handling vehicles to move the containers from the quay to the storage area and from the storage area to the intermodal area dedicated to train formation, have been analyzed.
The evaluation of costs at the intermodal exchange nodes is important; in fact, these costs represent an important component of the total transport costs. For example, we shall consider road transport, combined road-rail transport and intermodal transport which involves the use of AGW at the interchange node; it is possible to make a generalized distance-cost diagram as Fig.1 illustrates. In the case of road transport, there is a linear increase in transport costs in proportion to distance. As regards rail transport, there is high access impedance (via road) due to the fact that the railway is not able to guarantee a widespread network over the whole territory and wagon handling and train composition in a station entail high costs (in the figure this incremental cost corresponding to road-rail modal transport is represented by the jump Kt); these factors limit railway competitiveness compared to on-road
freight. There is also a linear rise in rail transport costs according to distance, but the unit cost is lower compared to road transport. The break-even distance, that is, the distance from which rail transport is cheaper, is calculated to be around 400-500 km from departure point today. In order to make rail transport more competitive and appealing to the market, reducing the jump in the original cost Kt can be made possible by acting on the organization and
exchange terminal operation and for this reason great attention is paid to the choice of efficient and economically advantageous HUs (McLaurin, 2015).
The expected effects, connected with the use of AGW, should be considerable and lead to the reduction of generalized transport costs (Kt), due to a significant reduction in both handling times and costs at the interchange
Fig. 1 Generalized cost versus travel distance
The methodological approach followed for the analysis of monetary times and costs is divided into 5 phases. In the first phase, data concerning the technical characteristics and performance of the considered handling systems were collected as well as the dimensional and layout characteristics of the container terminal chosen in the analyses. The data were systematized in a synthetic, modular and potentially updatable database.
Therefore, the construction of the conceptual model of the node was carried out in two successive steps: the design of the flow chart representing the functional areas of the node and the relationships between them; the construction of the graph and the identification of possible routes.
Finally the specification and calibration of some cost functions have been applied and the simulations have been provided to evaluate times and monetary costs useful for comparative analysis.
4. Functional models related to freight transfer from ship to train
The structure of a freight interchange site can be functionally illustrated in the representation of its physical/organizational components and reciprocal relations, by means of a graph or a topological model based on nodes and links; and finally by means of a network model based on a graph associating quantitative characteristics or cost functions to each arch and node.
4.1. Functional models and network diagram
The aim of the functional representation of an intermodal site, as a port (Fig.2), is to define the operating components of the terminal and highlight existing relations. It can meet various requirements, from relative analyses and evaluations to the spatial, organisational and relational structure of the node. The functional representation is achieved through block diagrams that define the typical utilities of the terminal and the connections between the various areas of the node itself.
Fig. 2 Functional representation of a container port
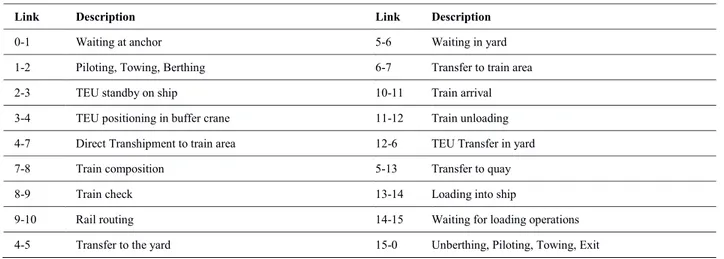
The graphic representation of a freights interchange node (Fig.3) is achieved by means of a graph schematizing the different activities. Generally speaking, the nodes on the graph are physical and/or time points representing the beginning/end of a simple operation in the goods transport cycle and their potential handling/treatment, while the links represent the actual handling and/or treatment operations (Table 3).
Fig. 3 Network graph in interchange maritime-rail context Table 3. Description of graph links
Link Description Link Description
0-1 Waiting at anchor 5-6 Waiting in yard
1-2 Piloting, Towing, Berthing 6-7 Transfer to train area
2-3 TEU standby on ship 10-11 Train arrival
3-4 TEU positioning in buffer crane 11-12 Train unloading 4-7 Direct Transhipment to train area 12-6 TEU Transfer in yard
7-8 Train composition 5-13 Transfer to quay
8-9 Train check 13-14 Loading into ship
9-10 Rail routing 14-15 Waiting for loading operations
4-5 Transfer to the yard 15-0 Unberthing, Piloting, Towing, Exit GATE
(IN) RAIL SERVING AREA (OUT)GATE
STORAGE AREA StrategyService
Indirect transhipment Via storage Direct transhipment Transhipment trucks Gantry Crane
Fig. 1 Generalized cost versus travel distance
The methodological approach followed for the analysis of monetary times and costs is divided into 5 phases. In the first phase, data concerning the technical characteristics and performance of the considered handling systems were collected as well as the dimensional and layout characteristics of the container terminal chosen in the analyses. The data were systematized in a synthetic, modular and potentially updatable database.
Therefore, the construction of the conceptual model of the node was carried out in two successive steps: the design of the flow chart representing the functional areas of the node and the relationships between them; the construction of the graph and the identification of possible routes.
Finally the specification and calibration of some cost functions have been applied and the simulations have been provided to evaluate times and monetary costs useful for comparative analysis.
4. Functional models related to freight transfer from ship to train
The structure of a freight interchange site can be functionally illustrated in the representation of its physical/organizational components and reciprocal relations, by means of a graph or a topological model based on nodes and links; and finally by means of a network model based on a graph associating quantitative characteristics or cost functions to each arch and node.
4.1. Functional models and network diagram
The aim of the functional representation of an intermodal site, as a port (Fig.2), is to define the operating components of the terminal and highlight existing relations. It can meet various requirements, from relative analyses and evaluations to the spatial, organisational and relational structure of the node. The functional representation is achieved through block diagrams that define the typical utilities of the terminal and the connections between the various areas of the node itself.
Fig. 2 Functional representation of a container port
The graphic representation of a freights interchange node (Fig.3) is achieved by means of a graph schematizing the different activities. Generally speaking, the nodes on the graph are physical and/or time points representing the beginning/end of a simple operation in the goods transport cycle and their potential handling/treatment, while the links represent the actual handling and/or treatment operations (Table 3).
Fig. 3 Network graph in interchange maritime-rail context Table 3. Description of graph links
Link Description Link Description
0-1 Waiting at anchor 5-6 Waiting in yard
1-2 Piloting, Towing, Berthing 6-7 Transfer to train area
2-3 TEU standby on ship 10-11 Train arrival
3-4 TEU positioning in buffer crane 11-12 Train unloading 4-7 Direct Transhipment to train area 12-6 TEU Transfer in yard
7-8 Train composition 5-13 Transfer to quay
8-9 Train check 13-14 Loading into ship
9-10 Rail routing 14-15 Waiting for loading operations
4-5 Transfer to the yard 15-0 Unberthing, Piloting, Towing, Exit GATE
(IN) RAIL SERVING AREA (OUT)GATE
STORAGE AREA StrategyService
Indirect transhipment Via storage Direct transhipment Transhipment trucks Gantry Crane
The graph representation of the node is significant if each link is associated to a quantitative value, that is a (monetary or time) cost related to the execution of the represented activity. By carrying out this operation, a network model can be built and defined from the graph representation. It gives information as to transit costs and times by means of link cost functions opportunely specified and calibrated.
In order to speed up container handling in the storage yard, when there are large areas and/or moderate cargo volumes, it is preferable to keep the height down to one or two tiers; in this case, vehicles such as the SC are preferred; viceversa, in a congested terminal, a Transtainer system (RTG or RMG) with a high storage density is preferable.
There are many container handling strategies in a storage yard. We will consider a container terminal with possible rail cargo transfer. A first distinction (Gunter and Kim; 2005) can be made between systems that use the same HU for the transport and positioning of containers in the yard and systems that use two different HUs. An example of the first kind of system is SC handling: from the quay to the yard where the SC can move through aisles to position the containers in ordered rows; by so doing, however, a part of useful space is “wasted”. An example of the second kind is one where light HUs (ex. Reach Stacker) transfer containers to the edge of the yard, and are then placed inside the yard by Transtainers.
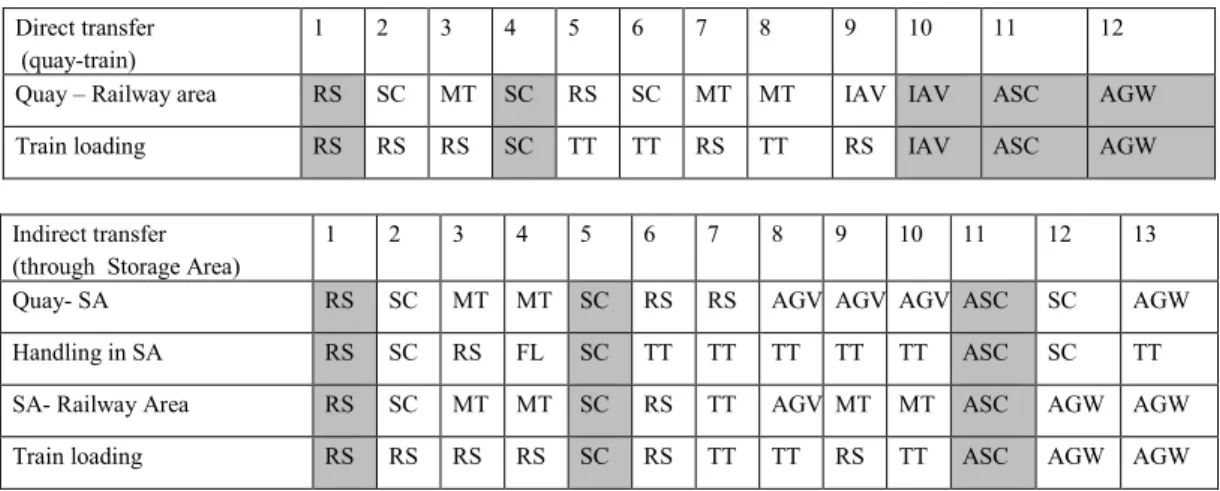
A number of functional schemes can be determined in relation to the combination of HUs adopted for transfer and handling in the storage area (Brinkmann, 2011); there follows a series of schemes related to sea-rail modal transfer, distinguishing between direct transfer (quay-train) and indirect transfer (from the quay to a storage area and, successively, from the area to the train).
Table 4: Combination of HUs for sea-rail modal transfer Direct transfer
(quay-train) 1 2 3 4 5 6 7 8 9 10 11 12 Quay – Railway area RS SC MT SC RS SC MT MT IAV IAV ASC AGW Train loading RS RS RS SC TT TT RS TT RS IAV ASC AGW Indirect transfer
(through Storage Area) 1 2 3 4 5 6 7 8 9 10 11 12 13 Quay- SA RS SC MT MT SC RS RS AGV AGV AGV ASC SC AGW Handling in SA RS SC RS FL SC TT TT TT TT TT ASC SC TT SA- Railway Area RS SC MT MT SC RS TT AGV MT MT ASC AGW AGW Train loading RS RS RS RS SC RS TT TT RS TT ASC AGW AGW 4.2. Network Models
The network model gives information as to transit costs and times at the interchange node through link cost functions opportunely specified and calibrated (Kiani and Noori, 2011). Cost functions can be of two different kinds: generalized cost functions and non-generalized cost functions. In the first case the cost is expressed as a linear combination of various components, through an expression of the kind:
i i i
g
x
c
(1)in which: cg is the generalized transport cost; xi are the non-homogenous cost items considered (time, monetary
cost, disutility associated with possible delays or damage to the goods, etc.); βi are the “homogenization” coefficients
necessary to make the measurement units uniform and to attribute a value to each cost item. In this case there is a summary indicator that could be useful for the comparison of various system typologies, but it is objectively difficult to determine homogenization parameters of the various cost items valid for each context.
In the second case, costs are evaluated by considering the non-homogenous cost components separately; for example:
i i NA i i NAt
t
t
c
c
c
(2)with: c monetary cost linked to transport; ci added aliquot of the monetary cost (fuel, tyres, lubricants, etc.); cNA
non-added aliquot of the monetary cost (cost of driver, cost of tolls not proportional to the distance, etc.); t distance time; ti added aliquot of distance time; tNA non-added aliquot of distance time (for example, in the case of road
transport, rest time for the driver).
Such an approach helps to interpret phenomena and overcome the difficulties in determining univocal homogenization coefficients. To evaluate transit costs through the node we can use aggregated models, in which the various cost items, that help determine the global time or monetary cost, are grouped into a single parameter; and disaggregated models, in which the single cost components are explicitly considered.
5. A case study: Gioia Tauro port
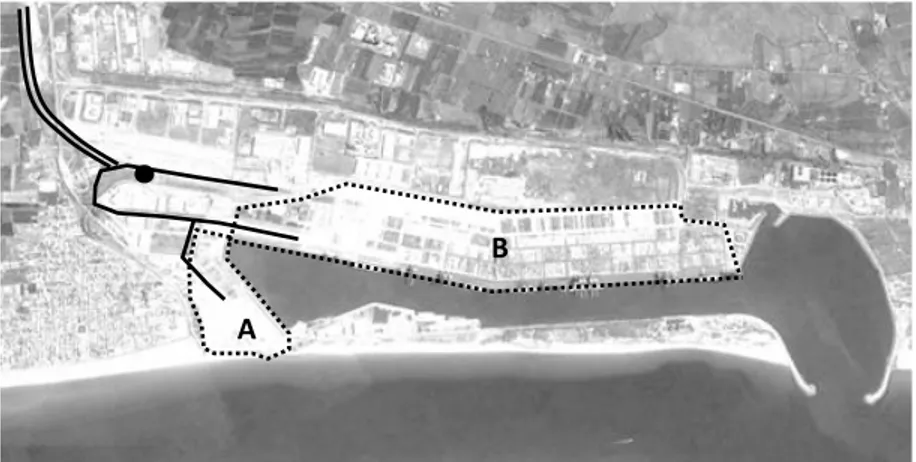
The port of Gioia Tauro is in the centre of the Mediterranean (at about 1,800 km from the Suez Canal and at about 1,900 km from the Gibraltar Straits). Its geographical position makes it a natural transhipment port, which also has strong land connections: it has direct access to major national communication routes. The railway infrastructure serving the port is made up of an area linking the national Tyrrhenian network with the internal railway terminals (Fig. 4).
There is a project for the construction of a railway terminal serving the port, in order to promote sea-rail intermodality. In fact, scenario analyses have been carried out based on the hypothesis of a stacking area for the freights destined for railway transport in the terminal container yard adjacent to the new intermodal terminal and, in the case of AGW handling, a parking area for the wagons themselves (Fig.5).
Fig. 4 Current railway connection in Gioia Tauro port B
A
Connection Railway trucks to national network Internal Railway trucks
Car Terminal B Container Terminal
Railway Station A
The graph representation of the node is significant if each link is associated to a quantitative value, that is a (monetary or time) cost related to the execution of the represented activity. By carrying out this operation, a network model can be built and defined from the graph representation. It gives information as to transit costs and times by means of link cost functions opportunely specified and calibrated.
In order to speed up container handling in the storage yard, when there are large areas and/or moderate cargo volumes, it is preferable to keep the height down to one or two tiers; in this case, vehicles such as the SC are preferred; viceversa, in a congested terminal, a Transtainer system (RTG or RMG) with a high storage density is preferable.
There are many container handling strategies in a storage yard. We will consider a container terminal with possible rail cargo transfer. A first distinction (Gunter and Kim; 2005) can be made between systems that use the same HU for the transport and positioning of containers in the yard and systems that use two different HUs. An example of the first kind of system is SC handling: from the quay to the yard where the SC can move through aisles to position the containers in ordered rows; by so doing, however, a part of useful space is “wasted”. An example of the second kind is one where light HUs (ex. Reach Stacker) transfer containers to the edge of the yard, and are then placed inside the yard by Transtainers.
A number of functional schemes can be determined in relation to the combination of HUs adopted for transfer and handling in the storage area (Brinkmann, 2011); there follows a series of schemes related to sea-rail modal transfer, distinguishing between direct transfer (quay-train) and indirect transfer (from the quay to a storage area and, successively, from the area to the train).
Table 4: Combination of HUs for sea-rail modal transfer Direct transfer
(quay-train) 1 2 3 4 5 6 7 8 9 10 11 12 Quay – Railway area RS SC MT SC RS SC MT MT IAV IAV ASC AGW Train loading RS RS RS SC TT TT RS TT RS IAV ASC AGW Indirect transfer
(through Storage Area) 1 2 3 4 5 6 7 8 9 10 11 12 13 Quay- SA RS SC MT MT SC RS RS AGV AGV AGV ASC SC AGW Handling in SA RS SC RS FL SC TT TT TT TT TT ASC SC TT SA- Railway Area RS SC MT MT SC RS TT AGV MT MT ASC AGW AGW Train loading RS RS RS RS SC RS TT TT RS TT ASC AGW AGW 4.2. Network Models
The network model gives information as to transit costs and times at the interchange node through link cost functions opportunely specified and calibrated (Kiani and Noori, 2011). Cost functions can be of two different kinds: generalized cost functions and non-generalized cost functions. In the first case the cost is expressed as a linear combination of various components, through an expression of the kind:
i i i
g
x
c
(1)in which: cg is the generalized transport cost; xi are the non-homogenous cost items considered (time, monetary
cost, disutility associated with possible delays or damage to the goods, etc.); βi are the “homogenization” coefficients
necessary to make the measurement units uniform and to attribute a value to each cost item. In this case there is a summary indicator that could be useful for the comparison of various system typologies, but it is objectively difficult to determine homogenization parameters of the various cost items valid for each context.
In the second case, costs are evaluated by considering the non-homogenous cost components separately; for example:
i i NA i i NAt
t
t
c
c
c
(2)with: c monetary cost linked to transport; ci added aliquot of the monetary cost (fuel, tyres, lubricants, etc.); cNA
non-added aliquot of the monetary cost (cost of driver, cost of tolls not proportional to the distance, etc.); t distance time; ti added aliquot of distance time; tNA non-added aliquot of distance time (for example, in the case of road
transport, rest time for the driver).
Such an approach helps to interpret phenomena and overcome the difficulties in determining univocal homogenization coefficients. To evaluate transit costs through the node we can use aggregated models, in which the various cost items, that help determine the global time or monetary cost, are grouped into a single parameter; and disaggregated models, in which the single cost components are explicitly considered.
5. A case study: Gioia Tauro port
The port of Gioia Tauro is in the centre of the Mediterranean (at about 1,800 km from the Suez Canal and at about 1,900 km from the Gibraltar Straits). Its geographical position makes it a natural transhipment port, which also has strong land connections: it has direct access to major national communication routes. The railway infrastructure serving the port is made up of an area linking the national Tyrrhenian network with the internal railway terminals (Fig. 4).
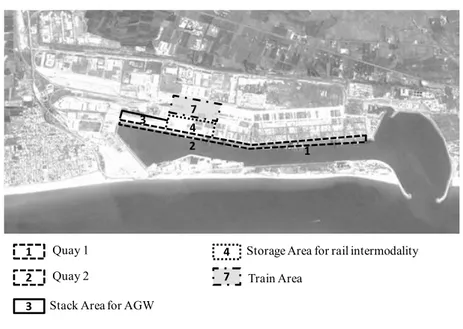
There is a project for the construction of a railway terminal serving the port, in order to promote sea-rail intermodality. In fact, scenario analyses have been carried out based on the hypothesis of a stacking area for the freights destined for railway transport in the terminal container yard adjacent to the new intermodal terminal and, in the case of AGW handling, a parking area for the wagons themselves (Fig.5).
Fig. 4 Current railway connection in Gioia Tauro port B
A
Connection Railway trucks to national network Internal Railway trucks
Car Terminal B Container Terminal
Railway Station A
Fig. 5 Reference Structure
In reference to the new structure of the area and hypothesizing the deployment of conventional handling units, the activity at the terminal for sea - rail intermodality involves the following operating cycle: ship unloading – transfer to the storage yard (dedicated area) – transfer to the intermodal terminal – train loading. If AGW vehicles are used for handling cargo destined for rail transfer, there is a considerable variation in the operating cycle with a reduction in load breakage. Table 5 shows the analyzed and compared cases.
Table 5. Intermodal operating cycles
1 2 3 4
Ship unloading GC GC GC GC
Transfer to yard SC SC AGV AGW
Transfer to intermodal terminal SC MT+RS AGV+RS AGW
Train loading RS TT TT -
Figure 6 illustrates the graph and the possible routes for freights transfer by conventional vehicles and AGVs. Figure 7 shows the graph and the possible routes when AGWs are used for handling.
Fig. 6 Graph and routes with conventional HUs and AGV
1 2 4 5 7 8 9 Link Description 1-4; 2-4 Quay-Yard 4-5 Waiting in yard 5-7 Yard-Train Area 7-8 Load on wagon 8-9 Train formation Routes a) 1-4-5-7-8-9 b) 2-4-5-7-8-9 1 3 4 7 Quay 1 Train Area Stack Area for AGW
Storage Area for rail intermodality
2 Quay 2
1 2
4 3 7
Fig. 7 Graph and routes with AGW
For performance analysis, some hypotheses have been adopted: a 10- wagon MT for container transfer from storage area to intermodal area; a typical 20-wagon train was considered; an average temporal value of 3 minutes for a TT to move a container from storage area to train; an average time of 5 minutes for RS operations (lifting containers in storage area and positioning on MT or AVG, lifting from MT or AVG and positioning on rail wagon); one day of average stop time in the storage area for containers in sea-rail transfer. As for input, a number of operational parameters and cost units have been defined by specialised technical literature: speed movement of HU (25 km/h for RS and SC; 35 km/h for MT, 16 km/h for AGV, 10 km/h for AGW); monetary cost for a container displacement (33 €/km for RS and SC; 1,5 €/km for MT; 12 €/h for AGV; 9 €/h for AGW; 30 €/h for TT); monetary cost for a 40-feet container parking (20 €/day); train composition (8 €/wagon). The results are summarized in Table 6 and Figure 8.
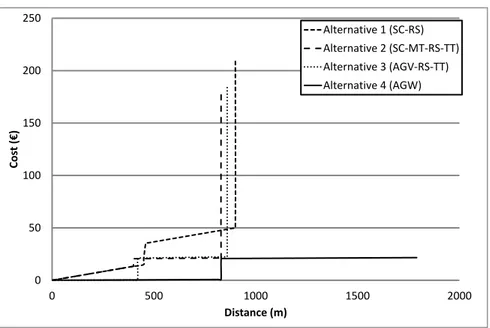
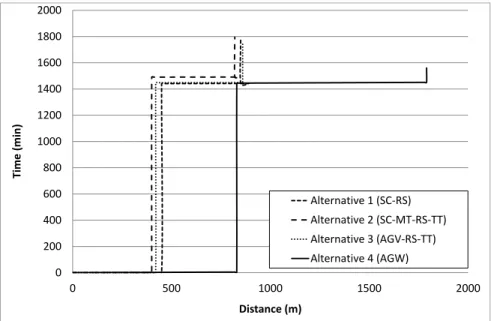
With reference to both the origins of container movement (Quay 1, Quay 2), from the comparison between the 4 alternative modal transfers, AGW transport mode offers greater advantages in temporal terms, and especially in terms of cost. In fact, a significant reduction in costs is achieved by removing the factor cost of train composition, since in the AGW case this operation is carried out automatically.
Also, the graphs in Figures 9 and 10 clearly show the advantage of the automatic wagon modality. In particular, in the case of the AGW it is possible to observe a substantial drop in intermodal transfer operational costs as regards displacement distance.
Nevertheless, the results should be viewed with some caution; in these analyses investment and maintenance costs related to the railway facilities in the yard have not been considered. These costs should evidently be reflected on the operational cost of the AGW system. Technical evaluations are expected through further developments in research.
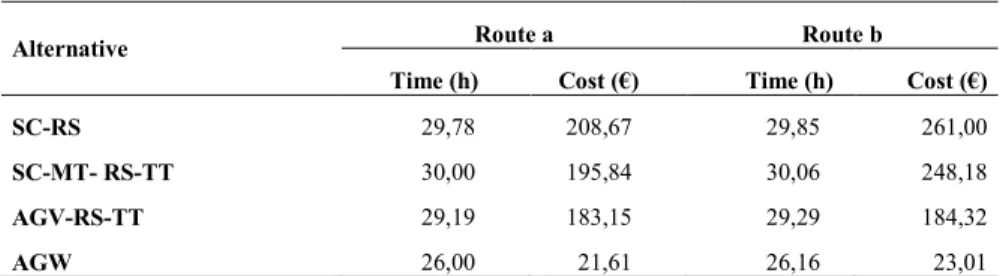
Table 6. Performance analysis results
Alternative Route a Route b
Time (h) Cost (€) Time (h) Cost (€) SC-RS 29,78 208,67 29,85 261,00 SC-MT- RS-TT 30,00 195,84 30,06 248,18 AGV-RS-TT 29,19 183,15 29,29 184,32 AGW 26,00 21,61 26,16 23,01 1 2 3 6 7 9 Link Description
1-3;2-3 Quay- Stack Area for AGW 3-6 Waiting in Stack area for AGW 6-7 Stack area for AGW–Train Area
7-9 Automated train formation Routes a) 1-3-6-7-9 b) 2-3-6-7-9
Fig. 5 Reference Structure
In reference to the new structure of the area and hypothesizing the deployment of conventional handling units, the activity at the terminal for sea - rail intermodality involves the following operating cycle: ship unloading – transfer to the storage yard (dedicated area) – transfer to the intermodal terminal – train loading. If AGW vehicles are used for handling cargo destined for rail transfer, there is a considerable variation in the operating cycle with a reduction in load breakage. Table 5 shows the analyzed and compared cases.
Table 5. Intermodal operating cycles
1 2 3 4
Ship unloading GC GC GC GC
Transfer to yard SC SC AGV AGW
Transfer to intermodal terminal SC MT+RS AGV+RS AGW
Train loading RS TT TT -
Figure 6 illustrates the graph and the possible routes for freights transfer by conventional vehicles and AGVs. Figure 7 shows the graph and the possible routes when AGWs are used for handling.
Fig. 6 Graph and routes with conventional HUs and AGV
1 2 4 5 7 8 9 Link Description 1-4; 2-4 Quay-Yard 4-5 Waiting in yard 5-7 Yard-Train Area 7-8 Load on wagon 8-9 Train formation Routes a) 1-4-5-7-8-9 b) 2-4-5-7-8-9 1 3 4 7 Quay 1 Train Area Stack Area for AGW
Storage Area for rail intermodality
2 Quay 2
1 2
4 3 7
Fig. 7 Graph and routes with AGW
For performance analysis, some hypotheses have been adopted: a 10- wagon MT for container transfer from storage area to intermodal area; a typical 20-wagon train was considered; an average temporal value of 3 minutes for a TT to move a container from storage area to train; an average time of 5 minutes for RS operations (lifting containers in storage area and positioning on MT or AVG, lifting from MT or AVG and positioning on rail wagon); one day of average stop time in the storage area for containers in sea-rail transfer. As for input, a number of operational parameters and cost units have been defined by specialised technical literature: speed movement of HU (25 km/h for RS and SC; 35 km/h for MT, 16 km/h for AGV, 10 km/h for AGW); monetary cost for a container displacement (33 €/km for RS and SC; 1,5 €/km for MT; 12 €/h for AGV; 9 €/h for AGW; 30 €/h for TT); monetary cost for a 40-feet container parking (20 €/day); train composition (8 €/wagon). The results are summarized in Table 6 and Figure 8.
With reference to both the origins of container movement (Quay 1, Quay 2), from the comparison between the 4 alternative modal transfers, AGW transport mode offers greater advantages in temporal terms, and especially in terms of cost. In fact, a significant reduction in costs is achieved by removing the factor cost of train composition, since in the AGW case this operation is carried out automatically.
Also, the graphs in Figures 9 and 10 clearly show the advantage of the automatic wagon modality. In particular, in the case of the AGW it is possible to observe a substantial drop in intermodal transfer operational costs as regards displacement distance.
Nevertheless, the results should be viewed with some caution; in these analyses investment and maintenance costs related to the railway facilities in the yard have not been considered. These costs should evidently be reflected on the operational cost of the AGW system. Technical evaluations are expected through further developments in research.
Table 6. Performance analysis results
Alternative Route a Route b
Time (h) Cost (€) Time (h) Cost (€) SC-RS 29,78 208,67 29,85 261,00 SC-MT- RS-TT 30,00 195,84 30,06 248,18 AGV-RS-TT 29,19 183,15 29,29 184,32 AGW 26,00 21,61 26,16 23,01 1 2 3 6 7 9 Link Description
1-3;2-3 Quay- Stack Area for AGW 3-6 Waiting in Stack area for AGW 6-7 Stack area for AGW–Train Area
7-9 Automated train formation Routes a) 1-3-6-7-9 b) 2-3-6-7-9
Fig. 8 Time and monetary costs of modal transfer
Fig. 9 Cost versus distance 24 25 26 27 28 29 30 31 SC-RS SC-MT- RS-TT AGV-RS-TT AGW Route a - Time (h) 0 50 100 150 200 250 SC-RS SC-MT- RS-TT AGV-RS-TT AGW Route a - Cost (€) 24 25 26 27 28 29 30 31 SC-RS SC-MT- RS-TT AGV-RS-TT AGW Route b - Time (h) 0 50 100 150 200 250 300 SC-RS SC-MT- RS-TT AGV-RS-TT AGW Route b - Cost (€) 0 50 100 150 200 250 0 500 1000 1500 2000 Cos t ( €) Distance (m) Alternative 1 (SC-RS) Alternative 2 (SC-MT-RS-TT) Alternative 3 (AGV-RS-TT) Alternative 4 (AGW)
Fig. 10: Time versus distance 6. Conclusions
This paper outlines the main results of a comparative analysis of alternative container handling systems in intermodal transfer in a port site, from ship to train. Various unit handling technologies have been considered, some conventional and one innovative (AGW). The aim of this study is to evaluate the performance of different handling vehicles, and the benefits deriving from an automated wagon system. The results seem to indicate that by adopting AGW, a significant reduction in intermodal transfer costs is achieved, and so represents a good opportunity to make the railway more competitive than road transport.
Nevertheless, it would be opportune to carry out further research, and to consider, on one hand, the amortization costs of the railway infrastructure in the port and the maintenance costs of the infrastructure itself; and on the other hand, the constraints determined by the fleet of railway wagons in use. It goes without saying that the “AGW system” could give appreciable results only by assuring a large fleet of automated wagons in a national/international context. And this implies the need for the railway companies to make investments, in order to purchase already automated autonomous wagons, or to automatize ordinary wagons.
References
Asef-Vaziri, A., Cadavid, M. and Dougherty, E. (2003) A combined container handling system in maritime terminals. Annual Meeting INFORMS Atlanta 2003, Oct 19–22, California State University, Northridge.
Brinkmann, B. (2011) Operations Systems of Container Terminals: A Compendious Overview. In Handbook of Terminal Planning Edited by Jürgen W. Böse. Springer.
Gattuso, D., Cassone, G.C., A., Lucisano A., Lucisano F. and Lucisano M. (2017) Automated Rail Wagons for new freight transport opportunities. 5th IEEE International Conference on Models and Technologies for Intelligent Transportation Systems. IEEE MT-ITS 2017- 26-28 June 2017, Naples (Italy).
Gattuso, D. and Cassone, G.C. (2013) I nodi della logistica nella supply chain, Franco Angeli Milano. Gunter, H., O. and Kim, K., H. (2005) Container Terminals and automated transport Systems. Springer.
Ioannou, P ., Kosmatopoulos, E., B,, Jula, H., Collinge, A., Liu, C-I., Asef-Vaziri, A., Dougherty, Jr E. (2000) Cargo handling technologies. Final Report, University of Southern California.
Ioannou, P, Jula, H., Liu, C-I., Vukadinovic, K., Pourmohammadi, H. and Dougherty, Jr E. (2001) Advanced material handling: automated guided vehicles in agile ports. Final Report, University of Southern California.
Ioannou, P., Chassiakos, A., Zhang, J., Kanaris, A. and Unglaub, R. (2002) Automated container transport system between inland port and terminals. Project Report University of Southern California.
0 200 400 600 800 1000 1200 1400 1600 1800 2000 0 500 1000 1500 2000 Time (m in ) Distance (m) Alternative 1 (SC-RS) Alternative 2 (SC-MT-RS-TT) Alternative 3 (AGV-RS-TT) Alternative 4 (AGW)