1
Alma Mater Studiorum – Università di Bologna
DOTTORATO DI RICERCA
SCIENZE CARDIO-NEFRO-TORACICHE
30° Ciclo
Settore Concorsuale: 06/E1
Settore Scientifico Disciplinare: MED21
TITOLO
EVALUATION OF THE EFFECTIVENESS OF THE USE OF
ENDOBRONCHIAL ULTRASOUND GUIDED TRANSBRONCHIAL
NEEDLE ASPIRATION (EBUS-TBNA) FOR THE IDENTIFICATION OF
CHEMO-RESISTANCE MARKERS THROUGH GENOMIC
INVESTIGATION IN PATIENTS WITH NON-SMALL CELL LUNG
CANCER (NSCLC)
Presentata da: Dott.ssa JULIANA GUARIZE
Coordinatore Dottorato
Supervisore
Prof. Gaetano Domenico Gargiulo Prof. Sandro Mattioli
2 Acknowledgements
I would like to thank all the people who, in various ways, have accompanied me in this project.
First, I want to thank to my tutor, Professor Sandro Mattioli for the irrevocable contribution and patience. I thank Dr. Fabrizio Bianchi, Head of Cancer Biomarkers Unit of the Institute for Stem-cell Biology, Regenerative Medicine and Innovative Therapies - IRCCS - Casa Sollievo della Sofferenza, San Giovanni Rotondo - for the precious and crucial support.
Thanks to the colleagues that supported the clinical activity at the Division of Thoracic Surgery at the European Institute of Oncology, especially Dr. Stefano Donghi and Dr. Monica Casiraghi; the Department of Molecular Medicine, specially Dr. Manuela Vecchi, Elena Belloni, Elena Marino and Giovanni Bertalot for the inestimable contribution in the laboratorial activity; the Department of Pathology, especially Dr. Chiara Casadio, the cytopathologists and technicians and the Biobank for Translational Medicine at IEO for the technical support.
3 INDEX 1. INTRODUCTION 2. OBJECTIVES 3. METHODS 3.1 RETROSPECTIVE PHASE I 3.1.1 BACKGROUND 3.1.2 PATIENTS’ SELECTION 3.1.3 RESULTS 3.2 RETROSPECTIVE PHASE II 3.3 PROSPECTIVE STUDY 4. RESULTS 4.1 PRELIMINARY RESULTS I 4.2 PRELIMINARY RESULTS II 4.3 FINAL RESULTS 5. DISCUSSION 6. CONCLUSIONS 7. REFERENCES
4 1. INTRODUCTION
Lung cancer is the leading cause of cancer-related deaths in the developed world, accounting for 156,480 estimated cancer deaths in 2013 in the United States alone (1).
Approximately 85 to 90% of all cases of lung cancer are non–small-cell lung cancer (NSCLC). Despite increasing public awareness of tobacco-associated risk and recent improvements in early detection, about one third of patients present clinically evident metastatic disease that is not curable either by surgery or by combined modality therapy (2).
An additional one third of patients have locally advanced disease, and 80-85% of these patients will relapse with incurable metastatic disease in spite of treatment with aggressive multi-modality therapy (3).
With the advent of third-generation agents (taxanes, gemcitabine, vinorelbine, irinotecan) administered in combination with carboplatin or cisplatin, a significant increase in response rates, better tolerability and quality of life, was observed although without an improvement in overall survival (4-7).
Recent molecular targeted therapies using tyrosine-kinase inhibitors (TKI) or inhibitors of the receptor ALK (anaplastic lymphoma kinase), demonstrated that modern, molecularly targeted drugs can benefit patients with advanced lung cancer (8-10).
However, the complexity of the cancer genome and the relatively propensity of cancer cells to acquire molecular alterations highlights the need to search for cancer biomarkers which could suggest optimal treatment and identify novel drug targets (11).
Despite large studies devised to develop new strategies for early diagnosis to increase chemotherapy response and prognosis, mortality remains high and effective therapies for advanced lung cancer are still lacking (12). As known, is worldwide accepted that initial stages NSCLC patients (N0 and N1 disease) should be treated with anatomical surgical resection and complete mediastinal and hilar lymphadenectomy. Advanced stages (stage IIIB and stage IV) should be treated with definitive chemotherapy or chemo/radiotherapy (13,14). In contrast, the best treatment option for locally advanced disease (Stage IIIA – pN2) is still debated.
According to American College of Chest Physicians guidelines, Stage IIIA (pN2) patients should be treated with definitive chemo/radiotherapy (15) but several series suggests that tree modality treatment (induction chemotherapy, surgery followed by radiotherapy) could be the best treatment option. (16-21)
5
Analyzing the literature data about N2 NSCLC patients, we found that this group represents a heterogeneous group with different clinical presentation, and both prognosis and treatment strategies are usually based on the extension of the disease to the mediastinum.
As known, patients with stage IIIA (pN2) disease present a very different prognosis according to different grades of mediastinal involvement and according to response to chemotherapy. Thus, these patients could be divided into three different groups according to clinical presentation and prognosis.
The first group, the “occult N2” group, includes those without clinical lymph node involvement (N0) but with unexpected N2 disease discovered after surgery and complete mediastinal lymphadenectomy; these patients are usually treated with adjuvant therapies after complete surgical resection, reaching a 5-year overall survival (OS) up to 35% (16, 22).
The second group is an “unresectable” group of patients with “bulky N2” disease, treated only with definitive chemo-radiotherapy, and with a 5-year OS less than 10% (23).
The third group of patients, “potentially resectable N2” disease, presents a pathological proven mediastinal lymph nodes at the baseline clinical staging, and they have a poor outcome with 5-year OS up to 16% (24), even if resectable.
While surgical resection is still a matter of debate for this last group of patients, the disappointing results reached after either primary surgery alone or radiotherapy alone (25, 26) led induction chemotherapy (IC) to be considered to increase resectability with the final hope of improving long-term survival rates.
After a number of randomized and multi-institutional trials (27-29) testing new drugs and different combinations of surgery, chemotherapy and radiotherapy, there are enough positive results to state that IC followed by surgery was able to further complete resection (R0) and mediastinal downstaging, improving the long-term survival of 5% at 5 years from 40% to 45%, with low morbidity and mortality rates in experienced centers (30).
A better understanding of lung cancer biology and the discovery of novel cancer biomarkers are paramount to achieve effective therapies especially for patients with advanced NSCLC.
Recent studies showed that microRNA (miRNA) could be ideal candidate biomarkers for cancer prognosis since their dysregulation was found to correlate with the onset and progression of several malignancies including lung cancer (31, 32).
6
In terms of feasibility in NSCLC specimens and as previous reported, miRNA can be accurately analyzed in formalin-fixed paraffin-embedded (FFPE) and in fresh tissue biopsies (33).
In addition, miRNA are present in different biological fluids (blood, plasma, saliva and urine) and are altered in asymptomatic early stage lung cancer patients (34).
Different miRNA expression profiles were found to be associated with different lung cancer subtypes and there is evidence that miRNAs could play a role in targeted therapy in different oncological settings (35-37). Despite the potential clinical value of miRNA signatures, the clinical utility of identified signatures has yet to be demonstrated.
For many years, mediastinoscopy has been considered the gold standard for mediastinal staging with high sensitivity and accuracy, but the procedure was progressively underused due to the high invasiveness, risk of complications and the need to be performed in experienced centers (38).
In the last years, a minimally invasive convex probe endobronchial ultrasound (EBUS) with the ability to perform real-time transbronchial needle aspiration (TBNA) has been described with high accuracy for mediastinal and hilar lymph node staging. (39)
Since then, EBUS-TBNA have gradually changed the way to perform mediastinal staging and in a short period improved its value with new indications in lung cancer management, becoming a standard of care. (40) Recent studies showed that EBUS-TBNA provides adequate cytological specimens for lung cancer diagnosis and staging, including detection of the major genetic alterations identified in lung cancer: epidermal growth factor receptor-tyrosine kinase (EGFR) mutation status, anaplastic lymphoma kinase fusion genes (ALK), and Kirsten-ras oncogene homologue (KRAS) mutation status (41).
2. OBJECTIVES
The aim of this study was to evaluate the feasibility of a high-throughput miRNA expression profile analysis of lung cancer lymph nodal metastasis (pN2) using primary cell lines established from EBUS-TBNA samples. To validate the EBUS-TBNA miRNA profile, the results were compared with those obtained from formalin-fixed paraffin-embedded (FFPE) NSCLC surgical biopsies obtained from mediastinoscopies.
7
In particular, we want to investigate the genomic profile of tumor specimen from patients with locally advanced disease (stage IIIA - pN2), who are eligible to neoadjuvant chemotherapy. The identification of cancer gene networks involved in mechanisms of chemotherapy resistance will highlight possible novel cancer biomarkers and therapeutic targets to increase survival for lung cancer patients with locally advanced disease.
3. PATIENTS AND METHODS
Research involves two phases: a retrospective study included two different phases (PHASE I and II) and a prospective study.
3.1 RETROSPECTIVE STUDY – PHASE I
3.1.1 Study design
Retrospective analysis of a population of patients with NSCLC - locally advanced - Stage IIIA (pN2), who underwent mediastinoscopy or EBUS-TBNA for the cyto-histological characterization of mediastinal adenopathy and sub sequential induction chemotherapy and surgical resection. Chemotherapy was performed as induction regimens containing cisplatin for a mean of 3 cycles and consecutive surgery.
The main objective was to identify patients with a complete lymph node response after chemotherapy, valuating the ypN2 after the radical surgical resection and identify factors affecting response and survival rates.
3.1.2 Objectives
The aim of this retrospective phase I was to analyze a series of “potentially resectable” stage IIIA- pN2
NSCLC, pathologically confirmed by mediastinoscopy or EBUS-TBNA, undergoing cisplatinum-based- neoadjuvant - induction chemotherapy (IC) followed by surgery, to evaluate short and
long-8
term outcomes and to identify prognostic factors to improve survival and to investigate future therapies.
3.1.3 Patients and methods
A Retrospective analysis of a cohort of patients with radiologically - computer tomography (CT) and positron emission tomography (PET) suspected of NSCLC with a lymph node involvement (N2) but "potentially resectable” after IC, that underwent mediastinoscopy or EBUS-TBNA for confirmation of pathological N2 (pN2) followed by induction chemotherapy and surgery resection with complete mediastinal and hilar lymphadenectomy with radical intent.
3.1.4 Results
Two hundred and eight seven (287) patients were included into the study and treated with induction chemotherapy.
After a mean of 3 cycles of cisplatin-based chemotherapy regimens, patients were revaluated with CT scan.
One hundred and fourth one (141; 49%) patients from those 287 initially included, were subjected to surgery with radical intent as being considered radiologically “responder” to inductive treatment. One hundred twenty six (126) patients underwent radical surgery (15 patients underwent exploratory thoracotomies) - after a mean of 27 days from the last chemotherapy cycle and 113 patients had a complete radical surgery without residual disease (R0).
From 113 patients that underwent radical complete resection, 22 patients (17.5%) had a complete “N” response after chemotherapy evaluated by the number of lymph node stations (passing from an initial N2 to N0 disease confirmed by radical lymphadenectomy) and 8 patients (6.3%) had a complete answer also on the T (T0).
9
The overall mean survival was 24 months and 5-years survival was 30%.
Multivariate analysis shown that the number of CT cycles performed and the complete lymph node response (down staging) are independent prognostic factors of survival.
10
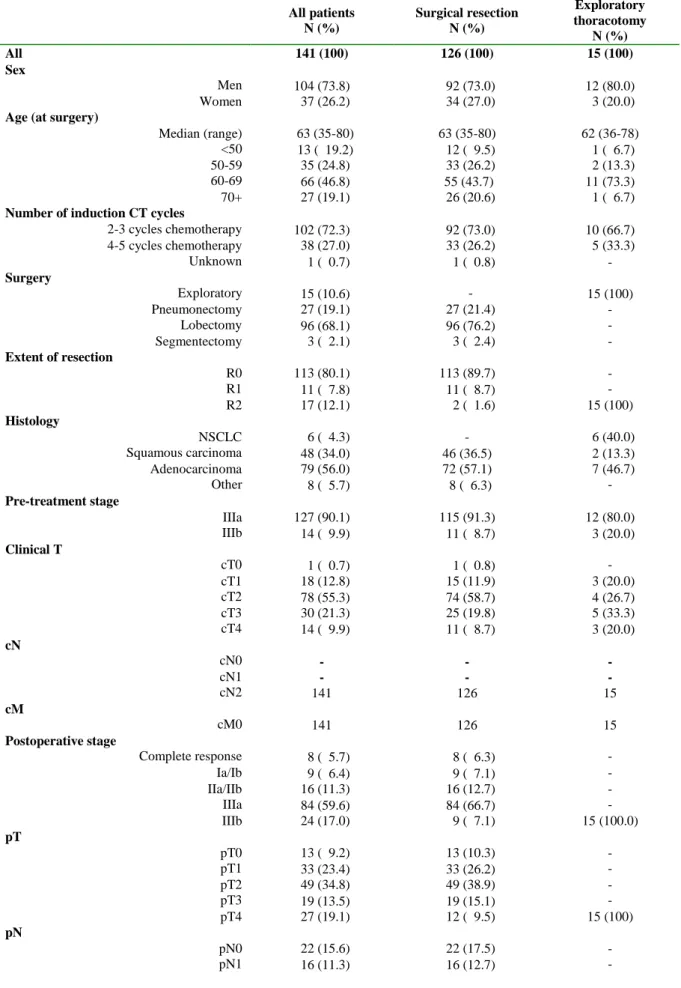
Table 1: Patients’ clinical, surgical and pathological characteristics
All patients N (%) Surgical resection N (%) Exploratory thoracotomy N (%) All 141 (100) 126 (100) 15 (100) Sex Men 104 (73.8) 92 (73.0) 12 (80.0) Women 37 (26.2) 34 (27.0) 3 (20.0)
Age (at surgery)
Median (range) 63 (35-80) 63 (35-80) 62 (36-78)
<50 13 ( 19.2) 12 ( 9.5) 1 ( 6.7)
50-59 35 (24.8) 33 (26.2) 2 (13.3)
60-69 66 (46.8) 55 (43.7) 11 (73.3)
70+ 27 (19.1) 26 (20.6) 1 ( 6.7)
Number of induction CT cycles
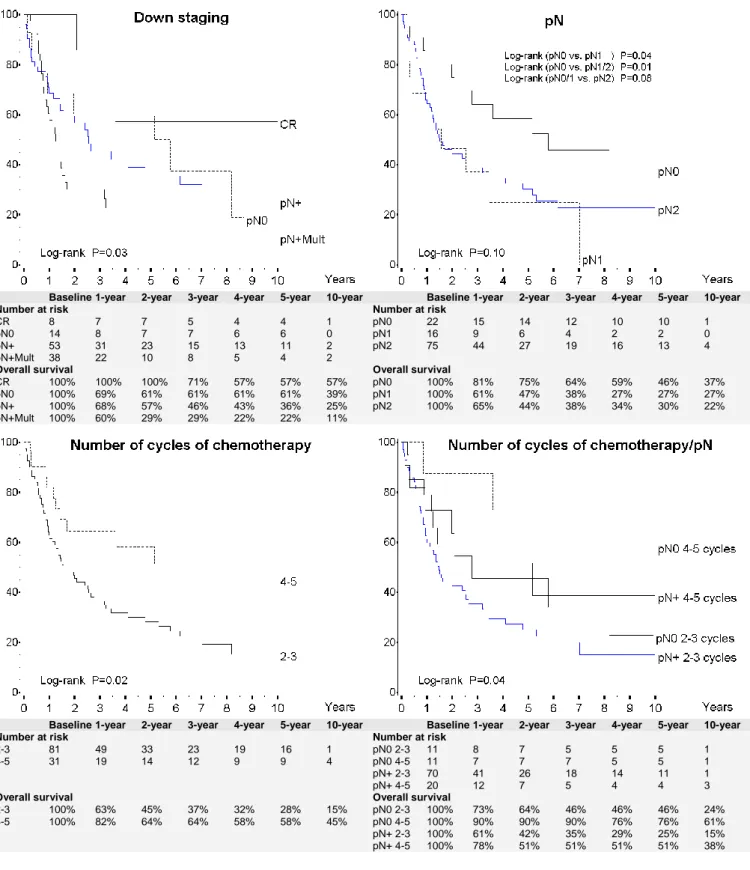
2-3 cycles chemotherapy 102 (72.3) 92 (73.0) 10 (66.7) 4-5 cycles chemotherapy 38 (27.0) 33 (26.2) 5 (33.3) Unknown 1 ( 0.7) 1 ( 0.8) - Surgery Exploratory 15 (10.6) - 15 (100) Pneumonectomy 27 (19.1) 27 (21.4) - Lobectomy 96 (68.1) 96 (76.2) - Segmentectomy 3 ( 2.1) 3 ( 2.4) - Extent of resection R0 113 (80.1) 113 (89.7) - R1 11 ( 7.8) 11 ( 8.7) - R2 17 (12.1) 2 ( 1.6) 15 (100) Histology NSCLC 6 ( 4.3) - 6 (40.0) Squamous carcinoma 48 (34.0) 46 (36.5) 2 (13.3) Adenocarcinoma 79 (56.0) 72 (57.1) 7 (46.7) Other 8 ( 5.7) 8 ( 6.3) - Pre-treatment stage IIIa 127 (90.1) 115 (91.3) 12 (80.0) IIIb 14 ( 9.9) 11 ( 8.7) 3 (20.0) Clinical T cT0 1 ( 0.7) 1 ( 0.8) - cT1 18 (12.8) 15 (11.9) 3 (20.0) cT2 78 (55.3) 74 (58.7) 4 (26.7) cT3 30 (21.3) 25 (19.8) 5 (33.3) cT4 14 ( 9.9) 11 ( 8.7) 3 (20.0) cN cN0 - - - cN1 - - - cN2 141 126 15 cM cM0 141 126 15 Postoperative stage Complete response 8 ( 5.7) 8 ( 6.3) - Ia/Ib 9 ( 6.4) 9 ( 7.1) - IIa/IIb 16 (11.3) 16 (12.7) - IIIa 84 (59.6) 84 (66.7) - IIIb 24 (17.0) 9 ( 7.1) 15 (100.0) pT pT0 13 ( 9.2) 13 (10.3) - pT1 33 (23.4) 33 (26.2) - pT2 49 (34.8) 49 (38.9) - pT3 19 (13.5) 19 (15.1) - pT4 27 (19.1) 12 ( 9.5) 15 (100) pN pN0 22 (15.6) 22 (17.5) - pN1 16 (11.3) 16 (12.7) -
11 pN2 103 (73.0) 88 (69.8) 15 (100) M M0 140 (99.3) 126 (100) 14 (93.3) M1 1 ( 0.7) - 1 ( 6.7) Adjuvant treatment None 50 (35.5) 47 (37.3) 3 (20.0) Chemotherapy 5 ( 3.5) 5 ( 4.0) - Radiotherapy 83 (58.9) 71 (56.3) 12 (80.0) Chemo-radiotherapy 3 ( 2.1) 3 ( 2.4) -
Table 2: Postoperative complications after radical surgery (126 patients) according to the number
of cycles of neoadjuvant chemotherapy*
ALL 2-3 cycles chemotherapy 4-5 cycles chemotherapy N (%) N (%) N (%) All patients 126 (100) 93 (73.8) 33 (26.2) MAJOR complications 14 (11.1%) 12 (12.9%) 2 (6.1%) ARDS/ pneumonia/ respiratory failure 6 (4.8%) 5 (5.4%) 1 (3.0%)
Rethoracotomy: 5 (4.0%) 5 (5.4%) - - Hemothorax 3 (2.4%) 3 (3.2%) - - Cardiac dislocation 1 (0.8%) 1 (1.1%) - - empyema 1 (0.8%) 1 (1.1%) - Fistula 2 (1.6%) 1 (1.1%) 1 (3.0%) Renal failure 3 (2.4%) 3 (3.2%) - Chylothorax 1 (0.8%) 1 (1.1%) - Gastric bleeding 1 (0.8%) 1 (1.1%) - MINOR complications 48 (38.1%) 32 (34.4%) 16 (48.5%) Arrhythmia 21 (16.7%) 14 (15.1%) 7 (21.2%) Anemia 18 (14.3%) 12 (12.9%) 6 (18.2%) Atelectasia/ FBS 7 (5.6%) 6 (6.5%) 1 (3.0%)
Prolonged air leak 10 (7.9%) 5 (5.4%) 5 (15.2%)
Dysphonia 1 (0.8%) 1 (1.1%) -
*several patients reported more than one postoperative complication.
12
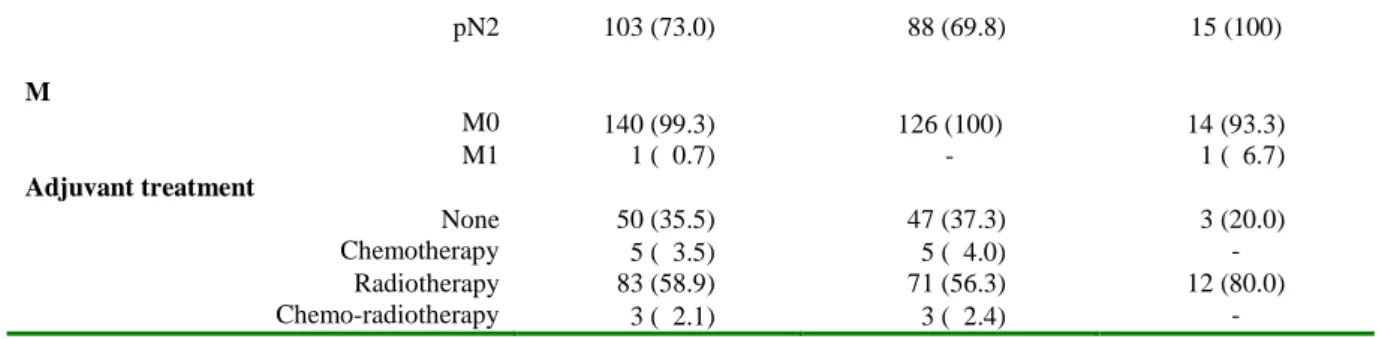
Table 3: Univariate analysis of the pre and post-surgery variables
Hazards Ratio
(95% CI) p-value Number of chemotherapy cycles
2-3 cycles chemotherapy 1.00 4-5 cycles chemotherapy 0.47 (0.26-0.85) 0.01 Surgery Pneumonectomy 1.00 Lobectomy 0.68 (0.41-1.13) 0.14 Segmentectomy 1.22 (0.28-5.22) 0.79 Extent of resection R0 1.00 R1/R2 1.39 (0.74-2.63) 0.31 Histology Adenocarcinoma 1.00 Squamous 1.29 (0.83-2.03) 0.26 Other 1.34 (0.53-3.41) 0.54 Pre-treatment stage IIIa 1.00 IIIb 1.42 (0.71-2.84) 0.32 Clinical T cT0/cT1* 1.00 cT2 1.59 (0.78-3.24) 0.20 cT3 1.28 (0.56-2.90) 0.56 cT4 2.00 (0.79-5.05) 0.14 Post-operative stage Complete response 1.00 Ia/Ib 1.84 (0.41-8.28) 0.42 IIa/IIb 3.00 (0.82-11.0) 0.10 IIIa 3.39 (1.05-10.9) 0.04 IIIb 10.6 (2.64-42.2) 0.0009 pT pT0 0.36 (0.13-0.98) 0.04 pT1 1.00 pT2 1.27 (0.72-2.23) 0.42 pT3 1.95 (1.00-3.81) 0.05 pT4 3.76 (1.71-8.28) 0.001 pN pN0 1.00 pN+ 2.10 (1.11-4.00) 0.02 pN0 1.00 pN+ 1.77 (0.90-3.49) 0.10 pN+ (multiple N2) 2.72 (1.36-5.44) 0.005 Adjuvant treatment None 1.00 Chemotherapy 1.03 (0.25-4.38) 0.96 Radiotherapy 1.10 (0.69-1.76) 0.68 Chemo-radiotherapy 1.58 (0.37-6.71) 0.53
Hazards ratios and 95% confidence intervals (CIs) obtained from univariate Cox proportional hazards regression model.
13
Table 4: Univariate and multivariate analysis
Univariate Multivariate
Variable HR (95% CI) P-value HR (95% CI) P-value
PN+ (multiple N2) 1.00 1.00 PN+ 0.65 (0.41-1.04) 0.07 0.57 (0.35-0.92) 0.02 PN0 0.37 (0.18-0.74) 0.005 0.40 (0.20-0.80)* 0.01 2-3 cycles CT 1.00 1.00 4-5 cycles CT 0.47 (0.26-0.85) 0.01 0.46 (0.25-0.85) 0.01
*the multivariate risk estimate is HR=0.54 (95%CI 0.25-1.19) for patients pN0 with residual disease and HR=0.23 (95%CI 0.07-0.77) for patients who achieved a complete pathological response (pN0 and pT0).
14
Figure 1: Overall survival of all 141 patients according to extent of resection (A,B). Figure 1C
shows the overall survival of 146 patients who were not candidates for surgery but had definitive chemotherapy or chemo/radiotherapy
A) B)
Baseline 1-year 2-year 3-year 4-year 5-year 10-year Baseline 1-year 2-year 3-year 4-year 5-year 10-year Number at risk Number at risk
All 141 86 59 42 31 27 5 R0 113 68 47 35 28 25 5
R1/R2 13 9 6 4 2 1 0
Exploratory 15 9 6 3 1 1 0
Overall survival Overall survival
All 100% 68% 50% 41% 33% 30% 19% R0 100% 68% 50% 43% 38% 35% 23%
R1/R2 100% 76% 58% 42% 21% 10% - Exploratory 100% 65% 50% 25% 8% 8% -
C)
Baseline 1-year 2-year 3-year 4-year 5-year 10-year Number at risk CT 82 31 13 8 5 3 0 CT+/-RT* 53 33 18 13 5 2 0 Overall survival CT 100% 54% 29% 18% 13% 8% - CT+/-RT* 100% 69% 41% 29% 21% 16% -
15
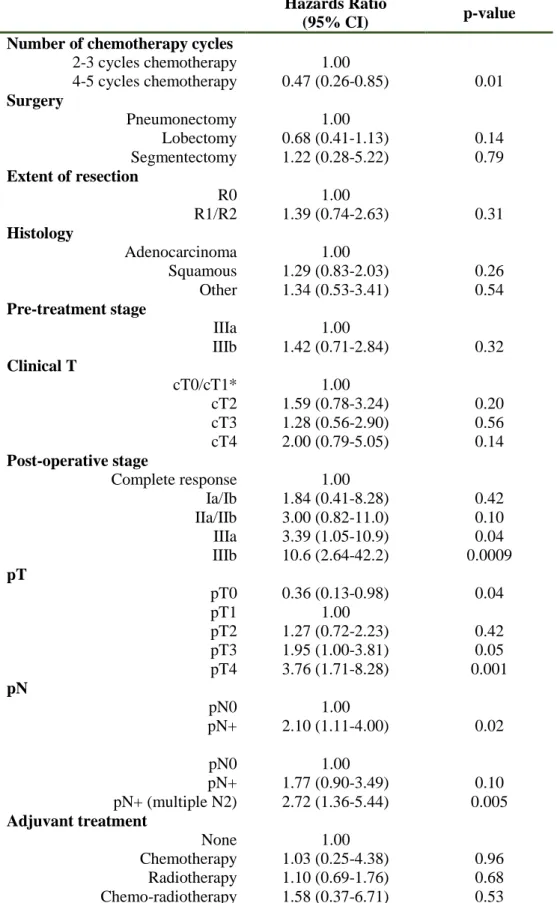
Figure 2: Overall survival of 113 patients after R0 resection according to selected characteristics:
downstaging, pN after resection, number of cycles of chemotherapy and number of cycles of chemotherapy and pN
Baseline 1-year 2-year 3-year 4-year 5-year 10-year Baseline 1-year 2-year 3-year 4-year 5-year 10-year Number at risk Number at risk
CR 8 7 7 5 4 4 1 pN0 22 15 14 12 10 10 1
pN0 14 8 7 7 6 6 0 pN1 16 9 6 4 2 2 0
pN+ 53 31 23 15 13 11 2 pN2 75 44 27 19 16 13 4
pN+Mult 38 22 10 8 5 4 2
Overall survival Overall survival
CR 100% 100% 100% 71% 57% 57% 57% pN0 100% 81% 75% 64% 59% 46% 37%
pN0 100% 69% 61% 61% 61% 61% 39% pN1 100% 61% 47% 38% 27% 27% 27%
pN+ 100% 68% 57% 46% 43% 36% 25% pN2 100% 65% 44% 38% 34% 30% 22%
pN+Mult 100% 60% 29% 29% 22% 22% 11%
Baseline 1-year 2-year 3-year 4-year 5-year 10-year Baseline 1-year 2-year 3-year 4-year 5-year 10-year Number at risk Number at risk
2-3 81 49 33 23 19 16 1 pN0 2-3 11 8 7 5 5 5 1
4-5 31 19 14 12 9 9 4 pN0 4-5 11 7 7 7 5 5 1
pN+ 2-3 70 41 26 18 14 11 1
pN+ 4-5 20 12 7 5 4 4 3
Overall survival Overall survival
2-3 100% 63% 45% 37% 32% 28% 15% pN0 2-3 100% 73% 64% 46% 46% 46% 24%
4-5 100% 82% 64% 64% 58% 58% 45% pN0 4-5 100% 90% 90% 90% 76% 76% 61%
pN+ 2-3 100% 61% 42% 35% 29% 25% 15% pN+ 4-5 100% 78% 51% 51% 51% 51% 38%
16 3.2 RETROSPECTIVE STUDY – PHASE II
Departing from the results of the first retrospective phase study, we decide to evaluate the possibility of predicting the oncological results obtained in patients with full chemotherapy response that showed the best surprising 5-year survival.
For this purpose, in order to evaluate the presence of a predictive genetic different signature in patients responsive to chemotherapy, we performed DNA, RNA and microRNA extraction from a group of mediastinoscopy FFPE specimens in patients that underwent the multimodal treatment described in the phase I.
3.2.1 DNA and RNA extraction
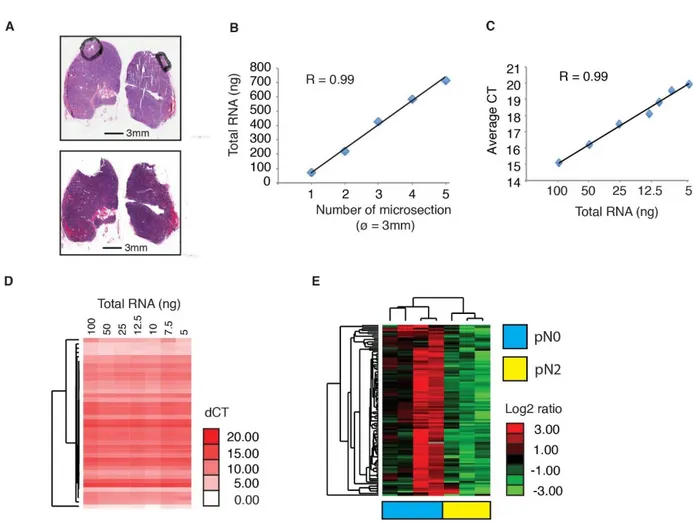
RNA extraction using FFPE specimens was performed with the All-Prep DNA/RNA FFPE kit (Qiagen) to extract both total RNA (including miRNA) and DNA from micro-fiber FFPE tissue sections (Fig 3A).
The extraction was subsequently performed from different amounts of micro-dissected tissue in order to optimize and establish the RNA quantity. The results of RNA extraction according to different quantity of micro-dissected tissue is shown in figure 3B.
Different amounts of total RNA extracted were retro-transcript to determine the minimum quantity of material required to obtain a reliable TLDA (Taqman low-density array) miRNA profile (Figure 3C).
We verified that even at low total RNA amount in the retro-transcription reaction input (5 ng) the miRNA profile obtained was equivalent to other profiles obtained from a panel of 42 controls miRNA (figure 3D) showing that the analysis is reliable also in very small amount of tissue samples.
17
3.2.2 Evaluation of miRNA expression
We used the optimized protocol to identify the miRNA expression in an initial series of seven patients with NSCLC (Stage IIIA – pN2) treated with neoadjuvant chemotherapy followed by radical surgical resection.
Four patients had a complete lymph node downstage after chemotherapy, with a pN0 after radical surgery – those patients were considered “responders” to chemotherapy.
Three patients had no lymph node downstage after induction chemotherapy and remained pN2 after surgery – those patients were considered “not-responders”.
3.2.3 "Proof-of-principle" experimental results
We profiled 378 miRNAs and 105 of these were detected in at least 6 of the 7 patients.
The hierarchical clustering analysis revealed a clear separation of “responders” (pN0 after surgery) from “non-responders” (pN2 after surgery) patients, based on the expression profile of this miRNA series (Figure 3E).
These results supported the feasibility of identifying a “signature” of miRNA that could be involved in the chemotherapy response in patients with Stage IIIA NSCLC.
18
Figure 3.
Figure 3: A) Two hematoxylin-eosin-stained microscopic images of the same tissue sample before (mediastinal lymphnodes) and after (below) microdissection of the tissue area containing tumor cells. Scale bars are shown below the pictures (black bar). B) Total RNA extracted from increasing numbers of tissue microsections (3 mm in diameter). C) Quantitative real-time PCR analysis of miRNAs using increasing amounts of total RNA input extracted from microdissected FFPE tissue sections (CT, threshold cycle; average CT, average of 42 miRNAs used as control). D) Hierarchical clustering analysis of miRNA expression profiles obtained using different amounts of total RNA as in (C). E) Hierarchical clustering analysis of 105 miRNA expression profiles of a first set of mediastinoscopies of patients with stage IIIA lung cancer, before induction chemotherapy (color codes indicate chemosensitive patients, pN0 (blue), or chemoresistant patients, pN2 (yellow).
19
3.3 PROSPECTIVE STUDY
3.3.1 Background
Departing from the results of the retrospective phase of the study and considering that nowadays all patients with suspect NSCLC with mediastinal involvement underwent EBUS-TBNA to confirm the pathological data, the prediction of response to chemotherapy should be ideally predicted in this seating to better identify patients who can benefit from the neoadjuvant treatment followed by surgery.
3.3.2 Objectives
To evaluate the feasibility of culture cell lines obtained from EBUS-TBNA specimens and the DNA and RNA extraction and consecutive high-throughput miRNA expression profile analysis of lung cancer lymph nodal metastasis.
To validate the EBUS-TBNA miRNA profile, the results were compared with those obtained from formalin-fixed paraffin-embedded (FFPE) NSCLC surgical biopsies obtained from a series of mediastinoscopies.
3.3.3 Patients and Methods
3.3.3.1 Patients selection
Patients with suspect Stage IIIA - NSCLC that underwent routine EBUS-TBNA for the diagnosis of suspect lymph node metastasis (pN2) were included into the study.
20
All patients were evaluated with computer tomography (CT) and positron emission tomography (PET) before EBUS-TBNA procedures. Mediastinal lymph nodes were considered suspected when the short axis was larger than 10 mm and there were a PET scan uptake.
Cytological specimens were collected for NSCLC epithelial cell culture and subsequent transcriptomic miRNA expression analysis.
3.3.3.2 EBUS-TBNA procedures
EBUS-TBNA was performed under local anaesthesia (1% lidocaine) and moderate sedation provided by an anaesthesiologist with spontaneous ventilation. All procedures were performed using a convex-probe (EBUS Convex Probe BF-UC180F; Olympus) and a dedicated ultrasound processor (EU-ME2; Olympus).
EBUS-TBNA specimens were collected with a 22 gauge dedicated needle (Vizishot NA-201SX-4022; Olympus).
A very small amount of the aspirated material was pushed out by the internal stylet and smeared onto glass slides for immediate on-site evaluation (Rapid on Site Evaluation – ROSE) provided by the cytopathologist.
The remaining aspirate and other needle passages were put into saline solution for cell block processing and histological evaluation.
One dedicated needle passage was put separated into a culture basal medium for primary cell cultures.
21
3.3.3.3 EBUS-TBNA primary cell culture
The dedicated EBUS-TBNA specimen was processed within 30 minutes after the end of the procedure and placed in a sterile falcon filled with 5 ml of cell culture basal medium Ham’s F12/DMEM 1:1 supplemented with 1% foetal bovine serum, 50ng/ml L-glutamine, 100U/mL penicillin, 100μg/mL streptomycin, 10μg/mL gentamicin, 0.5 μg/mL amphotericin B, 10μg/mL human transferrin, 1 μg/mL human insulin, 1μg/mL hydrocortisone, 10mM Hepes pH 7.5, 50μM L-ascorbic acid, 15nM sodium selenite, 0.1mM ethanolamine, and 50 ng/mL cholera toxin.
EBUS-TBNA samples were spun down for 5 min at 1000g at RT, resuspended in 3 ml of complete medium further supplemented with 10nM epidermal growth factor EGF, 35μg/mL bovine pituitary extract, and 10nM triiodothyronine, and cultured on six-well collagen I-coated plates (Collagen Cellware, Biocoat, Corning) in a humidified incubator with 5% CO2.
Primary cells were grown for six to 12 days and washed twice with PBS prior to total RNA extraction.
3.3.3.4 Immunofluorescence
Immunofluorescence was used to check the expression of lung epithelial (CCA, for bronchiolar epithelium, and SP-C for alveolar epithelium) and neuroendocrine (chromogranin A) markers on EBUS-derived and plated cells.
All the following steps were carried out at room temperature. Permeabilization was achieved with 0.2% BSA, 0.1% Triton, and 1x PBS for 10 min, followed by one wash with 1x PBS.
Blocking was carried out with 2% BSA for 30 min. Primary antibodies were added and left for 1h. Following two washes with 1x PBS, secondary antibodies were added for 30 min (light protected),
22
then another two washes with 1x PBS were performed. Post-fixing was achieved with 2% PFA for 1 min, followed by DAPI staining for 5 min and another two washes with 1x PBS.
A final post-fixing was done with 2% PFA followed by one final wash with 1x PBS.
Slides were mounted and analyzed.
The following antibodies were used: CCA, goat polyclonal raised against a peptide mapping near the mouse protein C-terminal (CC10 T-18, Santa Cruz Biotechnologies, sc-9772), dilution 1:400; secondary antibody, donkey anti goat Cy3, dilution 1:400; SP-C, rabbit polyclonal raised against a.a. 1-20 from human protein N-terminal (Anti-Prosurfactant Protein C, pro-SP-C, Millipore, AB3786), dilution 1:1000; secondary antibody, donkey anti rabbit Alexa 647, dilution 1:100; chromogranin A, rabbit polyclonal raised against the human protein C-terminal (Abcam, Ab15160), dilution 1:100; secondary antibody, donkey anti rabbit Alexa 647, dilution 1:100.
3.3.3.5 RNA/miRNA extraction and quantitative real-time PCR analysis
The total RNA was extracted from EBUS-TBNA primary cells using the All-Prep
DNA/RNA/miRNA Universal Kit and from FFPE tissue samples obtained by mediastinoscopy using the All-Prep DNA/RNA FFPE Kit, both protocols automated on QIAcube, according to the manufacturer's instructions (Qiagen, Hilden, Germany).
Following histological assessment of each FFPE tissue block, RNA was extracted from micro-dissected areas of one to two tissue sections (5-10 μm thick) on glass slides with adequate tumor cellularity (>60%), selected by a pathologist.
Total RNA (200 ng) extracted from EBUS-TBNA-derived primary cells was measured using the NanoDrop® ND-1000 spectrophotometer and reverse transcribed with the SuperScript VILO
23
cDNA Synthesis Kit (Thermo Fisher Scientific) in 20 μl of final volume and 5 ng of cDNA/reaction were analysed by PCR.
Quantitative PCR was performed using UPL probes (Universal ProbeLibrary; Roche) and primers specific for KRT5 and KRT14 (expressed in epithelial basal cells), KRT18 (expressed in bronchial and alveolar epithelium), or PTPRC and PECAM-1 (expressed in endothelial cells), or PDGFRB (expressed in mesenchymal cells) and LCP2 (expressed in lymphocyte), in a final volume of 15 μl of LightCycler 480 Probe Master mix (Roche).
UPL probe and primer combinations specific for each target were designed with the free web-based ProbeFinder Software (Roche) and reported in Supplemental Table 1.
Real-time quantitative PCR analysis (qPCR) reaction was run in a LightCycler 480 real-time PCR instrument (Roche) in 96 wells format, using the following thermal cycling conditions: 95°C for 10 min, followed by 45 cycles of 95°C for 10 s and 72°C for 60 seconds and final cooling at 40°C for 30 s.
For each miRNA target in each sample, the expression level was measured in triplicate and the average Cq was calculated. Data (average Cq) were normalized to the average Cq value of the two endogenous reference genes (GAPDH and GUSB) using the 2-ΔCq method.
For miRNA expression analysis, 10 ng of total RNA, measured using the Quant-iT™ RiboGreen® RNA Assay kit (Thermo Fisher Scientific), were reverse transcribed with Megaplex™ miRNA-specific stem-loop RT Primers Human Pool A v2.1 (Thermo Fisher Scientific) and TaqMan® MicroRNA reverse transcription kit (Thermo Fisher Scientific) according to the manufacturer’s instructions; 5μl of reverse transcribed product were pre-amplified for 14 cycles using the TaqMan PreAMP Mastemix and Megaplex PreAMP primers PoolA v 2.1 according to the manufacturer’s instructions (Thermo Fisher Scientific).
24
The PCR reaction was performed using the TaqMan Universal Master Mix II, No AmpErase UNG (ThermoFisher Scientific) by loading 100 μl of the pre-amplified mixture (final dilution 1:200) in each of the eight lanes of the TaqMan® Low Density Array miRNA PanelA v 2.0 (ThermoFisher Scientific).
Real-Time PCR was carried out on the ViiA7 Real-Time PCR System (Thermo Fisher Scientific) using the manufacturer’s recommended cycling conditions (50°C for 2 min, 95°C for 10 min, followed by 40 cycles at 95°C for 15 s and 60°C for 1 min) and setting an automatic threshold. Cq data of miRNAs were normalized using the RNU6-1 as housekeeping gene.
Normalized Cq (Cqn) were calculated as previously described (42). Hierarchical clustering analysis was performed using Cluster 3.0 for Mac OS X (http://bonsai.hgc.jp/wmdehoon/software/clus- ter/) and Java Treeview (http://jtreeview.sourceforge.net). Spearman rank correlation and centroid clustering methods were used on Cqn data.
4. RESULTS
4.1 Preliminary results I
The immunofluorescence analysis using known markers of alveolar and neuroendocrine cells constituting the airway epithelium confirmed the lung origin of the established EBUS primary cell lines (Figure 4A). Real-time quantitative PCR analysis (RT-qPCR) revealed a high expression of epithelial markers in EBUS-derived primary cell lines which was almost absent in the EBUS-TBNA specimen (Figure 4B), while the EBUS-TBNA samples were positive to the expression of non-epithelial markers (Figure 4B).
As a control, the expression of non-epithelial markers was checked in two commercial cell lines of non-epithelial origin (HL60 and HUVEC) and proved positive (Figure 4C).
25
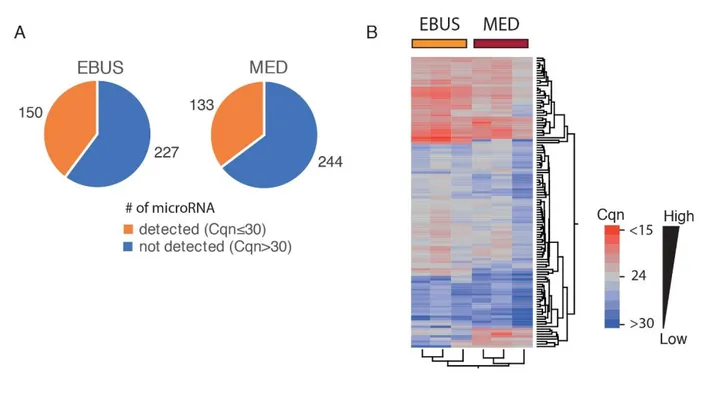
These data confirmed the successful establishment of lung epithelial cells from EBUS-TBNA specimens and the analysis of the miRNA expression profile of three independent EBUS-TBNA primary cell lines using TaqMan® Array Human MicroRNA Card A, allowed the screening of 377 different human miRNAs; 150 miRNAs (~40% of the total analysable) were detected (with Cqn≤30) in all three cell lines. Relative quantities of miRNAs detected in all three EBUS-primary cell lines ranged from 22 to 27 Cqn (i.e. the 25th and 75th quartile intervals) (Figure 5A).
The analysis of the miRNA expression profile of micro-dissected formalin-fixed lung cancer tissue – FFPE mediastinoscopy samples (MED) evaluated in also 3 cases, compared with the profile of EBUS-primary cells (Figure 5A) showed a slight decrease in the average number of miRNA detected (i.e. with Cqn≤30) in all three FFPE samples (133 vs. 150; Figure 5A). This was probably due to a partial degradation of some miRNA species in FFPE samples.
A total of 117 miRNA (~78% in EBUS-TBNA primary cell lines and ~88% of FFPE mediastinoscopies) were commonly detected in all samples analysed (with Cqn≤30), confirming a strong similarity of the two miRNA profiles as also shown in hierarchical cluster analysis (Figure 5B).
26
27
Figure 4) A. Immunofluorescence analysis of primary cell lines obtained from two EBUS-TBNA
samples. Left: expression of the Clara cell–specific marker (CCA) and surfactant protein C (SP-C) indicates bronchoalveolar cells in the EBUS specimen of a lung adenocarcinoma. Right: expression of chromogranin indicates neuroendocrine cells in the EBUS specimen of a lung adenocarcinoma with neuroendocrine features. Below, visible microscope analysis representing the morphology of the two cell lines obtained; the neuroendocrine cells appeared with the characteristic spindle-shaped morphology. B. qPCR analysis of a panel of genes expressed preferentially in non-epithelial cells (i.e. non-epithelial marker) or epithelial cells (i.e. epithelial markers). In blue, gene expression level in all EBUS-TBNA samples. In red, gene expression level in the established primary cell lines. C. qPCR analysis of two commercial cell lines of non-epithelial origin used as control: HL60 (promyeloblast cell type) and HUVEC (endothelial cell type). Normalized expression refers to the expression of genes normalized to the average of the expression of GUSB and GAPDH (i.e. the -dCT), used as housekeeping genes.
28
FIGURE 5.
Figure 5) A. Pie charts of the number of detected (Cqn≤30; in orange), or undetected (Cqn>30; in
blue) microRNA in all the primary cells obtained from EBUS (N=3) or in all mediastinoscopy FFPE samples, i.e. “MED” samples (N=3). B. Hierarchical cluster analysis of the expression profile of the 117 commonly detected miRNAs in EBUS (N=3) and MED samples (N=3). Heat map indicates the expression level of each individual miRNA analyzed. Normalized Cq values were colour-coded and described by the scale bar.
29
4.2 Preliminary results II
The first analysis of microRNA extraction in an initial cohort of seven patients, showed a strong different miRNA profile between patients responders to chemotherapy and patients not-responders.
Figure 6.
Figure 6. A. Cluster analysis of all the microRNAs expressed (N=174) in the EBUS samples. B. Subset of microRNAs most discriminating between responder/partial responder vs. not responder patients to neoadjuvant chemotherapy.
30
In yellow, more expressed microRNAs. In blue, less expressed microRNA. Value of microRNAs expression were log2 transformed before clustering; color codes indicate relative microRNAs expression.
4.3 Final results
A total of 82 patients underwent EBUS-TBNA for the confirmation of pathological lymph node involvement (Stage IIIA - pN2 NSCLC).
In 38 (46.3%) was possible to obtain primary lung cancer cell cultures and in 19 (23.2%) patients was possible to proceed with consecutive DNA, RNA extraction and microRNA profiling. The percentage of success of RNA extraction from primary EBUS-TBNA epithelial cell cultures was about 50%.
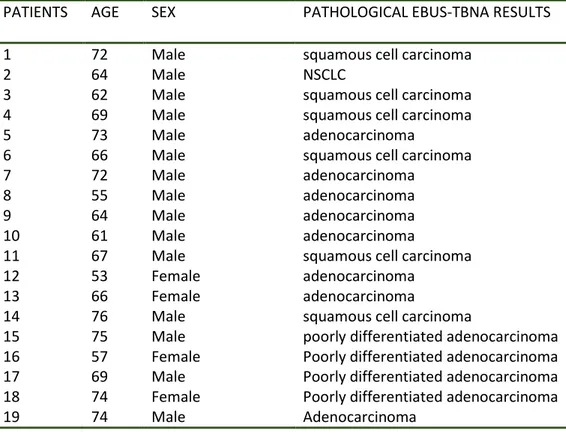
Table 5 shows patients’ characteristics and pathological EBUS-TBNA results.
Ten (10) out of 19 (53%) patients completed the treatment with neoadjuvant chemotherapy and surgery being possible to evaluate the lymph node down staging after surgery.
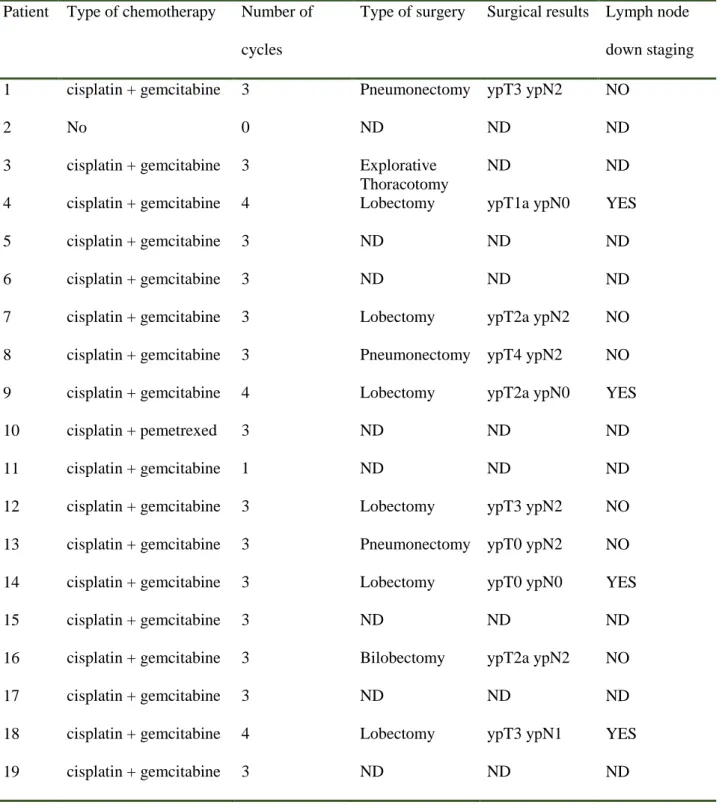
Table 6 shows the type and number of chemotherapy cycles and the final follow-up with the lymph node down staging after surgery.
Table 7 shows the quantity of DNA and RNA extracted from each EBUS-TBNA primary culture cells sample.
MicroRNA expression profile results:
Analysis of the miRNA expression profile of three independent EBUS-TBNA-derived primary cell lines using TaqMan® Array Human MicroRNA Card A allowed the screening of 377 different human miRNAs; 150 miRNAs (~40% of the total analyzable) were detected (with Cqn≤30) in all three cell lines. Relative quantities of miRNAs detected in all three EBUS-primary cell lines ranged from 22 to 27 Cqn (i.e. the 25th and 75th quartile intervals).
31
To better homogenise the casuistic, we compared the results of miRNA profile founded in EBUS-TBNA primary cell cultures with 10 cases of FFPE from mediastinoscopies (5 responders and 5 not-responders). The results of the analysis showed a strong similarity between the two profiles.
A total of 117 miRNA (~78% in EBUS-TBNA primary cell lines and ~88% of FFPE
mediastinoscopies) were commonly detected in all samples analysed (with Cqn≤30), confirming a strong similarity of the two miRNA profiles as also shown in hierarchical cluster analysis.
A series of 13 most promising differentially expressed miRNA were identified and highlighted in a comparison table that is shown in figure 7.
Figure 8 shows the hierarchical clustering of microRNA expression profile of 117 microRNA commonly expressed in EBUS-TBNA biopsy specimens (N = 20) – on the left - or mediastinoscopy (MED) – on the right. The heat map indicates the level of expression (log2 Ratio) of each single microRNA (green, less expressed, red, more expressed) in the analyzed samples. Bottom, yellow samples of patients who responded to neoadjuvant therapy and in black those who did not respond. Figure 9 shows the hierarchical clustering expression profile of a 13 differentially expressed microRNA (p <0.05) set in EBUS-TBNA samples of patients responders to neoajuvant chemotherapy vs. not-responders. On the left, the expression level logic (log2 Ratio) of each single microRNA (green, less expressed, red, more expressed) in the EBUS-TBNA samples. On the right, heatmap of the expression profile in the mediastinoscopy samples (MED). Bottom, yellow samples of patients who responded to neoadjuvant chemotherapy, while in black those who did not respond.
32
Table 5. Patient’s characteristics and EBUS-TBNA pathological results
PATIENTS AGE SEX PATHOLOGICAL EBUS-TBNA RESULTS
1 72 Male squamous cell carcinoma
2 64 Male NSCLC
3 62 Male squamous cell carcinoma
4 69 Male squamous cell carcinoma
5 73 Male adenocarcinoma
6 66 Male squamous cell carcinoma
7 72 Male adenocarcinoma
8 55 Male adenocarcinoma
9 64 Male adenocarcinoma
10 61 Male adenocarcinoma
11 67 Male squamous cell carcinoma
12 53 Female adenocarcinoma
13 66 Female adenocarcinoma
14 76 Male squamous cell carcinoma
15 75 Male poorly differentiated adenocarcinoma 16 57 Female Poorly differentiated adenocarcinoma 17 69 Male Poorly differentiated adenocarcinoma 18 74 Female Poorly differentiated adenocarcinoma
33
Table 6. Type and number of chemotherapy cycles and follow-up after surgery
Patient Type of chemotherapy Number of cycles
Type of surgery Surgical results Lymph node down staging 1 cisplatin + gemcitabine 3 Pneumonectomy ypT3 ypN2 NO
2 No 0 ND ND ND
3 cisplatin + gemcitabine 3 Explorative Thoracotomy
ND ND
4 cisplatin + gemcitabine 4 Lobectomy ypT1a ypN0 YES
5 cisplatin + gemcitabine 3 ND ND ND
6 cisplatin + gemcitabine 3 ND ND ND
7 cisplatin + gemcitabine 3 Lobectomy ypT2a ypN2 NO 8 cisplatin + gemcitabine 3 Pneumonectomy ypT4 ypN2 NO 9 cisplatin + gemcitabine 4 Lobectomy ypT2a ypN0 YES
10 cisplatin + pemetrexed 3 ND ND ND
11 cisplatin + gemcitabine 1 ND ND ND
12 cisplatin + gemcitabine 3 Lobectomy ypT3 ypN2 NO 13 cisplatin + gemcitabine 3 Pneumonectomy ypT0 ypN2 NO 14 cisplatin + gemcitabine 3 Lobectomy ypT0 ypN0 YES
15 cisplatin + gemcitabine 3 ND ND ND
16 cisplatin + gemcitabine 3 Bilobectomy ypT2a ypN2 NO
17 cisplatin + gemcitabine 3 ND ND ND
18 cisplatin + gemcitabine 4 Lobectomy ypT3 ypN1 YES
34
Table 7. Total quantity of DNA and RNA extracted from each EBUS-TBNA cell cultures misured
with Ribogreen (for RNA) and Picogreen (for DNA).
Patients [RNA](ng/ul) TOT RNA(ng) [DNA] (ng/ul) TOT DNA(ng)
1 30,87 1698 2,98 298 2 6,23 62,9 0,4 40 3 72,86 4007 6,92 692 4 54,67 3006 5,92 592 5 9,50 95,05 0,338 33,8 6 38 2090 3,66 366 7 6,05 60,51 0,106 10,6 8 175,67 9661 23,2 2320 9 15,64 859,95 2,28 228 10 9,84 541,03 1,87 187 11 142,91 8574,6 6,94 694 12 3,16 31,63 0,29 29 13 209,75 11536,28 19,7 1970 14 3,62 199,33 0,174 17,4 15 18,63 1024,82 1,71 171 16 161,14 8862,75 100 10000 17 165,12 9081,77 30,2 3020 18 328 19680 47,4 4740 19 38,28206837 2296,924102 4,86 486
35
Figure 7. Normalized expression data (small-nuclear RNA - U6 - was used as housekeeping) of the
13 microRNAs in EBUS (above) and MED (below) samples. Data is shown in CQ (quantification - real-time qPCR- cycle value) form. The statistical significance of the expression difference in “risponders” compared to “not-risponders” patients is reported on the right (p-value; Student's “t” test), along with the mean difference in logarithmic expression (Log2 Ratio).
RESPONSE NO NO NO NO NO YES YES YES YES YES
ID MED#1 MED#2 MED#3 MED#4 MED#5 MED#6 MED#7 MED#8 MED#9 MED#10 p-value MED Log Ratio
MIR_#89 26,1429991 27,9314991 25,5682497 22,9697499 23,9257497 21,5402504 22,7422495 20,3365005 23,8287499 22,9022508 0,02071496 -2,83 MIR_#60 27,1230005 28,1394993 26,6832495 23,3427491 24,3837499 20,7122493 20,2242498 19,6035007 22,4837506 20,3232503 0,00084831 -6,36 MIR_#99 28,8870005 29,945499 27,9552507 26,2897496 24,2657499 30,01 30,01 25,1045002 26,8147499 26,6212507 0,86658374 -1,14 MIR_#2 23,4539999 26,3005005 23,6412496 23,1687493 22,8657503 20,9552494 21,4302492 20,2204994 23,2457497 24,51825 0,10815284 -2,02 MIR_#70 22,3560003 23,1685005 20,0362501 20,2727494 21,6627511 18,6472507 20,9292498 17,5844997 18,5737488 20,9942499 0,04570609 -3,02 MIR_#88 26,9320006 29,6084991 26,30025 27,8327508 25,1937513 23,9182506 25,2002497 22,9295009 26,4557507 27,4642492 0,1120981 -1,73 MIR_#105 28,0899996 29,9715 28,99825 27,4777493 27,6357507 30,01 26,6602507 24,3195003 26,5707504 25,6812501 0,12707552 -1,52 MIR_#49 27,1359991 27,9505001 26,6422491 24,7397504 25,8897504 24,1552501 24,6332502 20,040501 25,3887493 25,70225 0,06436649 -2,01 MIR_#36 25,1109995 25,9584995 22,6342497 23,2477498 24,3127508 20,8862491 21,2732496 19,1684994 22,3697502 22,7832494 0,00969718 -3,04 MIR_#10 24,3649992 25,0384994 23,8652506 23,07375 22,8097505 21,7222496 21,3882494 19,4904999 22,8237488 22,4972501 0,01361007 -2,14 MIR_#113 25,6319994 27,9344994 25,3762502 24,46275 24,9817514 22,5932499 22,5092497 21,2785 25,1227505 24,7362504 0,03259979 -2,78 MIR_#1 21,0209994 22,9234997 21,7992506 19,9007497 21,3707513 18,9532505 19,7922506 17,783501 20,4107506 20,4702497 0,02622825 -1,58 MIR_#95 18,8579992 20,2464996 18,9622507 19,488749 19,2507505 15,9552494 17,7642508 16,0184997 17,4807503 20,7842508 0,0894594 -1,77
RESPONSE NO NO NO NO NO NO YES YES YES YES
ID EBUS #1 EBUS #2 EBUS #3 EBUS #4 EBUS #5 EBUS #6 EBUS #7 EBUS #8 EBUS #9 EBUS #10 p-value EBUS Log Ratio
MIR_#89 24,2580358 24,8715358 24,2430358 22,8735358 23,8032858 24,1566978 22,1710358 23,4685358 22,7895358 21,6660308 0,01092948 -1,72 MIR_#60 22,4240358 22,8415358 23,4910358 21,6895358 23,6232858 24,8637988 21,9290358 21,6835358 20,6565358 19,6132118 0,01417213 -2,00 MIR_#99 23,7460358 23,2215358 23,3110358 22,5815358 23,9952858 21,7095478 22,7040358 21,3115358 20,4155358 20,9995048 0,01633716 -2,11 MIR_#2 25,9980358 26,0855358 25,5170358 25,2935358 28,1252858 23,5285078 23,5120358 22,4545358 24,0185358 23,6465068 0,01903621 -2,18 MIR_#70 19,7480358 20,0815358 19,1050358 18,9865358 21,0762858 19,1270358 18,3635358 16,4985358 16,7091228 0,01967592 -2,21 MIR_#88 26,9880358 27,5795358 26,2350358 25,6775358 27,1012858 25,9000378 25,9460358 25,7455358 25,3195358 24,1893608 0,03200948 -1,08 MIR_#105 25,9640358 27,1545358 27,6600358 26,2345358 29,0932858 26,6766578 26,6790358 25,6635358 24,3795358 24,1522848 0,03343142 -1,89 MIR_#49 24,7830358 25,0785358 26,0000358 24,4485358 25,3142858 24,6207578 24,4220358 24,6945358 23,6805358 22,6417148 0,03416368 -0,88 MIR_#36 22,7730358 22,9915358 22,0270358 22,1275358 22,5462858 23,2413758 21,5990358 22,5155358 21,5225358 19,9834968 0,03591171 -1,10 MIR_#10 22,5550358 22,3005358 23,3590358 21,6815358 21,6822858 21,9105178 20,6940358 20,9575358 22,3525358 20,0857578 0,04056355 -1,28 MIR_#113 24,4450358 24,8175358 25,6780358 23,7465358 23,2742858 25,0059248 23,9080358 24,0115358 23,3685358 21,6185128 0,07708431 -0,99 MIR_#1 21,0390358 20,7665358 20,3810358 19,5395358 20,6472858 19,4752228 20,8420358 18,8425358 18,3045358 18,9817098 0,08891307 -1,60 MIR_#95 20,7570358 20,3485358 20,1150358 19,2435358 21,2072858 18,5788928 20,3000358 18,9045358 17,6605358 18,3090608 0,09828997 -1,62
36
Figure 8.
Hierarchical clustering of microRNA expression profile of 117 microRNA commonly expressed in EBUS-TBNA biopsy specimens (N = 20) – on the left - or mediastinoscopy (MED) – on the right. The heat map indicates the level of expression (log2 Ratio) of each single microRNA (green, less expressed, red, more expressed) in the analyzed samples. Bottom, yellow samples of patients who responded to neoadjuvant therapy and in black those who did not respond.
37
Figure 9.
Hierarchical clustering expression profile of a 13 differentially expressed microRNA (p <0.05) set in EBUS-TBNA samples of patients responders to neoajuvant chemotherapy vs. not-responders. On the left, the expression level logic (log2 Ratio) of each single microRNA (green, less expressed, red, more expressed) in the EBUS-TBNA samples. On the right, heatmap of the expression profile in the mediastinoscopy samples (MED). Bottom, yellow samples of patients who responded to neoadjuvant chemotherapy, while in black those who did not respond.
38
5. DISCUSSION
New trends in thoracic oncology are characterized by non-invasive therapies and less-invasive methods for the diagnosis and staging of advanced NSCLC, and targeted therapies (43) designed to reduce patient discomfort and complications and improve survival rates.
Surgical histological specimens have been supplanted by EBUS-TBNA in different clinical scenarios, especially in lung cancer diagnosis and staging (44). In recent years, several studies have demonstrated that EBUS-TBNA reaches the same percentage of diagnosis as surgical biopsies, and allows molecular analyses and mutation detections for target therapies in advanced lung cancer patients (41). Due to its low invasiveness, EBUS-TBNA can also be repeated on “long survival” patients to re-characterize molecular status for personalized treatment.
Different studies have investigated the association between miRNA alterations and lung cancer onset and progression. MiRNAs were shown to be prognostic factors, or early diagnostic markers, or more intriguingly, factors determining chemotherapy or biological drug responses. (33)
Developing novel biomarkers in conjunction with less invasive methods of diagnosis and staging of NSCLC patients, especially EBUS-TBNA, is paramount to offer patients optimal care with the new perspectives of targeted therapies. The integration of miRNA screening studies with clinical protocols is mandatory to transfer the proposed miRNA biomarkers to the clinical setting. Standardizing methods for collection of biological samples and optimizing miRNA profile analyses, particularly when starting from limited amounts of specimens, represents a definitive strategy to increase the assessment of proposed biomarkers in clinical studies.
As previously reported, miRNAs are resistant to degradation and can be easily identified in FFPE specimens, but few data are available on the feasibility of miRNA expression analyses in cytological specimens. A recent study investigated mRNA and miRNA expression profiles in EBUS-TBNA stored specimens (45). However, it did not address the purity of the samples to derive miRNA/mRNA
39
expression profiles in terms of lung cancer cells fraction, a major issue since miRNAs have been shown to be tissue-specific (46).
In the first phase of our study, we retrospective analysed a consecutive intent-to-treat series of selected patients with “potentially resectable” N2 NSCLC, pathologically proven by mediastinoscopy or EBUS-TBNA after induction chemotherapy, to obtain the most homogeneous group possible to identify prognostic factors to improve survival but also to identify the best group of survivors to investigate future therapies.
Although survival was significantly compromised in most studies when residual nodal disease was present after induction therapy, and these patients might do as well overall without surgery, for those showing a response to induction, multiple studies have already demonstrated that a more important determinant of survival in patients with stage III-N2 disease is downstaging the mediastinal lymph nodes involved (47-50). Patients with pathologic downstaging to N0 status demonstrated a survival benefit compared with those with persistent nodal involvement (N1–N3 disease, or nodal involvement ‘‘unknown’’) at the time of surgery, and with patients who did not undergo surgical resection (5-year survival 41% versus 24% versus 8%, respectively) (25).
Our study observed mediastinal downstaging in 30% of the patients, with a complete pathological response in only 8 patients (6%). Even if we had a moderate mediastinal response after IC, complete lymph node downstaging (pN0) was found to be one of the most important predictors of survival (46% for pN0 vs. 26% for pN+), above all considering that most of the patients with N1 or persistent N2 disease underwent adjuvant radiotherapy.
In multivariate analysis, lymph nodal downstaging and the number of chemotherapy cycles were both independent prognostic factors, with the benefit of downstaging mostly due to complete pathological response. In our patients, 5-year OS was 35% for all patients undergoing radical resection but when the lymph nodal downstaging was associated with 4 or more cycles of IC, the 5-year OS rose to 76%. This excellent result was related to the fact that those patients were already good responders after
2-40
3 cycles of chemotherapy, and that is why we decided to continue with subsequent cycles of chemotherapy.
Another important prognostic factor was the number of nodal stations involved. Daly et al. (48) found a significant difference in 5-year OS between persistent single versus multilevel N2 at resection (37% vs. 7.1%; p<0.005), as did our study (33% and 18%, p=0.005).
Since persistent lymph node disease after chemotherapy has a negative prognostic significance, the appropriate selection of patients for surgery following IC becomes essential not only for a correct analysis of the data but also to reduce the operative risk of surgery in patients who may not benefit. The preliminary retrospective analysis of a miRNA expression profile in mediastinoscopies specimens derived from the first retrospective cohort of patients showed a specific pattern of expression highly different between “responders” and “not-responders” patients.
Departing from these results, we tested the feasibility of the use of EBUS-TBNA specimens to profile the whole genome and miRNA expression that has never been described.
The use of primary cell lines instead of the completely fixed cytological specimens collected from EBUS-TBNA should guarantee a higher specificity of the miRNA expression profile, avoiding “contamination” of the neoplastic cell miRNA profile by other non-epithelial cells (lymphocytes, blood and stromal cells) which are abundant in lymph node samples.
Our study obtained primary cell cultures from EBUS-TBNA specimens removing most of the non-epithelial cells (lymphocytes, blood and stromal cells) that might affect the gene expression profile of NSCLC cellularity and miRNA results. The results demonstrate the feasibility of obtaining pure populations of primary NSCLC cells from EBUS-TBNA specimens and a complete miRNA expression profile analysis, which strongly correlates with those obtained from micro-dissected lymph nodal metastases from mediastinoscopy specimens.
In addition, the evaluation of miRNA profile in NSCLC cell cultures derived from EBUS-TBNA specimens also provided a specific pattern of expression completely different from “responders” and
41
“not responders” patients. This pattern was also verified in a series of FFPE samples derived from mediastinoscopies confirming the results.
Our results are promising for the management of advanced NSCLC patients. The possibility to use EBUS-TBNA specimens for a primary cell culture and whole miRNA expression profiles provides an excellent tool in the personalized therapy of advanced lung cancer patients.
Based on our results the evaluation of a miRNA signature based on response to chemotherapy that could predict a good prognosis and single out the best candidates for therapy represents a step forward in the personalized treatment era.
6. CONCLUSIONS
Response to chemotherapy is the most important prognostic factor affecting survival in Stage IIIA – pN2 NSCLC patients.
The ability to predicted response to chemotherapy is crucial and the genomic approach represents the best tool.
The identification of chemo-resistance markers through miRNA expression profile is feasible and reproducible in EBUS-TBNA specimens from patients with NSCLC.
Our results are very promising in a new future the management of NSCLC patients in the personalized therapy era.
42
7. REFERENCES
1. Siegel R, Naishadham D, Jemal A. Cancer statistics, 2013. CA Cancer J Clin. 2013 Jan;63(1):11-30.
2. Peto R, Lopez AD, Boreham J, Thun M, Heath C Jr, Doll R. Mortality from smoking worldwide. Br Med Bull. 1996 Jan;52(1):12-21.
3. Schiller JH, Harrington D, Belani CP, Langer C, Sandler A, Krook J, Zhu J, Johnson DH; Eastern Cooperative Oncology Group. Comparison of four chemotherapy regimens for advanced non-small-cell lung cancer. N Engl J Med. 2002 Jan 10;346(2):92-8.
4. Bonomi P, Kim K, Fairclough D, Cella D, Kugler J, Rowinsky E, Jiroutek M, Johnson D. Comparison of survival and quality of life in advanced non-small-cell lung cancer patients treated with two dose levels of paclitaxel combined with cisplatin versus etoposide with cisplatin: results of an Eastern Cooperative Oncology Group trial. J Clin Oncol. 2000 Feb;18(3):623-31.
5. Giaccone G, Splinter TA, Debruyne C, Kho GS, Lianes P, van Zandwijk N, Pennucci MC, Scagliotti G, van Meerbeeck J, van Hoesel Q, Curran D, Sahmoud T, Postmus PE. Randomized study of paclitaxel-cisplatin versus cisplatin-teniposide in patients with advanced non-small-cell lung cancer. The European Organization for Research and Treatment of Cancer Lung Cancer Cooperative Group. J Clin Oncol. 1998 Jun;16(6):2133-41.
6. Sandler AB, Nemunaitis J, Denham C, von Pawel J, Cormier Y, Gatzemeier U, Mattson K, Manegold C, Palmer MC, Gregor A, Nguyen B, Niyikiza C, Einhorn LH. Phase III trial of gemcitabine plus cisplatin versus cisplatin alone in patients with locally advanced or metastatic non-small-cell lung cancer. J Clin Oncol. 2000 Jan;18(1):122-30.
7. Le Chevalier T, Brisgand D, Douillard JY, Pujol JL, Alberola V, Monnier A, Riviere A, Lianes P, Chomy P, Cigolari S, et al. Randomized study of vinorelbine and cisplatin versus vindesine and cisplatin versus vinorelbine alone in advanced non-small-cell lung cancer: results of a European multicenter trial including 612 patients. J Clin Oncol. 1994 Feb;12(2):360-7.
43
8. Kris MG, Natale RB, Herbst RS, Lynch TJ Jr, Prager D, Belani CP, Schiller JH, Kelly K, Spiridonidis H, Sandler A, Albain KS, Cella D, Wolf MK, Averbuch SD, Ochs JJ, Kay AC. Efficacy of gefitinib, an inhibitor of the epidermal growth factor receptor tyrosine kinase, in symptomatic patients with non-small cell lung cancer: a randomized trial. JAMA. 2003 Oct 22;290(16):2149-58.
9. Perez-Soler R. Phase II clinical trial data with the epidermal growth factor receptor tyrosine kinase inhibitor erlotinib (OSI-774) in non-small-cell lung cancer. Clin Lung Cancer. 2004 Dec;6 Suppl 1:S20-3.
10. Shaw AT, Yeap BY, Solomon BJ, Riely GJ, Gainor J, Engelman JA, Shapiro GI, Costa DB, Ou SH, Butaney M, Salgia R, Maki RG, Varella-Garcia M, Doebele RC, Bang YJ, Kulig K, Selaru P, Tang Y, Wilner KD, Kwak EL, Clark JW, Iafrate AJ, Camidge DR. Effect of crizotinib on overall survival in patients with advanced non-small-cell lung cancer harbouring ALK gene rearrangement: a retrospective analysis. Lancet Oncol. 2011 Oct;12(11):1004-12.
11.Webb JD, Simon MC. Novel insights into the molecular origins and treatment of lung cancer. Cell Cycle. 2010 Oct 15;9(20):4098-105. Epub 2010 Oct 11.
12. Goldstraw P, Chansky K, Crowley J, Rami-Porta R, Asamura H, Eberhardt WE, Nicholson AG, Groome P, Mitchell A, Bolejack V; International Association for the Study of Lung Cancer Staging and Prognostic Factors Committee, Advisory Boards, and Participating Institutions; International Association for the Study of Lung Cancer Staging and Prognostic Factors Committee Advisory Boards and Participating Institutions. The IASLC Lung Cancer Staging Project: Proposals for Revision of the TNM Stage Groupings in the Forthcoming (Eighth) Edition of the TNM Classification for Lung Cancer. J Thorac Oncol. 2016 Jan;11(1):39-51.
13. Scott WJ, Howington J, Feigenberg S, Movsas B, Pisters K; American College of Chest Physicians. Treatment of non-small cell lung cancer stage I and stage II: ACCP evidence-based clinical practice guidelines (2nd edition). Chest. 2007 Sep;132(3 Suppl):234S-242S.
44
14. Socinski MA, Crowell R, Hensing TE, Langer CJ, Lilenbaum R, Sandler AB, Morris D; American College of Chest Physicians. Treatment of non-small cell lung cancer, stage IV: ACCP evidence-based clinical practice guidelines (2nd edition). Chest. 2007 Sep;132(3 Suppl):277S-289S.
15. Robinson LA, Ruckdeschel JC, Wagner H Jr, Stevens CW; American College of Chest Physicians. Treatment of non-small cell lung cancer-stage IIIA: ACCP evidence-based clinical practice guidelines (2nd edition). Chest. 2007 Sep;132(3 Suppl):243S-265S.
16. Goldstraw P, Mannam GC, Kaplan DK, Michail P. Surgical management of non-small-cell lung cancer with ipsilateral mediastinal node metastasis (N2 disease). J Thorac Cardiovasc Surg 1994; 107:19 –28.
17. Burkes RL, Ginsberg RJ, Sheperd FA, Blackstein ME, Goldberg ME, Waters PF, et al. Induction chemotherapy with mitomycin, vindesine, and cisplatin for Stage III unresectable non-small cell lung cancer; results of the Toronto phase II trial. J Clin Oncol 1992; 10:580–6.
18. Roth JA, Fosella F, Komaki R, Ryan MB, Putnam JB Jr, Lee JS, et al. A randomized trial comparing perioperative chemotherapy and surgery with surgery alone in resectable Stage IIIA non small cell lung cancer. J Natl Cancer Inst 1994; 86:673–80.
19. Rosell R, Gomez-Codina J, Camps C, Maestre J, Padille J, Cantó A, et al. A randomized trial comparing preoperative chemotherapy plus surgery with surgery alone in patients with non-small cell lung cancer. N Engl J Med 1994; 330:153–8.
20. Sugarbaker DJ, Herndon J, Kohman LJ, Krasna MJ, Green MR. Cancer and Leukemia Group B Thoracic Surgery Group. Results of cancer and leukemia group B protocol 8935. A mutiinstitutional phase II trimodality trial for Stage IIIa (N2) non-small cell lung cancer. J Thorac Cardiovasc Surg 1995; 109:473–85.
21. Albain KS, Rusch VW, Crowley JJ, Rice TW, Turrisi AT 3rd, Weick JK, et al. Concurrent cisplatin/etoposide plus chest radiotherapy followed by surgery for Stages IIIA (N2) and IIIB
non-45
small cell lung cancer: mature results of Southwest Oncology Group phase II study 8805. J Clin Oncol 1995; 13:1880–92.
22. Pearson FG, DeLarue NC, Ilves R, Todd TR, Cooper JD. Significance of positive superior mediastinal nodes identified at mediastinoscopy in patients with resectable cancer of the lung. J Thorac Cardiovasc Surg 1982; 83:1–11.
23. Detterbeck FC, Jantz MA, Wallace M, Vansteenkiste J, Silvestri GA. Invasive mediastinal staging of lung cancer: ACCP evidence-based clinical practice guidelines (2nd edition). Chest 2007;132(3 Suppl.):202S—20S.
24. DeCamp MM Jr, Ashiku S, Thurer R. The role of surgery in N2 non-small cell lung cancer. Clin Cancer Res 2005; 11:5033s–7s.
25. Albain KS, Swann RS, Rusch VW, Turrisi AT 3rd, Shepherd FA, Smith C, et al. Radiotherapy plus chemotherapy with or without surgical resection for stage III non-small-cell lung cancer: a phase III randomised controlled trial. Lancet. 2009 Aug 1; 374(9687):379-86.
26. Van Meerbeeck JP, Kramer GW, Van Schil PE, Legrand C, Smit EF, Schramel F, et al; European Organisation for Research and Treatment of Cancer-Lung Cancer Group. Randomized controlled trial of resection versus radiotherapy after induction chemotherapy in stage IIIA-N2 non-small-cell lung cancer. J Natl Cancer Inst. 2007 Mar 21; 99(6):442-50.
27. Betticher DC, Hsu Schmitz SF, Totsch M, Hansen E, Joss C, von Briel C, et al. Mediastinal lymph node clearance after docetaxel-cisplatin neoadjuvant chemotherapy is prognostic of survival in patients with stage IIIA PN2 nonsmall-cell lung cancer: a multicenter phase II trial. J Clin Oncol 2003;21(9):1752-9.
28. Eberhardt W, Wilke H, Stamatis G, Stuschke M, Harstrick A, Menker H, et al. Preoperative chemotherapy followed by concurrent chemoradiation therapy based on hyperfractionated
46
accelerated radiotherapy and definitive surgery in locally advanced non-small cell lung cancer: mature results of a phase II trial. J Clin Oncol 1998;16(2):622-34.
29. Lorent N, De Leyn P, Lievens Y, Verbeken E, Nackaerts K, Dooms C, et al. Long-term survival of surgically staged IIIA-N2 non-small-cell lung cancer treated with surgical combined modality approach: analysis of a 7-year prospective experience. Ann Oncol 2004;15(11):1645-53.
30. Rami-Porta R, Wittekind C, Goldstraw P. Complete resection in lung cancer surgery: proposed definition. Lung Cancer 2005;49(1):25-33.
31. Nakanishi H, Taccioli C, Palatini J, Fernandez-Cymering C, Cui R, Kim T, Volinia S, Croce CM. Loss of miR-125b-1 contributes to head and neck cancer development by dysregulating TACSTD2 and MAPK pathway. Oncogene 2014, 33, 702-712.
32. Li C, Lyu J, Meng QH. MiR-93 Promotes Tumorgenesis and Metastasis of Non-Small-Cell Lung Cancer Cells by Activating the PI3K/Akt Pathway via Inhibition of LKB1/PTEN/CDKN1A. J. Cancer 2017, 8, 870-879.
33. Landi MT, Zhao Y, Rotunno M, Koshiol J, Liu H, Bergen AW, Rubagotti M, Goldstein AM, Linnoila I, Marincola FM, Tucker MA, Bertazzi PA, Pesatori AC, Caporaso NE, McShane LM, Wang E. MicroRNA expression differentiates histology and predicts survival of lung cancer. Clin Cancer Res. 2010 Jan 15;16(2):430-41.
34. Bianchi F, Nicassio F, Marzi M, Belloni E, Dall'olio V, Bernard L, Pelosi G, Maisonneuve P, Veronesi G, Di Fiore PP. A serum circulating miRNA diagnostic test to identify asymptomatic high-risk individuals with early stage lung cancer. EMBO Mol Med. 2011 Aug;3(8):495-503. 35. Xu H, Cheung IY, Guo HF, Cheung NK. MicroRNA miR-29 modulates expression of immunoinhibitory molecule B7-H3: potential implications for immune based therapy of human solid tumors. Cancer Res. 2009 Aug 1;69(15):6275-81.
47
36. Cortez MA, Ivan C, Valdecanas D, Wang X, Peltier HJ, Ye Y, Araujo L, Carbone DP, Shilo K, Giri DK, Kelnar K, Martin D, Komaki R, Gomez DR, Krishnan S, Calin GA, Bader AG, Welsh JW. PDL1 Regulation by p53 via miR-34. J Natl Cancer Inst. 2015 Nov 17;108 (1).
37. Montani F, Marzi MJ, Dezi F, Dama E, Carletti RM, Bonizzi G, Bertolotti R, Bellomi M, Rampinelli C, Maisonneuve P, Spaggiari L, Veronesi G, Nicassio F, Di Fiore PP, Bianchi F. miR-Test: a blood test for lung cancer early detection. JNCI Journal of the National Cancer Institute 2015 Mar 19;107(6).
38. Hammond ZT, Anderson RC, Meyers BF. The current role of mediastinoscopy in the evaluation of thoracic disease. J Thorac Cardiovasc Surg 1999; 118: 894-899.
39. Yasufuku K, Chiyo M, Sekine Y, et al. Real-time endobronchial ultrasound-guided
transbronchial needle aspiration of mediastinal and hilar lumph nodes. Chest 2004; 126: 122-128. 40. Kinsey CM, Arenberg DA. Endobronchial ultrasound-guided transbronchial needle aspiration for non-small cell lung cancer staging. Am J Respir Crit Care Med 2014; 189: 640-9.
41. Casadio C, Guarize J, Donghi S, Di Tonno C, Fumagalli C, Vacirca D, Dell'Orto P, De Marinis F, Spaggiari L, Viale G, Barberis M. Molecular Testing for Targeted Therapy in Advanced Non-Small Cell Lung Cancer: Suitability of Endobronchial Ultrasound Transbronchial Needle Aspiration. Am J Clin Pathol 2015 Oct;144(4):629-34.
42. Montani F, Marzi MJ, Dezi F, Dama E, Carletti RM, Bonizzi G, Bertolotti R, Bellomi M, Rampinelli C, Maisonneuve P, Spaggiari L, Veronesi G, Nicassio F, Di Fiore PP, Bianchi F. miR-Test: a blood test for lung cancer early detection. JNCI Journal of the National Cancer Institute 2015 Mar 19;107(6).
43. Roy-Chowdhuri S, Aisner DL, Allen TC, Beasley MB, Borczuk A, Cagle PT, Capelozzi V, Dacic S, da Cunha Santos G, Hariri LP, Kerr KM, Lantuejoul S, Mino-Kenudson M, Moreira A, Raparia K, Rekhtman N, Sholl L, Thunnissen E, Tsao MS, Vivero M, Yatabe Y. Biomarker Testing in Lung Carcinoma Cytology Specimens: A Perspective From Members of the Pulmonary