A
A
l
l
m
m
a
a
M
M
a
a
t
t
e
e
r
r
S
S
t
t
u
u
d
d
i
i
o
o
r
r
u
u
m
m
–
–
U
U
n
n
i
i
v
v
e
e
r
r
s
s
i
i
t
t
à
à
d
d
i
i
B
B
o
o
l
l
o
o
g
g
n
n
a
a
DOTTORATO DI RICERCA IN
Economia
Ciclo 30°
Settore Concorsuale: 13/A1 Economia Politica
Settore Scientifico Disciplinare: SECS-P/01 Economia Politica
Essays in Applied Insurance Economics
Presentata da:
Paolo ZanghieriCoordinatore Dottorato
Supervisore
Prof. Vincenzo Denicolò
Prof. Paolo Vanin
2
TABLE OF CONTENTS
ABSTRACT
3
WHAT CAUSES INSURANCE FRAUD? EVIDENCE ON MOTOR
THIRD PART LIABILITY IN ITALIAN PROVINCES 6
THE VALUE AND PRICE OF A “TOO-BIG-TO-FAIL” GUARANTEE
IN THE INSURANCE INDUSTRY 32
BUSINESS CYCLE AND MOTOR INSURANCE PROFITABILITY 66
4
A
BSTRACT
The papers included in this thesis deal with a few aspects of insurance economics that have seldom been dealt with in the applied literature.
In the first paper “What causes insurance fraud? Evidence on Motor Third Party Liability in Italian Provinces” I apply for the first time the tools of the applied economics of crime to study the
determinants of frauds, using data on Italian provinces. I find a negative correlation between frauds and economic development. The contributions to the literature are manifold:
- I show that the price of insuring has a positive correlation with the propensity to defraud - Social norms constraint fraudulent behavior, but their strength is severely curtailed in
economic downturns
- On the methodological side, I apply a simple extension of the Random Coefficient model, which allows for the presence of time invariant covariates and asymmetries in the impact of the regressors.
The second paper, “The Value and Price of a “Too-Big-to-Fail-Guarantee in the Insurance Industry”, assesses how and to what extent the evolution of macro prudential regulation of insurance companies has been reflected in their equity prices. To this end I employ a standard event study methodology, deriving the definition of the “control” and “treatment” groups from what is implied by the regulatory framework. The main results are:
- Markets care about the evolution of the legislation, and their perception has shifted from a first positive assessment of a possible implicit “too big to fail” subsidy to a more negative one related to its price in terms of stricter capital requirement
- The size of this phenomenon is positively related to leverage, size and on the geographical location of the insurance companies
The third paper, “Business Cycle and Motor Insurance Profitability” introduces a novel methodology to forecast non-life insurance premium growth and profitability as function of macroeconomic variables. It adapts the simultaneous equation framework traditionally used for macroeconometric models to some items of the technical account of the Italian motor third party business, employing a simple theoretical model of insurance pricing to derive a long term relationship between premiums, claims expenses and short term rates. The model is shown to provide a better forecast of premiums and profitability compared with the single equation specifications commonly used in applied analysis.
5
Gli articoli inclusi in queste tesi si occupano di aspetti dell'economia dell’assicurazione raramente trattati dalla letteratura empirica.
Nel primo articolo , “What causes insurance fraud? Evidence on Motor Third Party Liability in
Italian Provinces” si applicano per la prima volta gli strumenti dell'economia applicata del crimine per studiare le determinanti delle frodi assicurative, utilizzando dati sulle province italiane. SI trova una correlazione negativa tra frodi e sviluppo economico. I contributi alla letteratura sono
molteplici:
- Si mostra come il costo di assicurarsi ha una correlazione positiva con la propensione a
frodare.
- Il Comportamento fraudolento è limitato dalle norme sociali, ma la loro forza è indebolita
severamente in caso di recessione.
- Dal punto di vista metodologico, si applica una semplice estensione del modello Random
Coefficient, che permette di impiegare regressori fissi nel tempo e di tenere conto dell’impatto asimmetrico delle variabili esplicative.
Il secondo articolo, “The Value and Price of a “Too-Big-to-Fail-Guarantee: Evidence from the
Insurance Industry” valuta come e in che misura l'evoluzione della regolamentazione
macroprudenziale delle compagnie di assicurazione si è riflessa nel prezzo delle loro azioni. A tal fine si utilizza una metodologia event study, derivando la definizione dei gruppi di "controllo" e "trattamento" dalle implicazioni dal quadro normativo. I principali risultati sono:
- Il mercato finanziario reagisce all’evoluzione della legislazione, e la sua percezione è
cambiata da una prima valutazione positiva di un possibile sussidio implicito a una più negativa, a causa del suo costo in termini di requisiti patrimoniali più severi
- L’intensità del fenomeno è maggiore per le compagnie con più indebitate, più grandi, e
dipende dalla loro localizzazione geografica.
Il terzo articolo, “Business Cycle and Motor Insurance Profitability: Evidence for Italy” presenta una
nuova metodologia per prevedere la crescita dei premi di assicurazione danni la profittabilità del settore in funzione di variabili macroeconomiche .Lo schema ad equazioni simultanee
tradizionalmente usato per i modelli macroeconometrici viene adattato ad alcune voci del conto economico del settore auto italiano, impiegando un semplice modello teorico di pricing
dell’assicurazione danni per derivare una relazione di equilibrio tra premi, costi dei sinistri premi e tassi a breve termine. Si mostra come il modello fornisce dei premi che della profittabilità previsioni più accurate rispetto alle specificazioni a equazione singola utilizzate nelle letteratura applicata.
6
W
HAT
C
AUSES
I
NSURANCE FRAUD
?
E
VIDENCE ON
M
OTOR
T
HIRD
P
ART
L
IABILITY IN
I
TALIAN
P
ROVINCES
Paolo Zanghieri*
University of Bologna, Department of Economics
[email protected]
November 30, 2017This paper seeks to explain the large differences in the incidence of
motor insurance fraud between Italian provinces. The econometric
analysis highlights the role of the variability in per capita income and
strength of social norms common to other types of crimes. Moreover
the differences in the average cost of purchasing this mandatory
cover are shown to affect the propensity to defraud. Finally, cyclical
fluctuations in the labor market have an effect, both directly and by
weakening the deterrent power of social norms.
JEL Classification: G22, A13
Keywords: Non–life Insurance, Frauds, Crime, Social Capital
*I wish I to thank the participants to the 2015 Ph.D Forum at the University of Bologna, and in particular Matteo Cervellati, Lucio Picci and Paolo Vanin for their comments . All errors are my own.
7
1. INTRODUCTION
In this article I apply the tools of the economic analysis of crime to a very specific form of offense: fraud in motor third part liability (MTPL) insurance, a compulsory cover for all drivers in most countries. The empirical analysis of crime has normally focused on property crimes in which there are normally no prior relationships between the perpetrators and the victim. In the case of
insurance fraud, a contractual relationship exists (in the case of MTPL insurance, a very specific and standardized one), and the terms of the contract may play some role in the propensity to breach it. The first contribution of this paper is then the analysis of the impact of the contract terms (more specifically, the cost of the insurance policy) on the propensity to cheat. The second one is the assessment of the impact of the business cycle on the propensity to defraud, not just directly but also via the effect on the strength of the social norms that should act as deterrent. I focus on Italy because of its large diversity in social and economic conditions and the extreme variability of insurance prices. The econometric analysis uses aggregate data on provinces but employs a panel specification that can disentangle the effects of cross-unit variability from those due to cyclical fluctuations. The empirical analysis of insurance fraud is not a new field, but this is, to my knowledge, the first time the tools on the economics of crime are applied to aggregate data and consider explicitly the insurance contract terms.
The main results can be summarized as follows: first of all, the terms of the insurance contract, approximated by the average price paid by motorists, matter in explaining the incidence of fraud. Average premium has a strong explanatory power, especially when it is instrumented using
determinants of insurance pricing not related to frauds; this highlights the role of perceived fairness of a financial contract and the level of trust in the financial institutions issuing it. Secondly, social norms play a deterrent role, but their strength is significantly lessened when economic conditions worsen, in particular after the 2008/09 recession. Additionally, and in line with evidence on the determinants of crime rates, the economic environment matters, both in terms of "structural" differences in per capita income across provinces and of cyclical changes in the unemployment rate.
The results are relevant first of all for the insurance industry and the regulators: a reduction in the overall level of costs and possibly, in its variability across provinces may be helpful in combating frauds, which are responsible for a non-negligible part of compensation costs which, in turn, are to a large extent passed onto policyholders. Moreover the estimates of the impact of the business cycle on frauds can be useful for insurance company to predict the evolution of the incidence of fraud. However, some of the implications of the results go beyond insurance. Firstly, it documents empirically that the terms of a financial contract may provide an incentive to breach it. Secondly, it shows that the impact of social norms on criminal activity is not time invariant, but it is affected by the business cycle.
The paper is structured as follows: Section 2 defines insurance fraud, in Section 3 I sketch the model that serves as background for the empirical analysis and describe the possible role of the perceived fairness of the insurance price and of social interactions. Section 4 has a quick review of the economic literature and the following one describes the data on frauds, as a preliminary to the econometric analysis, shown in Section 6. The results are presented in section 7 and their
robustness to spatial correlation and different measures of the strength of social norms are shown in section 8. Section 9 concludes.
8
2. DEFINING INSURANCE FRAUD
Insurance fraud is a form of ex-post moral hazard that involves the manipulation of information in order to unduly benefit from insurance protection: it can entail either the making up of a non-existing claim or the exaggeration of the damages sustained in a true accident. Fraudsters take advantage of the promise made by the insurer to pay losses in some circumstances defined when signing the contract. This kind of crime, therefore, occurs within the context of a contractual relationship linking the insurer and the policyholder. As a consequence, the decision to invent or exaggerate an accident can be seen as an (extreme) economic response to the terms of the contract; the potential importance of the contract characteristics sets frauds apart from other forms of consumer dishonesty, such as shoplifting.
Insurance fraud has been characterized as a "crime without victims". Due to mutualization, the extra costs due to fraud, if not detected and recovered, are passed to a large extent onto all policyholders. This does not create any significant of harm to any of them individually, possibly leading to policyholders' underestimation of the severity of the offense. Moreover, if the concept of risk-pooling is poorly understood, people may be led to think that fraudsters steal the insurers' money and non that belonging to policyholders. This may lead to a high tolerance to fraud and a consequent reduction of the moral costs attached to committing it, especially in areas where premiums are high (not necessarily due to frauds) or in response to a large increase in premiums. The analysis in this paper deals with fraud in Motor Third Part Liability Insurance (Responsabilità Civile Auto e Natanti, in Italian), a mandatory cover against damages caused to other vehicles and persons while driving. In this line of business insurers have the obligation to provide a binding quote to any driver who asks for it, regardless of her driving history. Ratemaking must adhere to several regulatory requirements on, for example, deductibles and level and modes of
compensation. Moreover compensations for bodily injuries (which account for nearly 70% of total paid to claim-holders) are to a large extent dictated by the law and are often decided after a trial. As a consequence, in this line of business insurers cannot adopt many of the contract features designed to prevent frauds like pricing out unwanted customers or setting a high a level for deductible; therefore, the costs related to being caught are one of the few leverages that can be used to reduce the extent of fraud.
3. DRIVERS OF FRAUD: ECONOMIC CONDITIONS, CONTRACT TERMS AND SOCIAL
CAPITALMy analysis follows the standard framework for the economic analysis of crime dating back to the seminal works of Becker (1968), Allingham and Sandmo (1972) and Ehrlich (1973). The decision to file a fraudulent claim is considered as the outcome of a rational choice based on the
comparison of the utility gains of a successful attempt with the cost the fraudsters may incur if fraud is detected. As shown by a large body of empirical literature, the business cycle and in particular its impact on the unemployment rate are key drivers of this trade off1
1
9 I extend the analysis in two directions and focus on:
• The impact on the price of the insurance contract and its perceived "fairness" on the propensity to defraud
• The strength of social norms, and in particular whether it is correlated with the business cycle
3.1
C
ONTRACTT
ERMSI consider claim falsifications related to a well identified and highly standardized insurance contract2, for which I have aggregate price information at the provincial level that can be used to build a direct link with the measure of fraud. On average, in Italy every year only around 6% of vehicles undergo an accident covered by MTPL policies; therefore it is fair to say that the price each policyholder pay is the only feature that matters to the large majority of them as very few are exposed to other characteristics of the contract (the speed of response, quality of the reparation, etc.). MTPL insurance in Italy is one of the most expensive in Europe3 and the differences across provinces are very large indeed, as shown by table 1, which shows the annual premium paid by three types of drivers, as published by IVASS, the industry regulator.
Table 1: Average premium by types of male driver in 2012, euros
1 2 3 Aosta 1746 336 431 L’Aquila 2397 473 607 Milan 2601 505 649 Bologna 3174 650 835 Rome 3187 677 869 Bari 3407 792 1025 Naples 3734 1221 1580 Source: IVASS
1) 18 year old, top Bonus Malus (BM) class, with a 1300cc gasoline car 2) 40 year old, lowest BM class, with a 1300cc gasoline car
3) 55 year old, lowest BM class, with a 1900cc diesel car
One of the hypotheses I want to test is whether this large differences in prices maps into the incidence of fraud. There can be several reasons for that: policyholders living in a province with a higher claims frequency can think that the price they pay for this mandatory cover is too high even though it is fairly priced from an actuarial point of view, moreover the perceived "unfairness" of the price paid for a mandatory cover can be enhanced by a poor understanding of the workings of non-life insurance. Van Wolferen (2014) uses experiments to show that people think about non-non-life insurance as a financial investment (as suggested by Kunreuther et al. (2013)); when they do not incur in an accident, and therefore receive no compensation, policyholders might feel that the money spent for the premium is wasted, increasing their tolerance to fraud4.Changing company is
2
When subscribing an MTPL contract, the driver can choose between only two or three options regarding the limit to coverage (the minimum of which is set by law) and the deductible
3
Differences with respect to other European countries are due to a much higher claims frequency and a higher level of compensation. Similarly differences across provinces mirror a large variation if frequency and in the incidence of accidents with bodily injuries, see, for example ANIA (various issues)
4
Insurance fraud may also be seen also as an example of "negative reciprocity". A growing strand of theoretical and experimental literature, surveyed in Fehr and Gachter and Fehr (2000) and Schmidt (2006) shows that consideration and expectation on how other agents behave are important drivers of individual
10
not yet a very popular option. According to the regulator, in 2014 only 15,2% of policyholder switched to another insurer, despite the substantial savings that can be achieved: those who changed companies saw their premium decrease by almost 22% as opposed to the 5%
experienced by those who did not move(see IVASS, 2015). This may be due to poor information, which may lead motorists to see the cost for this mandatory cover as a tax rather than the price of a financial product and possible react accordingly, by defrauding or fail to insure5 .
3.2
S
OCIALC
APITALAccording to IVASS, on average only slightly more than 2% of the accidents believed by the insurers to be fraudulent are actually reported to the judiciary (IVASS, 2013). Therefore, the
probability of undergoing a trial if caught defrauding is extremely low. Insurers are forbidden by law to refuse to insure a driver who accepts the quote proposed, and efforts to price away riskier drivers by charging very high premiums are often punished by the regulator. Given the relatively overall low incidence of fraud, some other kind of punishment may be at work as deterrent. One particular candidate is the existence of civic norms: these will increase the (non-pecuniary)
opportunity cost of defrauding, given the guilt and shame it would provoke. The strength of informal networks, arising for example in small communities may magnify this effect by means of social sanctions such as ostracism for those known as an insurance fraudsters. Starting from the seminal work of Putnam (1993) the impact of civic norms and associations (grouped together under the somehow loose heading of "social capital") on various aspects of social life has been studied at large. Italy has been the subject of quite a lot of analyses, due to the wide and persistent
differences in indicators of social capital across provinces. Guiso et al. (2004), based on a large household survey, find that various measures of social capital show a strong correlation with individual financial choices. In areas with higher social capital people tend to rely more on banks for financial transactions, holding less cash and being involved in less informal lending, and invest in more sophisticated financial products. Working with aggregate data at the provincial level Millo and Pasini (2010) show that social capital increases the demand for non-life insurance. The relationship between social capital, the strength of networks and various forms of criminal activity in Italy has been studied by Buonanno et al. (2009) and Buonanno et al. (2012), using data at the province level. They find that civic norms (proxied by blood donation, electoral turnover and participation to charitable associations) and networks affect negatively property crimes; moreover, crime is lower when social interactions are denser, e.g. when a large share of population lives in small towns6.
Most of the empirical analysis on the nexus between social capital and financial transactions is either based on cross-section regressions or include social capital as a time-invariant explanatory variable. However, it may well be that, when faced with extremely large adverse shocks (i.e. a
behavior Agents often deviate from purely self-interested behavior in a reciprocal manner: in response to friendly actions or expected intentions, people are much nicer and cooperative than predicted by the self-interest model(positive reciprocity); conversely, after a hostile actions/intentions they are frequently much more nasty (negative reciprocity). The evidence indicates that these attitudes are important for bilateral negotia-tions, for the enforcement of social norms, for understanding the functioning of markets and economic incentives. More recently Kline et al. (2014) provide evidence from experiments and the World Value Survey that deviations from meritocracy are related to a higher propensity towards self-serving dishonesty.
5
According to ANIA, in 2014 8.7% of vehicles in use did not carry a valid insurance, with a peak of over 13% in the Southern regions
6
More specifically, they use as regressors he share of people living in center with less of 2000 inhabitants or in towns with more than 250,000.
11
surge in the unemployment rate), individuals may find social norms less binding and therefore, committing small offenses like insurance fraud more acceptable; I seek to assess whether and to what extent the large drop in economic activity and employment in 2008 and 2009 affected the deterrent impact on social capital on the propensity to defraud7.
4 LITERATURE REVIEW
Most of the theoretical literature on insurance fraud8 aims at either finding the contract, expressed in terms of premium, compensation and deductible which minimizes the incentive to defraud or to derive the optimal level of (costly) monitoring by the insurer, ignoring what drives the decision to defraud.
On the empirical side, a rapidly increasing stream of literature utilizes individual claims data and run GLM models using as covariates the features of the policy (deductible, kasko, etc...), the details of the policyholder (age, sex, number of years with the same insurer, etc.) and information on the accident (period of the day, type of road, witnesses), to construct models able to flag suspicious claims9.
However, the impact of the environmental variables and the business cycle, which this paper is focused on, is not considered in detail: the geographic location of the accidents is normally
dummied out and the use of cross section data by construction neglects the impact of the business cycle. One exception is the paper by Dionne and Wang (2013) on Taiwan: they add to a standard probit model time dummies and find a statistically significant positive relationship between the probability of a claim being fraudulent and cyclical downturns.
A very few papers use aggregate data for US states. Cummins and Tennyson (1996) use a cross section of data for 29 US states: lacking data on the incidence of frauds, they proxy ex-post moral hazard in motor insurance by the ratio of bodily injury claims in the total. They find a positive and significant correlation with a tolerant attitude to insurance fraud in the state, measured by a survey, the percentage of people without health insurance and with the urbanization rate. They find similar results for the share of sprain and strain claims (one of the easiest to fake injuries) over bodily injury claims. Tennyson (1997) provides an in-depth analysis of the survey data mentioned above. It turns out that over 20% of respondents find fraud at least "probably" acceptable. Overall
individual attitude to fraud has a strong correlation with that expressed by people living in the same state, hinting at some environmental factors like to ones I review in this paper playing a role. Moreover, a negative attitude towards the insurance industry in general has a positive correlation with the attitude to fraud. Finally, Goel (2014) uses a cross-section of 31 US states and finds that insurance frauds convictions are inversely related to convictions for corruption and to higher public expenditure on crime fighting, while state level insurance regulation is generally not significant. He interprets the results as better institutions having a negative impact on the propensity to defraud and of substitution in enforcement resources. Moreover, fraud convictions are inversely correlated with per capita income and positively to the urbanization rate.
7
Stevenson and Wolfers (2011) find that, during the Great Recession, countries that experienced the largest rise in unemployment also show the largest drop in public confidence and trust towards national government and the financial sector.
8
A comprehensive and up-to-date survey can be found in Picard (2014).
9
See, for example the analysis on Spanish motor insurance carried out by Artìs, Ayuso and Guillém (2002) and Caudill, Ayuso and Guillém (2005).
12
5. THE DATA
This article uses data on the number of MTPL claims reported as fraudulent by the insurance companies for each Italian province, and communicated to the regulator for statistical purposes: data are annual and range from 2000 and 2011, the last year for which they have been published. It is not possible to distinguish the percentage of frauds involving bodily injuries. Reported frauds may or may not have become part of a trial (most of them were not). In this way they are immune from the underreporting bias which affects other data on crime.
However, there is not a common methodology, agreed by all the insurance companies or imposed by the regulator, to assess whether a claim is truthful or false. Normally, each claim is
automatically analyzed via an algorithm, and given a score. Suspect claims are then reported to local units for more in-depth searches based on standard criteria. However, these criteria may vary across companies (but not across provinces) and this may lead to some potential bias in the data as market shares of companies are not homogeneous across provinces. The econometric
methodology used in this paper seeks to minimize this potential bias. Figure 1: MTPL: Fraudulent claims ad % of the total
Figure 1 shows the share of fraudulent claims on the total by province, between 2000 and 2011. In most of the provinces frauds account for less than 5% of total accidents, but there are a few outliers showing an incidence in excess of 10%, with a marked downward trend.
A further evidence of the polarization of the phenomenon is provided by the decomposition of the variance, shown in table 2. Most of the variability is across provinces; nevertheless the standard deviation across time is non-negligible, being equal to roughly one third of the mean.
Table 2: Incidence of fraud in MTPL insurance: variance decomposition Mean Std. Dev.
Overall 2.139 2.769 Between 2.680
13
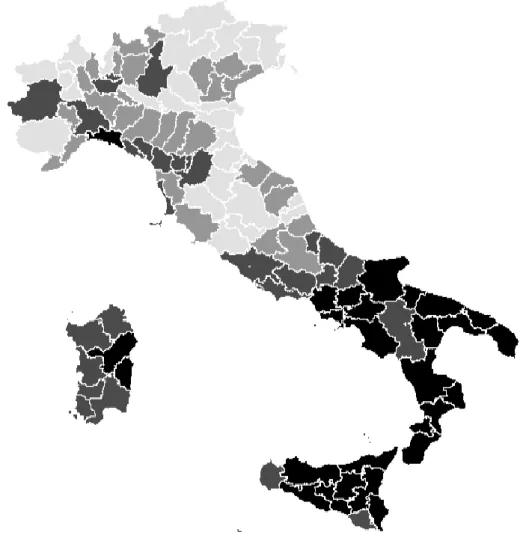
As shown by Figure 2, the highest incidence of fraud is concentrated into a few neighboring provinces in the South and Sicily.
Figure 2: MTPL: Geographic distribution of fraud incidence (2000-2011 average)
6. THE ECONOMETRIC MODEL
The econometric analysis aims at quantifying how the incidence of insurance fraud, measured as (the log of) the number of fraudulent claims per 100,000 people is affected by:
• The economic environment: I will consider both the differences across provinces in per capita GDP and unemployment rate and their deviations from the long term province mean, to assess whether fraudulent activity is related to structural differences in income and the extent to which it reflects business cycle fluctuations10 .
• Social capital and networks: I test whether non-pecuniary costs of committing frauds, which have been shown to be significant in explaining property crime, matter for insurance fraud as well. I employ standard measures of social capital and network strength. In the baseline specification a time-invariant effect is assumed and subsequently I shall assess whether the strength of civic
10
As far as the unemployment rate is concerned, the focus on a very specific type of crime and the use of data at the provincial level should minimize the aggregation bias in the relationship between unemployment and crime first illustrated by Chiricos (1987).
14
norms has been affected by busyness cycle fluctuations and, in particular by the severe downturn that the economy experienced in 2008 and 2009.
• The price of insurance: In order to test whether a higher cost of insuring increases the propensity to defraud I use as a regressor the average MTPL premium in the provinces, lagged one year, as the price paid on the last policy renewal is the only piece of information on the contract available when deciding to commit a fraud (MTPL contracts are annual). The possible endogeneity of the variable is dealt with by using Instrumental Variables.
In addition to these variables I use a list of proxies for factors which may facilitate fraudulent activity, such as the relative (in)efficiency of the judiciary, the presence of organized crime, and road congestion. Additionally, based on the evidence on individual claims, I add a proxy for the average age of vehicles, i.e. the share of vehicles older than four years in the total stock. Table 3 summarizes the explanatory variables and shows whether they are time invariant or not.
Table 3: Explanatory variables
Time Invariant ?
Economic conditions
Per capita GDP No
Unemployment Rate No
Socio-demographic factors
Adult population by age class No
Crime and judicial system
Days for a 1st degree sentence Yes Index of organized crime Yes
Social capital and networks
Blood donations per 1000 adults Yes
% living in small towns Yes
% living in large cities Yes
Tolerance to fraud
Average MTPL premium Yes
Vehicle parc
% of new vehicles No
Vehicle per square mq No
The nature of these variables raises a series of issues:
1. It is not possible to rule completely out that the criteria to identify a fraudulent are homogeneous across provinces; this would call for a Fixed Effect estimator...
2. ..however, some of the explanatory variables are time invariant, requiring a Random Effect estimator.
3. Average premiums are likely to be endogenous; in terms of compensation paid or reserved, fraudulent claims account for around 2% of the total, but in some provinces they make for nearly 15% of the total. The correlation between fraud incidence measured on the number of claims and on the sums paid is 97%, hinting at frauds playing a non-negligible role in the costs borne by insurers and reflected in premiums in some areas where the phenomenon is more widespread. Moreover, average premiums are calculated by dividing the premium amount by the stock of registered vehicles. This may be badly measured, as sometimes vehicles no longer in circulation are not canceled and during the period considered there was not any direct linkage between the
15
databases containing the lists of the insured and registered vehicles: the potential measurement error of the variable strengthen the case for instrumental variables
4. There could be spatial correlation in the dependent variable, possible due to social and cultural factors not fully captured by the regressors or, more trivially, by the fact that fraudsters can operate also in other (possibly neighboring) provinces.
The first three issues are dealt with in the baseline estimation, while the fourth is considered as a robustness test.
6.1
D
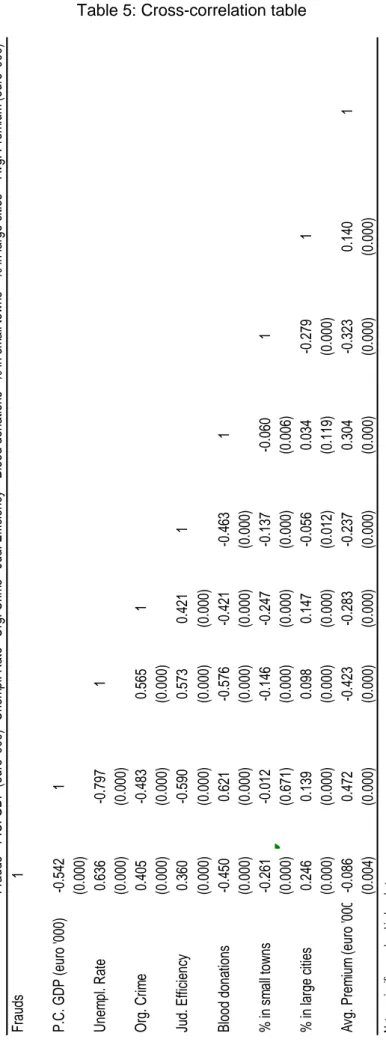
ESCRIPTION OF THE DATATable 4 and 5 show the summary statistics and the correlation between the variables on which I focus my analysis on. There appears to be a large (cross sectional) variability between them; the correlation between frauds and the most important explanatory variables, with the notable
exception of average premiums, are in line with what hypothesized in Section 4. Table 4: Summary statistics
Mean Std. Dev Min Max
Frauds 0.001 0.001 0.000 0.018 P.C. GDP (euro '000) 18.292 4.880 8.921 33.503 Unempl. Rate 8.380 5.768 1.340 32.440 Org. Crime 2.065 1.490 0.383 8.500 Jud. Efficiency 2.848 0.829 1.425 5.882 Blood donations 0.383 0.146 0.120 0.850 % in small towns 9.703 9.687 0.000 42.559 % in large cities 5.154 14.491 0.000 69.505 Avg. Premium (euro '000) 0.367 0.059 0.169 0.656
6.2
M
ODELS
PECIFICATIONIn order to employ simultaneously time varying and invariant regressors I use a version of the RE specification originally proposed by Mundlak (1978), the Within-Between model illustrated in detail by Bell and Jones (2015). Consider a standard RE specification:
𝑦𝑖𝑡 = 𝛽0+ 𝛽1𝑥𝑖𝑡+ 𝛽2𝑧𝑖+ (𝑢𝑖+ 𝑒𝑖𝑡) (1) It requires that covariates be independent of residuals.
𝐶𝑜𝑣(𝑥𝑖𝑡, 𝑢𝑖) = 0, 𝐶𝑜𝑣(𝑥𝑖𝑡, 𝑒𝑖𝑡) = 0 (2)
This assumption is seldom met by data, leading researchers to discard Random Effects in favor of the Fixed Effects specification in which time invariant covariates are averaged out. This
endogeneity often arises from the fact that time varying covariates are treated as single process, whereas in fact they can be decomposed in a "between" component, which does not vary with time, and a "within" one
16
Table 5: Cross-correlation table
Frauds P.C . G DP (e uro '00 0) Un em pl. Ra te Org . C rim e Jud. Efficiency Blo od do na tion s % in s m all tow ns % in l arg e c itie s A vg. Pr em ium (e uro '00 0) Frauds 1 P.C . G DP (e uro '00 0) -0. 54 2 1 (0. 00 0) Un em pl. Ra te 0.636 -0. 79 7 1 (0. 00 0) (0. 00 0) Org . C rim e 0.405 -0. 48 3 0.565 1 (0. 00 0) (0. 00 0) (0. 00 0) Jud. Efficiency 0.360 -0. 59 0 0.573 0.421 1 (0. 00 0) (0. 00 0) (0. 00 0) (0. 00 0) Blo od do na tion s -0. 45 0 0.621 -0. 57 6 -0. 42 1 -0. 46 3 1 (0. 00 0) (0. 00 0) (0. 00 0) (0. 00 0) (0. 00 0) % in s m all tow ns -0. 26 1 -0. 01 2 -0. 14 6 -0. 24 7 -0. 13 7 -0. 06 0 1 (0. 00 0) (0. 67 1) (0. 00 0) (0. 00 0) (0. 00 0) (0. 00 6) % in l arg e c itie s 0.246 0.139 0.098 0.147 -0. 05 6 0.034 -0. 27 9 1 (0. 00 0) (0. 00 0) (0. 00 0) (0. 00 0) (0. 01 2) (0. 11 9) (0. 00 0) A vg. Pr em ium (e uro '00 0) -0. 08 6 0.472 -0. 42 3 -0. 28 3 -0. 23 7 0.304 -0. 32 3 0.140 1 (0. 00 4) (0. 00 0) (0. 00 0) (0. 00 0) (0. 00 0) (0. 00 0) (0. 00 0) (0. 00 0) N ot e = s ig ni fic an ce le ve l i n bra ck et s
17 𝑥𝑖𝐵= 1 𝑇∑ 𝑥𝑖𝑡 𝑇 𝑡=0 𝑥𝑖𝑡𝑊 = 𝑥𝑖𝑡− 𝑥𝑖𝐵
The specification in (1) assumes that within and between effects are equal; the variance that is not accounted for will end up in the error term, leading them to be correlated with the regressor. The proposed alternative uses both components of the time-varying regressors, in order to account for both the impact of the difference across units and of the cyclical fluctuation around the mean
𝑥𝑖𝑡 = 𝛽0+ 𝛽1(𝑥𝑖𝑡− 𝑥̅𝑖) + 𝛽2𝑥̅𝑖+ 𝛽3𝑧𝑖+ (𝑢𝑖+ 𝑒𝑖𝑡) (4)
𝑥̅𝑖 =1 𝑇∑ 𝑥𝑖𝑡
𝑇 𝑡=0
The response of fraud to the business cycle or to change in the insurance cost need not be
symmetric. Mocan, Billups and Overland (2005) develop a model in which, if an individual commits a crime during a cyclical downturn, her legal human capital decreases due to for, example bad reputation, whereas the criminal one appreciates, and this may make it difficult for her to switch back to a legitimate activity when the economy recovers; this leads to hysteresis, whereby the reduction in criminal activity during booms are smaller than its increase in downturns. Similarly, Calvo-Armengol, Verdier and Zenou (2007) show that, when a person engages in a criminal activity when his peers commit crimes too, she finds it difficult to go back to the labor market. Mocan and Bali (2010) test this proposition using aggregate data on US states and individual data for all those born in Philadelphia in 1958. They find that year-on-year increase in the
unemployment rate have a large, in absolute value, impact on the diffusion of several types of crime than an improvement in the labor market. I extend the Within-Between specification including in the model both positive and negative deviations of per capita GDP and unemployment from their long term mean, to see whether the business cycle has an asymmetric impact on the propensity to defraud.
The specification has then two endogenous regressors, the province mean of the average premiums and the deviations from it. I assume that premiums are set in using backward looking expectations and use the lagged values11 of a few determinants of claims frequency and severity impacting compensation costs, and therefore premiums, without affecting the propensity to defraud, namely:
• The incidence of fatal accidents: compensations for deaths are extremely costly and fatal accidents are very unlikely to have been made up
• The average rainfall in the province, affecting both the frequency and sever-ity of true accidents. Note that the dependent variable used in the ratio of fraudulent claims on population. Had I used the ratio on total claims this instrument would not have been valid.
• Fuel consumption per vehicle, a proxy for the intensity of vehicles' use, and therefore of the likelihood of an accident; in principle this should affect just true accidents, as the decision of commit a fraud does not depend on how intensive is car usage.
11
18
• The share of national highways in the total, excluding motorways12
. Accidents in non-urban road have four times the number of fatalities than those occurring elsewhere. Fraudsters choose where to stage a fake accident, so the percentage of non-urban road is most likely to matter just for true claims.
I use two lags of the first three variables to account for smooth adjustment of premiums to changes in compensation costs13. In order to test the validity of the instruments I employ four tests:
• A standard F test for the significance of the excluded instruments in the two first-stage regression • The Kleibergen-Paap (2006) for underidentification with potentially non i.i.d errors: it is a test of whether the excluded instruments are cor-related with the endogenous regressors
• The Angrist-Pischke (AP) first-stage F tests of weak identification of the individual endogenous regressor, i.e. to check whether the excluded in-struments are only weakly correlated with the endogenous regressors, see Angrist and Pischke (2009), pp. 217-18.
• The standard J-test for overidentification
7 RESULTS
7.1
B
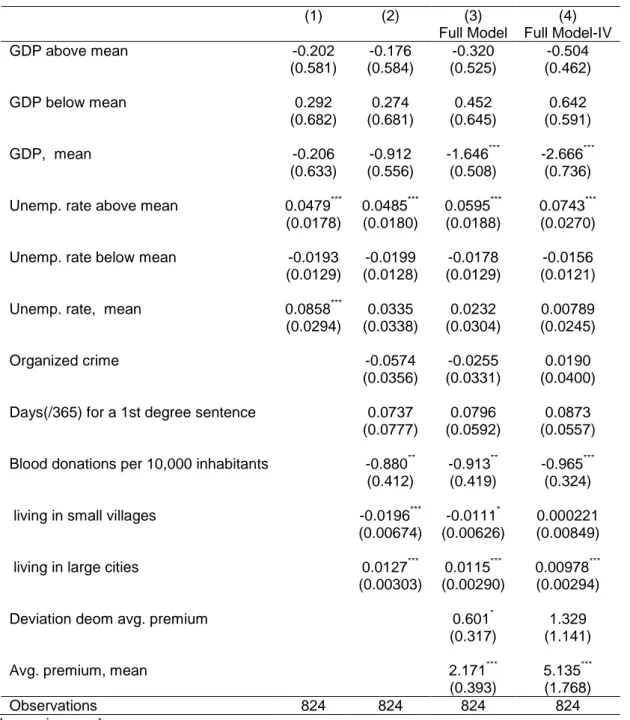
ASELINE SPECIFICATIONIn Table 6 I show the result of the baseline specification: the first column has just the economic determinants, then the measures of organized crime, court efficiency, social capital and networks are added, and finally the full model including premiums is estimated by GLS and by 2SGLS. Frauds are more widespread in poorer provinces, in those where social cap-ital is lower and where people are more concentrated in large cities; this is consistent with the evidence on other types of crime. Moreover, fluctuations in the unemployment rate affect the propensity to defraud
asymmetrically, in accordance with the hysteresis hypothesis. Finally, cross sectional differences in the long-term mean of the average premiums are positively correlated with frauds, but increases in premiums over time do not lead to a higher incidence of fraud.
12
Motorways accidents occurring in a given province are not very likely to involve only vehicles registered in that province
13
The most widely used time series model used to measure premium fluctuations in non-life insurance premiums, initially proposed by Lamm-Tennant and Weiss (1997) regress the percentage change in
premiums on two own lags and at least the first and second lag of the ratio between compensation paid and premiums
19
Table 6: Estimation results: baseline specification
(1) (2) (3) (4) Full Model Full Model-IV GDP above mean -0.202 -0.176 -0.320 -0.504 (0.581) (0.584) (0.525) (0.462) GDP below mean 0.292 0.274 0.452 0.642 (0.682) (0.681) (0.645) (0.591) GDP, mean -0.206 -0.912 -1.646*** -2.666*** (0.633) (0.556) (0.508) (0.736)
Unemp. rate above mean 0.0479*** 0.0485*** 0.0595*** 0.0743*** (0.0178) (0.0180) (0.0188) (0.0270)
Unemp. rate below mean -0.0193 -0.0199 -0.0178 -0.0156 (0.0129) (0.0128) (0.0129) (0.0121)
Unemp. rate, mean 0.0858*** 0.0335 0.0232 0.00789 (0.0294) (0.0338) (0.0304) (0.0245)
Organized crime -0.0574 -0.0255 0.0190 (0.0356) (0.0331) (0.0400)
Days(/365) for a 1st degree sentence 0.0737 0.0796 0.0873 (0.0777) (0.0592) (0.0557)
Blood donations per 10,000 inhabitants -0.880** -0.913** -0.965*** (0.412) (0.419) (0.324)
living in small villages -0.0196*** -0.0111* 0.000221 (0.00674) (0.00626) (0.00849)
living in large cities 0.0127*** 0.0115*** 0.00978*** (0.00303) (0.00290) (0.00294)
Deviation deom avg. premium 0.601* 1.329 (0.317) (1.141)
Avg. premium, mean 2.171*** 5.135*** (0.393) (1.768) Observations 824 824 824 824 Standard errors in parentheses
Dependent Variable: number of MTPL fraudulent claims per 10,0000inhabitants. Robust and province-clustered standard errors
Additional Regressors, not shown: share of population aged 20 to 40 and over 65, vehicles per squared km, share of vehicles over 4 years old, macroregional dummies
*
20
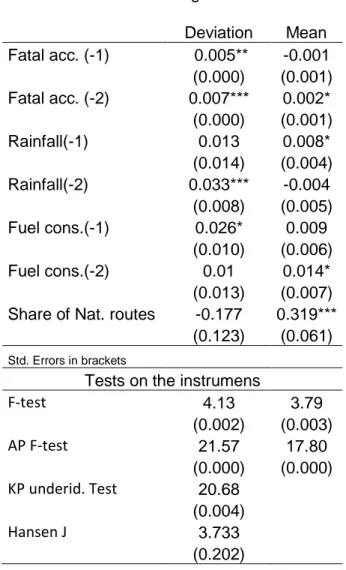
The results of the first stage regression are presented in table 7; the validity of the excluded instruments is confirmed.
Table 7: 1st stage results
Deviation Mean Fatal acc. (-1) 0.005** -0.001 (0.000) (0.001) Fatal acc. (-2) 0.007*** 0.002* (0.000) (0.001) Rainfall(-1) 0.013 0.008* (0.014) (0.004) Rainfall(-2) 0.033*** -0.004 (0.008) (0.005) Fuel cons.(-1) 0.026* 0.009 (0.010) (0.006) Fuel cons.(-2) 0.01 0.014* (0.013) (0.007)
Share of Nat. routes -0.177 0.319***
(0.123) (0.061)
Std. Errors in brackets
Tests on the instrumens
F-test 4.13 3.79 (0.002) (0.003) AP F-test 21.57 17.80 (0.000) (0.000) KP underid. Test 20.68 (0.004) Hansen J 3.733 (0.202)
7.2
S
OCIAL CAPITAL OVER THE BUSINESS CYCLEIn what follows I test whether changes in economic conditions, and especially the large contraction in GDP and employment occurred between the second half of 2008 and the end of 2009, affect the strength of social norms. I use two alternative methods. Firstly I augment the baseline model with the interaction of blood donation with time dummies having value 1 from 2008 or 2009 on or the positive and negative deviation of per capita GDP and the unemployment rate. The use of time dummies assumes implicitly that the impact of the crisis is the same for all provinces, whereas the interaction with the deviations allows for the fact that, due to the large differences across provinces in the structure of the employment, the crisis had initially a larger impact on the areas where the share of private sector employment, especially in the manufacturing sector, was higher. These areas broadly overlap with those featuring the highest levels of the proxies for social capital (see Cartocci, 2007).
21
Table 8: Estimation results: donations interacted
(1)
(2)
(3)
(4)
(5)
blood…
-0.965
***-1.168
***-1.157
***-0.934
***-0.951
***(0.324)
(0.365)
(0.358)
(0.347)
(0.324)
…& post 2008 dummy
0.399
***(0.140)
…& post 2009 dummy
0.517
***(0.181)
…& GDP above mean
-3.826
(2.772)
…& GDP below mean
-6.323
*(3.716)
…& unemp. above mean
0.234
***(0.0650)
…& unemp. below mean
0.0814
(0.0635)
N
824
824
824
824
824
Dependent Variable: number of MTPL fraudulent claims per 10,0000 inhabitants. Robust and province-clustered standard errors
* p < 0.10, ** p < 0.05, *** p < 0.01
Table 9 shows that the crisis, and especially the drop in employment reduced the deterrence provided by social capital. For example, looking at column (3), the elasticity with respect to blood donation is -1.168 before 2009 and becomes -1.17+0.399=-0.769, with a 35% fall, afterwards. By the same token, in Column (4), When per capita GDP is 5% below the (province) long-term
average, the elasticity of social capital is -0.934 -6.323 x (-0.05) = -0.618; when the unemployment rate is 1 percentage point above the (province) long-term average, the elasticity of social capital is -0.959 + 0.240 x 1 = -0.719 (Column (5)).
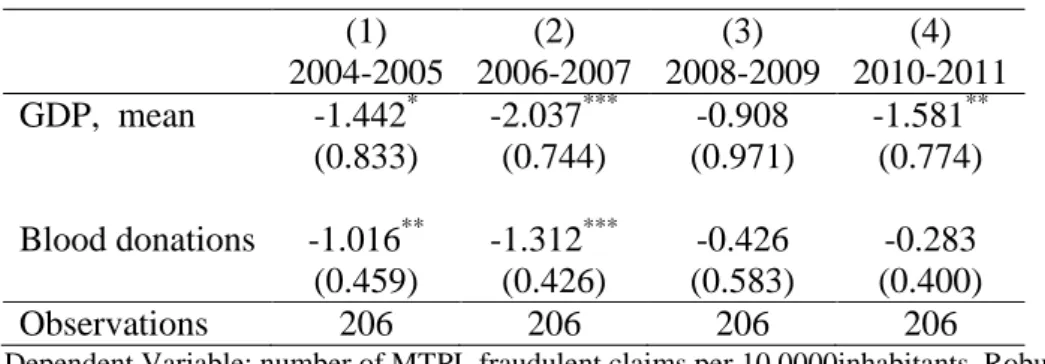
Alternatively, I estimate the baseline model splitting the sample in four nonoverlapping two-year periods; it appears that after the large drop in employment in 2008-9 social capital no longer exerted any influence on the propensity to defraud.
22
Table 9: Estimation results: sub periods
(1)
(2)
(3)
(4)
2004-2005 2006-2007 2008-2009 2010-2011
GDP, mean
-1.442
*-2.037
***-0.908
-1.581
**(0.833)
(0.744)
(0.971)
(0.774)
Blood donations
-1.016
**-1.312
***-0.426
-0.283
(0.459)
(0.426)
(0.583)
(0.400)
Observations
206
206
206
206
Dependent Variable: number of MTPL fraudulent claims per 10,0000inhabitants. Robust and province-clustered standard errors
* p < 0.10, ** p < 0.05, *** p < 0.01
8 ROBUSTNESS TESTS
8.1
S
PATIALC
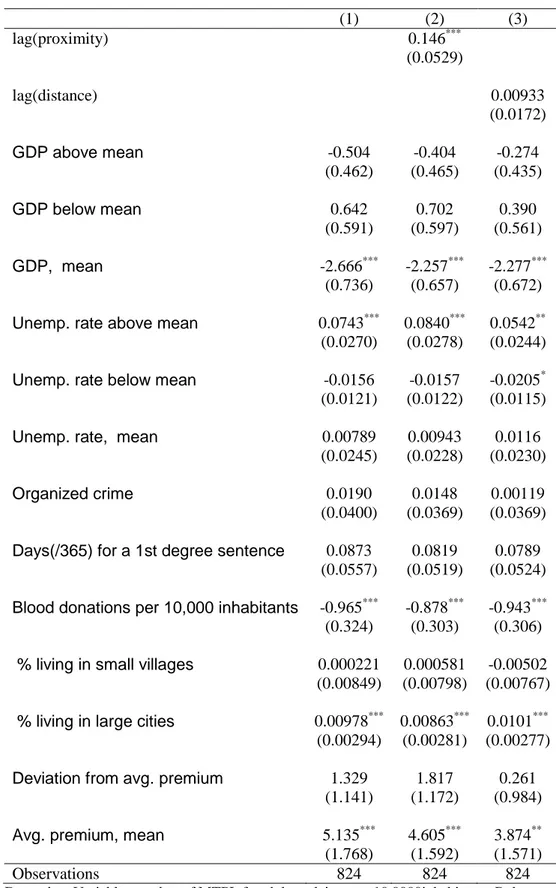
ORRELATIONThe inclusion of social capital is meant to capture some cultural factors that may explain why the highest incidence of insurance frauds is concentrated in a few neighboring provinces. However, the measures of social capital are imper-fect and may miss some other cultural traits specific to some areas. Moreover, ignoring spatial correlation in the variable may bias the estimates or make them inconsistent14. In order to test whether the results of the baseline model are robust to spatial effects, I reestimate the model adding a spatial lag. I use two different weighting matrices: a contiguity matrix and one with the inverse of the distance between each province's capital. The spatial leg is instrumented, as it is customary, with the weighted average of the explanatory
variables, using each matrix in turn. Table 10 compares the baseline model with the two spatial lag specifications. There are basically no differences as far as the main outcome is concerned.
Moreover, proximity is shown to play a role in explaining propensity to defraud over and above the measures of social capital and network strength, whereas distance does not. There can be several explanations for that. First of all, and rather trivially, fraudsters may operate not just in the province where the vehicles are registered but also in neighboring ones. Additionally, the cultural traits helping explain fraudulent behavior may be due less to geographical characteristics related to distance than to other cultural and historical factors, such as belonging to a city state in the Middle age, or living in a province which formed part of the State of the Church or the Kingdom of the Two Sicilies. Guiso et al. (2013) show that a large part of the differences in the endowment of social capital across Italian provinces can be traced back to the political institutions prevailing in the Middle Ages and, in some cases further back in time to the Pre-Roman period.
14
Several papers have analyzed the spatial dimension of criminal activity, for example Zenou (2003), Glaeser et al. (1996).
23
Table 10: Estimation results: Spatial lag model
(1) (2) (3) lag(proximity) 0.146*** (0.0529) lag(distance) 0.00933 (0.0172) GDP above mean -0.504 -0.404 -0.274 (0.462) (0.465) (0.435) GDP below mean 0.642 0.702 0.390 (0.591) (0.597) (0.561) GDP, mean -2.666*** -2.257*** -2.277*** (0.736) (0.657) (0.672) Unemp. rate above mean 0.0743*** 0.0840*** 0.0542** (0.0270) (0.0278) (0.0244) Unemp. rate below mean -0.0156 -0.0157 -0.0205*
(0.0121) (0.0122) (0.0115)
Unemp. rate, mean 0.00789 0.00943 0.0116
(0.0245) (0.0228) (0.0230)
Organized crime 0.0190 0.0148 0.00119
(0.0400) (0.0369) (0.0369) Days(/365) for a 1st degree sentence 0.0873 0.0819 0.0789
(0.0557) (0.0519) (0.0524) Blood donations per 10,000 inhabitants -0.965*** -0.878*** -0.943***
(0.324) (0.303) (0.306) % living in small villages 0.000221 0.000581 -0.00502
(0.00849) (0.00798) (0.00767) % living in large cities 0.00978*** 0.00863*** 0.0101***
(0.00294) (0.00281) (0.00277) Deviation from avg. premium 1.329 1.817 0.261
(1.141) (1.172) (0.984) Avg. premium, mean 5.135*** 4.605*** 3.874**
(1.768) (1.592) (1.571)
Observations 824 824 824
Dependent Variable: number of MTPL fraudulent claims per 10,0000inhabitants. Robust and province- clustered std. errors
Additional Regressors, not shown: share of population aged 20 to 40 and over 65, vehicles per squared km, share of vehicles over 4 years old, macroregional dummies
24
8.2
A
LTERNATIVED
EFINITIONS OFS
OCIALC
APITALIn the baseline regression I use blood donation, which is one of most common indicator of social capital: the altruism implied by giving blood is often considered the outcome of strong civic norms and engagement. However these are multi-faceted phenomena than may not be captured by a single indicator: moreover differences in blood donations across provinces can be due also to other factors, such as demography (people older than 65 cannot donate). Therefore, as a robustness check I consider other indicators of social capital15, which may measure other dimensions of social capital, in particular I consider:
• Turnouts to referendums: I average the participation rate in the two ref-erenda that took place in 1999 and 2001. Referenda are on well identified issues with national importance and voting is not mandatory; a high rate of participation can then be interpreted as a sign of engagement in public issues, the outcome of strong networks.
• Participation to sport clubs: Members of sport club per 1,000 persons. One may think of these groups as channels through which values and trust are learnt and shared.
• Daily newspapers sold: number of daily newspapers sold per 1,000 persons. Reading a newspaper can be seen as an investment in the knowledge of public affairs, leading to larger involvement in collective action and public life. Putnam (2000) found that people who regularly read newspapers are more likely to vote, volunteer more frequently for community projects, visit friends more frequently, and build tighter relationships with their neighbors. The results (Table 11) show that the impact of social capital remains signif-icant regardless of the way it is measured.
15
25
Table 11: Estimation results: Alternative measures of social capital
(1) (2) (3) (4) GDP above mean -0.614 -0.490 -0.607 -0.500 (0.541) (0.520) (0.537) (0.509) GDP below mean 0.787 0.617 0.759 0.656 (0.713) (0.685) (0.709) (0.674) GDP, mean -2.818*** -2.455*** -2.873*** -2.526*** (0.811) (0.793) (0.834) (0.776)
Unemp. rate above mean 0.0820** 0.0735** 0.0816** 0.0744** (0.0326) (0.0312) (0.0317) (0.0303)
Unemp. rate below mean -0.0132 -0.0153 -0.0137 -0.0142 (0.0134) (0.0129) (0.0134) (0.0128)
Unemp. rate, mean 0.00749 0.00839 0.0189 0.0201 (0.0254) (0.0253) (0.0270) (0.0257)
Organized crime 0.0254 0.00577 0.0544 0.0222 (0.0432) (0.0424) (0.0492) (0.0435)
Days(/365) for a 1st degree sentence 0.0879 0.0896 0.0604 0.0808 (0.0585) (0.0572) (0.0645) (0.0601)
Blood donations -0.963*** (0.338)
Avg. turnout at referenda -0.0225** (0.00938)
Members of charities/ 1000 people
Participation to sport clubs -0.0985 (0.0724)
Newspapers sold/1000 people -0.00631*** (0.00237)
% living in small towns 0.00259 -0.000189 0.00930 0.00386 (0.00992) (0.00966) (0.0104) (0.00957)
% living in large cities 0.00938*** 0.00926*** 0.00823** 0.00731* (0.00324) (0.00316) (0.00351) (0.00377)
Deviation from avg. premium 1.809 1.351 1.848 1.442 (1.621) (1.550) (1.554) (1.497)
Avg. premium, mean 5.666*** 4.885** 7.007*** 5.016** (2.051) (2.015) (2.358) (2.007) Observations 824 824 824 824
Dependent Variable: number of MTPL fraudulent claims per 10,0000inhabitants. Robust and province- clustered std. errors
Additional Regressors, not shown: share of population aged 20 to 40 and over 65, vehicles per squared km, share of vehicles over 4 years old, macroregional dummies
*
26
9.CONCLUDING REMARKS
Some of the results of this paper have general implications, not restricted to insurance. First of all it is shown that the business cycle may affect the incidence of fraud over and above the impact on pecuniary incentives. Morality -at least as far as a relatively minor offense like insurance fraud is concerned-appears to depend on economic conditions, especially when the labor market is buffeted by a large negative shock like the large recession that hit the economy starting in the second half of 2008. This can be both the effect of economic necessities partially trumping moral values and the consequence of a reduction in the trust towards the financial sectors documented in other studies. It would be interesting to test whether social capital has the same time varying impact on other, more harmful, forms of crime.
The other original contribution of the paper is showing that, other things being equal, contract terms affect the propensity to cheat; making up or inflating claim is more widespread in provinces where the average premium paid is higher (because of reasons other than fraud). The impact the perceived costs and benefits of a contract on the incentive to cheat may be explored in other areas and provide important insight on the relationship between, for example, the perceived quality of public services and the incidence of tax evasion.
Thirdly, the impact of economic fluctuations on frauds is asymmetric: propensity increases when unemployment goes up but is not reduced by improvements in the labor market: this is consistent with some sort of hysteresis that features in other theoretical and empirical analyses. Additionally, the analysis developed in this paper has shown that motor insurance fraud is in many ways, a crime like the others: it is more widespread in poorer areas, as it probably works as a structural supplement or replacement to labor income, and its diffusion is higher in provinces where civic values are weaker and a larger share of population lives in large cities where the indirect enforcement provided by informal networks is less tangible.
The findings of this paper are relevant for the insurance industry. First of all, reducing the costs of MTPL insurance can provide a non-negligible help in fighting frauds. A discussion on the extent of competition and profit margins in the Italian motor insurance industry is obviously beyond the scope of this paper; however any measure reducing the cost of protection, by for example cutting administration or legal costs might help curb frauds. Reducing the level of compensation (which account for 70% of the costs borne by insurers to provide cover) would be in theory a more
effective alternative, but it could backfire. It would entail curbing and standardizing the entitlements prescribed by law to those suffering bodily injuries and controlling more tightly the expenditure on car reparations (by, for example, obliging drivers to have their cars repaired in some specific garages), and this may raise among policyholders the feeling of being exploited by the insurance, possibly increasing the propensity to defraud.
27
APPENDIX
Table A1: Variable Description and data sources
Variable Description Source
Frauds Number of fraudulent MTPL claims IVASS
Vehicles Number of registered motor vehicles ISTAT
Premiums Total MTPL premiums collected in the province IVASS
GDP Per capita nominal GDP in the province ISTAT
CPI Consumer Price Index for the province ISTAT
Unemployment Unemployment Rate in the province ISTAT
Population aged 20-40
Total population between 20 and 40 in 2001 ISTAT Population aged 60
or more
Total population aged 60 or more ISTAT
Judicial Efficiency Years needed to get to a first degree sentence in the court located in the province, average between the 2000 and 2007 data
ISTAT
Organized Crime Incriminations for criminal association per 100K inhabitants, 2000--2005 average
ISTAT Blood donations Blood donations per 10K inhabitants, 2002 Ministry of
Health Referenda turnout Average turnout at the 1999 and 2011 referenda Ministry of
Interior
Sport clubs Number of members of sport clubs per 10K inhabitants Cartocci(2007) Newspaper
diffusion
Daily newspapers bought per 10K inhabitants, 2001-2 average
ISTAT % in small towns % of population living in villages with less than 2000
inhabitants, 2001
ISTAT % in big cities % of population living in cities with morethan 250K
inhabitants, 2001
ISTAT Fatal accidents Share of fatal road accidents in the total ISTAT
Rainfall Annual rainfall in the province ISTAT
Fuel consumption Per vehicle consumption ACI
Share of National routes
% of national routes in the total (in Kilometers) ISTAT
28
REFERENCES
Allingham, Michael G. and Agar Sandro, 1972. Income tax evasion: a theoretical analysis, Journal of Public Economics Vol. 1, No. 3-4, 323.338
Angrist, Joshua D. and Pioche, Jorn-Stefen, 2009. Mostly Harmless Econo-metrics: An Empiricist's Companion, Princeton University Press.
ANIA, Association of Italian Insurers, Annual Report, available at www.ania.it
Artis, Manuel, Mercedes Ayuso and Montserrat Guillén, 2002. De-tection of Automobile Insurance Fraud with Discrete Choice Models and Misclassified Claims, The Journal of Risk and Insurance, Vol.69, No 3, 325.340
Becker, Gary S., 1968. Crime and Punishment: An Economic Approach, Journal of Political Economy, Vol.77, 169.216
Bell, Andrew and Kelvyn Jones, 2015. Explaining Fixed Effects: Random Effects Modeling of Time-Series Cross-Sectional and Panel Data, Political Science Research and Methods Vol.3, No.1, 133.153
Buonanno, Paolo, Daniel Montolio and Paolo Vanin, 2009. Does Social Capital Reduce Crime? Journal Law and Economics, Vol.52, 145.169
Buonanno, Paolo, Giacomo Pasini and Paolo Vanin, 2012. Crime and Social Sanction Papers in Regional Science, Vol.91, No.1 193.218
Calvo-Armengol, Antoni, Thierry Verdier and Yves Zenou, 2007. Strong and Weak Ties in Employment and Crime, Journal of Public Economics, Vol. 91, 203.233
Cartocci, Roberto, 2007. Mappe del tesoro. Atlante del capitale sociale in Italia, Il Mulino Caudill, Steven B., Mercedes Ayuso and Montserrat Guillllcn, 2005. Fraud Detection Using a Multinomial Logit Model With Missing Information, The Journal of Risk and Insurance, Vol. 72, No 4, 539 .550
Chiricos, Ted 1987. Rates of Crime and Unemployment: An Analysis of Aggregate Research Evidence, Social Problems, Vol.34 187.212
Cummins, J. David and Sharon Tennyson, 1996. Moral Hazard in Insur-ance Claiming: Evidence from Automobile Insurance, Journal of Risk and Uncertainty, Vol. 12, No. 1 29 .50
Dionne, Georges and Wang Kili C., 2013. Does Insurance Fraud in Auto-mobile Theft Insurance Fluctuate with the Business Cycle? Journal of Risk and Uncertainty, Vol. 47, No 1, 67 .92 Ehrlich, Isaac, 1973. Participation in Illegitimate Activities: A Theoretical and Empirical Investigation, Journal of Political Economy, Vol.81, No. 3 521.565
Fehr, Ernst and Simon Gachter, 2000. Fairness and Retaliation: The Economics of Reciprocity Journal of Economic Perspectives, Vol. 47, No 1, 67 .92
29
Fehr, Ernst and Klaus M. Schmidt, 2006. The Economics of Fairness, Reciprocity and Altruism Experimental Evidence and New Theories. In Serge-Christophe Kolm and Jean Mercier Ythier (editors) Handbook of the Economics of Giving, Altruism and Reciprocity, Volume 1, Elsevier., 615. 691
Glaeser, Edward. L., Bruce Sacerdote, and Jost A. Scheinkman 1996. Crime and Social Interactions. Quarterly Journal of Economics, 111, 508.548.
Goel, Rajeev K., 2014, Insurance Fraud and Corruption in the United States, Applied Financial Economics, Vol. 14, No 3, 159.181
Gould, Eric D., Bruce A. Weinberg, and David B. Mustard, 2002. Crime Rates and Local Labor Market Opportunities in the United States: 1979. 1997 The Review of Economics and Statistics, Vol.84, No.1, 45.61
Guiso, Luigi, Paola Sapienza and Luigi Zingales., 2004. The Role of Social Capital in Financial Development, American Economic Review, Vol. 94, No. 3, 526.556
Giuso, Luigi, Paola Sapienza and Luigi Zingales, 2013. Long-term Persis-tence, EIEF Working Paper 23/13
IVASS 2013. Relazione Antifrode, 2013 IVASS 2015. Relazione Annuale 2014
Gleibergen, Frank and Richard Paap, 2006. Generalized reduced rank tests using the singular value decomposition, Journal of Econometrics, vol. 133, No. 1, 97.126
Kline, Reuben, Fabio Galeotti and Raimondello Orsini, 2014. When Foul Play Seems Fair: Dishonesty as a Response to Violations of Just Deserts. University Of Bologna, Department of Economics, Working paper No.920
Kunreuther, Howard C., Mark V. Pauly and Stacey McMorrow, 2013. Insurance and Behavioral Economics, Cambridge University Press
Lamm-Tennant, Joan, and Mary A. Weiss, 1997. International Insurance Cycles: Rational
Expectations/Institutional Intervention. The Journal of Risk and Insurance Vol. 64 No. 2, 415-439. Millo, Giovanni and Giacomo Pasini, 2010. Does Social Capital Reduce Moral Hazard? A Network Model for Non-Life Insurance Demand Fiscal Studies Vol.31, No. 3, 341.372
Mocan H. Naci, Turan G. Bali, 2010. Asymmetric Crime Cycles, the Review of Economics and Statistics Vol.92, No.4, 899.911
Mocan H. Maci, Steve Billups and Jody Overland, 2005. A dynamic Model of Differential Human Capital and Criminal Activity Economica Vol.72, 655. 681
Mundlak, Yair, 1978. On the pooling of time series and cross section data. Econometrica, No. 46, Vol. 1, 69.85
Picard, Pierre, 2000. Economic Analysis of Fraud. In Georges Dionne (ed-itor) Handbook of Insurance, Second Edition, Springer. pp 379-396
30
Putnam, Robert D., 1993. Making Democracy Work: Civic Tradition in Modern Italy, Princeton University Press
Putnam, Robert D., 2000 Bowling Alone. The Collapse and Revival of the American Community, Simon and Schuster
Raphael, Steven and Rudolf Winter-Ebmer, 2001. Identifying the Effect of Unemployment on Crime Journal Law and Economics, Vol.11, No.1 259.283
Stevenson, Betsey and Justin Wolfers, 2011. Trust in Public Institutions over the Business Cycle, American Economic Review: Papers and Proceed-ings, Vol. 101, No. 3 281.287 2011
Tennyson, Sharon, 1997. Economic Institutions and Individual Ethics: A Study of Consumer Attitudes towards Insurance Fraud, Journal of Economic Behavior and Organization, Vol. 32, 247.265
Van Wolferen, Job, 2014. Incomplete Understanding of Insurance Facilitates Fraud Acceptance, Ph.D. Thesis, University of Tilburg
Zenou, Yves, 2003. The Spatial Aspects of Crime, Journal of the European Economic Association, Vol. 1, No.23, 459.467
32
T
HE
V
ALUE AND
P
RICE OF A
“T
OO
-B
IG
-
TO
-F
AIL
”
G
UARANTEE
IN THE
I
NSURANCE
I
NDUSTRY
Paolo Zanghieri*
University of Bologna, Department of Economics, [email protected]
20th October 2017
This paper analyzes the impact of the evolution of the regulation dealing
systemically important insurance groups, using an event study methodology.
The results show that investors were able to detect which companies were to
be designated well ahead of the publication of the list. Most importantly, after
an initial positive reaction, consistent with the expectation of a “too-big-to-fail”
implicit subsidy, the disclosure on how the capital charges for systemic insurers
would be calculated led to sizeable negative abnormal returns for the entities
concerned. Leverage plays a key role in driving investors’ reaction; more
leveraged entities experience higher abnormal returns when the expectation of
a TBTF guarantee arises and lower ones when information on the size of the
capital charges is revealed.
JEL Classification: G20, G22, G23, G28
Keywords: Insurance Companies, Systemic Risk, Global Systemically Financial Institutions, TBTF, Too-Big-to-Fail, Capital Requirements
* I wish to thank Dario Focarelli the participants to the 44th Seminar of the European Group of Risk and Insurance Economists, to the Goethe University 2016 Workshop on systemic Risk in insurance the 2016 Ph.D Forum at the University of Bologna, in particular Giacomo Calzolari. All errors are my own.
33
1.INTRODUCTION AND MOTIVATION
In 2008, the biggest bailout in history prevented the failure of a large insurance company, AIG. This was coupled, in Europe, with substantial amounts of public money being used to rescue and
recapitalize financial conglomerates with sizeable insurance activities. Despite AIG paying back bailout funds in the following years, concluding repayments in 2012, this has raised the question of whether insurance companies can become an important source of systemic risk and, if so, which entities should be regulated and how. Since 2012, international regulators have proposed a new framework aimed at identifying and regulating Global Systemically Important Insurers (G-SIIs). This framework foresees stricter oversight of accounts and practices, the requirement for the
designated companies to prepare a plan allowing an orderly resolution of the entity in case of severe distress and, above all, envisages an additional capital requirement to which G-SIIs will be subjected, the Basic Capital Requirement (BCR).
This paper seeks to assess how financial markets have reacted to the introduction of this
regulation between the end of 2011 and the end of 2015. In particular, I try to gauge to what extent insurance companies designed as systemically important, or those who may be so in the future, enjoy a “too-big-to-fail” (TBTF) premium and/or whether the imposition of additional capital requirements has been perceived as burden. In order to distinguish with precision which entities are liable to fall under the new measures I explore the different layers of regulation recently proposed for domestically and internationally active insurance groups. Following what is being done for other components of the financial industry (especially banks) I use a time-tested event study methodology.
The results show that this regulation does matter to investors, as the key steps of the regulation were accompanied by statistically significant abnormal returns for the equity of the entities affected. Investors were able to identify which companies would be designed as G-SII a year and a half before the official designation, and the positive reaction to the extension of the framework for systemically important banks to insurance companies can be thought as the perception of a valuable “too- big-too-fail” implicit guarantee, in line with what was found in similar studies on the banking sector. However, when details emerged, after the formal designation, on what arguably is the most important policy measure, the Basic Capital Requirement, G-SIIs experienced negative abnormal returns, which can be seen as a gauge of the price of the TBTF guarantee. This
interpretation is corroborated by the fact that both the first–positive-effect and the second-negative-effect are stronger for more leveraged entities.
The overall impact of the regulation so far is not very large, slightly below what found for banks. Considering the group of G-SIIs, the cumulated abnormal return of the events, when they are statistically significant, is 0.58%. The -0.18% return differential with respect to a group of large multinational insurers which are not designated as systematic indicates that, so far, the price of the TBTF guarantee is perceived as slightly higher than its value. These findings, along with the results of the responsiveness of abnormal results to company characteristics, can hopefully inform the debate on the regulation and provide support for the next stages.
In Section 2 I briefly describe the cases of public bailouts of insurance companies during the 2007/8 financial crisis and sketch the new regulatory framework for global insurers that is being developed. Section 3 illustrates the differences between the banking and insurance business, the