Università Politecnica delle Marche
Scuola di Dottorato di Ricerca in Scienze dell’Ingegneria Curriculum Meccanica
---
Inspection and characterization of birefringent
materials: development of methods and systems for
scintillating anisotropic crystals
Ph.D. Dissertation of:
Luigi Montalto
Advisor:
Prof. Nicola Paone
Curriculum supervisor:
Prof. Daniele Rinaldi Dr. Paul Lecoq
XV edition - new series
Università Politecnica delle Marche
Dipartimento di Ingegneria Industriale e Scienze Matematiche
2
Abstract
A scintillating material has the peculiar capability to convert in visible light the energy of a radiating particle that interact within its volume.
The excitation can derive from different kinds of radioactivity or energy interaction that is able to excite electrons so to make them jump to a higher energy band and turn back to their equilibrium state. This mechanism leads to a release of photons in the visible (or near-visible) range.
The light produced by the scintillating material is usually monochromatic and represents the output of the conversion of the incident energy in the energy of a group of photons each of much lower energy than one absorbed, as it happens for all kinds of energy conversion.
The quality of light emitted by these materials has, also, great quality in terms of wavelength stability, coherence and polarization.
They are involved in fields like the nuclear and high energy physics (for instance, CERN-Geneva), medical and general bio-imaging (PET-positron emission tomography for cancer diagnosis), geologic research, security and laser technology. Performances of the scintillators rule the behavior of the instruments and the systems exploited in those fields; moreover, the quality of the material itself and the production efficiency, determine the cost and the feasibility of the above-mentioned activities.
In depth knowledge and characterization of the material is crucial to predict the behavior of the crystals from mechanical and optical viewpoint. Since the production process is quite complex, delicate and time consuming, industry needs tools to improve the efficiency and efficacy of the larger and larger production of these crystalline scintillators
The work presented in this thesis aims to the development of non-invasive methods and systems to assess the crystal quality through the determination of the residual stress state that can be the signature of the whole quality degradation due to different origins.
The developed methods are based on photoelasticity and optical crystallography; they allow to a very detailed analysis providing sensitivity and spatial resolution.
The possibility to have a complete characterization of the materials has been improved by the measuring in different direction with respect to the crystal optic axes.
The set of developed methods is completed by a new technique named Sphenoscopy, which provides reliable inspection of the crystal in a faster and simplified way whatever orientation of the crystallographic and optic axes.
Since they are based on the acquisition of fringe images, -the systems have been provided of dedicated algorithms to process and analyze accurately the fringe patterns carried out by the methods.
The information carried out by these methods are useful for both research bodies and industries, crystal producers and users, since they are crucial feedbacks to better understand the material behavior, develop predictive math models and set properly the production parameters.
3
Abstract
Un cristallo scintillatore ha la peculiare capacità di convertire, in luce visibile, l'energia di una particella radiante che interagisce con il suo volume.
L'eccitazione può derivare da diversi tipi di radioattività o interazione energetica che è in grado di eccitare gli elettroni in modo da farli saltare ad una banda di energia più alta e tornare indietro al loro stato di equilibrio. Questo meccanismo porta ad un rilascio di fotoni nel visibile (e vicino visibile).
La luce prodotta dal cristallo è solitamente monocromatica e rappresenta il prodotto della conversione dell'energia incidente in energia di un gruppo di fotoni di energia molto inferiore quelli assorbiti, come avviene per tutti i tipi di conversione di energia.
La qualità della luce emessa da questi materiali, in termini di stabilità di lunghezza d'onda, coerenza e polarizzazione, è estremamente elevata.
Essi sono coinvolti in campi come la fisica nucleare e la fisica delle alte energie (ad esempio, CERN-Ginevra), in campo medico nell’ambito del bio-immaging (tomografia ad emissione di positroni PET-per la diagnosi del cancro), la ricerca geologica, la sicurezza e la tecnologia laser.
Le prestazioni degli scintillatori incide sul comportamento degli strumenti e dei sistemi sfruttati in tali settori; Inoltre, la qualità del materiale stesso e l'efficienza di produzione, determinano il costo e la fattibilità delle suddette attività.
Una conoscenza approfondita e una buona caratterizzazione del materiale è fondamentale per prevedere il comportamento dei cristalli dal punto di vista sia meccanico che ottico. Poiché il processo di produzione è piuttosto complesso, delicato e lungo, l'industria ha bisogno di strumenti per migliorare l'efficienza e l'efficacia della produzione di questi scintillatori cristallini
Il lavoro presentato in questa tesi mira allo sviluppo di metodi e sistemi non invasivi per valutare la qualità dei cristalli attraverso la determinazione dello stato di stress residuo, che può essere una firma del grado di qualità.
I metodi sviluppati sono basati sulla fotoelasticità e la cristallografia ottica; permettono un'analisi molto dettagliata con elevata sensibilità e risoluzione spaziale.
La possibilità di avere una caratterizzazione completa dei materiali è stata migliorata riuscendo a misurare in direzione diversa rispetto agli assi ottici del cristallo.
L'insieme di metodi sviluppati è completata da una nuova tecnica denominata Sfenoscopia, che fornisce controlli affidabili del cristallo in un modo più veloce e semplificato ed in qualunque orientamento rispetto agli assi ottici.
Dal momento che i metodi si basano sulla acquisizione di immagini di frange, i sistemi sono stati forniti di algoritmi dedicati per elaborare e analizzare accuratamente le immagini acquisite.
Le informazioni ottenute con questi metodi sono utili sia per gli enti di ricerca che per le industrie, produttori e utenti finali. Esse sono fondamentali per avere la possibilità di comprendere meglio il comportamento del materiale, sviluppando modelli matematici predittivi, per impostare correttamente i parametri di produzione
4
Contents
Chapter 1
6
1
Introduction
6
1.1
Context of the research activity ...8
1.1.1
Outline of the main production procedures ...8
1.1.1.1 Czochralsky method ...8
1.1.1.2 Bridgman method ...9
1.1.1.3 Annealing ... 10
1.1.1.4 Machining ... 10
1.1.2
A touch upon the main fields of applications ... 11
1.1.2.1 Nuclear and high energy Physics ... 11
1.1.2.2 Medical bio-imaging (PET/SPECT) ... 12
1.2
Scope of this work ... 14
1.3
State of the Art. A brief survey ... 14
Chapter 2
17
2
Crystal Optics
17
2.1
Light and Polarization ... 17
2.2
Refractive Indices and Optical Indicatrix ... 23
2.3
Bertin surfaces ... 28
2.4
Conoscopic Fringe Patterns ... 32
Chapter 3
36
3
Birefringent crystals photoelasticity and the diffused light polariscope
36
3.1
Crystals Photoelasticity: Piezo-Optic effect ... 36
3.2
Diffused light polariscope. ... 40
Chapter 4
43
4
Innovative contribution: Laser Conoscopy and Sphenoscopy
43
4.1
Laser Conoscopy ... 44
4.2
Laser Conoscopy: observation orthogonal with respect to the optic axis ... 47
5
4.3
Sphenoscopy ... 52
4.4
Fringe analysis algorithms ... 55
4.4.1
Laser Conoscopy – observation along the optical axis ... 55
4.4.2
Laser Conoscopy: observation orthogonal to the optic axis ... 57
4.4.3
Sphenoscopic fringe patterns ... 58
4.5
Experimental validation and results ... 60
4.5.1
Laser Conoscopy along the optic axis: tests and validation ... 60
4.5.1.1 Unloaded conditions... 60
4.5.1.2 Loaded condition by four point bending test ... 62
4.5.1.2.1 Assessment of the local inspection ... 62
4.5.1.2.2 Detecting the stress distribution ... 64
4.5.2
Observing orthogonally to the optic axis: experimental test ... 67
4.5.3
Sphenoscopy: testing the technique ... 70
4.5.3.1 Observing along a random direction ... 71
4.5.3.2 Inspection of a non-homogenous sample ... 72
Chapter 5
74
5
Impact
74
5.1
CERN experience ... 74
5.1.1
Interesting Results ... 74
5.2
Saint Gobain Recherche: technological transfer... 77
5.3
Testing PWO: Crytur experience ... 78
Chapter 6
80
6
Concluding Remarks
80
6.1
Conclusions ... 80
6.2
Future improvements and potential development ... 81
6
Chapter 1
1 Introduction
A scintillating material has the peculiar capability to convert in visible light the energy of a radiating particle that interact within its volume.
The excitation can derive from different kinds of radioactivity or energy interaction that is able to excite electrons so to make them jump to a higher energy band and turn back to their equilibrium state. This mechanism leads to a release of photons in the visible (or near-visible) range.
Basically, the same phenomenon governs phosphorescence, luminescence and scintillation, differing by the internal mechanisms involved and by their decreasing time scales [1].
Light Yield (LY), rise and decay time (τ), wavelength and energy resolution (ER) are some of the main characteristic parameters of the phenomenon [2].
Briefly: LY is the number of photons (light intensity) produced with respect to the energy interaction, rise time and decay describe the duration of the scintillation phenomenon (the rise of intensity and the decay), ER describe how narrow is the peak in the emission energy spectra (narrower the peak, better the capability to discriminate the incoming energy of the radiation.) [2].
The light produced by the scintillating material represents the output of the conversion of the incident energy in the energy of a group of photons each of much lower energy than one absorbed, as it happens for all kinds of energy conversion. The quality of light emitted by these materials has, also, great quality in terms of wavelength stability, coherence and polarization.
It is obvious that these objects find place in number of applications as primary transducers of sophisticated and complex systems.
They are involved in fields like the nuclear and high energy physics (for instance, CERN-Geneva), medical and general bio-imaging (PET-positron emission tomography for cancer diagnosis), geologic research, security and laser technology. Performances of the scintillators rule the behavior of the instruments and the systems exploited in those fields; moreover, the quality of the material itself and the production efficiency, determine the cost and the feasibility of the above-mentioned activities.
Applications, by their growing demand in space and time resolution, light production, sensitivity and general improvement of the quality, prompted the increased performance of the Scintillators.
Synthetic mineral crystalline scintillators still represent the best performing material; therefore, more and more efforts are aimed in this direction.
This generation of materials is characterized by an excellent time resolution, with a steep rise and short persistence (no afterglow) of the luminescence, due to a chemical structure that gives high properties and reliable performance over time and a resistance to working conditions (no aging, radiation resistance) [3]. By choosing high atomic number, Z, chemicals, high density crystals can be synthesized, ensuring the tight containment of deposited energy -thus reducing the instrument dimensions [2].
In depth knowledge and characterization of the material is crucial to predict the behavior of the crystals from mechanical and optical viewpoint. Since the production process is quite complex, delicate and time consuming, industry needs tools to improve the efficiency and efficacy of the larger and larger production of these crystalline scintillators [4].
The work presented in this thesis aims to the development of non-invasive methods and systems to assess the crystal quality through the determination of the residual stress state that can be the signature of the whole quality degradation due to different origins.
7
The information carried out by these methods are useful for both research bodies and industries, crystal producers and users, since they are crucial feedbacks to better understand the material behavior, developing predictive math models, and to set properly the production parameters.
The conceptual process will be presented starting from the state of the art which is the base of the developed methods, with a dedicated section about the impact of this research.
Hereafter, some paragraphs will outline briefly the main fields in which scintillating crystals are involved, their principal production techniques and criticalities.
8
1.1 Context of the research activity
1.1.1 Outline of the main production procedures
Scintillating crystal production evolves from the chemical laboratory to the industrial scale. Crystals are produced by growth methods specific (optimal) for every chemical compound, part size and quantity [1].
A variety of techniques is used to grow scintillating inorganic crystals. They are all derived by two main methods, which are named Czochralsky and Bridgman [5].
Upstream, the preparation of raw materials is a mandatory prerequisite for crystal quality. Purity must be controlled, affecting scintillation (afterglow, light yield) transparency (color centers) radiation resistance and built-in stress level (cell distortion).
Dopant species and quantity are responsible for the lightning performances and production. The dopant fraction is usually of a few percent. They should be chosen to match the lattice properties to the best (crystal symmetry, lattice parameters). Two obstacles must be faced: segregation, that makes light production uneven over the crystal volume, and lattice distortion, that may induce mechanical stress and be detrimental to the production yield.
1.1.1.1 Czochralsky method
In Czochralsky method (Fig. 1.1), raw materials are molten in a metallic crucible and kept slightly above fusion point. A small crystal of the same material (seed) is put in contact with that molten bath and pulled up to lift a small meniscus of liquid by capillarity. Solidification occurs at a position and at a rate ruled by several parameters [6].
Fig. 1. 1 A schematic representation of the Czochraski growth method; a hot melt of raw material is put in contact with a pure crystalline seed (slightly colder), generating a meniscus where the melt starts to solidify. Then the growth crystalline part is pulled up (or down) slowly so to produce the boule.
9
The thermal gradient is regulated by an induction loop heating the melt with the help of the crucible mass. The melt temperature is homogenized by crucible regulation. The rising solidified bulk takes the shape of the desired ingot (or boule). The pulling rate gives the ingot its conical top and bottom ends and its cylindrical overall shape. Optimal conditions result in turning the full melt into the ingot volume. The growth of a 1kg PWO ingot take a time of the order of 1 day. The ingot shape may be facetted or oval, depending on the crystal lattice and on the seed orientation. The latter is a critical parameter.
1.1.1.2
Bridgman method
A scheme is presented in (Fig. 1.2a). This method is an evolution of the fusion zone refining method [6]; the hot zone moves along the length of the furnace while the crystal growths. The raw (in powder form) material is shaped to the final part proportions with extra thickness for the mechanical processing to follow. The shape is usually an elongated prism (Fig. 1.2b). A monocrystalline seed is placed at one end. This assembly is contained in a thin (a few tenths of a mm) metallic envelope, usually made of platinum.
a
bFig. 1. 2 A scheme of a possible Bridgman setup (left). In this case, it is the heater that moves along the crucible length. The seed is placed at a side of the crucible and the powder of raw material first melts and then crystallizes while the heater goes back and forth several times. The technique allows to prepare a multiple crucible shaped more or less like the requested final geometry.
One or several of these assemblies are positioned in the furnace enclosure. The fusion zone (thermal gradient) moves from the seed interface along the ingot length by combining several induction loops. The gradient displacement velocity is comparable to the Czochralsky growth rate, but the operation must be repeated several times (at the week scale) to reach monocrystallinity and purity at the required level. The Bridgman process competes with the Czochralsky method only using multiple ingot furnaces, so to have a parallel production.
10
1.1.1.3 Annealing
The solidification process results in thermally-induced stresses. They are supposed to have the conventional parabolic profile, with moderate compression in the core, and higher tension at the periphery. The latter is a matter of concern as crystals are especially prone to breaking in tension (crack opening). Annealing is necessary to reduce these tensions. The annealing temperature is very close to the melting point to ease dislocation movements and elimination. The thermal effect is sometimes combined with the presence of a chemical element in a controlled atmosphere, as a chemical correction is expected to restore the crystal lattice equilibrium. In that case, annealing time is governed by diffusion and may take several days.
The annealing furnace is therefore a complex temperature controlled device and annealing is a costly operation in time and money.
Moreover, the annealing step is performed to recover the radiation damage too; since in this process the thermal time gradient could be faster, the distribution of the eventual residual stress can be critical.
1.1.1.4 Machining
Cut and shape the crystals according to the needs is a delicate part. This is a key activity to avoid material wasting or induce stress and bad surface condition. Ingots are the base material for expensive parts tightly specified in shape and dimensions. Mechanical processing is designed to achieve these two goals.
1) For calorimeters, ingots are usually dimensioned for the yield of one piece. Attempts were made to get two and even four pieces out of an ingot.
11
1.1.2 A touch upon the main fields of applications
Two of the main fields are briefly reported; nuclear and high energy physics and medical imaging. The basic principles are described outlining the criticalities.
1.1.2.1 Nuclear and high energy Physics
Scintillating crystals, in the High-Energy Physics, are used to build calorimeters (Fig. 1.3) with the scope of measuring the effect of elementary particles generated during particle (e.g. electrons) collisions in accelerators.
The spatial energy distribution (intensity, frequency) due to collisions allows physicists to detect the kind of generated particles, the decay time and many others information.
Fig. 1. 3 The huge dimensions of the CMS detector are shown in this figure. It is possible to note them with respect to the human height (in black). About 80000 PWO crystals are mounted into the device, coupled with sophisticated photodetectors [7] and electronics.
About 80000 large sized Yttrium doped PWO (PbWO4) crystals are installed on the CMS calorimeter [7].
The extreme speed of response, together with specific spectral sensitivity, high light yield and good radiation absorption capacity are the discriminating parameters for the choice. The critical working environment requires highly performing and quality crystals. In fact, the high radiation rate and the heavy radiating particles (e.g. hadrons) could degrade the scintillation efficiency, radiation hardness [3] is therefore one of the main characteristic to consider.
High density is mandatory to increase the stopping power [2], ensuring the capability to stop high energized particles. In this case, PWO crystals have a low light yield [3], therefore light extraction became crucial to the good behavior of the CMS system; crystal geometry and homogeneity of the refractive indices need attention too.
The large size required for these dense and brittle material poses some issues for the production and the behavior during function.
12
Increasing size means a much more complex thermal and motion control during the growth and could heighten the development of a thermal residual stress distribution. This is a crucial problem during the cutting and assembly of the crystals; the risk of unwanted fractures during function, due to thermal shock (due to the light production mechanism or during the annealing process used to recover from the radiation damage) or the instauration of non-predicted stress in the CMS modules, is linked to that stress condition.
Finally, the stress could dramatically change the distribution of the refractive indices, influencing the light extraction.
1.1.2.2 Medical bio-imaging (PET/SPECT)
The knowledge of elementary particles allowed, in the last decades, the development of technological devices for Medical diagnosis based on the detection of high energy photons. One of the most promising techniques in the field of cancer diagnosis and cerebral activity monitoring is the Positron Emission Tomography (Fig. 1.4).
Fig. 1. 4 A scheme of a PET behavior, the back to back emitted gamma rays are detected by the scintillators placed on a ring. If the crystals have a good quality and a fast response (fast decay time) the emission point can be evaluated along the line by the measure of the time of flight. Otherwise more statistics and a higher computational effort is needed, resulting in a longer persistence of the patience exposition.
In PET the patient ingests some radio-element that releases positrons (beta decay). The recombination of the positron with an ambient electron produces two opposite gamma rays of well-defined energy (511 keV) detected in opposite scintillator pixels (usually 2 x 2 x 10 mm3 prisms) [8].
Modern devices aim to be characterized by lower radiation doses (and/or shorter exposures), 3-D information (tomography), real-time observation, tissue or function identification, with the help of large arrays of fine scintillators (pixels) surrounding the patient or covering the organ (mammography) and powerful reconstruction software [9].
Even if the architecture and the principle of detection is similar to the calorimeters, the different scope and dimensions require special characteristics of the scintillators.
13
Also, a good energy resolution (a well-defined peak of emission) to increase the sensitivity is needed. A fast response with a short decay time is needed to achieve a time of flight PET analysis (TOF-PET), crucial for a shorter exposure of the patient and a real-time diagnosis.
Each PET is provided of about 20000 crystals. Aging and stability of the scintillators are crucial for the behavior of this complex medical tool. Growth and machining are critical as well as the homogenous distribution of the dopants (performance decrement and lattice distortion can derive from an incorrect distribution).
Stress and distortion affect dramatically the functional properties and the production efficiency. The induced change of the refractive indices affect the light transport and extraction; a low residual stress state makes the machining and polishing more efficient. The capability to endure to eventual shocks is improved controlling the stress state, so to achieve a slow aging.
SPECT [10] (single photon emission computed tomography, namely Positron emission single photon), is another diagnostic technique very similar to PET [10]. It is largely used for the diagnosis of diseases of brain and neuroendocrine system. SPECT differs from PET by the use of radioactive compounds that directly emit gamma rays.
An example is the use of the isomer 99mTc, which decaying emits a single photon; this has a peak around 140 keV and the half-life of 6 hours. The SPECT technology is, usually, less expensive than the PET and the exposition is typically short (15-20 seconds each image acquisition). It offers the possibility to visualize the hematic flow for a long time.
After the injection of the radioactive substance, a gamma camera (Fig. 5) acquires planar images at several angles around the phantom or the patient. By these, a 3D reconstruction of the images is achieved. The main elements which compose the gamma camera are (Fig. 1.5):
1. The collimator: a lead plate with holes which allow gamma rays in a particular direction; it is used to manage the magnification and the field of view.
2. Pixelated scintillating crystals, used to convert the gamma photon in light signals. 3. Photodetectors
4. Computing system
Fig. 1. 5 A scheme of a gamma camera. The collimater allows gamma rays, coming from the phantom (head), which have a particular direction, the pixelated crystals convert the gamma rays in light detected by the photodetectors which produce electric signals analyzed by the computer.
The quality of the pixelated crystals rules the entire behavior of the device. To achieve spatially resolved images, they are machined in very small pixels; it is, therefore, fundamental check their condition, since this affects the performances in terms of sensitivity, energy resolution and light collection, influencing the quality of the signal.
14
1.2 Scope of this work
In the previous paragraphs, the production processes and some of the main applications which involve scintillating crystals have been briefly outlined with their own characteristics and criticalities. The crystals functional behavior and service life are related to their quality; their internal structure and mechanical stress may affect negatively performance and lifetime. Unwanted or unpredict failure during production or during function are linked to the mechanical stress conditions that is relate to the whole crystal quality.
Stress and structure distortion may affect the lightning phenomena so to lead to an out of design performances with unpredictable and non-repeatable behavior.
A deeper knowledge of the opto-mechanical behavior and the assessment of the crystal condition, are mandatory to overcome the above-mentioned issues.
This work deals with the development of method and systems to characterize and evaluate the condition of birefringent crystals by means of the assessment of the residual stress state [11].
Residual stress is a good indicator of the crystal quality, since it affects the crystals from the production to the function. The developed methods are aimed to achieve:
A safe check of the samples state, since crystal are expensive and delicate
An efficient quality control systems and useful feedbacks for the production process. Reliable tools to develop predictive models of the opto-mechanical behavior.
Therefore, methods which can have a transversal exploitation, from research to the industries and users, have been developed.
To be suitable for the purpose, non-invasive techniques have been developed and optimized.
Since scintillating crystals are mostly naturally birefringent and transparent materials, photoelastic methods [12] and optical crystallography [13][14] techniques are suitable bases for the work. Moreover, they allow to develop non-destructive testing methods, which are relevant for process and quality control of crystal production.
In fact, these methods have been adapted and optimized for the purpose of scintillating crystal inspection.
1.3 State of the Art. A brief survey
Scintillating materials are transparent and usually are optically anisotropic. Internal stress causes lattice strain and deformations, which manifest as stress induced birefringence [12]; this means that the distribution of the refractive indices varies as a function of stress. The piezo-optic properties of the material can be observed to verify its internal strain (or stress) state.
Photoelasticity is a classical measurement technique suited to observe stress induced birefringence in transparent materials, classically used for isotropic materials [11].
15
Fig. 1. 6 On the left a scheme of a polariscope set-up: a) the diffuse light source, b) and d) the crossed polarizers (d is usually called analyzer), c) the sample, e) acquisition system. On the right the typical fringe pattern due to a residual stress condition in an isotropic material.
Therefore, photoelasticity is a suitable and non-invasive method for quality control of scintillating crystals. This measurement method, implemented by observation in polarized light (polariscopes), provides information on crystal quality, related to mechanical strain and stress, and requires an accurate knowledge of piezo-optic properties of the material [14][15], which are not always available. Furthermore, it is a volumetric technique which provides information on the spatial integral of the stress distribution along the light path through the crystal.
The optical properties of transparent naturally birefringent materials are often observed and evaluated by means of conoscopy [13]. Observation made by converging or diverging polarized light (conoscopy) in transmission through an optically transparent crystal allows to observe interference fringes, which provide information about the structural and elasto-optic properties of the material. Qualitative and quantitative information about external influences, such as temperature, stress, electric, and magnetic fields, on optical characteristics could be extracted through the conoscopic observations [16].
Conoscopy is well known in both mineralogy and optical crystallography [17] where the method is usually implemented by means of the polarized microscopes to determine the species and the characteristics of the crystal mineral. The method is also used to evaluate the light characteristics like polarization (e.g. in [18])
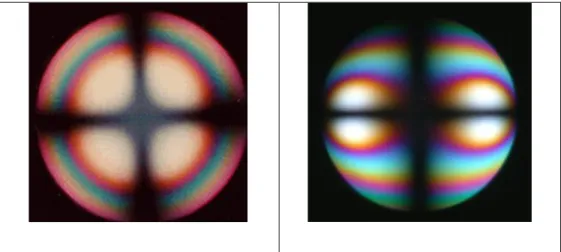
The technique, generally used for naturally birefringent materials, produces fringe patterns that are a signature of the crystal structure even if stress is not present (Fig. 1.7).
Fig. 1. 7 Fringe patterns carried out by means of polarized microscopes in conoscopy configuration (diverging light) observing anisotropic media. The shape is a signature of the crystal symmetry: uniaxial crystal on the left and biaxial on the right.
16
Photoelasticity and optical crystallography, by means of Conoscopy, are at the bases of this research activity in conjunction with image processing and analysis techniques [19]. In fact, an efficient data process is mandatory to obtain reliable fringe pattern images.
Actually, the use of the classical diffuse light polariscope applying conoscopic observation is the state of the art for non-invasive analysis of the crystal state. How it will be outlined in chapter 3, these systems are reliable and capable to evaluate the crystal condition, allowing to assess the correspondence between interference fringe pattern shape and stress level [20]. They are not affected by environmental condition and external influences like vibrations, temperature and crystal surface quality. Anyway, the classical polariscope based methods present limitation in terms of sensitivity, spatial resolution and precision.
17
Chapter 2
2 Crystal Optics
Scintillating Crystals are optically transparent, therefore photoelastic methods; in transmitted light, are natural candidate to build up a non-invasive technique to check the crystal conditions and characterize them.
The behavior of the light transmitted through the medium depends by its optical characteristics linked to the refractive indices distribution [13].
One example of the interaction between light and matter is the well-known Snell law [17].
The refractive index distribution along the optical path of a light beam will affect the electromagnetic wave (light) with respect to its wavelength (λ), polarization (direction of the vibration of the electric field) and direction of propagation [14]. The photoelastic phenomena treated in this work are therefore linked to how the light propagates into the media rather than the interaction at the interface of two different media.
In this chapter, it will be briefly shown the difference between isotropic media and anisotropic ones (naturally birefringent crystals) considered in this work.
At the base of the treatment there is the wave theory of light (light wave), therefore, some about light wave and polarization will be briefly outlined hereafter.
2.1 Light and Polarization
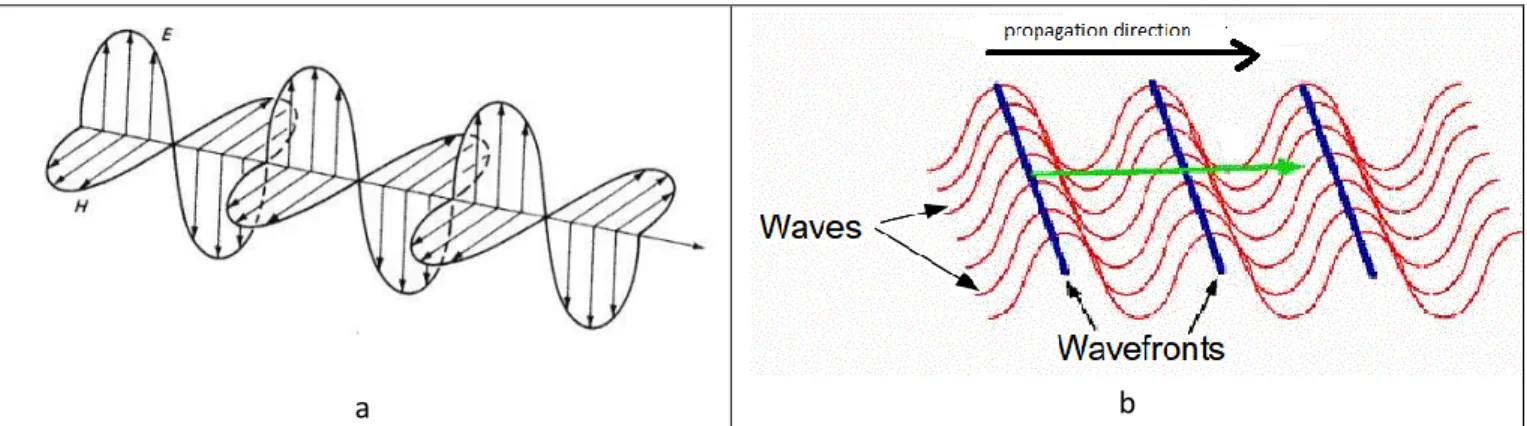
The wave model describes the light as a composition of electric E and magnetic H field which are in phase each other and that oscillate perpendicularly to each other (Fig. 2.1a). The wavelength λ and the frequency f are connected each other by the law:
c
f
(eq. 2.1)Where c is the speed of light. The light waves can propagate in several directions. The loci of points where at the same time
t the electric fields vibrate in the same way (they have the same phase) is defined as wave front. The shape of the wave front
18
a
b
Fig. 2. 1- Electromagnetic wave representation (a) as the oscillation of E, electric field, and H, magnetic field, in phase and mutually orthogonal. (b) representation of the wavefront in a coherent propagation of light waves.
Maxwell equations in vacuum describe wave propagation. These equations connect the spatial E and H variations to their temporal variations [21]. 2 2 0 0 2
t
E
E
(eq.2.2) 2 2 0 0 2t
H
H
(eq. 2.3) Where: - µ= magnetic permeability [17]; - ɛ = dielectric constant [17];To describe an optical wave just the E vector is considered. The electric field function that satisfy the equation (2.2) is:
E = E
0e
i(kr - ωt)(eq. 2.4)
In which:
- E0 = vector amplitude;
- k = wave vector with the amplitude 2π/λ and parallel to the propagation direction;
- r = displacement vector; -ω = angular frequency = 2πf.
In the case of a plane wave front wave which propagates in the z direction it is possible to write the function:
ct)
(z
λ
π
E
E
0cos
2
(eq. 2.5)19
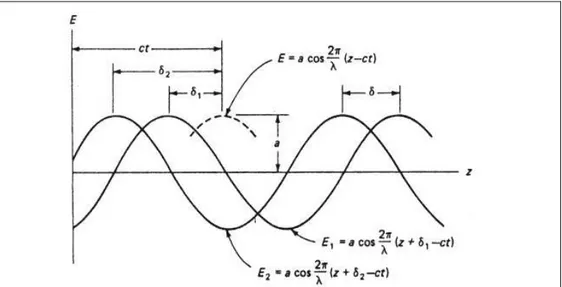
Fig. 2. 2 representation of waves with the same characteristics in terms of λ, amplitude and ω (2πc/λ) but with different delay δ.
The waves in Fig. 2.2 can be described by the functions [17]:
ct)
(z
λ
π
E
E
0cos
2
(eq. 2.6)ct)
(z
λ
π
E
E
1
0cos
2
1
(eq. 2.7)ct)
(z
λ
π
E
E
2
0cos
2
2
(eq. 2.8)A comfortable representation is achieved if the following assumptions are made:
Let’s define the phase delay as
–
(eq. 2.9)And the phase angle as
z
(
)
2
(eq. 2.10)The three equation can be written as:
t)
(
E
20
t)
E
E
1
0cos(
1
(eq.2.12)t)
(
E
E
2
0cos
2
(eq. 2.13)A wave emission is composed by a series of short impulses and from great number of emitting atoms; each impulse contains a discrete number of oscillations; this is usually called wave train. If the emissions are not coordinate each train will be different to the other in terms of amplitude, phase and vibration plane. That is, the light is not coherent. Otherwise, if the light has a regular wave front and vibrates ordinately then is defined coherent (Fig. 2.1b).
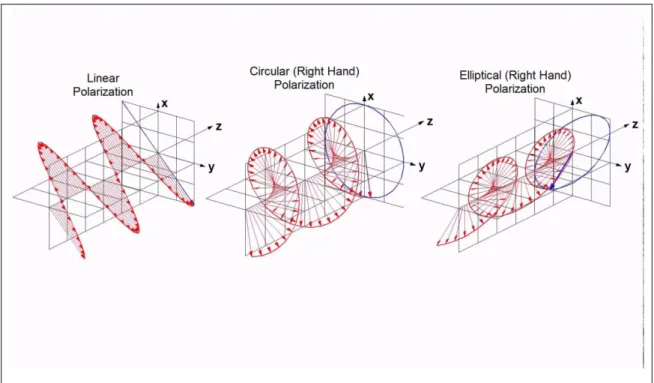
Polarization of light, is about how the light wave vibrates along its propagation path. The harmonic light waves (defined as the oscillation of the Electric Field E) can vibrate in a plane, then is linear polarized or plane polarized (Fig. 2.3a) but can also vibrate generating a circular or elliptic helix (circular and elliptic polarization Fig. 2.3b and c), or randomly (unpolarised) like most the light sources.
Fig. 2. 3 polarization of the light wave (how the electric field vibrates); linear (a), circular (b) and elliptical (c).
21
Fig. 2. 4 two identic light waves which vibrate in mutually orthogonal planes. The resulting wave by their composition has a polarization which is a function of the delay and the amplitudes.
Let us consider the waves in Fig. 2.4, they are defined with the harmonic motions:
t)
(
E
E
x
0xcos
(eq. 2.14)t)
(
E
E
y
0ycos
(eq. 2.15)They can be rearranged so to eliminate the time and see what the tip of the resulting vector E describes on the plane orthogonal to the propagation [13].
t)
(
E
E
x xcos
0
(eq. 2.16))
sin(
)
sin(
)
cos(
cos
0
t)
t
(
E
E
y y
(eq. 2.17) Substituting:)
sin(
1
)
cos(
2 01 2 0 0
E
E
E
E
E
E
x x x y y
(eq. 2.18)Transposing and squaring
)
(
sin
1
)
cos(
2 2 0 2 2 0 0
x x x x y yE
E
E
E
E
E
(eq. 2.19)22
)
(
sin
)
cos(
2
2 0 0 2 0 2 0
x y x y x x y yE
E
E
E
E
E
E
E
(eq. 2.20)This last equation represents an ellipse in the plane X-Y. Remembering the equation (eq. 2.10
)
in that plane (Z=0) we can describe some cases of the function in (eq. 2.20). The trace of the tip of the E vector of the resulting wave:For
= ±Nπ, that is,
2
N
(with N integer number) the equation of a straight linear is obtained (linear polarization Fig. 2.3a) as:0
2 0 0
x x y yE
E
E
E
(eq. 2.21) x x y yE
E
E
E
0 0
(eq. 2.22)It is worth to notice that the linear polarization of pair and odd N numbers are mutually orthogonal. When
2
N
±
or
4
N
,
in which N is a whole odd number the equation of an ellipse (Fig. 2.3b) is obtained and of a circle if E01 and E02 have the same amplitude (Fig. 2.3c):1
2 0 2 0
x x y yE
E
E
E
(eq. 2.23)23
2.2 Refractive Indices and Optical Indicatrix
Reflection, refraction, absorption [17] are some of the phenomena linked to the interaction between matter and light waves. Here the behavior of the light propagating through the media is outlined rather than the phenomena at the interfaces. When the oscillating electric fields passes through a substance, interacts with atoms and ions perturbating the electric atmosphere. Actually, an oscillation is forced in the substance particles and the restoring forces of the induced vibrating dipoles (due to the substance and crystal structure) rule the propagation of the electromagnetic wave [22].
The interaction depends by the direction of the oscillation of the electric fields [21] and by the bonding forces of the structure [22].
The speed of the electromagnetic light wave is slower than the speed in vacuum when it passes through a medium [17] and depends by the magnetic and dielectric properties of the material [21] (eq. 2.24).
1
v
(eq. 2.24)The ratio between the speed of light in vacuum c and the speed in the material is named refractive index n [17].
Since in this case the constant µ is the same as in the vacuum, the definition of the refractive index is (for further details see [13], [17] and [21]):
n
(eq. 2.25)Or, considering the dielectric impermeability
1
B
[21]:B
n
1
(eq. 2.25)In case of isotropic material, the refractive index is the same for each direction of the propagation while, in optically anisotropic there is a distribution of the refractive indices with respect to the direction of the light. In fact, light transmitted energy depends by the arrangement of the dipoles that conforms to the crystal requirements of internal symmetry [22]. Therefore, isometric crystals (e.g. cubic ones) or amorphous material transmit the energy in an isotropic behavior while, not isomeric structures (e.g. hexagonal or rhombohedra) have anisotropic transmission of light.
In these last materials, the refractive indices are represented by a positive-definite and symmetric tensor [23].
The light transmitted through the anisotropic media is represented by the eq. 2.26 in which D is the electric displacement vector (for further details see [20][21][22]).
z y x zz zy zx yz yy yx xz xy xx z y xE
E
E
D
D
D
(eq. 2.26) Or shorter24
D
E
(eq. 2.27)From the eigenvalues of
the principal refractive indices can be derived, which describe the optical behavior of the media.x x
n
,n
y
y ,n
z
z (eq. 2.28)By the [17] and [20], considering that
1
D
E
, the dielectric energy is defined as follow [20][21][22]:
D
D
U
1
2
1
(eq. 2.29)
In the most general case the surface with constant energy is an ellipsoid [22].
C
z
y
x
z y x
2 2 2 or (eq. 2.30)C
n
z
n
y
n
x
z y x
22 22 2 2 or (eq. 2.31)C
z
B
y
B
x
B
x 2
y 2
z 2
(eq. 2.32)This ellipsoid describes the distribution of the refractive indices and it is named as Fresnel ellipsoid, index ellipsoid or optical indicatrix [13].
By eq. 2.30 three cases can be distinguished with respect to the light transmission according to the eigenvalues of eq. (2.26):
1) isotropic behavior (nx=ny=nz=n), the ellipsoid became a sphere (Fig. 2.5) and the light is transmitted in the same way in each direction.
Fig. 2. 5-the image from [13] represents the transmission of light in an unstressed isotropic substance; the light propagation behavior is the same for each direction, the radius of the sphere is proportional to the refractive index.
25
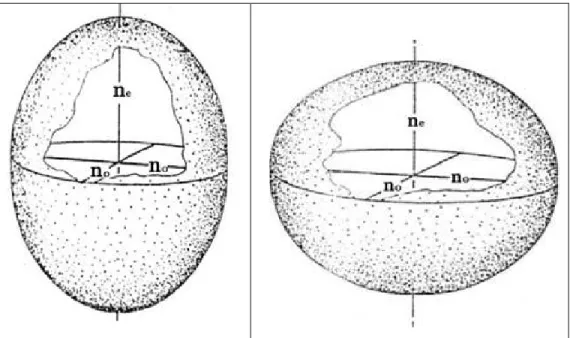
2) anisotropic uniaxial behavior (nx=ny≠nz), the ellipsoid has one axis. This axis is normal to the circular cross section with the radius equal to nx=ny and it is named optical axis. The refractive indices nx and ny have the same value and are named ordinary indices no. the other index nz is named extraordinary index ne (in Fig. 2.6 are reported the positive and negative ones [13]).
Fig. 2. 6-the uniaxial optical indicatrix is shown in the pictures (positive on the left, with ne>no, and negative on the
right). The light transport behavior changes as a function of the direction of propagation. The optical axis is the axis normal to the circular surface with its radius proportional to no (ordinary refractive index). In this direction, an
isotropic behavior is maintained and the light does not change its initial polarization, running with one velocity. Any other direction shows anisotropic behavior and the birefringent effect [13], these directions are normal to ellipses with one axis equal to no and the other depending by the specific direction (n’). the resulting electromagnetic
perturbance is the sum of two different waves mutually orthogonal polarized (as the axis of the ellipse normal to the direction no and n’) and traveling with different velocities (a phase delay is carried out).
3) anisotropic biaxial behavior (nx≠ny≠nz). In this case the ellipsoid has two axes with circular cross section (two optical
axes that lie on the optical plane). Even in this case, ordinary and extraordinary refractive indices can be recognized as
the radius of the circular cross sections and the dimension of the circular axes (in Fig. 2.27 are reported the positive and negative ones).
26
Fig. 2. 7-biaxial indicatrix, the optical axis are represented as the normal to the circular cross section. Along these directions an isotropic transport of light is present ruled by one refractive index (no).along any other direction the
resulting perturbance is composed by two waves delayed and polarized as the axis of the ellipses normal to the specific direction.
The angle between these axes can be evaluated by (eq. 2.31) [17].
2 2 2 2 2
1
1
1
1
y z x yn
n
n
n
tg
(eq. 2.33)In the last two cases, the media have an isotropic behavior in the direction of the optical axes only. In any other direction, it has been demonstrated by theory and proven by experiments that any electromagnetic perturbation consists in the sum of two plane and mutual orthogonally polarized light waves [13]. These waves are affected by different forces acting to restore the vibrating dipoles, therefore, they travel with different velocities [17]. In fact, for these directions the refractive indices are represented by the axis of their cross section. These anisotropic material, are naturally birefringent [14].
It is worth to remind that the combination of such waves gives a resulting wave with a polarization which depends by the relative delay.
In general, for the anisotropic media the light propagation is affected by the fact that the electric field E and the displacement vector D are not parallel except along the direction of the optical axes.
To get the idea of the behavior a sort of Huygenian construction [13] is presented considering that the axes of the index ellipsoid are the direction of vibration of the waves which move with a velocity related to that axis (inversely proportional to the refractive index).
27
This means that the velocity surface about the ordinary light waves (governed by the ordinary index) is a sphere while the one about the extraordinary ray (velocity proportional to
e
n
1
) is still an ellipsoid.
Some section of this surfaces are presented and the wave front behavior explained in the Fig. 2.8 [13];
a
b
c
Fig. 2. 8-in the image, sections of the ray velocity propagation surfaces are shown. These surfaces are related to the optical indicatrix (velocity is proportional to
n
1
) and in the figures the trace of the refracted rays are drawn. The polarization is indicated as dots, when the vibration is normal to the section, and with doubled arrows lines, when the vibration is parallel to the section. The light impinges normally to the surface. In (a) the ray is not refracted and crosses the crystal thickness along the optical axis; therefore, a uniform and isotropic behavior as recognized. In (b) the light goes along the orthogonal direction with respect to the optic axis; even if the light run the same path, a birefringent effect is present. In fact, the resulting wave is composed by the sum of two orthogonally polarized waves which run with different velocities (one with V proportional to
o
n
1
and the other with V proportional to e
n
1
). The light emerges from the outlet surface with a phase delay. In (c) the crystal is cut randomly. The impinging ray (normal to the inlet surface) is divided in two rays. The ordinary ray (not refracted) follows the spherical propagation and the other (refracted) the elliptical. In the image the wave fronts are draw as tangent to the ray velocity surfaces. The overall electromagnetic perturbance is composed by two waves. The waves have different velocity and run through different paths. The extraordinary ray is refracted again at the outlet surface (normal to that surface). The emerging rays have achieved a phase delay.
It is clear how when rays of lights propagate in direction different from the optical axes, each ray is divided in two mutually orthogonally polarized waves which propagate with different velocities [13].
28
2.3 Bertin surfaces
In the previous paragraphs, it has been outlined how the delay between interacting light waves affects the resulting one. In our case the delay can be generated by birefringent material and it is ruled by their optical indicatrix (refractive indices distribution) and the relative ray velocity surfaces.
Consider the Fig. 2.8b, in that case two waves are travelling the thickness of the crystal along the same path but with different velocities and mutually orthogonal polarized.
At the outlet surface, they get a delay due to the thickness and to the different refractive indices (eq. 2.34). That is, defining the dimension of the thickness as d:
d
n
d
n
e
o
(eq. 2.34)It is convenient, here, to express the delay as optical path difference (related to the wavelength λ) and as phase delay
(
2
):
n
en
o
d
N
(eq. 2.35)
n
en
o
d
2
(eq. 2.36)About the delay (optical path or phase delay) it is possible to trace points with the same phase delay and optical delay in terms of number of wavelength. These points compose the so called Bertin Surfaces [13][24], that is, the loci of point where the refracted waves get the same phase delay.
29
a
b
Fig. 2. 9- construction of the Bertin surfaces [13]; (a) two-dimensional representation of the equal delay or optical path difference as function of the angle of refraction. (b) three-dimensional reconstruction by means of the circular symmetry of the light behavior around the optic axis.
Considering a small angle between the ordinary and the extraordinary ray [17] the Fig. 2.9a can be represented with an equation similar to the (eq. 2.36 and 2.37):
(
)
sin
2cos
2
o e mn
n
d
(eq. 2.38)Where θ is the angle between the refracted ray and the optic axis, while θm is the angle between the optic axis and the bisector of the ordinary and extraordinary ray; practically, θm=θ. The same equation is achievable for the optical path difference.
(
)
sin
2cos
mn
en
od
N
(eq. 2.39)In the same manner, Bertin surfaces can be traced for the biaxial crystals. Hereafter the construction of the curves for the three planes of symmetry of the optical indicatrix are reported [13] (Fig. 2.10), described with mathematical approach as (eq. 2.35).
30
a
)
(
cos
m y in
n
d
N
(eq. 2.40)b
)
(
cos
mn
zn
id
N
(eq. 2.41)c
)
(
cos
m i xn
n
d
N
(eq. 2.42)Fig. 2. 10 Two dimansional trace of the biaxial Bertin surface in the planes of the principal section of the optical indicatrix. On the right are repoted the relative path difference relation as function of the refractive indices.
The evaluation of ni has been made for each angle by the (eq. 2.43) [13]:
2 2 2 2 2 2 2cos
sin
z x x z in
n
n
n
n
(eq. 2.43)31
By the Fresnel treatment [17] the Bertin curves can be represented by a relation similar to (eq. 2.39), taking into account that the refracted middle ray has an angle from each optic axis (θ1 and θ2).
2 1
sin
sin
)
(
cos
z x mn
n
d
N
(eq. 2.44)The curves and the mathematical relations are at the base of the construction of the biaxial Bertin surfaces (Fig. 2.11).
a
bFig. 2. 11- three-dimensional reconstruction of the equal path difference curves in biaxial crystals, (a) by [26]. (b) computer simulation of the Bertin surfaces by the model in [26].
Starting from this, a fourth-order polynomial expression representing the Bertin surfaces has been found in [20][27] (eq. 2.45):
2 2 2 2 2 2 2 2 2 2 2 22 ( ) 1 cos sin 1 cos sin
z y x x z z y x x z n n z y x N x z (eq. 2.45)
32
2.4 Conoscopic Fringe Patterns
The Bertin surfaces are mathematical concepts which are helpful to determine the optical path difference and the phase delay of light waves traveling through a birefringent crystal. Fringe patterns are observed using polarized light and optical systems. The morphology of those patterns is due to the path difference; therefore, they are directly related to the Bertin surfaces.
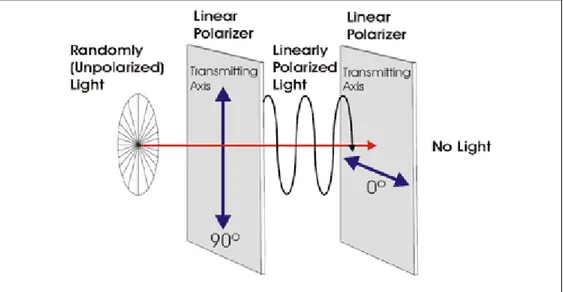
Polarizers are optical accessories which have the capability to absorb linear polarized light which has an angle with respect to polarizer transmission axis [12] (Fig. 2.12). They are at the bases of numbers of optical systems like polarized microscopes [13] and polariscopes [28] used, classically, for photoelastic observation.
Fig. 2. 12 a schema of the behavior of the polarizer. In typical optical devices like polariscopes or polarized microsopes, the second polarizer (0°) is called analyzer.
A simple and helpful method using vectors is presented (see for details [13]), to evaluate the light transmitted by the analyzer when it is crossed by π/2 with respect to the polarizer (Fig. 2.13).
33
a b
c d
Fig. 2. 13-a scheme to evaluate the light, emerging from the crystal outlet surface, transmited by the analyzer. XX’ and YY’ are the direction of the plane of vibration of the light waves. PP and AA are polarizer and the analyzer. The polarized electric field is represented by Ep; Ex and Ey are its component along the vibration planes. In (a) and (b) the wave components (in black) have a Nλ path difference, therefore they are in the same positive quadrant X-Y. The resulting vectors on the analyzer are equal and in opposition, no light is transmitted. In (c) and (d), the path difference of the components is (N/2)λ with N odd number. Ey is, in this case, in the negative part of YY’. The resulting vectors on the analyzer are in the same direction. Intensity is transmitted due to the constructive interference.
In the Fig. 2.13, polarizer and analyzer are named as PP and AA while the traces of the vibration planes of the light emerging from the crystal are XX’ and YY’ (the axis of the relative ellipseobtained as a section of the optical indicatrix normal to the light ray).
34
The amplitude of the electric field emerging from the polarizer (P) is represented by E. Crossing the crystal, the light is composed by two rays vibrating along XX’ and YY’ (Ex and Ey). The amplitude of the electric field transmitted by the analyzer is named as Ea. In the case a and b of the Fig.2.13, since the delay is Nλ with N a whole pair number, the vectors of the electric fields parallel to the analyzer are equal and opposite. A destructive interference is obtained.
In (c) and (d), since the path difference is (N/2)λ (N an odd number), the component on YY’ is opposite to the one in (a) and (b) (this is in accord with the eq. 2.20). Therefore, the electric fields vectors on the analyzer are equal and in the same direction. A constructive interference is carried out. In the case (d) the transmitted intensity is lower.
Illuminating a crystal with convergent polarized light, like in the scheme of Fig. 2.9a and 2.9b, the plane of vibration of the emerging ray in Fig. 2.14 are obtained.
Fig. 2. 14 the lines represent the trace of the vibration planes for each direction angle of diverging light inside the crystal. Left, uniaxial crystal observed along its optic axis; right, biaxial observed along its acute bisector.
By the system in Fig. 2.15, each couple of parallel rays vibrating on orthogonal plane, are recombined on the focal plane. Their optical path difference (or phase delay), described by the Bertin surface, determine destructive or constructive interference.
35
Fig. 2. 15 typical observation scheme with the sample between two crossed polarizers. The lens makes the parallel rays, emerging from the sample, converge on the focal plane. A bijective correspondence between point to angle is achieved and an interference is carried out on the focal plane.
The typical fringe patterns carried out are shown in Fig. 2.16 which can be though and expressed as the intersection of the Bertin surfaces with planes (the edge surfaces of the crystal).
a b c
Fig. 2. 16- conoscopic fringe patterns, uniaxial (a), biaxial (b) and uniaxial observed along the optic axis normal. The black cross in (a) and (b) is because the planes of vibration coincide with the polarizer and analyzer axis, therefore, no light is transmitted.
36
Chapter 3
3 Birefringent crystals photoelasticity and the diffused light
polariscope
Photoelasticity is a classical measurement technique suited to observe stress in transparent isotropic materials [10]. The birefringence induced by the stress leads to an estimate of the stress condition by the appearing of fringe patterns due to the induced refractive indices difference [12].
The presented research deals with naturally birefringent media in which a fringe structure is already present even when the stress is not present [13]. Usually these patterns are symmetric.
Then, in case of stress it is observed a modification or distortion of the symmetries of the patterns due to the deformation of the stressed lattice [12].
Hereafter are outlined, briefly, the principles governing phooelasticity of natuarally birefringent materials and the piezo-optic behavior of the anisotropic transparent media as well as the diffuse light polariscope technique; its strength and its limitation will be underlined.
3.1 Crystals Photoelasticity: Piezo-Optic effect
Each transparent material is affected by a changing of its optical properties with respect to stress conditions.
In isotropic materials, the stress tensor (Lamè ellipsoid) [29] interacts with the structure modifying the spheroid indicatrix so as to became an ellipsoid (Fig. 3.1).
a
b
c
Fig. 3. 1- A graphical representation of the interaction of the isotropic optical indicatrix (a) with the stress tensor (b) named Lamè ellipsoid [29]. The spherical indicatrix (a) turns in a general ellipsoid (c).
![Fig. 2. 5-the image from [13] represents the transmission of light in an unstressed isotropic substance; the light propagation behavior is the same for each direction, the radius of the sphere is proportional to the refractive index](https://thumb-eu.123doks.com/thumbv2/123dokorg/2971848.27375/24.918.260.660.729.988/represents-transmission-unstressed-isotropic-substance-propagation-proportional-refractive.webp)
![Fig. 2. 9- construction of the Bertin surfaces [13]; (a) two-dimensional representation of the equal delay or optical path difference as function of the angle of refraction](https://thumb-eu.123doks.com/thumbv2/123dokorg/2971848.27375/29.918.147.774.101.612/construction-bertin-surfaces-dimensional-representation-difference-function-refraction.webp)
![Fig. 2. 11- three-dimensional reconstruction of the equal path difference curves in biaxial crystals, (a) by [26]](https://thumb-eu.123doks.com/thumbv2/123dokorg/2971848.27375/31.918.155.763.274.726/fig-dimensional-reconstruction-equal-difference-curves-biaxial-crystals.webp)