A.A. 2005 - 2006
Dipartimento di Fisica “E. Amaldi”
Università degli Studi Roma Tre
Dottorato in Fisica XIX ciclo
LOCALIZATION EFFECTS ON THE STRUCTURAL
PROPERTIES OF NOBLE METAL NANOPARTICLES
Tatiana Comaschi Chairperson of the Ph.D. School prof. Orlando Ragnisco
Supervisor prof. S. Mobilio
“ Le cose sono unite da legami invisibili:
non puoi cogliere un fiore senza
turbare un stella.”
Contents
Introduction v
1 The physics of metal nanoparticles 1
1.1 Nanoclusters and nanocrystals . . . 2
1.2 Interest in nanostructure and applications . . . 2
1.3 Experimental techniques of nanocluster synthesis . . . 6
1.4 Electronic properties . . . 9
1.4.1 Kubo theory . . . 10
1.4.2 The shell model . . . 14
1.5 General physical properties . . . 15
1.5.1 Metal cluster abundance spectra . . . 15
1.5.2 Photoionization and ionization potential . . . 17
1.5.3 Photoelectron spectra and electron affinities . . . 18
1.5.4 Cluster decay processes . . . 20
1.5.5 Optical properties . . . 22
1.6 Magnetic properties . . . 26
1.7 Geometry and structure . . . 30
1.7.1 XRD results . . . 32
1.7.2 EXAFS results . . . 34
2 Theory of thermal expansion and NTE 37 2.1 Theory of thermal expansion . . . 37
2.1.1 Anharmonic effects . . . 38
2.1.2 Thermal expansion of a crystal . . . 39
2.2 Negative thermal expansion (NTE) . . . 45
2.2.1 Non-vibrational effects . . . 54 2.3 Thermal behavior of interfaces and nanoparticles: the case of gold clusters 56
2.4 Other thermal properties of nanoparticles: specific heat and melting . . 59
3 Experimental techniques: EXAFS and XRD 63 3.1 XAFS: X-ray Absorption Fine Structure . . . 64
3.1.1 EXAFS: the phenomenological mechanism . . . 67
3.1.2 Multiple scattering . . . 71
3.1.3 Vibrational dynamics . . . 73
3.1.4 Cumulant expansion method . . . 79
3.1.5 EXAFS in gold nanoparticles . . . 85
3.2 XRD: X-ray Diffraction . . . 88
3.2.1 Powder diffraction . . . 89
3.2.2 Distorsion and anisotropic effects in powder diffraction . . . 90
4 Experimental methods 93 4.1 The main growth technique: SMAD (Solvated Metal Atom Dispersion) 93 4.2 Experimental measurements . . . 98
4.2.1 ESRF . . . 99
4.2.2 The GILDA beamline . . . 99
5 Data analysis and results 105 5.1 XRD measurements . . . 106
5.1.1 Raw data transformation . . . 106
5.1.2 Analysis and results . . . 107
5.2 EXAFS measurements . . . 112
5.2.1 Sample preparation . . . 112
5.2.2 Spectra collection . . . 113
5.2.3 Data analysis: the case of gold bulk and of not-coated gold nanoparticles . . . 114
5.2.4 Data analysis: the case of thiol-capped gold nanoparticles . . . . 136
5.2.5 Data analysis: the case of silver thiol-capped nanoparticles . . . 146
5.3 Discussion of results . . . 151
5.3.1 Thermal behavior of the structural parameters of nanoparticles 151 5.3.2 Calculated thermal trends . . . 154
5.3.3 On the occurrence of non-crystallographic structures in thiol-passivated gold samples . . . 158
Conclusions 161
A EXAFS 165
A.1 EXAFS: the physical process . . . 165
A.1.1 Transition probability: ’Fermi’s golden rule’ . . . 165
A.1.2 Single electron and dipole approximations . . . 166
A.2 Interpretation of the EXAFS function . . . 167
A.2.1 Approximated calculus . . . 169
A.3 Analysis of EXAFS spectra . . . 173
A.3.1 Signal extraction . . . 173
A.3.2 Determination of the structural parameters . . . 174
A.3.3 Separated analysis of phases and amplitudes . . . 178
B XRD 181 B.1 Scattering by a free electron . . . 181
B.2 Scattering by an atom . . . 183
B.3 Scattering by a single crystal . . . 184
B.3.1 Laue equations . . . 186
B.3.2 Reciprocal lattice . . . 186
C Experimental apparatus 189 C.1 Synchrotron radiation . . . 189
C.2 The GILDA beamline . . . 193
C.2.1 Monochromator . . . 193
C.2.2 Energy resolution . . . 196
Introduction
Nanoscale science and technology concern the manipulation of matter on the nanometre length scale in the range 1-100 nm. Even though they might simply be seen as a natural extension of the (sub)micron-scale physics and engineering, that, for example, has driven the microelectronics development so far, the wealth of novel physical, chemical and biological behavior that occurs at that scale makes nanoscience an exciting area of research. Instead of dealing with an ’infinitely’ extended solid or individual atoms and molecules, in nanoscience one investigates the properties of units containing a countable relatively small number of atoms. These units, like clusters of atoms, carbon nanotubes, fullerenes or biomolecules, show fascinating electronic, optical and chemical properties in virtue of their nanometre dimensions. This mainly because the coherence length of the valence and conduction electrons becomes comparable with the physical dimension of the units. By varying the size of the units and controlling their interactions, the fundamental properties of nanostructured materials may be modified and tuned.
Of particular interest are metal clusters. They exhibit a wide range of physical and chemical properties of great fundamental as well as technological interest. As a matter of fact large is their actual and potential use in different fields like catalysis and photonics.
The electronic properties of these nano-objects involve the so called ’quantum size effects’ (QSE), i.e. the quantized level structure of the conduction band, with levels grouped into electronic shells, which determine transport, optical and chemical prop-erties.
As for the structural properties of finite-size systems it’s well known the presence of lattice contractions if compared to bulk materials because of surface effects, and the occurrence of stable non-crystallographic structures (like icosahedra and decahedra) different from the crystalline atomic arrangement of the corresponding macrocrystalline counterpart.
Given the above considerations this thesis represents a study of localization effects v
on the structural properties of gold nanoparticles of different sizes: in particular we investigated the temperature dependence of the cell parameter of such systems.
Typically ’common’ materials present thermal expansion with increasing temper-ature which is described by the coefficient of linear thermal expansion, α, and is ex-plained by the Gruneisen theory of thermal expansion. There exist, however, some crystals which contract in one or even in all crystallographic directions at increas-ing T, showincreas-ing a negative thermal expansion (NTE). These phenomena can be often connected to anisotropic characteristics of the studied system.
A recent work on Au clusters of mean diameter ∼4nm evidenced the occurrence of thermal contraction of the cell parameter of such objects with increasing temperature. They show thermal expansion at low T, but a negative one at high T.
This observed crossover effect was interpreted in terms of the influence of electronic excitations on the total energy of the system. For a bulk system, indeed, the band gaps at the Fermi surface are considerably larger than the thermal energy (corresponding to a few meV). Therefore the electronic contribution to the total energy of the system results slowly variable with temperature and do not contribute in a significative way to the behavior of the cell parameter with temperature. Therefore bulk materials generally show thermal expansion, dictated only by the anharmonic contribution to the lattice potential.
On the other hand, in nanoparticles, discrete energy levels are separated by only a few meV; as a consequence electronic energy varies relevantly with T even at quite low temperatures. In such a situation the equilibrium cell parameter will be given by the balance between two energetic terms: the vibrational one, leading to thermal expansion and dominating at low T, and the electronic one, driving to NTE, which starts to overcome the first term at higher temperatures.
For approximately spherical clusters the allowed energy levels for valence electrons vary in an inverse proportional way with respect to the volume of the system, which vary with temperature because of the thermal variation of the cell parameter. As a consequence energetic separations between adjacent levels are temperature dependent too. Electronic energy will give, therefore, a different contribution to the total energy and therefore a different effect on the cell parameter at different temperatures.
The present work extend such a study to clusters of reduced size, where quantum size effects are expected to be enhanced. At such sizes, however, X-ray diffraction don’t sample lattice parameter with enough accuracy. For this reason we employed XAS (X-ray absorption spectroscopy) with particular attention to the so called EXAFS region
of the spectrum. EXAFS suits very well to our problem as it is a local structural probe, it allows to obtain information about the radial distribution of atoms around the central atom, providing bond lengths and coordination numbers. Furthermore it provides information on the distribution of the atomic positions, in particular giving the structural and thermal disorder of atomic positions.
The starting point was a detailed EXAFS study of the thermal behavior of the structural parameters of bulk foil from which we optimized the analysis method before applying it to the case of finite-size systems.
Temperature-dependent experiments (in the interval 20-300K) were performed on five different samples of Au clusters of sizes in the range 2-6 nm. Two of the samples were produced by evaporation on a non-interacting substrate while the other three were prepared by means of SMAD method. A very accurate data analysis showed that the experimental trends of the near-neighbor distance (NND) with temperature are, in every case, different to various degree from bulk thermal behavior; these were also compared with theoretical trends, calculated by minimizing the total energy of the system.
Another open problem concerns the structural modifications occurring in very small nanoparticles because of their reduced size. The question is the sometimes foreseen ap-pearance of non-crystallographic structures in noble metal particles, such as decahedra and icosahedra, which do not exist in the bulk phase. For example, unsupported silver particles smaller than about 5 nm show the presence of icosahedral structures, whereas clusters larger than 9 nm are fcc structured like the bulk metal. Total absence of fcc particles was found for colloidal thiol-capped gold nanoparticles of mean size of ∼2 nm, with decahedral and icosahedral structures present in equal proportion. However results and conclusions in literature are strongly contradictory. We investigated also this aspect of the physics of nanocluster by XAS and XRD.
Finally recent experimental results show that Au and Ag clusters have magnetic properties. Ferromagnetic hysteresis at room temperature was measured in 1.7 nm gold nanoparticles surrounded by thiols. Highly anisotropic giant moments were also observed for self-organized organic molecules linked by thiol bonds to gold films. Such behaviors were ascribed to size effects and to the charge transfer that takes place by thiol bonding to nanoparticle’s surface. In the course of this thesis we also started to investigate such magnetic aspects on two samples of thiol-capped Ag nanoparticles, by studying both the Ag and S K-edge. XAS experiments allowed to derive some preliminary and qualitative conclusions about that.
The thesis is organized as follows: the first chapter is dedicated to the description of the main aspects of interest of the nanocluster physics, the second one deals with the theory of thermal expansion and NTE describing also the origin of the modifications of some thermal properties in finite size systems. The third and fourth chapters briefly describe the two used experimental techniques, XAS and XRD, and the experimental apparata used for the experiments respectively. Lastly the final chapter reports data analysis, experimental results and their interpretation.
Chapter 1
The physics of metal nanoparticles
Nanoscale science concerns with materials of nanometer length scale, typically in the 1-100 nm range. The growing interest towards this field over the past decades arises from the fact that one deals with a countable number of atoms instead of an ’infinitely’ ex-tended solid or of single atoms or individual molecules: examples are carbon nanotubes, biomolecules, fullerenes, clusters of atoms (quantum dots). Because of their reduced size these systems show a variety of fascinating chemical and physical characteristics. These properties are strongly size-dependent so it becomes possible to tune the main properties of materials based on these building blocks (nanostructured materials).
In 1959 Feynman [1] underlined the need of development of suitable instrumentation acting as true ”eyes” and ”fingers” in the nanoworld to achieve atomic manipulation. The first practical step towards the realization of this idea was the development of the scanning tunnelling microscope (STM) in the early 1980 [2, 3]; this instrument pro-vides atomically resolved image of a surface by the measure of the tunnelling current between a metal tip and a conducting substrate. Today other scanning probe instru-ments, such as the atomic force microscope (AFM), magnetic force microscope (MFM) as well as the scanning near field optical microscope (SNOM) are available [4, 5] to look at the arrangement of single atoms and molecules. The development of these imaging techniques opened also atomic scale engineering through a careful control of tip-surface interaction, as shown in 1990 by Eigler and Schweizer: they were able to place individual Xe atoms on a Ni substrate to form the IBM word [6].
More recently Lee and Ho [104] used STM to construct a molecule by bringing together individual atoms or molecules. In the last few years STM-based atomic ma-nipulation was used even at room temperature instead that at cryogenic temperatures, usually used to inhibit atomic diffusion on surfaces. SPM techniques will continue to
Figure 1.1: Individual Xe atoms positioned on a Ni surface at 4K to form the IBM logo [7].
play a very important role both in nanofabrication and in the study of nanometre-scale objects even if these techniques have a drawback for what concerns the synthesis of nanostructures: they are very slow. Other deposition methods, however, overcome this problem as explained in the following.
1.1
Nanoclusters and nanocrystals
Nanoclusters (or nanocrystals) are systems formed by a limited number of atoms, between a few and a few thousands of atoms. They represent the primitive building blocks for nanostructured materials: nanoclusters, indeed, can be considered as small artificial molecules. During the last decade an enormous progress was made in the synthesis, characterization and understanding of finite-size systems. In the followings nanoparticle physics is briefly presented.
1.2
Interest in nanostructure and applications
Nanomaterials are at the leading edge of the rapidly developing field of nanotech-nology. Their unique size-dependent properties make these materials interesting and indispensable in many areas of human activity. In particular their applications in catalysis, biology and medicine as well as in the field of magnetic media are almost widespread with a great number of examples provided by the technological handling of gold nanoparticles.
Gold nanoclusters are the chief objects of investigation in this thesis and for this reason we will focus attention mainly on them in what follows giving, however, some
remarks also for other similar metallic systems.
Gold has been regarded as poorly active as a heterogeneous catalyst since it’s the least reactive metal in the bulk state, being the most stable and incorruptible sub-stance known to humankind. However at room temperatures HCOOH, H2S and thiol
compounds can adsorb on its smooth surface (the strong affinity for sulfur can be used for gas sensors with evaporated films of Au for the detection of H2S and other sulfur
substances). However when this metal is deposited on selected metal oxides as fine-particles with diameters smaller than 5 nm its chemistry dramatically changes. As early as 1906, W.A. Bone and R.V. Wheeler of the University of Manchester demon-strated that gold gauze is a catalyst for the reaction between hydrogen and oxygen at 523-673K. It was only in 1980 that the work in two different laboratories demonstrated more spectacular examples of the chemical reactivity of gold.
G. Hutchings used gold an a carbon catalyst to convert ethyne into vinyl-chloride by adding hydrogen chloride. Subsequent research resulted in the statement of gold catalysts to be about three times more active than the commercial mercuric chloride catalysts in vinyl chloride manufacture. Other demonstrations of the interesting gold activity was later provided by M. Haruta [9]: he found that gold clusters could be effec-tive at room temperature with H2, CH4 and O2 and show a dependence of reactivity
on the electrical charge and on the atomic number of the particle, being observed an enhanced activity at specific magic numbers. He found that gold coprecipitated with certain metal oxide supports exhibit unique catalytic performances different from unsupported gold and result often more reactive than Pd and Pt catalysts at low tem-peratures. For example, in the oxidation of CO and H2, gold supported on metal
oxides other than SiO2 and Al2O3 is much more active for CO oxidation with the
ex-cellent catalytic performance tuned by the proper selection of support materials. Gold deposited on Co3O4 exhibits the highest catalytic activity among supported gold
cata-lysts for the complete oxidation (combustion) of hydrocarbon fuels. The advantageous features of the supported Au catalysts over supported Pt ones are higher catalytic ac-tivity at low temperatures and much higher selecac-tivity to N2against N2O. Furthermore
nanocrystalline gold catalysts can provide tunable active catalysts for the oxidation of alkenes using air, with exceptionally high selectivity to partial oxidation products and significant conversion [10].
Given all these examples the catalytic nature of gold has been found to be tunable for several reactions through the control of its particle size, the architecture of the metal-support interaction as well as the appropriate selection of the support material
together with the preparation method and oxidation state. However the attainment of the best performing gold catalyst is still a challenge given the multiplicity of factors influencing catalytic activity, first of all the quantum size effects indicated as the main requisite for the high catalytic activity in the low temperature oxidation of CO. Further investigations [11] revealed a worse catalytic performance for gold nanosized particles in a pure metallic state (both on a ’reducible’ and ’inert’ support) with the highest
CO conversion rates at the lowest temperatures in the case of non-metallic Au species.
The structure of the active site of oxide-supported gold nanoparticles still remains an elusive problem with several hypothesis advanced ranging from the presence of defects on the oxide surface modified by the presence of nearby gold to neutral gold atoms on the nanoparticle itself.
Living organisms are made up of cells tipically 10µm across. However cellular con-stituents are even smaller (in the sub-micron size domain) and even smaller are the proteins with typical sizes of just 5nm, just comparable with the dimensions of man-made nanoparticles. This fact gives an idea of the potential applications of nanopar-ticles as very small probes in the biological field enabling to understand biological processes at the nanoscale level. Among several possible applications there are their use as fluorescent biological labels with recent examples including the observation of diffusion of individual glycine receptors in living neurons thanks to the use of fluores-cent semiconductor nanocrystals (also known as quantum dots) then followed by the possibility to identify lymph nodes in live animals by near-infrared emission during surgery [12]. They will not certainly replace the well-established fluorophores or fluo-rescent protein-fusion technologies but will complement them for applications needing better photostability or single-molecule sensitivity for long time scales. The use of gold nanoparticle-oligonucleotide complexes as intracellular gene regulation agents for the control of protein expression in cells is also well known [13]. This modified complexes have higher affinity constants for complementary nucleic acids than their unmodified counterparts so allowing consequent intracellular gene regulation. Remote electronic control over the hybridization behavior of DNA molecules was demonstrated through the inductive coupling of a radio-frequency magnetic field to a metal nanocrystal cova-lently linked to DNA [14]. This coupling increases the local temperature of the bounded DNA so inducing its denaturation: this kind of approach should allow extension of this concept to the control of hybridization and so of a large range of biological functions at the molecular scale.
ad-vanced 20 years ago by Matsudaira [15] who observed a radioenhancing effect of iodine on cultured cells. Direct tumor injection of iodine contrast medium followed by 100kVp x-rays completely suppressed the growth of 80% of tumours in mice [16]. An exten-sion of these concepts concerned the use of gold nanoparticles to deliver a very large quantity of gold to tumors via intravenous injection without apparent toxicity, com-bining this with x-rays, resulted in eradication of most tumors [17]. Other examples of biomedical applications of nanoparticles (specifically of magnetic nanoparticles) con-cern therapeutic drug, gene and radionuclide delivery (the use of magnetic carriers to target specific sites within the body has the first objective to reduce the amount of systemic distribution of cytotoxic drug, so reducing the associated side-effects, and as a second one to reduce the dosage required by a more efficient and localized targeting of the drug itself or increasing the efficiency of gene transfection and expression for gene delivery), contrast enhancement agents for magnetic resonance imaging applica-tions or even magnetic separation labelled cells and other biological entities. Magnetic clusters have also been tested for tissue engineering applications, for example, in the mechanical conditioning of cells growing in culture.
Nanosized particles holding permanent magnetic moments play a key role for the basic understanding of magnetism and also for miniaturized data-storage technology. The early type of recording media were composed of γ − F e2O3 particles then followed
by the appearance of thin film media in which the material used was Co-based alloy film. In this sense magnetic nanoparticles have significant potential for increasing magnetic storage capabilities: cobalt and Pt/Co bimetallic nanoparticles are being investigated as magnetic storage devices. Further investigations concern core-shell cobalt clusters embedded in an anti-ferromagnetic matrix. Cobalt nanoparticles have also been found to self-assemble into ’nanorings’ that can store magnetic information at room temperature. This kind of magnetic rings are being considered as memory elements in devices for long-term data storage and magnetic random-access memory (MRAM). Another example is provided by the use of polystyrene film containing gold nanoparticles to store a charge and act as organic memory devices.
Given all these facts there’s a continuous evolution of research into this field being the development of new materials and their understanding on smaller and smaller length scale at the root of progress in many scientific areas.
1.3
Experimental techniques of nanocluster
synthe-sis
There is no universal method of nanoparticle production suitable to every element; in addition often the preparation method must be chosen according to the constraints imposed by the physical properties one is interested in. Optical absorption measure-ments, for instance, are easily interpreted only if clusters are dispersed in a matrix while another example is given by the experiment of Ladas et al [18] regarding the susceptibility measurements of palladium particles that was based on the changes of the electronic structure as a consequence of hydrogen absorption on the sample.
The most common techniques of synthesis are now briefly summarized in what follows.
i) Gas-phase cluster synthesis
In ’gas-phase synthesis’ clusters are formed in the gas phase (also known as ’pre-formed’ clusters) before their deposition on a solid substrate. These methods include:
• gas aggregation: the metal is vaporized and introduced in a flow of cold inert
gas becoming supersaturated and cluster production proceeds also thanks to the low temperature of the inert gas; this method results particularly efficient for the synthesis of large clusters, N<10000
• laser vaporization: the metal vapor is produced by the pulsed-laser ablation of
a rod of the chosen material, is cooled in a pulse of cold helium gas forming clusters; this method produces tipically clusters in the size range from a few to several hundreds of atoms
• ion sputtering: bombarding a metal surface with high-energy inert-gas ions gives
intense continuous beams of small singly ionized clusters of many metals.
The cluster size distribution is determined by different parameters such as specific characteristics of the source, dimensions of the various experimental components, gas flow rate etc... Mass selection can be achieved by different methods like quadrupole mass filtration, time-of-flight mass spectromery, ion cyclotron resonance mass spec-tromery or molecular-beam ”cromatography”.
For the deposition of pre-formed clusters graphite and silica are popular choices as substrates. This is an important step because the morfology as well as the functionality
of simple clusters or of assembled thin films are greatly influenced by cluster-surface interaction. In particular cluster dynamics (diffusion and coalescence) proved to be a quite complex problem. Sb clusters made up of 2300 atoms are mobile on graphite and form ramified islands [19]; a similar behavior was found in the deposition of Ag small clusters (containing from 50 to 250 atoms) always on graphite [20].
ii) Self-assembled clusters on surfaces
During the 1970s and 1980s techniques for producing microelectronic circuity by electron and photolitographic methods were developed, like beam molecular epitaxy, electron beam lithograpy and etching. These techniques are able to confine electrons to one or, ultimately, zero dimensions with the consequent formation respectively of a quantum wire or a quantum dot. Combining lattice-mismatched materials allows to produce nanometer-scale islands (nanoclusters or quantum dots) with a narrow size distribution.
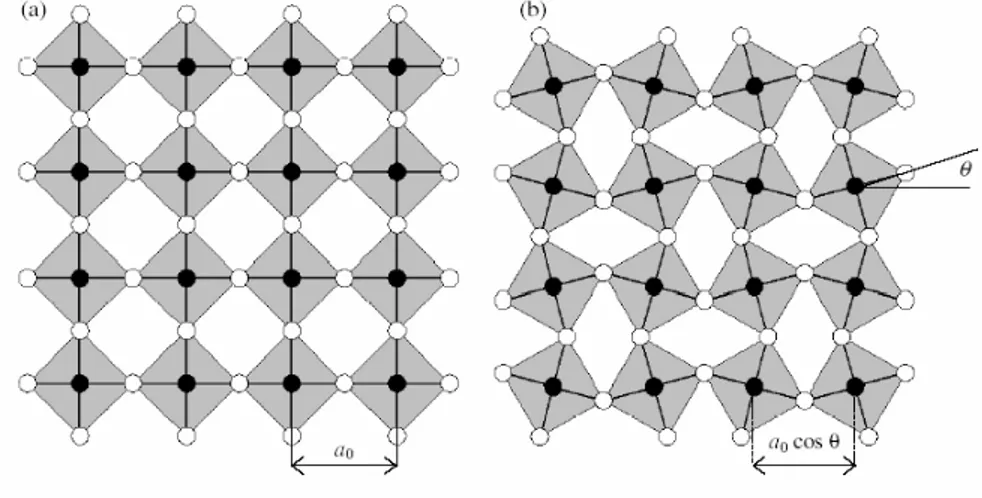
Figure 1.2: Schematic illustration of various thin-film growth modes (θ represents the total adsorbate coverage)
In fact in eterohepitaxial growth, when the lattice mismatch between the two ma-terials is less than about 1% a film of the first material will normally grow layer by layer on a substrate of the second one (Frank-van der Merwe (FM) growth). When the mismatch between the substrate and the film lattices is higher (as, for example, in Si/Ge systems where it’s about 4% or in InAs/GaAs in which it’s ∼ 7%), initially a single monolayer of atoms on the substrate is formed with an in-plane lattice parameter equal to that of the substrate; then the growth continues in 2D form (layer-by-layer) with an out of plane parameter that is expanded (or contracted) with respect to the
parent material to preserve the unit cell. However at a critical overlayer thickness, the accumulated elastic strain energy forces a transition towards a 3D growth with the formation of islands (Stranski-Krastanov (SK) growth). When the values of the free energies of the substrate and of the adsorbate layer are very different, the adsorbate prefers forming 3D islands instead of wetting the substrate even in the initial phase of the growth (Vollmer-Weber (VW) growth). This VW mode can be successfully exploited in the fabrication of nanoscale clusters; common substrates like graphite, amorphous carbon or metal oxides are widely used because of their low free energy and of their chemical inertness.
iii) Colloidal synthesis
The colloidal fabrication of nanoparticles involves the controlled nucleation and growth of clusters in a precursor solution. Since nineteenth century with Faraday’s studies [21] Au colloids have been the focus of the majority of research on colloid-based synthesis of nanostructured materials. Among these methods we quote the preparation of hydrosols that involves the mixture of an acidic solution of the appropriate metallic element with a reducing agent (a typical combination of reagents is hydrogen tetra-chloroaurate and sodium citrate [22, 23, 24]) to produce a suspension of particles. The sample is then dehydrated leaving the clusters embedded in a gelatine matrix intro-duced to avoid coalescence between single units. The stoichiometric ratio of the metal salt and of the reagent is the key to control the size of the nanoparticles. One ad-vantage of this approach is the chemical purity of the sample against the introduction of magnetic impurities. Another powerful chemical method makes use of a support matrix with very high surface area and with the presence of an high number of pores; in these pores impregnation of an aqueous solution of the metallic element (a metal-lic salt) takes place. Once impregnated the support is dried and then heated in air (calcination process). The final step is in the chemical reduction to the metallic state in the presence of hydrogen gas. This technique gives small, quite spherical particles whose size is normally lower than the diameter of the pore on the substrate. For ex-ample Pt particles can be formed from a H2P tCl6 solution, using SiO2 or Al2O3 as
a substrate [25]. Another possible method is the ion exchange/chemical reduction, a method based on the exposure of the substrate to an appropriate metallic salt where the metal is in the form of a cation (as for example P t(NH3)2+4 in the presence of OH−
coming from NH4OH). The cation remain anchored elettrostatically to the support
In all these cases an interaction between the nanocluster and the substrate can be present, which realistically modifies the electronic properties of the supported particles with respect to unsupported ones; because of this a chemically inert support should be used (rare-gas cryogenic matrices are a good approximation to the ideal case).
1.4
Electronic properties
In a crystalline solid, the continuous energy bands structure determine the main optical, electrical as well as magnetic properties of the solid. On the other hand atoms and molecules have discrete density of states, and as a consequence they show intrinsically sharp spectral line-widths. From the electronic point of view a nanoparticle is in an intermediate position between the two above extreme cases.
The electronic structure of a metal particle critically depends on its size. For small particles, the electronic states are not continuous but discrete, due to the confinement of the electron wave function.
The first modification of the band structure of finite-size systems is represented by the very small capacitance of these isolated objects, which results in a strong influence on its electronic properties and so gives rise to single-electron charging effects, the best known of which is the Coulomb blockade phenomenon [26]. This effect can be observed in a nanocluster coupled to source and drain electrodes (corresponding typically to a STM tip and the support). The energy needed to add an electron to the cluster is so given by:
Eadd = e
2
C + ∆E (1.1)
with C capacitance of the system and ∆E energy difference between the single elec-tronic levels. The necessary condition in order to add or remove an electron from a nanoparticle is that the Fermi level of the source to be raised above the electrochemical potential corresponding to the cluster with N+1 electrons (µN + 1) or lowered below
the electrochemical potential of the N-electron particle (µN) respectively.
Consequently there will be a region of zero conductance as a consequence of a range of bias voltage for which the source Fermi energy satisfies neither of the above criteria. Because of the discrete character of the allowed energy states, thermodynamic prop-erties of nanoclusters such as the magnetic susceptibility and the heat capacity are sensibly different from the corresponding bulk quantities [28]. Kubo [29] was the first to develop a theory on the electronic properties of nanoclusters; his approach was then
Figure 1.3: (a) Equivalent circuit for a double-tunnel-barrier junction formed between an STM tip, a nanocrystal and a substrate. (b) Schematic energy level diagrams illustrating the origin of Coulomb blockade in nanocrystal systems. (c) STM I(V) data for a passivated 1.8 nm Au cluster. The presence of a Coulomb gap around 0V is evident.
implemented by the shell model as described in the following two subsections.
1.4.1
Kubo theory
Kubo theory is based on the idea that the energy levels of a finite-size particle are quantized and discrete. The details of the energy level spectrum of an individual cluster are determined by its own size and geometry; particles of comparable size but with different shapes or with different surface conditions have different spectra even though they share the same average level spacing. Let’s consider a set of metallic clusters. The electronic level scheme for each particle can be described as in the following:
εl = −ε 0 l < 0 (l < 0) ε0 = 0 εi > 0 (i > 0)
where l and i are characteristic indexes of the energy levels. The Fermi level is taken at the zero of the energy at 0K so that ε0 is occupied by two electrons with opposite
spins or by a single electron with spin up or down.
The specific values of the energy levels change from cluster to cluster because of the inhomogeneity in size and shape of the particles; these values can therefore assumed to be statistical distributed with a well-defined probability law associated with the distribution in size and geometry. In an ensemble of particles (each one made up of N atoms) the difference between two successive electronic levels, ∆, is:
∆i = εi− εi−1 or ∆l = εl−1− εl ≡ ε 0 l− ε 0 l−1
and it is assumed to follow the probability distribution:
Pr(∆, d∆) = exp(−∆/δ)d∆/δ (1.2)
where δ is the average level-spacing. Indeed, under the hypothesis that the levels are randomly distributed with DN(ε0)dε (DN(ε0) is the density of states at the Fermi level)
states in the interval dε around the Fermi level, one can express the average energy spacing as: δ = 1/DN(ε0). In the free electron model with one valence electron per
atom the density of states is given by:
DN(ε) = 3
4Nε
1/2/ε3/2
0 (1.3)
thus one obtains:
δ = 4ε0
3N =
2mev2F
3n(π/6)d3 (1.4)
where me is the electron mass, n the number of atoms per unit volume, vF the Fermi
velocity and d the macroscopic diameter of the particle.
Because of this, for a metallic cluster, a transition towards a ”non-metallic” state occurs when kBT is less than δ because the Fermi energy falls in a gap between adjacent
sharp energy levels.
As already said thermodynamic properties, like specific heat and magnetic suscep-tibility, are significantly altered from the corresponding bulk values due to the discrete
Figure 1.4: Average electron-level spacing as a function of particle diameter for a selection of the metallic elements. For a number of elements only one size is shown by vertical marks with the other level spacings that can be easily inferred from this using the indicated slope [92].
character of the allowed energy states; this is the most interesting aspect of quantum size effects which become particularly evident in the low temperature regime (kBT < δ).
In principle given a spectrum of energies (Ei) one can calculate the specific heat C
and the magnetic susceptibility χ starting from the partition functions Z:
Z = 1 +X i6=0 e−βEj C = kBβ2 ∂ 2 ∂β2 ln Z χ = β−1 ∂ 2 ∂H2 ln Z (1.5)
where β = (kBT )−1. Averaging these quantities over the appropriate statistical
dis-tribution and finally over the experimentally determined size disdis-tribution one can find the realistic trend of hCi and of hχi respectively. As discussed in [29, 30] there are substantial differences between the partition functions for clusters with an even or an odd number of electrons per particle, as a direct consequence there may be a different behavior of C and χ according to the parity of the electron number.
The electronic specific heat can be expressed as:
C ≈ kB Ã kBT δ !n+1 (1.6) where n can assume the values 1,4,0 or 2. So the electronic contribution to the spe-cific heat for small particles is reduced of a factor (kBT /δ)n with respect to the bulk
smeared out and this thermodynamic quantity recovers the bulk trend. Experimentally a decrease of the electronic specific heat at low T was found, for example, in platinum clusters, [31].
Figure 1.5: The small-particle elec-tronic heat capacity as a function of temperature for different statistical dis-tribution of levels, all deviate from the linear heat capacity for the continuum case (dashed-dotted line) [92].
Figure 1.6: The spin magnetic sus-ceptibility, including the effect of spin-orbit interaction, is shown as a function of temperature in an equal-level spacing approximation [92].
As for the magnetic susceptibility, in the case of weak spin-orbit coupling, a parti-cle containing an odd number of electrons behaves differently from one with an even number of electrons. This is in fact what happens: if Ne is odd the electron in the
highest occupied levels is like a free spin and therefore obeys Curie’s law:
χodd =
µ2
B kBT
. (1.7)
When Ne is even, instead, the spins are quenched in the ground state and are able
to form a triplet state in the excited condition. So the magnetic susceptibility is zero at 0K and then increases according to the relation:
χeven =
µ2
BkBT
δ2 . (1.8)
Also in this case there’s a reduction of χ by the factor kBT
δ as compared to the bulk
susceptibility:
χP auli =
2µ2
B
This value is approached at high temperatures by both χeven and χodd. When
spin-orbit coupling is strong, magnetic susceptibility do not depend on the number of electrons and is given by the Pauli relation (eq.(1.9)).
1.4.2
The shell model
The statistical description given by Kubo [29] was later updated by Keith Clemenger, Walt de Heer and Winston Sauders [32] to explain the striking order observed in the cluster abundance spectra of alkali metals.
The idea was to calculate the electronic structure of the valence electrons treating the ionic cores as secondary units; these valence electrons are in a delocalized state and therefore exhibit a shell structure closely similar to that of the nuclei. After the discovery of electronic shell structures also in the case of many simple and noble-metal particles, the jellium approach (in which the system is considered as an uniformly positively charged sphere filled with electrons) developed to a quite high degree of sophistication in order to explain this type of structure. Assuming a spherical symmetry the valence electrons fill energy levels which are grouped in a shell of high degeneracy; each shell is characterized by a radial quantum number n and the angular momentum
l, following the nuclear convention. When the number of valence electrons is enough
to complete a shell the corresponding clusters will show higher stabilities. Indeed when one atom is added to the system its valence electrons will occupy an higher level; this reduces the stability of the cluster as observed in a reduced abundance in the mass spectrum. A spherically symmetric potential can be adopted only for closed-shell particles; for open-shell clusters a distortion appears because of the Jahn-Teller theorem [33]. To account for this effect a deformable potential well was adopted (Clemenger-Nilsson model) [34, 35]. This model takes as an effective single-particle potential that of a three-dimensional harmonic oscillator with the inclusion of a small anharmonic distortion term. So the spheroidal or ellipsoidal distortions introduced in this way cause the presence of sub-shell closings, which constitute the main features of the fine structure of abundance spectra (therefore determined to lowest order by the geometric shape instead by the specific arrangements of the ionic cores). The shape, in fact, adjusts to the electronic structure starting from the spherical dimer (only s states are occupied) going through the prolate shape of the tetramer (the px level is doubly
occupied with a reduction of the energy through an elongation of the particles along the x direction) continuing with the 5 and 6-mer, disk shaped since both px and py
are now occupied, till arriving at the first spherical 8-mer with the 1p shell completely filled and so on.
Figure 1.7: Single-particle levels of sodium clusters as calculated according to the ellipsoidal shell (Clemenger-Nilsson) model.
There are strong similarities in the overall structure between the single-particle levels predicted from the Clemenger-Nilsson model (Fig.(1.7)) and those calculated through molecular-dynamics or with the jellium approach. As we are going to see in the following the shell model represents a starting point for the comprehension of several properties of simple metal clusters.
1.5
General physical properties
Physical properties of metal nanoparticles are strongly different from those of the cor-responding macrocrystalline counterparts because of their large surface-to-volume ratio and because of quantum size effects, due to the confinement of the electrons when their wavelength at the Fermi energy becomes comparable to the size of the particle. An example is represented by the modification of the mechanical properties of nanometer-size supported gold clusters which show an elastic modulus approximately 1/6 that of bulk Au because of surface tension effects [36].
We now briefly report some of the peculiar properties of metal nanoparticles.
1.5.1
Metal cluster abundance spectra
The production and detection of alkali metal clusters up to about 1000 atoms [32] show an abundance spectra reflecting the order of a spheroidal symmetry: clusters whose number of electrons matched the spherical shell closing numbers are produced more abundantly (Fig.(1.8)).
Figure 1.8: Experimental sodium cluster abundance spectrum
Figure 1.9: Logarithmic abundance spectrum of silver cluster ions produced in a sputtering source. Numbers corre-spond to spherical shell closings.
This characteristic persists up to very large sizes, i.e. for particles with several thousands of atoms.
Comparing the abundance spectra of clusters corresponding to the same group of the chemical table one finds strong similarities with the reproduction of ellipsoidal shell closing steps in the fine structure of the spectra. Pronounced shell structures are also present in the cluster-ion abundance spectrum as shown in Fig.(1.9) for silver: the clusters are produced as singly ionized objects and therefore the shell steps occur for number of atoms equal to 9,21,35... instead of 8,20,34... as normally expected. Increasing the particle size, the sharp peaks in the spectra are smeared out.
Indeed at a certain finite size a transition from an electronic structure dominated by shell effects to one dominated by crystal-field effects is expected with the shell steps diminishing for larger clusters. For example the sodium mass spectrum up to N=25000 [37, 38] shows a series of peaks at the shell closing numbers and above ∼ 2000 a second series closely obeying the algorithm:
N = 1
3(10K3− 15K2+ 11K − 3)
These numbers are associated with the Mackay icosahedra, geometrically compact structures made up of K atoms. This shows that at low temperatures, for sodium, for sizes around N=2000 the electronic shell structure becomes of less importance than the geometrical one. As a matter of fact the theoretical prediction from Clemenger model gives N=1640 as the transition number from an electron driven structure to a crystalline structure. The Mackay structure doesn’t foresee the bcc arrangement of atoms of the bulk structure of Na so that a second transition is expected.
1.5.2
Photoionization and ionization potential
The ionization potential for a cluster is defined as the energy difference of the neutral and the ionized clusters in their ground states (more precisely this is the adiabatic ionization potential, AIP).
Photoionization involves the removal of an electron by a photon. This is a direct electronic process that does not change the position of the ionic cores; rather, the electronic system as a whole adjusts in the process of removing the electron. Assuming that a cluster is initially in the ground state, then the lowest-energy photon that can ionize the cluster corresponds to the vertical ionization potential (VIP). The ground-state geometry of the neutral cluster and of the ion are usually different, so that the photoionized cluster is vibrationally excited immediately after ionization. Hence a photoionization measurement yields the vertical ionization potential and not the adiabatic ionization potential.
There is a substantial difference between VIP and AIP only when dealing with small clusters, for larger ones it is not so because shape differences between the ionized and the neutral states are irrelevant and the two quantities are identical. The energy difference between them, indeed, decreases with increasing particle size Fig.(1.10).
Extraction of ionization potentials from the photoionization efficiency spectra can be quite complicated especially in the case of hot clusters, for the dramatic effects of temperature on the efficiency curves. To this aim several general methods exist. Fig.(1.11) represents ionization potential of sodium and potassium small particles; steps are present for 8, 18, 20, 40, 58 and 92; the several minor observed features are well explained in terms of the electronic ellipsoidal shell and sub-shell closings and of spin- and crystal-field effects. All these structures are superimposed over a decreas-ing behavior commonly present in all simple metal cluster systems. This last aspect is justified modelling the particle as a classical conducting sphere. The photoionization energy then is made up of two main contributions: one is the work function (the binding energy of the electron in the metal) and the other comes from the electrostatic energy of a small charged system in a ionized state. Within this model the photoionization potential (IP) as well as the electron affinity (EA) are given by:
IP = W F + αe2
R
EA = W F −βe
2
R (1.10)
Figure 1.10: Schematic diagram of the photoionization process of N a9.
The total energy of the cluster as de-termined in the ellipsoidal shell model for the ground state and for the ionized state is shown as a function of the long axis of the cluster. AIP and VIP are indicated.
Figure 1.11: Ionization potentials of sodium and potassium clusters.
of the sphere so that in the infinite limit IP approaches the WF. Predictions from theory by self-consistent jellium calculations correspond quite well with experimental observations.
1.5.3
Photoelectron spectra and electron affinities
In a photoionization process the final state of the emitted electron is unknown. On the other hand photoelectron spectroscopy measures the kinetic energy of the emitted electron; the difference between the electron kinetic energy and the absorbed photon energy is the energy spent in removing the electron from the nanoparticle. For an anionic cluster, it’s given by:
U = hν − " En− β e2 R # (1.11) where U is the energy of the emitted electron and En are the single-particle energies.
As a first approximation we consider the formation only of a single hole ignoring more complex excitations; in such a case the photoelectron spectra will be made up of a set
of lines associated to the discrete energy levels of the cluster. However the real corre-spondence between the density of electronic states and such lines in the photoelectron spectrum is more complicated.
Because of different processes, like the electron losing energy while leaving the particle, the photoelectron spectra result also slightly dependent on the energy of the incident photon.
Figure 1.12: Photoelectron spectra of copper anionic clusters. Dots indicate the positions of the highest occupied levels corresponding to the two bands.
Figure 1.13: Experimental electron affinities of copper and silver anionic.
The structures in photoelectron spectra of nanoparticles are essentially a fingerprint of the electronic density of states, which is further assumed to be crudely represented by the energy levels in the ellipsoidal shell model.
Photoelectron spectra as a function of cluster size allow to follow the electronic structure from the atom up to the bulk, as in the case of copper anions (Fig.(1.12)) where one can see in particular the evolution of two bands, one that grows up from the atomic 4s level and gradually transforms into the conduction band and another that
emerges from the atomic 3d states and converges towards the bulk 3d bands.
Another interesting example is given by the observation of the growing degree of hybridization between the 3s and 3p electrons with increasing size in the photoelectron spectra of aluminum clusters. In the isolated atom, indeed, the energy separation between 3s and 3p levels is 3.6 eV while in the bulk the corresponding bands are hybridized to give the conduction band: the photoelectron spectra of the first present two well separated peaks while that of the bulk is nearly featureless. The intermediate systems show a rapid evolution from one behavior to the other with the two structures merging to form a single structure.
The electronic affinities (Fig.(1.13)) clearly show the predicted shell structure with the values at 7, 19, 39 greater than the others, as predicted from the shell model.
A difficulty of this type of probe can come in the UV range where a relevant contribution from the substrate material to the valence-band spectra can be present and this prevents access to the details of the electronic structure of the cluster itself.
1.5.4
Cluster decay processes
A lot of experimental information can be obtained observing the dissociation of a cluster which follows its excitation by an external probe.
Dissociation can happen after the absorption of a photon or the collision with other particles. At high temperatures when the free energy is greater than that of a constituent atom, ion or larger fragment, it can also occur spontaneously. Symbolically the process is the following:
X∗
N → XM+X(N −M ). (1.12)
where X∗
N is an excited state of the cluster XN while XM and X(N −M ) are the two
produced fragments. Fragmentation products are usually vibrationally and/or elec-tronically excited, therefore fragmentation (or evaporation) chains can occur. Multiply charged clusters can also decay through fission into charged fragments,; for a doubly ionized particle:
(X++
N )∗ → XM+ + XN −M+ (1.13)
In investigating dissociation processes the physical parameters which one is inter-ested in are the branching ratios of the different decay channels, their thresholds as well as their decay time constants.
Several experimental evidences suggest that similar processes are involved both in photodissociation and in collision-induced dissociation. The reason is that the
exci-tation mechanism heats the cluster and consequently dissociation occurs as a second step decoupled from excitation. In a simplified model (RRK theory, [42]) treating the decay as a statistical process one can relate the dissociation rate to the thermal energy and the dissociation energy of the cluster. Given ν, the vibrational frequency, and
s = 3N − 6, the number of vibrational degrees of freedom, one obtains: k(E0) = ν ·E 0− ED E0 ¸s−1 (1.14) for the dissociation rate, with E0 and ED the thermal and dissociation energy of the
particle, respectively.
Multiply charged clusters have a certain tendency to disintegrate into two large frag-ments because of Coulomb repulsion. The disintegration of neutral particles instead usually occurs through evaporation of atoms and dimers. As for normal dissociation, fission may be induced by photoabsorption, by collisions with specific atoms or may start spontaneously in the case in which the system is hot enough. Also in this case important information can be derived from the measure of the process rates and of the branching ratios. For example multiply charged sodium clusters Naz+N show, for each charge state z, a well defined critical size Nc above and below which the nanoparticle
prefers to decay in a different way (fission or evaporation). Na2+
27, the smallest
posi-tively identified double charged sodium cluster, goes through fission to Na+
13+ Na+14
or evaporate giving Na+
26+ Na with comparable probabilities indicating that for this
size the fission barrier equals the dissociation energy for evaporation of one atom. Another interesting example is provided by the analysis of daughter clusters pro-duced from the dissociation of parents in the range Au2+9 to Au2+18. There is, in fact, a strong odd-even alternation in the fissionability of the nanoparticles with the prob-ability of fission relative to evaporation for even clusters being larger than that of the neighboring odd systems. Furthermore as the parent size decreases the probability of fission respect to evaporation increases strongly.
To describe fission processes it is often used the liquid-drop model which is comple-mentary to the shell model. This theory considers the cluster as a uniformly charged liquid drop, whose shape is determined by a competition between surface tension, which induces a spherical shape, and electrostatic energy, that instead should lead to elongated shapes. Analyzing the total energy as a function of the shape one finds that spontaneous fission occurs if the value Z2/N exceeds a critical value given by the
relation: (Z 2 N )c= 10 4π 3 r3 sσ e2 (1.15)
where σ is the surface tension and e the electronic charge. For doubly charged Au clusters the calculated critical size is N=5, a value in reasonable agreement with the smallest cluster experimentally observed (N=9). A remark to be made to this treatment is that shell structure effects are not taken into account even if the fission process is a complex process involving details of the geometrical as well as of the electronic structure.
1.5.5
Optical properties
Metals have unique optical properties compared to other materials mainly due to the conduction electrons: an example is their characteristically high reflectivity; most met-als are silvery in color, but copper appears reddish and gold yellow. All these properties are modified by the reduced size of metal clusters. When the diameter of the particle is lower than the light wavelength, free clusters generally appear black, although when they are isolated in a matrix, like glass, they can have rich colors.
The optical response of clusters directly reflects their electronic structure, which is strongly dependent on the particle’ shape and size. In analogy with atoms, one may expect that the optical features are associated with transitions between the single particle energy levels. On the contrary it turns out, that the absorption spectra are dominated by a resonance associated to the collective oscillation of the conduction electrons and that single particle excitations can be observed only as fine structures. Only for dimers and trimers of alkali metals there’s only a small evidence of this behavior, mainly because of the too small number of electrons present, that makes such a collective mode hardly possible. This is however balanced by the possibility to finely resolve single-particle excitations contrary to larger particles.
The theory proposed by Mie gives a reasonably clear description of most of the optical properties of metal clusters; this theory gives the response properties of spher-ical or ellipsoidal particles as a function of the ratio between the wavelength of light and the particle diameter. A small particle has a well defined surface plasmon mode which, for noble metals, occurs in the near UV/visible region. This feature makes such systems very interesting objects for potential use in optical-device applications. The width of these resonances vary inversely with the particle size while their intensity is proportional to metal concentration. The surface plasmon band can be classically de-scribed in terms of the oscillation of the conduction electrons with respect to the ionic background. The key quantity in the theoretical description of this phenomenon is the
frequency-dependent dielectric function.
Consider a single, representative, spherical particle with complex dielectric con-stant:
ε = ε1 + iε2 (1.16)
embedded in a medium of dielectric constant εm.
According to Mie the total absorption coefficient K of such a system is given, by:
K = 18πf ε3/2m λ
ε2
(2εm+ ε1)2+ ε22
(1.17) where f is the volume-filling fraction of the metal and λ the photon wavelength. The plasma resonance is a consequence of the above equation: there will be a maximum of the absorption coefficient at a value of the frequency (ωR) where the condition:
[ε1+ 2εm]ω=ωR = 0 (1.18)
is fulfilled. Using, for the metal, the Drude-Sommerfeld form of the dielectric constant:
ε(ω) = ε0(ω) +
4πiσ(ω)
ω (1.19)
one can express σ(ω), the frequency-dependent conductivity of free charges of density
n, as:
σ(ω) = ne2τ /m
1 − iωτ (1.20)
τ being the Drude relaxation time. In the high-frequency limit (ωτ >> 1) one finds: ε1 = ε0 − ωp2/ω2
ε2 = ωp2/ω3τ (1.21)
with ωp bulk plasma resonance (ωp2 = 4πne2/m). The condition given by eq.(1.18)
determines the surface plasma resonance frequency (ωsp):
ωsp/ωp = (ε0+ 2εm)−1/2. (1.22)
Looking at eq.(1.17) it results that the absorption spectrum has a Lorentzian shape that around ωsp is given by:
K = 9 4 f ε3/2 m c(ε0+ 2εm)3 ω2 p/(ω2τ ) (ωsp− ω)2+ (2τ )−2 . (1.23)
The photoabsorption cross section can then be written as: σ = 4πN e 2 2mec ω2Γ (ω2− ω2 sp)2 + (ωΓ)2 (1.24) where Γ is an empirical damping factor inclusive of the lifetimes and widths of the resonance. The above equation is the Mie expression in the small sphere limit and it predicts a single strong absorption peak in correspondence of the collective dipole oscillations of the valence electrons, whose line-width is expected to be primarily de-termined by inhomogeneous effects connected with the Frank-Condon principle. In the case of non-spherical clusters, with an ellipsoidal shape, one can expect three different resonances according to the three unequal components of the polarizability along the three principle axes.
In principle eq.(1.23) doesn’t foresee any dependence of the resonance position and width on particle size, but only a volume-dependent variation of the intensity of the resonance. These aspects are in contradiction with several experimental evidences which clearly show that as the nanocluster size decreases there’s a dramatic increase in the plasmon resonance bandwidth, accompanied by a shift in the resonance position. In addition photoluminescence (PL) spectra [43] provided also strong evidences of an influence of the chemical state and structure of the nanocluster surface on the strength of the coupling between the incident radiation and the surface plasmon.
Indeed the damping of the plasma oscillation of conduction electrons is phenomeno-logically determined by the dissipative part, ε2, of the dielectric constant, which is
connected to the conductivity (eq.(1.19)). The conductivity of a small system is size-dependent if the diameter of the cluster is smaller than the mean free path. As a matter of fact it has been experimentally observed [44, 45, 46] that in the range 10˚
A-100˚A the width of the optical absorption peaks is inversely proportional to the radius
of the particle. Assuming that the electron mean free path is entirely limited by the scattering on the surface boundary of the particle the width of the surface plasmon mode will be inversely proportional to the size of the cluster:
Γ = τ−1 = vF
R (1.25)
where R indicates the radius of the system and vF the Fermi velocity. Scattering of
conduction electrons by phonons and lattice defects will also give their contributions changing the proportionality constant between Γ and R−1. This classical description
obser-vations. Resonance widths with this characteristic behavior are observed also for quite large supported noble-metal clusters [47].
A more rigorous quantum mechanical calculation by Kubo e Kawabata [48] con-firm the 1/R dependence of the plasmon bandwidth even if with a different slope. This is a consequence of the fact that for small-size particles the electronic wave func-tions are determined by boundary condifunc-tions, cannot be viewed as a superposition of Bloch waves and consequently Drude theory result quite inappropriate. They there-fore introduced a semiclassical model expressing the frequency-dependent conductivity in terms of current-current correlation functions and making use of the fluctuation-dissipation theorem. The surface plasmon lifetime results modified with respect to eq.(1.25) through a multiplicative factor of the order of unity, that changes the slope of the linear trend of Γ−1 vs R.
The main multi-peaked structures found in the measured photoabsorption cross sections of alkali clusters are quite well explained by the shell model even if a certain degree of disagreement can be found in some features of the spectra. As an example in the trend of the photoabsorption cross sections of closed-shell sodium clusters, for which the basic model predicts a single peak, there are double-peaked or more com-plex resonance structures (Fig.(1.14)). This effect is known as fragmentation of the surface plasma resonance and is ascribed to a coupling of the resonance with nearby particle-hole excitations. In the case of small particles these couplings with single-particle excitations generate a distribution of the surface-plasmon oscillator strength among several distinct excitations. The degree of fragmentation is directly correlated to the presence and correct symmetry of possible single-particle transitions to which the surface plasmon can couple. Even if only a restricted subset of the single excitations can couple to the surface plasmon, their density increases with the number of valence electrons therefore the shell model results more accurate in the case of the smallest particles than for the larger.
The optical properties of noble-metal particles are strongly influenced by interband transitions of the d electrons. Since these transitions for copper and gold occur in the visible region and for silver in the low UV, there are strong couplings with surface plasmons. This phenomenon causes even large frequency shifts of the resonance for metal particles: it is the case of the observed blueshift (Fig.(1.15)) of the measured band together with its broadening with decreasing size for gold clusters embedded in alumina matrix [49].
Figure 1.14: Photoabsorption cross-sections of a closed-shell sodium cluster. The dotted line is calculated in the basic model; dashed lines are from jellium calculations.
Figure 1.15: Absorption coefficient vs en-ergy for four different samples of mean size respectively: (a)2.0nm, (b) 2.3nm, (c) 2.6nm, (d) 3.7nm. The vertical line indicates the bulk limit value [49].
spectra even if the most important features can be explained thanks to the jellium model taking into account the above considerations that concern the influence of valence electrons.
1.6
Magnetic properties
The study of magnetism at the nanometer scale has recently been an active research area over the past decade for the close relationship between basic and industrially relevant properties. Below a critical diameter (dcrit, generally falling in the range
10-100 nm) a magnetic nanocluster cannot support more than a single domain. In these cases the atomic magnetic moments are coupled through exchange interactions with the formation of a large net cluster magnetic moment and the system is called super-paramagnet. For a specific super-paramegnetic particle there are rotational barriers to the alignment of the spins generated by shape, magneto-elastic and magneto-crystalline anisotropies; the corresponding magnetic anisotropy energy (MAE), accounting for the tendency of the magnetization to align along a determined direction and so connected to the stability of the magnetization, can be written as:
E(θ) = −KV cos2θ (1.26)
where K represents the so called magnetic anisotropy constant, V the volume of the particle and θ the angle between an easy direction of magnetization and the
magne-tization vector. There are two stable magnetic states, one with cluster magnemagne-tization parallel to the easy axis and the other with the magnetization antiparallel. The to-tal spin will flip between the two states and the frequency of this thermally activated flipping is given by the Arrhenius relationship:
v = v0e−∆E/kT (1.27)
where v0 is the attempt frequency and ∆E the energy barrier between the two spin
states (MAE).
Because of eq.(1.26), at a fixed temperature, there will be a critical particle size below which thermal fluctuations are sufficient to demagnetize the cluster; for a given particle diameter, there will be a temperature limit (blocking temperature) below which the hopping between the two spin states is frozen.
Recently experimental evidences of magnetic properties of nanoparticles in differ-ent conditions have been found. Macroscopic magnetic properties were observed in polymer-stabilized metal nanoparticles [50] like a super-paramagnetic behavior in Pd and Au clusters embedded in poly(N-vinyl-2-pyrrolidone)(PVP) at low temperatures. These observations are very interesting because gold, in the bulk state, is diamagnetic while palladium, in the same conditions, is diamagnetic. A question then arises on the existence of an intrinsic magnetic moment of the cluster. Direct evidence [51] of the intrinsic character of ferromagnetism in Au nanoparticles was given by on x-ray magnetic circular dichroism (XMCD) measurements. This spectroscopic probe allows to detect the magnetic moments of a specific element and because of this it has been used for the study of magnetism in the case of nanostructured materials [52], thin films [53] and strongly correlated systems [54]. For Au nanoparticles protected by polyallyl amine hydrochloride (PAAHC) (mean diameter 1.9nm) XMCD at the L2
and L3 Au-edges indicated the presence of a large magnetic anisotropy: the
magne-tization behavior is made up of superparamagnetism (obeying the Curie law) and a temperature-independent Pauli-paramagnetism. The total magnetization can then be expressed as: M(H) = NµL(x) + χP auliH, where L(x) is the Langevin function, µ the
magnetic moment per particle and N the total number of particles per unit volume. This expression fits rather well the experimental points, which show a rapid increase of magnetization with decreasing temperature followed then by a finite constant trend at high temperatures (Fig.(1.16)). The temperature-independent part of the plot cor-responds to the Pauli-paramagnetic part of the above equation, which is not observed in the bulk because it is diamagnetic. The advanced hypothesis is that this probably
happens because the paramagnetism of bulk Au is masked by the huge diamagnetism of the conduction electrons. On the contrary it’s not so in nanoclusters where, instead, paramagnetism occurs because of size effects and also of the kind of interaction with the surrounding molecules.
The possibility of an induced polarization of the conduction electrons of Au by magnetic impurities was excluded. So the observed mixed behavior was explained in term of surface ferromagnetism due to the large number of superficial atoms with re-spect to the bulk ones. Theoretical considerations, in fact, predict the appearance of a ferromagnetic spin polarization in 4d and 5d transition metals with reduced coor-dination geometry. So super-paramagnetic behavior comes from surface atom while diamagnetism comes from core atoms.
Figure 1.16: Temperature depen-dence of the XMCD peak intensity at 10T recorded at the Au L3 edge and
temperature variation of the tization measured by SQUID magne-tometer at 7T. Dotted line is the the-oretical fit to the data while solid lines are guides for the eye [51].
Figure 1.17: Hysteresis loops corre-sponding to the gold thiol-capped NPs, Au-SR, at 5K and 300K [55].
Inside this field the interaction with surrounding molecules plays an important role. Ligand polymers with a large affinity for the metal tend to quench the mag-netic moment at the surface of the cluster. An example is provided by the study of thiol-capped Au nanoparticles (mean size 1.4 nm) (hereafter called Au-SR) [55]. In this experiment, magnetic hysteresis up to room temperature was shown for Au-SR particles while Au nanoparticles of same size but stabilized by means of a very weakly interacting surfactant (tetraalkylammonium, hereafter called Au-NR) are diamagnetic as the macrocrystalline counterpart (Fig.(1.17)). It has been shown [116] that in gold nanoparticles capped with strong interacting thiols the number of holes in the 5d band


![Figure 2.1: Temperature dependence of linear expansivity α for metals of different compressibilities [86]](https://thumb-eu.123doks.com/thumbv2/123dokorg/2848818.5911/55.918.250.652.143.374/figure-temperature-dependence-linear-expansivity-metals-different-compressibilities.webp)