Abstract
Many hillslopes covered with maquis in the semi-arid Mediterranean environment have been cleared in recent decades. There is little information on what effect this has on the hydrology of the soil. We compared the hydraulic properties of the soil and the subsurface hydrological dynamics on two adjacent sites on a hills-lope. One site was covered with maquis, the other with grass. The grass started to grow some 10 years ago, after the maquis had been cleared and the soil had been ploughed. Our study found that the hydraulic properties and the hydrological dynamics of the maquis and the grassed soil differed greatly. The grassed soil had less organ-ic matter and higher apparent density than did the soil covered in maquis. Moreover, the maquis soil retained more water than the grassed soil in the tension range from saturation to 50 cm of water. Infiltration tests performed in summer and in winter indicated that the field saturated hydraulic conductivity (Kfs) of the maquis soil was
higher than that of the grassy soil. However the data showed that the Kfs of the two soils changed with the season. In the maquis soil the
Kfs increased from summer to winter. This was assumed to be due to
water flowing more efficiently through wet soil. By contrast, in the grassy soil the Kfs decreased from summer to winter. This was
because the desiccation cracks closed in the wet soil. As result, the influence of the land use change was clear from the Kfs
measure-ments in winter, but less so from those in the summer. Changes in land use altered the dynamics of the infiltration, subsurface drainage and soil water storage of the soil. The maquis soil profile never
satu-rated completely, and only short-lived, event based perched water tables were observed. By contrast, soil saturation and a shallow water table were observed in the grass covered site throughout the wet sea-son. The differences were assumed to be due to the high canopy interception of the maquis cover, and to the macropores in the grassed soil being destroyed after the maquis had been cleared and the soil ploughed.
The results of this work are helpful for predicting the changes in the hydraulic properties of the soil and in the near-surface hydrolog-ical processes in similar Mediterranean environments where the natural vegetation has been cleared. These changes must be taken into consideration when developing rainfall-runoff models for flood forecasting and water yield evaluation.
Introduction
The hydrological properties of the soil depend greatly on the vege-tation type and soil management. Land-use controls the hydrological processes in the soil at plot, hillslope and basin scale. In an attempt to explain the impact of the land use in the soil hydrology, and thus define a policy for sustainable land use management, hydrologists have investigated the influence of land use on the hydraulic proper-ties of the soil. Many authors (e.g. Gajić, 2013; Martinez and Zinck, 2004; Gonzales-Sosa et al., 2010; Price et al., 2010; Iovino et al., 2013) have reported that deforested soils have lower organic matter con-tent and higher bulk density than do forested soils. The water reten-tion characteristics and the hydraulic conductivity of soil also were different between land uses. This was particularly evident in the top-soil and in the water content at saturation (Gajić, 2013; De Moraes et al., 2006; Zimmermann et al., 2006; Alaoui et al., 2011). However, Evrendilek et al. (2004) reported that bulk densities did not vary between forest and pasture in the Mediterranean highlands of Turkey. Agnese et al. (2011) also reported that, for two of the five sites investigated in a Mediterranean watershed, bulk density did not differ for forest and the pasture areas. Sauer and Logsdon (2002), Hassler et al. (2010) and Celik (2005) also found that saturated hydraulic conductivity measured in field did not differ for forest and grassland. These contrasting results in the literature are due to the fact that the effects of land use vary greatly, depending on the cli-mate, morphology, vegetation, soil types and land management prac-tices. Hence the differences in the hydrological properties of the soil in areas with different land use cannot be assumed a priori, and need to be verified for each of the different types of environment.
Although the effects of the land use on the hydraulic properties of the soil have been studied intensively in recent decades, less atten-tion has been paid to investigating the related impact in the near-surface soil hydrological processes, such as the dynamics of soil moisture and the water table.
Correspondence: Mario Pirastru, Agricultural Department, University of Sassari, viale Italia 39, 07100 Sassari, Italy.
Tel.: +39.079.229342 - Fax: +39.079.229340. E-mail: [email protected]
Key words: Mediterranean maquis clearing, land use, hydraulic properties, field monitoring, soil water, water table.
Received for publication: 22 July 2014. Accepted for publication: 23 November 2014.
©Copyright M. Pirastru et al., 2014 Licensee PAGEPress, Italy
Journal of Agricultural Engineering 2014; XLV:428 doi:10.4081/jae.2014.428
This article is distributed under the terms of the Creative Commons Attribution Noncommercial License (by-nc 3.0) which permits any noncom-mercial use, distribution, and reproduction in any medium, provided the orig-inal author(s) and source are credited.
Effects of maquis clearing on the properties of the soil
and on the near-surface hydrological processes
in a semi-arid Mediterranean environment
Mario Pirastru, Marcello Niedda, Mirko Castellini
Agricultural Department, University of Sassari, Italy
[page 176] [Journal of Agricultural Engineering 2014; XLV:428]
Non
commercial
use
For example, Gallart et al. (1997) studied the variations in soil water storage over time in a Mediterranean mountain basin in the Pyrenees. They observed that the soil profiles in forested areas always had lower water content than did those in cleared areas. This was mainly attributed to the forest interception, which can be even higher than the potential evapotranspiration. In their study they found that forest cover played an equally important role in determining the spa-tial distribution of the soil water reserves as did the topographic sit-uation. Fu et al. (2003) investigated the soil moisture patterns of seven vegetation types in the semiarid area of the Loess Plateau of China. They found that intercrop (bare) soils had higher water con-tent than soil covered in vegetation, and that grass covered soil had higher soil moisture content than forested soil. They asserted that the main reasons for this were the interception of the trees and the dif-ferences in the physical properties of the soil. These affected the infiltration rate, storage and redistribution of soil water in the inves-tigated land uses. Mollnau et al. (2014) studied the soil water dynam-ics under a western juniper (Juniperus occidentalis) woodland and compared their results with those for a site where the woods had been cut down. They found that the soil moisture content was higher in sites where the tree cover had been cleared. The woodland had a negative impact on deep water reserve recharge. This was due to the high interception rate of the juniper, and also its ability to extract water from deep soil strata.
Little information is available in semi-arid Mediterranean water-sheds on the effects that clearing natural vegetation has on the hydraulic properties of the soil and its hydrological processes. Understanding how the soil responds after land use change is essen-tial for researchers and planners that work in this semiarid environ-ment, so that they can develop strategies for conserving the water and the soil and minimising flood risks. In this type of climate, the high frequency of intense rainfall events and the seasonal mismatch between evapotranspiration and rainfall results in more intense storm-flow and erosion in the watersheds (Piňol et al., 1997; Costa et al., 2003; Cantón et al., 2011). The main aim of this work is to inves-tigate the effects of clearing Mediterranean maquis on the hydrology of the soil, in an area which already suffers from land use degrada-tion. The soil on a hillslope with two different types of land use, i.e. a well developed mediterranean maquis and an area covered with spon-taneous grass, was analysed hydrologically. The specific objectives were to investigate how the removal of the mediterranean maquis influenced: i) the hydrological properties of the soil; ii) the near-sur-face water flow processes.
First, the results of measuring soil properties (texture, organic matter and bulk density), water retention and hydraulic conductivity are presented, and the difference between the land use classes analysed. Second, the observed dynamics of soil moisture and of the perched water table in the soil under the grass and the maquis are described. This information is then used to develop hypotheses about how clearing the maquis changes the infiltration, drainage and stor-age mechanisms in the soil.
Materials and methods
Site description
The experimental area is located in the Baratz Lake watershed (Niedda and Pirastru, 2013; Pirastru and Niedda, 2013), in north-west Sardinia, Italy. Baratz Lake is the only natural lake in Sardinia, and contributes significantly to the maintenance of biological diversity. It was declared a site of community importance in the NATURA 2000
network, as defined by the European Commission Habitats Directive (92/43/EEC) (http://ec.europa.eu/environment/nature/natura2000/). Baratz Lake has suffered from hydrological and ecological degrada-tion in recent years. This is due to a decrease in precipitadegrada-tion and the conversion of some parts of the basin from Mediterranean shrubland (maquis) and woods to pasture and arable lands (Niedda et al., 2014). The climate is semi-arid Mediterranean, with a mild winter, a warm summer, and a high water deficit between April and September. Mean annual temperature is 15.8°C and relative humidity 78.7%. Minimum and maximum mean daily temperatures are 3°C and 29°C, respective-ly. Average annual precipitation is about 600 mm, and this falls main-ly from autumn to spring.
The experimental area was on the steep side of a hill (Figure 1), adjacent to the main valley of the catchment area. The hillslope faces north and has a mean elevation of 63 m a.s.l. It is about 60 m long with a mean gradient of 30%. At the top of the hillslope, incoming overland flow and subsurface flow are diverted by the ditches along-side a road. At the bottom the slope is drained by the incised stream of the main river of the catchment area. Two adjacent 60 m long by 15 m wide sites on the hillslope with different land uses were selected for the research. One site was covered with a well-developed mediter-ranean maquis and the other was an unmanaged area covered with spontaneous grass. The maquis is 2-4 m high and consists of dense evergreen shrubs such as Myrtus Communis L., Arbutus unedo L., Erica arborea L., Phillirea latifolia L. and Pistacia lentiscus L.. The spontaneous grass area (Hordeum spontaneoum L., Avena sativa L., Galactites tomentosa Moench, etc.) is at least 10 years old. It is the result of clearing the previous maquis and the deep plowing (only once after the maquis had been cleared) to create a 15 m wide fire-break. The soil in both sites is about 0.4-0.5 m deep and overlies a greyish, altered substratum of Permian sandstone. This latter is very dense (at least 1900 kg m–3), and drainage through it is very low,
which prevents deep percolation. Soils are classified as Lithic Haploxerepts. The soil horizons include A, Bw and C in the area cov-ered in maquis, and Ap, BW and C in the area covcov-ered in grass. Because the two areas have the same climate and topographical fea-tures, they appear suitable for a comparative investigation of the effects of land use on soil hydrology.
Soil sampling, physical and hydrological property
measurements
Measurements of the physical and hydrological properties of the soil were carried out in both classes of land use at randomly chosen sites in the hillslope, at least 5 m inside the border of the maquis cover and close the central transect of the grassy zone. The litter and leaf residues (about 10 cm thick in the maquis and 1 cm thick in the grassed area) were removed from the soil surface before measure-ments were taken. Soil core samples were taken, so that the textural characteristics and organic matter content (OM), soil bulk densityρb
and the water retention characteristics θ(h) of the soil could be analysed in the laboratory. The saturated and unsaturated hydraulic conductivity of the soils, Kfs and K(h), were also estimated in the
field. Soil sampling and hydrological measurements were carried out at depths of 0.1 m (topsoil) and 0.2 m (subsoil) below the exposed soil surface, with the exception that K(h) was only estimated in the top-soil. The soil sampling was limited to a maximum depth of 0.2 m because, as several investigations have reported (Celik, 2005; Zimmermann et al., 2006; Hassler et al., 2010), the effects of land use decreases as the soil depth increases. Measurements were taken in June 2012 and, in the case of Kfs, were repeated in February 2013. All
the field measurements were taken during a two-week rainless peri-od. This minimised the effect of changes in soil moisture on the
Non
commercial
use
hydraulic properties of the soil over time.
The clay, silt, and sand content in 16 disturbed soil samples were determined, according to the United States Department of Agriculture (USDA) classification, by sieving for coarse and fine sand and by the pipette method for the silt and clay soil fractions. The OM was esti-mated to be equal to 1.724 times the organic carbon content. This was determined by the Walkley-Black method (Sleutel et al., 2007). The ρb
was estimated in the laboratory by oven-drying (110°C for 48 h) 60 soil samples in steel cylinders (5 cm high, volume of 100 cm3).
θ(h) were estimated using data from evaporation experiments on soil samples in the laboratory, using experimental procedures described in Pirastru and Niedda (2010). Soil core samples were col-lected in the field by pushing 10 cm high PVC cylinders with a volume of 300 cm3 into the soil surface. The cylinders had a sharp cutting
edge, so that they could be inserted with the minimum disturbance to the soil. Care was taken to insert the cylinders in soil areas which seemed to be free of stones. If the soil core samples included stones, the data was discarded. Eight soil core samples, 4 from each site, were used for the experiments. This number of samples is thought to be enough to obtain a sample mean that is within 25% of true mean at a 90% confidence level, because it is expected low or medium vari-ability in the amount of water retained at different tension levels (Warrick, 1998).
A single-ring infiltrometer was used to estimate Kfsin 96
field-infil-tration experiments (Reynolds et al., 2002; Bagarello et al., 2014). A horizontal step was created in the sloping surface, to allow this instrument to be installed. The steel cylinder (10 cm in diameter) was inserted down to the prescribed soil depth, and a constant water pres-sure head (3 cm) was established within the cylinder above the soil, using a Mariotte bottle device. Once an apparent steady-state flow had been reached (at least thirty minutes after the start of each experiment), the outflow was manually recorded every 5 min for a period of 30 min, and the steady outflow rate was calculated by aver-aging these results.
In the moisture range close to water saturation the K(h) was esti-mated with a tension infiltrometer apparatus such as that illustrated in Angulo-Jaramillo et al. (2000). The measurements were taken at only 10 locations, because of the difficulties encountered when the tension infiltrometer was installed in the field. These difficulties were due to the steepness of the slope, the stoniness of the soil and, for the maquis, the inaccessibility of the undergrowth. However, in the scientific literature (Gajić, 2013; Castellini and Ventrella, 2012; Das Gupta et al., 2006; Zhou et al., 2008; Hassler et al., 2010) similar sized data sets have been found to be sufficient for highlighting the effects of land use and soil management on the hydraulic conductivity of the soil. A horizontal step was created in the sloping surface, to allow the tension infiltrometer to be installed. Details about the used experimental procedure can be found in Castellini and Ventrella (2012). The infiltration rates were measured by applying the dry to wet sequence of water pressure heads of h=–10, –5, –3 and –1 cm at the same soil site, in order to exclude any confusion in the results due to hysteresis (Bagarello et al., 2005). The outflow rate was calcu-lated by averaging the 5 min measurements, after an apparent steady-state flow had been reached.
Analysis of data
Data from evaporation experiments in the laboratory were analysed using the mathematical procedures described in detail in Arya (2002) and Pirastru and Niedda (2010). The resulting water retention data from each experiment were fitted to the van Genuchten (VG) parametric function (van Genuchten, 1980), using the RETC non-linear least squares curve-fitting program (van Genuchten et al., 1991), and assuming that the residual water content
was zero:
(1)
where:
a[cm–1], n [-] and m [-] are shape factors that depend on soil type,
h is the water pressure head [cm] in the soil.
The Kfs values were calculated from the steady-state infiltration
rate measured during the infiltration experiments, using the single-head analysis described by Reynolds and Elrick (2002). In this analy-sis the parameter a* was set at 12 m–1, which is adequate for most
structured soils (Elrick and Reynolds, 1992).
The K(h) values were calculated from steady-state outflow rate by means of the double tension approach described by Reynolds and Elrick (1991) and Bagarello et al. (2010). We used the Wooding (1968) analytical solution for steady-state flow from a circular source, written for two different hydraulic heads and the two corresponding water volume flow infiltration rates.
All the measurements from the same soil depth were pooled for each land use class. The arithmetic mean (M) and the coefficient of variation (CV) were used to describe the data. The geometric mean (GM) and the appropriate equation for CV were used to describe the Kfsdata, because they are better described by a log-normal
distribu-tion (Lee et al., 1985).
Non-parametric Mann-Whitney Rank Sum tests were performed to test for the significance of the differences in the soil properties of the topsoil and the subsoil in the different land use classes. A threshold value of P=0.05 was used to define statistical significance. All analy-ses were performed using the functions of the MATLAB Statistical Toolbox (Natick, MA, USA).
Hydrological monitoring setup
Two identical sets of instruments, one set within the maquis, and the other in the area covered with grass, were installed in January 2009 (Figure 1). Each set included three TDR Campbell Scientific Inc. (Logan, UT, USA) CS216 Water Content Reflectometers (two-rod model, 0.3 m rod-length and 32 mm spacing) to measure moisture and one termistore (Model 107 Temperature Probe) to measure soil temperature. The termistore was located at a depth of 0.15 m. Two TDR probes were inserted horizontally at depths of 0.1 and 0.2 m, in order to monitor rapid soil moisture changes in the topsoil in more detail. A third TDR probe was placed 0.3 m deep in the soil. This was installed approximately vertically, and was done to monitor the aver-age soil moisture of the subsoil at depths between 0.3 m and 0.5 m (this will be referred to hereafter as the intermediate depth of 0.4 m). The output signals of the TDR probes were adjusted for soil tempera-ture following the manufactempera-turer’s instructions. In order to calibrate the probe, the output signals were related to independently determine volumetric water contents in the field. From these data it was possible to describe the probe response to changing water content by the quad-ratic calibration equation:
θv = C0+C1*τ+C2* τ2 (2)
where:
θvis the volumetric water content (cm3cm–3);
τ the CS616 period (ms); and
C0,C1and C2are calibration coefficients derived from the curve fit
(R2=0.93).
Non
commercial
use
All the automatic measurements were executed every 5 min in order to also monitor the fastest soil moisture changes, and were simultane-ously logged by a Campbell Scientific Inc. CR1000 data logger.
Three shallow observation wells were installed in the maquis site (M1, M2 and M3 of Figure 1) and five in the grassed site (from G1 to G5 of Figure 1) in January 2009, in order to monitor the height of the perched water table that developed within the soil above the impeding layer of altered sandstone. Each observation well extended down to the impeding layer, and was screened 0.3 m above the top of this layer. The height of the perched water table was monitored manually by a phreatimeter during site visits throughout the winter and spring of 2009. The time interval for monitoring varied, ranging from one day, after rainfall events, to ten days, in rainless periods.
Additional hydrological monitoring was carried out at the maquis site, beginning in autumn 2012. This included using two pressure transducers (Schlumberger mini-diver) to measure the water table heights in M2 and M3 every 5 min, while M1 was monitored manually during site visits. Throughfall was also estimated in the area covered in maquis, using three tipping bucket rain gauges located close to M2. These measurements were compared with those for gross rain-fall, measured by the tipping bucket rain gauge of an automatic weather station. This was installed in January 2009, about 300 m away from the hillslope.
Results
Physical and hydrological soil properties
Soil texture and organic matter content
Thirteen of the 16 soil samples analysed were classified as sandy loam. The other three were sandy clay loam, one coming from the grassy soil, and two from the maquis soil. As can be seen from Table 1, the mean percentages of sand, silt and clay of topsoil and subsoil
were very similar in the grassed site, and differed slightly in the maquis site. This was because the topsoil in the latter was richer in clay. The mean percentages of sand, silt and clay in the topsoil and subsoil were statistically similar.
As shown in Table 1, in the maquis site the mean OM of the topsoil was 1.62 times greater than that of the subsoil. This vertical differ-ence was not so apparent in the grassed site, with the mean OM being similar at depths of 0.1 and 0.2 m. The mean OM of the topsoil in the maquis site was 3.1 times greater than that of grassy site, and the dif-ference between land use classes was statistically significant. The mean OM of the subsoil in the maquis site was 2.6 times greater than of that grassy site and, once again, the difference was statistically sig-nificant.
Table 1. Physical soil properties (mean values) at depth of 0.1 and 0.2 m in the maquis and grassed sites.
Maquis* Grass*
Soil depth increment 0-0.1 m 0.1-0.2 m 0-0.1 m 0.1-0.2 m
Sand % 61.1 66.6 68.6aa 67.0aa (n=4) (0.18) (0.11) (0.06) (0.18) Silt % 20.2 21.6 14.9aa 14.4aa (n=4) (0.28) (0.37) (0.06) (0.36) Clay % 18.7 11.8 16.5aa 18.6aa (n=4) (0.29) (0.16) (0.19) (0.45) OM % 14.3 8.80 4.60ab 3.30ab (n=4) (0.09) (0.33) (0.21) (0.31) ρb(100 cm3) g cm−3 1.14 1.39 1.57ab 1.62ab (n=15) (0.17) (0.07) (0.08) (0.06)
*In parentheses are showed the coefficients of variation. Different letters indicate that the soil property value in the grassed soil significantly (P<0.05) differs respect to that of the maquis soil.
Figure 1. Photograph of the experimental hillslope with the maquis and grassed areas, and illustration of the monitoring design includ-ing automatic TDR probes, shallow piezometers and the rain gauges below the maquis cover for the throughfall estimation.
Non
commercial
use
Soil bulk density
In the maquis site the mean ρbof the topsoil (1.14 g cm–3) was
about 80% of that of the subsoil. By contrast, in the grassed site the mean ρbof the topsoil and of the subsoil were very similar (Table 1).
This reflects the above mentioned lack of variance in OM along this profile. The mean ρbof the maquis topsoil was 72% of that of the
grassed topsoil. The mean ρbof the maquis subsoil was 85% of that of
the grassed subsoil. The differences between the land use classes were statistically significant at both depths.
Water retention characteristics
Figure 2 shows the water retention data obtained from the evapo-ration experiments for the two investigated soils. In the Figure 2 are showed the mean water retention curves, obtained by pooling all the retention data from each soil and then fitting them, using the VG equation (Eq. 1).
Fitting the van Genuchten equation separately to the retention data from each evaporation test gave R2values always greater than 0.97.
The values of the n parameter varied over approximately the same narrow range of values (1.13>n>1.21 in grassy soil, 1.13>n>1.28 in maquis soil). This parameter is mainly the result of the slope of the retention curve at low potentials (h<–300 cm) and varies little among soils, as can be seen in Figure 2.
There was greater variation in the a values for the two soils (0.06>a>0.74 in the maquis site, 0.03>a>0.16 in the grassed site). This complicated the identification of differences between the maquis and grassed soils. We used the fitting strategy illustrated in Schwartz et al. (2003) to reduce this variation. We fixed the value of n at the observed mean value (n=1.19), and carried out a one-para-meter fit for each land use. As it did in Schwartz et al. (2003), this approach improved the identification of a, while not compromising the fit of the measured retention data (R2>0.95). When this fitting
strategy was used, the a parameters were consistently greater for the maquis site (0.16>a>0.23) than for the grassed site (0.03>a>0.079).
Unsaturated and saturated hydraulic conductivity
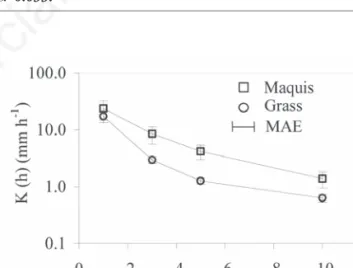
As can be seen from Figure 3, for h= –10, –5-, –3 and –1 cm, the mean K(h) in the maquis site were about 2.1, 3.1, 2.7 and 1.2 times greater than those for the grassed site. The K(h) values in the maquis soil and in the grassy soil increased at about the same rate, passing from h= –10 cm to h= –3 cm. For water tensions greater than h= –3 cm, the rate of increase in the grassy soil was about double that of the maquis soil.
The Kfsin the summer ranged from 130 to 600 mm h–1 in the
maquis site, and from 9.5 to 390 mm h–1in the grassed site. As shown
in Table 2, Kfsdecreased rapidly with depth, with the Kfsof the topsoil
being about 1.76 greater than that of the subsoil in the maquis and 2.4 times greater in the grassed site. Table 2 shows that the average Kfsin the topsoil of the maquis site was about 1.75 times higher than
that of the grassed site. The average Kfsin the subsoil of the maquis
site was about 2.4 times higher than that of the grassed site. At the two investigated soil depths, the null hypothesis that there was no dif-ference between land uses cannot be rejected.
In the winter period, the Kfsvalues ranged from 117 to 2154 mm h– 1in the maquis site and from 25 to 378 mm h–1in the grassed site,
and. High values, such as those that we found on several occasions in the maquis soil, have been reported in the scientific literature in both agricultural soils (Etana et al., 2013; Castellini et al., 2014) and forested soils. For example, Gonzalez-Sosa et al. (2010) in their study on a small wood with ivy land use measured a mean Kfsof 5400 mm
h–1with a single ring infiltrometer. Even higher values were found by
Buczko et al. (2006), who used a ponded ring infiltrometer in a study on soil water repellence in forest soils. Based on the winter measure-ments, the Kfsof the topsoil in the maquis site was about 2.8 times
higher than that of the subsoil, while Kfsvaried 1.5 times with depth
in the grassed site (Table 2). The average Kfsof the maquis topsoil
[page 180] [Journal of Agricultural Engineering 2014; XLV:428]
Figure 2. Ensemble of the water retention point data obtained in the evaporation experiments in laboratory for the maquis and grassed soils, and fitted van Genuchten (VG) curves. For the curve fitting the parameter n was fixed to the averaged value n=1.19 (see text for more details). Other fitting parameters are:
for maquis site θs=0.48 and a=0.153, for grassed site θs=0.38 and
a=0.033.
Figure 3. Mean values and mean absolute errors (MAE) of K(h) estimated in the summer at the water tensions of −10, −5, −3, −1 cm, in the maquis and in the grassed soils.
Table 2. Kfsvalues measured in the summer and in the winter
sea-sons in the topsoil and subsoil of the maquis and grassed sites (sample size n=12).
Maquis* Grass*
Soil depth increment 0-0.1 m 0.1-0.2 m 0-0.1 m 0.1-0.2 m
Kfssummer (mm h−1) 445 (0.25) 253 (0.59) 254aa° (0.51) 105aa° (1.29)
Kfswinter (mm h−1) 1017 (0.63) 363 (0.52) 139ab° (0.7) 94ab° (0.54)
GMwinter/GMsummer# 2.28cd# 1.43cd# 0.55cc# 0.89cc#
GM, geometric means. *In parentheses are showed the coefficients of variation; °Different letters indi-cate that the Kfsof the grassed soil significantly (P<0.05) differs respect to that of the maquis soil; #Different letters indicate that the K
fssignificantly (P<0.05) changed from summer to winter season.
Non
commercial
use
was about 7.3 times higher than that of the grassed site. In the sub-soil, the average Kfsof the maquis was about 3.9 times higher than
that of the grassed site. The statistical analysis indicated that there were significant differences between land uses at the two investigat-ed soil depths.
Near-surface soil water dynamics
Throughfall
The data for the throughfall observed in the wet season 2012-2013 by the three rain gauges installed under the maquis cover are shown in Figure 4A, and compared with the gross rainfall measured at the weather station. The data are complete for pluviometers P1 and P2, while for the third pluviometer P3 data stops in February 2013, because this instrument was irreparably damaged.
Throughfall was 68% of the gross rainfall for P1, 76% for P2 and 55% for P3. The average throughfall (the average of P1 and P2) was about 70% of the gross rainfall for the whole monitoring period. This data is in line with the values reported for Mediterranean environ-ments in the review by Llorens and Domingo (2007).
Soil moisture
The temporal dynamics of the soil moisture at depths of 0.1, 0.2 and
0.4 m in the maquis and grassed sites were observed from January 2009 to September 2010. The period included two wet seasons and one dry season (Figure 5A). These data are shown in Figure 5B and C. The water storage levels were estimated for the different land uses and showed in Figure 5D. The soil storage was computed by assuming that the horizontal probes estimated the average soil moisture in first 0.3 m of soil, and that the vertical probes did the same for the remain-ing soil volume until the impedremain-ing layer. The maximum water storage was about 180 mm for the grass and 140 mm for the maquis soil, with little difference between the two wet seasons that we monitored. The minimum stored water in the 2009 dry season was about 55 mm in the grass and 60 mm in the maquis. In the autumn of 2009, 180 mm of rainfall recharged the water storage of the grassy soil of about 125 mm. This was mainly due to the rain events of 15 September and 22 October 2009. In the same period the recovery of the soil water stor-age below the maquis was more gradual and ended in winter, when overall the soil water storage increased of about 80 mm. In early spring increasing evapotranspiration caused the soils to start to dry out, first under the maquis and then under the grass. However, as the dry season advanced, the soil depletion rate was very intense in the grassy site and in the summer of 2009 the situation for the moisture levels in the soils was reversed, with the grassy soil being drier than the maquis soil.
Figure 4. Observed rainfall and throughfall below the maquis cover (A) and hydrographs (B) showing the perched water table heights measured above the impeding layer in the piezometers M2 and M3 during the rainy season 2012-2013.
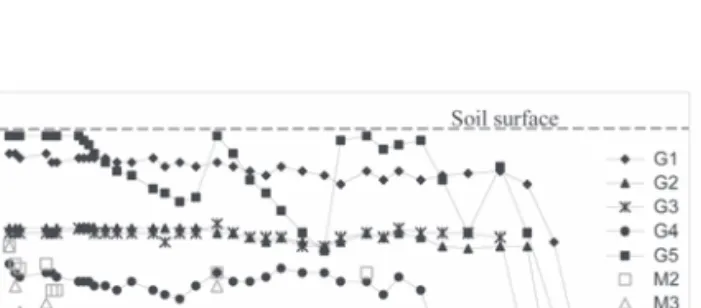
Figure 5. Observed rainfall (A), soil moisture at 0.1, 0.2 and 0.4 m of depth, observed from the January 2009 to September 2010 in the grassed site (B) and in the maquis site (C), and computed soil water storage (D).
A
A
B
C
D
B
Non
commercial
use
only
The TDR data indicated that at the three monitored soil depths the dynamics of soil moisture over time was different in the two soils. At the beginning of autumn 2009 the TDR probes in the grassed site reacted to the intense rainfall events simultaneously at all the observed soil depths, and these responses occurred a short time (a few minutes) after the beginning of the rain. These rain events, increased the moisture at depths of 0.2 and 0.4 m of soil by about 20%, and this increase was greater than that in the surface layer. Afterwards, the water content at 0.2 and 0.4 m of depth stayed mainly constant until the rain event of 22 October 2009, which saturated the soil at these depths. During the rainy autumn of 2009 the water con-tent of the soil at 0.1 m of depth fluctuated more than did that of the deepest soil layer. This was due to the drainage through the superfi-cial cracks and to the evapotranspiration process. In the winter evap-otraspiration was low and the cracks in the soil closed, greatly reduc-ing its conductivity. As a result, from January 2010 the water in the topsoil started to stagnate.
The TDR responses in the maquis site during the rain events of September and October 2009 were less apparent than those in the grassed site. These responses lessened with depth, so that the TDR probe at 0.4 m of depth was only slightly affected by these rains. As the wet season advanced soil moisture became more evenly distrib-uted in the soil profile, and, from the beginning of the winter, it approached the maximum annual values at all depths.
The soil of the grassy site at a depth of 0.1 m was always close to saturation in the two observed winter periods. This agreed with the evidence of a very shallow groundwater table from piezometer G1 nearby (Figure 6). This was measured directly in the winter of 2009, but was also found throughout the winter of 2010. However, although the water table submerged the 0.2 and 0.4 m deep TDR probes in both the winters, in these periods the observed soil moisture at the same soil depths was 70% and 85% of saturation, respectively. As can be seen from the results for the winter of 2010, these values were reached gradually, after peak levels that were the result of intense rain events in the autumn. We believe that this progressive reduction in moisture at 0.2 and 0.4 m of depth from the beginning of the wet season was due to the changes in the soil structure over time. Because the soil was wet, the soil aggregates may have expanded. This may have closed some large cracks near the probe rods, thus reducing the amount of retained water.
In the two observed winter periods the mean water content of the maquis soil was always close to 50% of saturation. This value approx-imately matches the field capacity of this soil (i.e. water held at –333 cm H2O, Figure 2). After this soil moisture condition was reached,
each rain event in the winter increased soil moisture by no more than 2-3%, without ever saturating the soil. The infiltrated water was then
rapidly redistributed by the efficient drainage in the soil.
The hydrological behavior of the two soils was also different in the dry periods of spring-summer 2009. In the grassed site the drying process started on the surface and then deeper down. It was very intense at all depths, so that by the start of the summer the soil mois-ture level already approached the minimum water content level for the year. In the maquis site the soil dried out more gradually than it did in the grassed site, so that at the end of summer the drying process still did not seem to have been completed. This process also occurred almost simultaneously at all depths.
Perched water table
The results of monitoring the shallow groundwater levels at the maquis and grassed sites during the rainy season of 2009 are shown in Figure 6. During this period all the piezometers of the grassed site showed that there was a perched water table. The water table persist-ed throughout the winter, and then disappearpersist-ed at the beginning of the summer. The water table levels were close to the soil surface at piezometers G1 and G5, which were positioned, respectively, at the top and bottom of the slope, and were deeper at G2, G3 and G4, in the central part of hillslope. The observed levels at G1, G2, G3 and G4 var-ied by a few centimetres, without ever reaching the surface of the soil. However, because our measurements were relatively infrequent, we cannot exclude the possibility that levels peaked at the soil surface during the most intense rainfall. In G5 the level fluctuations were greater and for long periods the levels rose to the soil surface.
During the rainy season of 2009 a perched water table was observed in wells M2 and M3 in the maquis site, but not in M1. This occurred for ten days at the beginning of the monitoring period, and also after the rainfall events of 7 March and 4 April 2009. On these occasions the groundwater table dried up before the subsequent visit to the site, which was four days later. During all site visits the moni-tored water table never reached the surface of the soil.
Monitoring of the groundwater levels in M1, M2 and M3 was car-ried out also from October 2012 to June 2013. No piezometric responses were observed in M1 throughout the monitoring period. In M2 and M3 no piezometric responses were observed in the autumn, but, unlike in the rainy season of 2009, on several occasions a perched water table developed in both these wells. This started in January 2013, as shown in Figure 4B. Levels begin to rise from one to three hours after the start of the rain, and then took from between one and twelve hours to reach their peak. In neither well did the water table reach the surface of the soil. After the rain ceased, the perched water table took from three to six days to dry out.
Discussion
Physical and hydrological soil properties
Particle size analysis indicated that was no difference in the tex-ture of the soil in the different land use areas. It indicates that the differences in the hydraulic properties of the soil and in the related hydrological processes in the maquis and the adjacent grassed area of the research site can be ascribed to the different vegetation types and the methods used to convert the land from one use to another, i.e. the deep ploughing that was carried out immediately after the maquis had been cleared. This occurred at least 10 years ago.
OM analysis indicated that the maquis cover creates much more favourable conditions for producing and storing OM than does grass cover. These results are in line with the findings of several other studies in sites where forest and grassed areas are compared (Celik,
[page 182] [Journal of Agricultural Engineering 2014; XLV:428]
Figure 6. Hydrographs showing the observed perched water table heights above the impeding layer in the maquis and grassed sites in the rainy season 2009.
Non
commercial
use
2005; Gonzales-Sosa et al., 2010; Agnese et al., 2011). Because organ-ic matter content distribution also influences ρbof soil, as reported by
many authors (Gajić, 2013; Agnese et al., 2011), there were signifi-cant differences in this soil property in the two different areas. The results of our study agree with those of other studies (Martinez and Zink, 2004; Gonzalez-Sosa et al., 2010; Price et al., 2010; Agnese et al., 2011), and support the general conclusion that after disruption of the natural land cover one must expect an increase in ρb, and this is more
apparent in the topsoil than the subsoil.
Changes in land use altered the soil pore size distribution. Analysis of the water retention characteristics of the soils suggested that these changes were limited to the water tension range from satura-tion to 50 cm. From Figure 2 one can see that in this range in mean the retained water content of the maquis soil greatly exceeded that of the grassed soil. Based on the water retention curves, we calculated that in the range from saturation to –5 cm of tension, where macro-pores are able to conduct the flow (Messing and Jarvis, 1993), the retained water was 4% in the maquis site, and 0.7% in the grassed site. Similar ranges of porosity were also found by Agnese et al. (2011), Daraghmeh et al. (2008) and Schwartz et al. (2003). When the soil is far from saturation (h< –50 cm), water retention is mainly affected by the micropore, which, in turn, is mainly determined by the soil texture (van Genuchten and Nielsen, 1985). Because this was similar among the observed soils, this similarity was mirrored in the water retention characteristics at the lowest potentials. For modelling purposes a decrease in the van Genuchten parameter a, rather than n, may better represent the alterations in the pore size distribution in the grassy soil.
The K(h) measurements in both maquis and grassed sites increased more than one order of magnitude passing from h= –10 cm to h= –1 cm. The greater variability in K(h) in the maquis site is an indication of the higher spatial variation of the biopores (e.g. tree roots and worm holes) in this soil. However one difference was observed in the way in which these flow paths were activated in the two soils during the infiltration tests. As can be seen in Figure 3, for potentials higher than –3 cm, the slope of the K(h) curve increase more for the grassed site than for the maquis site. This effect was due to the hydraulic activation of some cracks, which had been observed in the grassy topsoil during the dry summer. The fact that the K(h) of the two soils was similar at the highest applied potential during the tests with the tension infiltrometer suggests that these cracks act in a similar way to the macropores in the maquis soil, conducting a great deal of water vertically.
As also found by other authors in different environments (Bormann and Klaassen, 2008; Zhou et al., 2008; Hu et al., 2012), the analysis of Kfs indicated that in our experimental site this hydraulic
soil property varies due to complex spatial and temporal dynamics. In the maquis soil the Kfsin the topsoil was 2.3 higher in winter than
summer, and about 1.4 higher in the subsoil (Table 2). Both these increases were statistically significant. In the grassed site the Kfsin
the topsoil in winter was about 55% of that of the summer, and was 89% in the subsoil, although the decreases were not statistically sig-nificant. These results are in line with those of other field studies, which have indicated that Kfsvaries with time, depending of seasonal
biotic and abiotic factors. Bormann and Klaassen (2008) and Zhou et al. (2008) found that the surface hydraulic conductivity measured under pasture and cropland in late spring or summer was higher than that measured in wetter periods. These results were explained by the increase in surface soil macroporosity, which was itself due to the development of animal burrows and earthworm channels in the spring, and the appearance of desiccation cracks in the surface of the soil in the dry months. This well describes our grassed site, where during the dry summer some superficial vertical cracks developed in
the topsoil, and these were activated during the infiltration tests. Because these cracks were more frequent in the topsoil than in the subsoil, there was a significant seasonal decrease in Kfsas the depth
increased. In fact, during the wet winter the expansion of soil aggre-gates caused the cracks to close, with a resulting decrease in hydraulic conductivity.
In the maquis site, the high OM content stabilises soil aggregates, and this guarantees that soil structure is more stable over time. Thus, as Bormann and Klaassen (2008) and Zhou et al. (2008) stated, soil structure dynamics should have a minimal impact on changes in the hydraulic soil properties over time. However, unlike to the abovemen-tioned authors, we observed an increase in Kfsfrom summer to
win-ter, and, as shown in the Table 2, this increase was more evident in the topsoil than in the subsoil. This difference may be due to the very different soil moisture conditions when the measurements were made, about 15% of mean soil moisture in the summer and about 35% in the winter. There was also evidence that during the summer meas-urement period there was a moisture gradient along the soil profile, with the topsoil being drier than the subsoil. Unlike in the winter, in the summer greater air content may have been trapped in the soil during the ponding phase of the experiments of infiltration. This may have occurred more in the dry topsoil than in the wetter subsoil. Trapped air bubbles disrupt the continuity of the pore network and increase the tortuosity of the flow. This decreases the subsurface flow rate during the infiltration tests.
Soil moisture
Soil water data shows that land use significantly influences the vol-ume of water stored in the soil. During the wet seasons the maquis soil always had lower water storage than did the grassy soil. One key factor in this was the high power of interception of the maquis cover. Indeed the data of throughfall collected in the 2012-2013 wet season below the maquis, albeit based on only three rain gauges, indicate that about 30% of annual rainfall evaporates before it reaches the soil. The thick stratum of non-decomposed litter from the marquis is also an additional store of intercepted water. Another reason (described in more detail in the Near surface hydrological processes discussion paragraph) was the efficient lateral soil drainage in the marquis soil. This resulted in most of the infiltrated water moving rapidly down the slope, without increasing the amount of water stored in the soil. By contrast, we believe that in the monitored wet seasons evapotranspiration had a negligible impact on the different soil water storage dynamics of the maquis and the grassed site. Potential evap-otranspiration in winter was, indeed, generally lower than <1 mm/day (Pirastru and Niedda, 2013), the vegetation completely covered the soil in both sites, and water uptake was not limited by soil water avail-ability. Thus there is no reason to believe that the evapotranspiration of the maquis and of the grass were completely different.
The different dynamics of the water depletion in the two soils in the spring and the summer of 2009 are a reflection of the different canopy architecture of the maquis and the grass. When compared to the grassy soil, in the maquis site the presence of tall plants and undergrowth increased the radiation interception, so that direct evap-oration of water from the soil was reduced. The xeromorphic adapta-tions of the leaves of the plants in the maquis to the semiarid Mediterranean climate, that have been studied by several authors in sites close our research area (Rotondi et al., 2003), also minimise water consumption during prolonged dry periods (Rotondi et al., 2003; Spano et al., 2009). These factors prevented the maquis soil from drying out intensively, as was not the case for the grassed soil.
We monitored the soil moisture in the two soils at different soil depth, so that we could analyse the progress of the wetting front and
Non
commercial
use
thus identify the primary processes involved in water infiltration. The rapid and simultaneous responses of the TDR probes at different soil depths during the intense rainfall of autumn 2009 suggest that pref-erential flow may have occurred during these events. During rainfall the low permeable soil matrix at the soil surface rapidly saturated, and so water was diverted into the vertical cracks. Hydrophobic con-ditions in the very dry organic soil surface may also have promoted infiltration through preferential paths at the end of the summer, as also described in Dekker and Ritsema (2000) and Nimmo (2012). The cracks conducted water downwards, until it reached the impeding layer, and the high interaction with the soil matrix rewetted the soil profile from the bottom upwards.
In the maquis site the TDR reactions were frequently simultaneous at two or three depths, although sometimes the deepest probe reacted before the others. Progressive top-down front propagation, which is characteristic of matrix flow, appeared to be an exception. Similar behavior was observed by Alaoui et al. (2011) and Jost et al. (2012) during intense artificial rainfall tests in forested soil. The increase in soil moisture was generally greater on the surface than at depth, but cases where the response of the deepest probe was more apparent than that of the intermediate probe were not rare. The heterogeneous distribution of the wetting front is characteristic of the activation of preferential paths in the soil. Because the previous water content never exceeded the field capacity, we hypothesise that this process may begin at the soil surface. The surface macropore system trans-ferred water down to the high permeable layers at the bottom of the profile. As the water travels down, interaction with the surrounding soil matrix caused the matrix to moisten, but, depending on drainage rate and local wall permeability, some water may escape, bypass the pores and reach the deepest soil layer.
Perched water table
Our research indicated that the change in land use altered the groundwater dynamics in the grassed site. The perched water table persisted throughout the monitoring period in the grassed site in the winter and spring 2009, which were seasons with below average rain-fall, while in the same periods the water table was only rarely observed below the maquis. However in the winter and spring of 2013 frequent short-lived and event based water table rises were observed in the maquis site, due to the above average rainfall. In fact, in the winter and spring of 2013 there were 490 mm of rain, compared to 270 mm for the same period in 2009. Moreover, in 2013 rain events were frequent, and this resulted in persistently high soil moisture levels. As a consequence, even modest water inputs were enough to saturate the lowest soil layers. Similar differences in piezometric responses were detected by Germer et al. (2010) in their comparative study of land under forest and pasture in the Amazon basin. They connected these differences to the worsening of the hydraulic properties of the soil after land use change. De Moraes et al. (2006) in the same con-text came to the same conclusion, but also claimed that the lower water uptake of grassland when compared to forests was part of the reason for this. Rockefeller et al. (2004) also detected an increased height and persistence in the water table in a deforested area, when compared to pasture. They attributed this to the larger interception and evaporation rate of the forest when compared to pasture. Schume et al. (2004) also found that canopy interception is an important source of the variations in the hydrological behavior of soils under different tree species during the growing season.
Near-surface hydrological processes
In the maquis site, analysis of the TDR probe responses at the var-ious soil depths suggested that rainfall mainly infiltrated vertically
through the preferential pathways, bypassing the soil matrix. The low vegetation cover and the thick litter stratum protect the soil surface and aggregates from the impact of raindrops, and this ensures the stability over time of the macropore system, with respect to surface sealing effects. All the Kfs values measured in the topsoil greatly
exceeded the maximum 5-min rainfall intensity (130 mm h–1)
record-ed in the years 2009-2013. Although the measurrecord-ed Kfs value may
underestimate surface infiltrability, this suggests that all the rain infiltrated, even during the most intense events. This agrees with the results of Germer (2010), Alaoui et al. (2011), Jost et al. (2012), Scherrer et al. (2007), which indicated that infiltration-excess is neg-ligible in forested soils.
At the start of the autumnal rainy season, in the grassed site soil cracks and some micro fauna burrows present in the soil surface allowed the intense rainfall to entirely infiltrate into the soil. Due to the medium soil depth, the empty soil porosity, and the still high soil water evaporation in this period, the rainfall did not saturate the soil completely. This prevented substantial runoff generation in this peri-od. This was evident during site surveys, but was also confirmed by the analysis of Niedda and Pirastru (2014), which found that the runoff coefficient computed at the Baratz catchment outlet was always less than 2% during the autumn. Their continuous simulation model, which ignores the infiltration-excess mechanism (Niedda, 2004; Niedda and Pirastru, 2013; Niedda and Pirastru, 2014) for runoff generation, effectively simulated the stream discharge in this catchment in the years 2009-2013. In the winter the expansion of the soil aggregates caused the surface cracks to close, and this reduced the permeability of the soil. However, on only one occasion did the 5-min rainfall intensities exceed the mean Kfsmeasured in the topsoil
in winter. Hence we conclude that even in the winter periods the infil-tration-excess was negligible in the grassed site.
Characterising the soil drainage mechanisms is crucial when attempting to identify how a hillslope responds to precipitation. On one hand, the subsurface flow is itself a source of significant runoff during stormflow, and on the other it substantially controls the fre-quency of soil saturation, by controlling the water storage capacity prior to the rain events. In the maquis site, unlike in the grassy site, the high volume of soil macropores guaranteed efficient vertical soil drainage during the infiltration tests and during natural rainfall events. Because deep percolation is prevented by the low-permeable substratum, the rapid lowering of the water table after the rain events suggests that the pore network in the maquis soil was also efficient in transmitting the subsurface flow down the slope. The living and decaying roots of the maquis also helped to improve the efficiency of subsurface flow in this soil. Observations in situ of the distribution of tree and bush roots indicated that the fine roots are abundant in the surface layers, and that many coarse roots develop in the deeper soil, spreading both laterally and vertically. This root structure contributes to creating a continuous and well interconnected network of biopores and pipes along the hillslope. The importance of tree roots in deter-mining the water flow dynamics of the soil was highlighted by Jost et al. (2012). They showed how different root structures resulted in dif-ferent soil moisture levels and runoff processes. In the maquis site the subsurface flow lowered the water table considerably, both prior to and during rain events, so that a great deal of water was needed to raise the water content until the entire soil profile was saturated. The canopy interception and the water retained by the thick litter on the soil surface created additional water storage, and also contributed to delaying the beginning of the perched water table. Hence the efficient drainage and high interception, in association with the high porosity of the natural soil, prevented the entire profile becoming saturated even in the times of the heaviest rainfall.
In the grassed site the persistence, for long periods, of high
mois-[page 184] [Journal of Agricultural Engineering 2014; XLV:428]
Non
commercial
use
ture levels and the perched water table indicates that there was water logging. This was due to the alteration in the soil structure caused by the land use change, which reduced the volume and continuity of the macropores. This is in line with the findings of Alaloui et al. (2011), who observed that, when compared to forested soils, macropores and biopores in grassland are less efficient in draining water. As a result, in the grassed site even small amounts of rainfall were enough to completely saturate the soil during the rain events. Because of the proximity of the water table to the soil surface in the wet periods, sat-urated areas spread quickly over the whole hillside during rain events. This is in agreement with the variable source areas (VSA) concept of Hewlett and Hibbert (1967). There were many similarities in the findings of McDaniel et al. (2008). They studied soil moisture and perched water table dynamics in a grassed catchment area with a shallow fragipan. They ascribed the formation of VSA in the catch-ment area to the spatial patterns of the impeding layer. In the area we studied, low-permeable sandstone is evenly present at the same depth in both the maquis and grassed sites. However, saturation of the entire soil profile only occurred in the grassed area, which indicates that the type of land use, rather than the presence of the shallow impeding layer, was primarily responsible for controlling this process.
Conclusions
This work compares the hydrological properties and the hydrologi-cal dynamics of a soil covered with Mediterranean maquis and an adjacent soil covered with spontaneous grass. The results of this investigation refer to the specific situation of the research site. The grassed plot was cleared of maquis 10 years ago and deep ploughed, and then unmanaged spontaneous grass grew on it. However, our results may provide some indications, in other similar Mediterranean environments, of the changes which may occur in the hydraulic prop-erties of the soil and in its hydrological processes when the natural vegetation is cleared.
In the grassed site, compared to the maquis site, there was a less amount of organic matter and the bulk density was increased. Soil compaction was ascribed to the decrease in the volume of the pores that are activated in the water tension range from –50 cm to soil water saturation. The seasonal susceptibility of the grassy soil to shrinking increased the vertical saturated hydraulic conductivity dur-ing the dry summer. Because these cracks conducted water downward in a similar way to the macropores of the maquis soil, measuring the saturated soil conductivity in dry soil conditions did not show com-pletely the influences of the different land uses on the hydraulic prop-erties of the soil. During the wet winter period the closing of the cracks decreased soil conductivity in the grassy soil, while the oppo-site happened to the soil under the maquis. As result, the effects of the land uses on the hydraulic conductivity of the soil were mainly evident in the wet season. Because seasonal changes in the soil structure may also substantially alter the hydraulic behaviour of the soil, the seasonal dynamics of the hydrological properties of the soil should be taken into account in the hydrological analysis. Ignoring these influences may result in misleading results being obtained by field surveys of hydraulic conductivity, as well in the models for sim-ulating the hydrological processes of the soil. The dynamics of soil moisture and the perched water table were different with different land uses. High soil moisture and a high water table persisted throughout the wet season in the grassed site. In the maquis site only short-lived, event based, perched water tables were observed. These differences were due to the high level of rain interception by maquis canopy, and the changes in infiltration, subsurface drainage and the
water storage processes in the grassy soil. Characterisation of the hydraulic properties of the soil allowed us to hypothesise on the pos-sible causes of these changes. The conductivity and retention data collected in the maquis site suggested that macropores are abundant in this soil, and govern the fast subsurface flow through it. The high organic matter content of this soil also ensured that the system remained stable over time. In the grassy area the laboratory and field data indicated that the macropores were destroyed. This resulted in inefficient soil drainage and the soil being saturated during rainy periods. Further research should be directed at characterising the hydrological response of soils at the hillslope-scale and during extreme precipitation, which is frequent in the Mediterranean envi-ronment. Creating an experimental template that includes artificial intense rainfall equipment, surface runoff and subsurface flow meas-urers might be useful for obtaining information about both hillslope-scale hydraulic conductivity and the hydrological response of the soils to extreme events. We intend to do this in future research.
References
Agnese C., Bagarello V., Baiamonte G., Iovino M. 2011. Comparing physical quality of forest and pasture soils in a Sicilian water-shed. Soil Sci. Soc. Am. J. 75:1958-70.
Alaoui A., Caduff U., Gerke H.H., Weingartner R. 2011. Preferential flow effects on infiltration and runoff in grassland and forest soils. Vadose Zone J. 10:367-77.
Angulo-Jaramillo R., Vandervaere J.P., Roulier S., Thony J.L., Gaudet J.P., Vauclin M. 2000. Field measurement of soil surface hydraulic properties by disc and ring infiltrometers: a review and recent developments. Soil Till. Res. 55:1-29.
Arya L.A. 2002. Wind and hot-air methods. In: J.H. Dane and G.C. Topp (eds.), Methods of soil analysis, Part 4: Physical methods. Soil Science Society of America, Madison, WI, USA, pp 916-926. Bagarello V., Baiamonte G., Castellini M., Di Prima S., Iovino M. 2014.
A comparison between the single ring pressure infiltrometer and simplified falling head techniques. Hydrol. Process. 28:4843-53. Bagarello V., Castellini M., Iovino M. 2005. Influence of the pressure
head sequence on the soil hydraulic conductivity determined with tension infiltrometer. Appl. Eng. Agric. 21:383-91.
Bagarello V., Castellini M., Iovino M., Sgroi A. 2010. Testing the con-centric-disk tension infiltrometer for field measurement of soil hydraulic conductivity. Geoderma 158:427-35.
Bormann H., Klaassen K. 2008. Seasonal and land use dependent vari-ability of soil hydraulic and soil hydrological properties of two German soils. Geoderma 145:295-302.
Buczko U., Bens O., Hüttl R. F. 2006. Water infiltration and hydropho-bicity in forest soils of a pine-beech transformation chronose-quence. J. Hydrol. 331:383-95.
Cantón Y., Solé-Benet A., De Vente J., Boix-Fayos C., Calvo-Cases A., Asensio C., Puigdefábregas J. 2011. A review of runoff generation and soil erosion across scales in semiarid south-eastern Spain. J. Arid Environ. 75:1254-61.
Castellini M., Niedda M., Pirastru M., Ventrella, D. 2014. Temporal changes of soil physical quality under two residue management systems. Soil Use Manage. 30:423-34.
Castellini M., Ventrella D. 2012. Impact of conventional and minimum tillage on soil hydraulic conductivity in typical cropping system in Southern Italy. Soil Till. Res. 124:47-56.
Celik I. 2005. Land-use effects on organic matter and physical proper-ties of soil in a southern Mediterranean highland of Turkey. Soil Till. Res. 83:270-7.
Non
commercial
use
[page 186] [Journal of Agricultural Engineering 2014; XLV:428] Costa M.H., Botta A., Cardille J.A. 2003. Effects of large-scale changes
in land cover on the discharge of the Tocantins Rivers, Southeastern Amazonia. J. Hydrol. 283:206-17.
Daraghmeh O.A., Jensen J.R., Petersen C.T. 2008. Near-saturated hydraulic properties in the surface layer of a sandy loam soil under conventional and reduced tillage. Soil Sci. Soc. Am. J. 72:1728-37.
Das Gupta S., Mohanty B.P., Köhne J.M. 2006. Soil hydraulic conduc-tivities and their spatial and temporal variations in a vertisol. Soil Sci. Soc. Am. J. 70:1872-881.
De Moraes J.M., Schuler A.E., Dunne T., Figueiredo R.D.O., Victoria R.L. 2006. Water storage and runoff processes in plinthic soils under forest and pasture in Eastern Amazonia. Hydrol. Process. 20:2509-26.
Dekker L.W., Ritsema C.J. 2000. Wetting patterns and moisture vari-ability in water repellent Dutch soils. J. Hydrol. 231:148-64. Elrick D.E., Reynolds W.D. 1992. Methods for analyzing constant-head
well permeameter data. Soil Sci. Soc. Am. J. 56:320-3.
Etana A., Larsbo M., Keller T., Arvidsson J., Schjønning P., Forkman J., Jarvis N. 2013. Persistent subsoil compaction and its effects on preferential flow patterns in a loamy till soil. Geoderma 192:430-6.
Evrendilek F., Celik I., Kilic S. 2004. Changes in soil organic carbon and other physical soil properties along adjacent Mediterranean forest, grassland, and cropland ecosystems in Turkey. J. Arid Environ. 59:743-52.
Fu B., Wang J., Chen L., Qiu Y. 2003. The effects of land use on soil moisture variation in the Danangou catchment of the Loess Plateau, China. Catena 54:197-213.
Gajić B. 2013. Physical properties and organic matter of Fluvisols under forest, grassland, and 100 years of conventional tillage. Geoderma 200-201:114-9.
Gallart F., Latron J., Llorens P., Rabadà D. 1997. Hydrological function-ing of Mediterranean mountain basins in Vallcebre, Catalonia: some challenges for hydrological modelling. Hydrol. Process. 11:1263-72.
Germer S., Neill C., Krusche A.V., Elsenbeer H. 2010. Influence of land-use change on near-surface hydrological processes: undis-turbed forest to pasture. J. Hydrol. 380:473-80.
Gonzalez-Sosa E., Braud I., Dehotin J., Lassabatère L., Angulo-Jaramillo R., Lagouy M., Branger F.C., Jacqueminet Kermadi S., Michel K. 2010. Impact of land use on the hydraulic properties of the topsoil in a small French catchment. Hydrol. Process. 24:2382-99.
Hassler S.K., Zimmermann B., van Breugel M., Hall J.S., Elsenbeer H. 2010. Recovery of saturated hydraulic conductivity under second-ary succession on former pasture in the humid tropics. Forest Ecol. Manag. 261:1634-42.
Hewlett J.D., Hibbert A.R. 1967. Factors affecting the response of small watershed to precipitation in humid areas. In: W.E. Sopper and H.W. Lull. (eds.), International Symposium of Forest Hydrology, Pergamon Press, Oxford, UK, pp 275-290.
Hu W., Shao M.A., Si B.C. 2012. Seasonal changes in surface bulk den-sity and saturated hydraulic conductivity of natural landscapes. Eur. J. Soil Sci. 63:820-30.
Iovino M., Castellini M., Bagarello V., Giordano G. 2013. Using static and dynamic indicators to evaluate soil physical quality in a Sicilian area. Land Degrad. Dev. [In press].
Jost G., Schume H., Hager H., Markart G., Kohl B. 2012. A hillslope scale comparison of tree species influence on soil moisture dynamics and runoff processes during intense rainfall. J. Hydrol. 420:112-24.
Lee D.M., Elrick D., Reynolds W., Clothier B.E. 1985. A comparison of
three field methods for measuring saturated hydraulic conductiv-ity. Can. J. Soil Sci. 65:563-73.
Llorens P., Domingo F. 2007. Rainfall partitioning by vegetation under Mediterranean conditions. A review of studies in Europe. J. Hydrol. 335:37-54.
Martinez L.J., Zink J.A. 2004. Temporal variation of soil compaction and deterioration of soil quality in pasture areas of Columbian Amazonia. Soil Till. Res. 75:3-18.
McDaniel P.A., Regan M.P., Brooks E., Boll J., Barndt S., Falen A., Young S.K., Hammel J.E. 2008. Linking fragipans, perched water tables, and catchment-scale hydrological processes. Catena 73:166-73.
Messing I., Jarvis N.J. 1993. Temporal variation in the hydraulic con-ductivity of a tilled clay soil as measured by tension infiltrome-ters. J. Soil Sci. 44:11-24.
Mollnau C., Newton M., Stringham T. 2014. Soil water dynamics and water use in a western juniper (Juniperus occidentalis) wood-land. J. Arid Environ. 102:117-26.
Niedda M. 2004. Upscaling hydraulic conductivity by means of entropy of terrain curvature representation. Water Resour. Res. 40:W04206.
Niedda M., Pirastru M. 2013. Hydrological processes of a closed catch-ment-lake system in a semi-arid Mediterranean environment. Hydrol. Process. 27:3617-26.
Niedda M., Pirastru M. 2014. Field investigation and modelling of cou-pled stream discharge and shallow water-table dynamics in a small Mediterranean catchment (Sardinia). Hydrol. Process. 28:5423-35.
Niedda M., Pirastru M., Castellini M., Giadrossich F. 2014. Simulating the hydrological response of a closed catchment-lake system to recent climate and land-use changes in semi-arid Mediterranean environment. J. Hydrol. 517:732-45.
Nimmo J.R. 2012. Preferential flow occurs in unsaturated conditions. Hydrol. Process. 26:786-9.
Piňol J., Beven K., Freer J. 1997. Modelling the hydrological response of Mediterranean catchments, Prades, Catalonia. The use of dis-tributed models as aids to hypothesis formulation. Hydrol. Process. 11:1287-306.
Pirastru M., Niedda M. 2010. Field monitoring and dual permeability modelling of water flow through unsaturated calcareous rocks. J. Hydrol. 392:40-53.
Pirastru M., Niedda M. 2013. Evaluation of the soil water balance in an alluvial floodplain with a shallow groundwater table. Hydrolog. Sci. J. 58:898-912.
Price K., Jackson C.R., Parker A.J. 2010. Variation of surficial soil hydraulic properties across land uses in the southern Blue Ridge Mountains, North Carolina, USA. J. Hydrol. 383:256-68.
Reynolds W.D., Elrick D.E. 1991. Determination of hydraulic conduc-tivity using a tension infiltrometer. Soil Sci. Soc. Am. J. 55:633-9. Reynolds W.D., Elrick D.E. 2002. Pressure infiltrometer. In: J.H. Dane and G.C. Topp (eds.), Methods of soil analysis, Part 4: Physical methods. Soil Science Society of America, Madison, WI, USA, pp 826-836.
Reynolds W.D., Elrick D.E., Youngs E.G. 2002. Ring or cylinder infil-trometers (vadose zone). In: J.H. Dane and G.C. Topp (eds.), Methods of soil analysis, Part 4: Physical methods. Soil Science Society of America, Madison, WI, USA, pp 818-820.
Rockefeller S.L., McDaniel P.A., Falen A.L. 2004. Perched water table responses to forest clearing in northern Idaho. Soil Sci. Soc. Am. J. 68:168-74.
Rotondi A., Rossi F., Asunis C., Cesaraccio C. 2003. Leaf xeromorphic adaptations of some plants of a coastal Mediterranean macchia ecosystem. J. Mediterr. Ecol. 4:25-36.