(Cinque Terre) during the 19th century
G I A N P I E T R O G A S P A R I N IIndependent Researcher
(Cinque Terre) during the 19th century
G I A N P I E T R O G A S P A R I N I Independent Researcher SIDeS, «Popolazione e Storia»,Reproductive change in Riomaggiore
(Cinque Terre) during the 19th century
*GIAN PIETRO GASPARINI Independent Researcher 1. Introduction
A central feature of recent demographic evolution is the demographic transition, which corresponds to the shift from a high fertility and high mortality regime to a regime where both are low. Major changes in fertility and mortality have coincided with the transformation of the traditional society, dominated by agriculture, into an urban and industrial society: due to the complex socio-economic conditions and the different historical and demographic contexts (Livi Bacci 1977), it may be necessary to broaden its investigation to a wide variety of situations.
An extensive literature (Coale 1973; Coale, Watkins 1986; Galloway 1988) has attempted to assess how much the fertility transition can be correlated to a process of adaptation of the couple's reproductive behaviour in response to a changing environment: the industrial revolution but also the spread of social innovation and social influence (Spolaore, Wackziarg 2016). However, its understanding remains difficult, because economic, technological and social changes are closely interlinked and assessing the role of a given change is not an easy task (Guinanne 2011).
Fertility control has often been equated with a parity-specific limitation, which means that couples change their reproductive behaviour in order to achieve a certain family size. Coale (1986) states that parity-related limitation of marital fertility in Europe, although rare, was not completely absent before the sustained modern reduction in fertility began, while Livi Bacci (1986) provides an overview of parity-related restriction of fertility that occurred in different situations and conditions: elite groups, but also rural and urban communities.
Moreover, the focus of the debate on the nature of the limitation of fertility within marriage is the extent to which it is the result of stopping or spacing behaviour. It has been stated that stopping was the main mechanism for achieving a reduction in fertility, especially in the early stages of demographic
*
The author wishes to thank the parish priest of Riomaggiore, don Giordano Biso, for his kindness in allowing the consultation of the parish archives, and Catherine Bonanini for her valuable contribution in improving the English of the paper.
transition (Knodel 1988), while spacing strategies, already present with a minor role (Anderton, Bean 1985; Livi Bacci 1986; Van Bavel 2004), became more important in the more advanced phases of the transition (Reher, Sanz-Gimeno 2007). The survey on the links between child mortality and economic stress between 1700 and 1900 in Germany (Amialchuk, Demitrova 2012) highlighted that non-parity-specific birth control existed even before the demographic transition and stressed the importance of seeing the demographic transition as a gradual evolution of voluntary fertility control methods. The demographic transition was also defined as a shift from societal-level to individual-level regulation of fertility (Wrigley 1978)1.
Regarding Italy, several studies (e.g. Livi Bacci 1977; Fornasin, Manfredini 1989; Breschi et al. 1994; Breschi et al. 2000; Del Panta et al. 2002; Ge Rondi et
al. 2008; Breschi et al. 2014) confirmed that the times of transition have been
remarkably different along the Italian peninsula, especially between the northern and southern regions. But important differences were also observed within the same regional area.
This paper aims to add some knowledge to the transition process applying the micro-level approach to a village on the eastern coast of Liguria. The period is particularly interesting because it corresponds to a time when eastern Liguria was involved into a great industrial transformation and the intent is to verify how this event may have influenced the demographic conditions and more specifically the evolution of fertility. After describing the main characteristics of the area and the data sources, the paper begins to deal with marriage and marital reproduction. The maternal age, birth parity and birth interval are examined, while the replacement effect related to the interplay between infant and child mortality and the reproductive behavior is investigated.
2. Study area
The beginning of the demographic transition in Liguria can be dated around 1870, but Liguria was characterized by a low level of fertility even before the presence of a fertility control (Livi Bacci 1977). Its territory, narrow and rough, always had a great relevance in the shape of families and their demographic dynamics2. The nineteenth century was crucial for Liguria, which experienced a
great economic and industrial development, first in Genova (around the middle of the century) and then in many coastal areas (Giacchero 1970). Liguria was initially affected by a large flow of people from rural vicinities to urban centers, while in the last decades of the nineteenth century Ligurian cities, thanks to their industrial and economic growth, attracted workers from other regions. The result was an extensive urbanization, much more evident than in other Italian regions (Arvati 2007). Women living in urban centers, often characterized by lower fertility, became the largest fraction of the female reproductive population, lowering the average fertility of the region (Felloni 1961), although within the region there were still considerable disparities3.
The demographic evolution of Liguria during the nineteenth century shows a decrease in birth and mortality rates, but it was observed (Felloni 1961) that the decline in the birth rate preceded, not followed, that of mortality: the beginning of the decline in the birth rate can be dated around 1862-1866, while that of mortality at least ten years later and especially from the end of the eighties onwards. The delay in reducing mortality is also due to cholera episodes, which affected the entire region, and in particular the territory of La Spezia, where the exceptional and sudden increase in urban population in the second half of the century produced considerable obstacles in ensuring the necessary hygienic and housing conditions4.
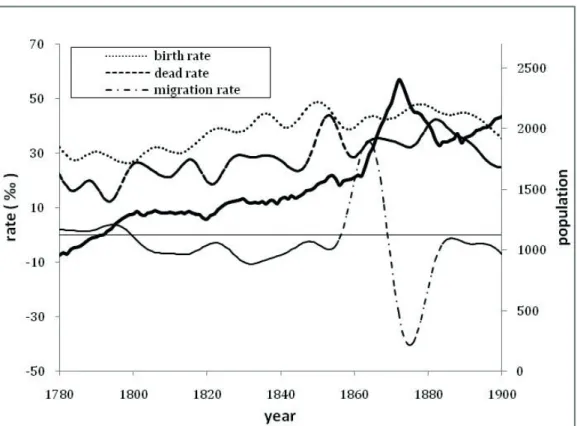
Riomaggiore is a village located along the eastern Ligurian coast but, despite its proximity to the sea, it was mainly characterized by agriculture: small vineyards in a steep territory able to provide only a modest income. An earlier work (Gasparini 2016) described the demographic evolution of Riomaggiore between the second half of the seventeenth century and the first half of the twentieth century, using aggregate demographic data. The population, about 1000 inhabitants in the last decade of the eighteenth century, increased significantly to reach about 2200 inhabitants at the end of the nineteenth century (fig. 1).
Fig. 1. Demographic parameter overview
Source: Our elaboration from Gasparini (2016).
The most important changes were observed in the second half of the 19th century, when the population became more dynamic and subject to a major demographic renewal (both birth and death rates reached their maxima) (Gasparini, 2016). The birth rate increased from a mean of 32.7‰ in the first half of the 19th century to a mean of 42.0‰ in the second half, but the mortality rate also increased from 23.1‰ to 31.7‰ (Several cholera episodes interested the village: the most severe was during the 1881 when the crude dead rate reached 74‰). Successively, we observe a progressive decrease of birth rate, followed by the dead rate decrease few years later (fig. 1).
That period corresponds to the first phase of industrialization in the Ligurian region and more specifically on its eastern border: the construction of a railway line along the coast has allowed Riomaggiore and other coastal villages to be connected with the industrial area of La Spezia (Redoano Coppedè 1985). La Spezia and several surrounding villages have been subjected to a great immigration. Riomaggiore was also interested in that flow, especially during the railway construction period (in the years 1860-70 the net migration rate was about 24‰): the village became very crowded and the already precarious health conditions worsened significantly. This led to a remarkable decline in life expectancy e0, which decreased from an average of 38.4 years in the first half of
the century to 30.0 years in the second half (Gasparini 2016).
As observed in other areas under urban influence (Breschi et al. 2009), since the last decades of the nineteenth century urban effects have become increasingly important for the community of Riomaggiore. For this reason, it may be of some interest to examine the characteristics and evolution of fertility at Riomaggiore during the 19th century, in order to verify the presence of a first signal of demographic transition. The analysis draws most of its evidence from family behaviour and compares two cohorts of marriages related to two different periods: the period 1795-1859, assumed as representative of the pre-transitional fertility condition, and the second 1860-1895 which corresponds to the establishing of industry in eastern Liguria, widely considered a determining factor in triggering the decline of fertility and parity-specific birth control.
3. Data and sources
The demographic data used in this study are extracted from parish registers of baptisms (APR1), burials (APR2) and marriages (APR3) to which the family reconstitution technique was applied: all nominal data reported in the parish records have been digitized and standard cross-checking procedures have been carried out to reconstitute individual biographies in order to allow the computation of key demographic parameters. The cross-checking procedures have also permitted to verify the data consistency in the different registers.
Using a cohort approach, our statistical analyses start from the date of the first marriage of couples and follow the reproductive history of married women up to the age of 49 years. The female population married between 1795 and
1895 was considered, tracing the reproductive histories up to 1925 (for the most recent marriage cohorts: 1890-95).
For the purpose of our analysis, we selected couples whose reproductive duration could be established or where the end of the reproductive history of marriage could be ascertained. Considering the births recorded in the baptism registers, we have information of 1395 marriages, but only 1140 of them are present in the marriage registers, corresponding to the 82% of the total5.
Starting from those numbers, the first marriages are 1038 and fully reconstituted are 820 (reconstitution efficiency 79% of the first marriages), while those with complete fertility are 546 (66% of the first marriages found in the parish registers). The analyses developed in the following paragraphs consider only the first marriages with complete fertility. They concern those families in which the couple remains in an intact union until the wife reaches the end of the reproductive age span: the women that can be followed during their entire reproductive history, from marriage until menopause. Our analysis therefore includes: a) marriages where the date of death of both spouses is known; b) marriages where the date of death of one or both spouses was/were unknown but it was possible to reconstitute the reproductive history up until the end of the fertile period (woman aged 50 and over). The choice of complete fertility marriages means to favour the residential family and to exclude the others. But that’s exactly what we are looking for, because our goal is to study whether and how residential families, present in their territory for a long time, have been able to change their reproductive habits.
As described above, the period under review is undergoing major changes which seem particularly suitable for verifying possible evidences supporting the demographic transition. The aim is to apply the standard procedures concerning marriage and marital reproduction (Knodel 1988) to the reconstituted family to assess changes in fertility (in particular its decrease) during the period under review, and to identify the main drivers for such changes. Considering that we are able to date (after 1860) the beginning of industrialization in the area under investigation, the marriages examined were divided into two cohorts (1795-1859 and 1860-1895) to verify whether significant changes in fertility occurred in the second cohort in relation to the beginning of the fertility transition. Special attention has been paid to child mortality, a key parameter for understanding these processes. Finally a multivariate approach, through a Cox regression model, has allowed to have some insights on how the childbirth interval can depend by relevant demographic parameters (mother age, birth parity, child mortality) used as covariates.
Due to the scanty information, it was not possible to analyze socio-professional differentials: the aggregated data indicate that employment in agriculture was largely prevalent, together with a number of seamen and/or fishermen (Gasparini 2004) but, in the second half of the 19th century, new jobs created by industry have to be considered6.
4. Marriage
Marriage is a central feature of a demographic regime because, especially in the context of natural fertility, nuptiality was the primary regulator of fertility and nuptiality patterns had important consequences for moderating population growth (Knodel 1988).
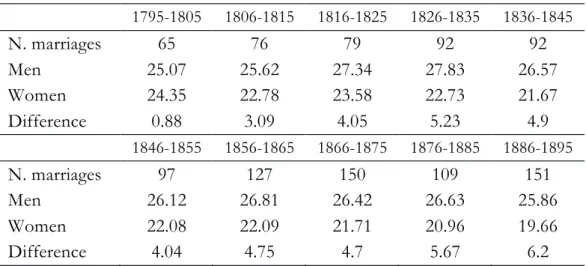
Two important parameters, able to influence fertility, are the age at first marriage and the percentage of celibacy. Table 1 shows the age at first marriage of men and women for cohorts of ten years, together with the corresponding age difference. A broadly stable age of man can be observed, while the age of the woman shows a considerable decrease in correspondence with the last observed cohorts. The different trends are evident in the age difference which, very small at the beginning of the nineteenth century, for the last cohort (1886-1895) is over 6 years.
Tab. 1. Number of marriages, mean age at first marriage of men and women by 10 year
marriage cohorts 1795-1805 1806-1815 1816-1825 1826-1835 1836-1845 N. marriages 65 76 79 92 92 Men 25.07 25.62 27.34 27.83 26.57 Women 24.35 22.78 23.58 22.73 21.67 Difference 0.88 3.09 4.05 5.23 4.9 1846-1855 1856-1865 1866-1875 1876-1885 1886-1895 N. marriages 97 127 150 109 151 Men 26.12 26.81 26.42 26.63 25.86 Women 22.08 22.09 21.71 20.96 19.66 Difference 4.04 4.75 4.7 5.67 6.2
Age at marriage is an important factor able to influence fertility, because the family size is the result of a cumulative process, closely related to the number of years the couple is exposed to the risk of childbearing. For this reason, the distribution in age groups to marriage is also important. Table 2 examines the distribution in two different cohorts (1795-1859 and 1860-1895). For women the prevailing age group is always 20-24, but for the second cohort its percentage increases considerably as well as that of the 19 age group (the 15-24 age interval moves from 59% to 75.4% of the total). In contrast, the third group (25-30 years old) falls from 28.9% to 19.5%. The prevailing age group of men is 25-29 years, which in the second cohort reached 46.5%.
In the transition from the first to the second cohort, the tendency of men is to concentrate the marriages in the interval of age 25-34, to which corresponds a decrease in all the other age groups, in particular the younger ones. In
summary, passing from the first cohort to the second, while women move to younger ages, men follow the opposite trend.
Tab. 2. Distribution (%) of age at first marriage by age class
Age 15-19 20-24 25-29 30-34 35-39 40-44 45-49 >=50 1795-1859 (N=337) Men 3.0 22.2 39.4 22.2 8.0 3.2 1.0 1.0 Women 6.5 52.5 28.9 7.0 2.7 1.3 0.8 0.4 1859-1895 (N=209) Men 1.0 18.9 46.5 23.4 8.3 1.2 0.4 0.2 Women 11.0 64.4 19.5 3.3 1.0 0.8 --- ---
Information concerning definitive celibacy may be derived from the burial records. The percentage of people who have never married can be estimated indirectly if the data on marital status at dead are regularly recorded in parish registers. In this case, the proportion indicated as single among persons dying over a certain age (after which a marriage rarely occurs) can be an approximate measure of permanent celibacy (Knodel 1988). Table 3 shows the percentage of unmarried women and men aged 50 and over by contemporary cohorts of 25 years7.
Table. 3. Percentage of celibacy by 25 year birth cohorts
Cohort 1770-1794 1795-1819 1820-1844 1845-1869 1870-1894
Women % 10.2 5.5 7.0 2.7 8.3
Men % --- 22.5 13.1 11.7 8.8
During the examined periods, female celibacy tends to be low, reaching very reduced percentages for 1845-1869 birth’s cohort. The very easy access to marriage for that cohort can be explained by considering that the most likely period of marriage (when females are 20-25 years old) includes years of intense immigration (fig. 1): marriages with a foreign husband rose from 10% in the period 1845-1865 to 26% in the period 1865-1885.
This result can be seen as an important opening signal of the resident community towards the outside. A decreasing trend is also present for male celibacy. Therefore, moving along the nineteenth century, and especially in its second half, in addition to a decrease in age at the first marriage of women, we have the decline of celibacy, a further factor in favor of the increase of marital fertility8.
5. Marital fertility
The marital fertility, component of the total fertility, is the proper focus of this study and the key aspect of the general level of fertility during the entire period of observation. As a measure of marital fertility levels and trends, the age-standardized index Ig has been adopted (Livi Bacci 1977) and estimated along
the examined period. Its evolution (fig. 2) shows an almost regular and mild decrease until the ‘60s, followed by a sudden acceleration of its downward trend, which suggests a change in fertility regime.
Fig. 2. Age-standardized index of marital fertility (Ig)
Source: Our elaboration from parish registers and from Livi Bacci (1977).
Further information on a possible presence of fertility control can be obtained by examining the evolution of the start, end and duration of reproductive period (fig. 3): the age at the first birth decreases from 25 years for the cohort at the end of the 18th century to 23 years for the middle 19th century cohort and at the age of 22 for the last observed cohort; the age at the last birth, stable until the 1836-45 marriage cohort, declines from a mean age of 40 to just over 35 years for the last cohort; the overall duration of reproduction (length of reproduction period), after an increase for cohorts in the first half of the 19th century, begins to decrease by reducing the duration from 20 to 16 years.
Let us now examine the age of the mother at the last birth because it is a measure that reflects the changing pattern of childbearing and is particularly sensitive to family limitation: in populations where family limitation is common, women bear their last child at an early age. Table 4 shows how this age is distributed between the different age groups at marriage (for both the two cohorts of marriage considered: before and after 1860). In the same table we have the corresponding mean number of children ever born for each age group.
Fig. 3. Start, end, duration of reproductive period by 10 year marriage cohorts
Tab. 4. Age of mother at last birth and number of children ever born
Age at marriage
1795-1859 1860-1895 Age Children Age children 15-19 40.3 8.7 36.8 7.1 20-24 40.5 7.5 37.7 6.5 25-29 42.2 5.9 39.7 5.4 30-34 42.7 4.6 41.3 2.0 35-39 41.6 1.5 40.1 1.0
For the first marriage cohort the age of the mother at last birth is always close to 40 years, evidencing a good exploitation of reproductive capability of that cohort. As regards the latter, both the age of the mother and the number of children are significantly reduced. The difference is more evident in the two younger age groups, suggesting the presence of a stopping control of fertility. This result is particularly important because the first two groups represent the highest concentration of marriage age (tab. 2) and marital fertility level (as will
be shown later). For subsequent marriage age groups, the age at last birth is even smaller, but the reproduction interval is probably too short to evaluate a stopping action.
Along with the stopping behavior, it is also important to know how the fertility changes in relation to birth spacing. The longitudinal evolution of birth intervals (fig. 4) shows that, for all marriage cohorts along the 19th century, intervals are fairly stable, suggesting that all cohorts have maintained almost the same spacing behaviour along the examined period: only the last cohort seems to suggest upward trends.
Fig. 4. Birth interval (in months) by 10 year marriage cohorts
It is also possible within a certain approximation to estimate the relevance of stopping and spacing components on changes in the average number of births over time (Knodel 1988). The average completed fertility of a group of married women can be expressed as a simple function of their starting, spacing and stopping behavior. Ignoring women who are childless, the average number of births of women who have at least one birth (C) can be calculated by dividing the duration time between the mean age at last birth (L) and the mean age at first birth (F) by the duration of the average inter-birth interval (I) and adding one to this result9.
Assuming the marriage cohort 1795-1859 as a reference, the subsequent cohort 1860-1895 shows a 4.5% reduction of age at first birth, a 6.9% reduction of age at last birth, a 1.6% increase of the birth interval, while the total number of births decreases by 10%. The reduction of age at first birth, extending the fertility period, acts to increase fertility; on the contrary, the age reduction at last birth (representative of stopping) acts to reduce it; the same effect has the increase of birth spacing. Finally, the decrease in the number of births suggests that stopping and spacing are able to determine the reduction of childbirths, despite the opposite effect produced by the lower age at the first birth.
Therefore, during the first phase of demographic transition, both stopping and spacing act to reduce fertility, with the stopping probably playing the major role.
6. Age-specific marital fertility
The most familiar approach to fertility measurement is to use age-specific marital fertility rates, which measure the total of legitimate births occurring to married women in a given age group to total of woman-years lived by such women in that group. Longitudinal trends of each age group are presented in figure 5 for married couples between 1795 and 1895, grouped in 10-year marriage cohorts (The first marriage group (15-19 years) is not shown, due to the reduced number of events in some period).
The results by age groups indicate distinct behaviors: a weakly oscillating fertility among younger women and a decreasing fertility among older women. The latter trend suggests a progressive practice of deliberate family limitation, which is expected to have a major impact in older age. It is generally assumed that deliberate limitation of fertility is less likely at a younger age, as the process of family building is still at an early stage but, after the cohort 1856-65, a decrease in fertility is present in all age groups.
Examining the two periods, 1795-1859 and 1860-1895, table 5 shows the mean values of the age-specific marital fertility rates for the corresponding marital cohorts: the first cohort exploits better the reproductive intervals up to the highest ages than the second, whose fertility decreases more rapidly with age (the second cohort usually reaches a high fertility rate in correspondence of the first childbirth age groups, followed by a subsequent fertility drop off).
It is known from literature (Wrigley et al. 1997) that fertility at a certain age is lower among women who have been married for a long time than those who have recently married. This effect, evident for both cohorts (as shown by the rate increase moving down in each column), is significantly more pronounced for the second cohort in agreement with the reduced fertility observed for that cohort. A confirmation of the lower fertility of the 1860-1895 cohort is given by considering the total marital fertility (TMFR) by marriage age group (last column in table 5), which shows lower values for that cohort.
Fig. 5. Age specific marital fertility rates by 10 year marriage cohorts
Of particular interest are the age-specific mean values of marital fertility rate (table 5, last row for each cohort), because they may be compared with the Coale and Trussell (1974) standard age-specific schedule of natural marital fertility (fig. 6). As noted above, the first marriage cohort should represent the conditions preceding the onset of fertility decline: despite significant differences in fertility levels, the curve shows a convex shape in line with the standard natural fertility schedule, but characterized by a slower decline in fertility at more advanced ages. Conversely, the second cohort, when compared with the natural fertility, has a reduced convexity with prominent fertility in the first age group and a lower fertility in the subsequent groups, highlighting two contrasting trends: while fertility in the younger groups prevails over natural values, in the older are natural values that prevail, suggesting the existence of a fertility control at older ages, which seems to support the stopping behavior. Tab. 5. Age Specific Marital fertility rates (per 1000 woman-years lived)
Tab. 5. Age Specific Marital fertility rates (per 1000 woman-years lived) Marital cohort 1795-1859 Age at marriage Childbirth age TMFR 15-19 20-24 25-29 30-34 35-39 40-44 45-49 15-19 400 404 374 363 332 201 22 9.0 20-24 451 388 361 319 198 26 7.9 25-29 476 357 302 165 50 6.0 30-34 369 383 269 127 4.7 35-39 348 120 ---- 1.5 Total 15-39 400 441 389 365 330 197 35 Marital cohort 1860-1895 Age at marriage Childbirth age TMFR 15-19 20-24 25-29 30-34 35-39 40-44 45-49 15-19 528 373 349 297 245 105 13 7.7 20-24 472 388 340 265 125 10 7.1 25-29 515 355 318 140 30 5.8 30-34 174 200 128 --- 2.0 35-39 308 95 --- 1.1 Total 15-39 528 421 384 325 264 120 13
A measure frequently used to test the relevance of deliberate family limitation is the computation of the Coale and Trussell indices m and M through a least-square regression procedure10. The obtained values for the two
distinct marriage cohorts are m = -0.25 and M = 0.86 for the first cohort and m = 0.26 and M = 0.97 for the second (The regression is statistically significant at
p < 0.05). The negative value of m for the first cohort is probably influenced by fertility higher than the natural fertility of the older age groups11 (fig. 6), while
the m value of the second cohort envisages the onset of a fertility control. As for M, it can be observed that the higher value of M for the second cohort could reflect the high level of marital fertility among younger women (table 5) of that marriage cohort (Knodel 1988).
Fig. 6. Age-specific marital fertility rates
Source: Our elaboration from parish registers and from Coale, Trussell (1974).
The reproductive behavior can also be directly related to parity by the parity progression ratio, defined as the proportion of women at a particular parity who move to the next higher parity. Table 6, which considers the probabilities for ‘complete’ family (our survey only considers ‘complete’ families), evidences that the parity ratios of the second cohort (1860-1895) are lower than those of the first cohort, with an increasing difference moving from the lowest to the highest parities.
Tab. 6. Parity progression ratio of ‘complete’ families
Marriage Parity
cohort 1-2 2-3 3-4 4-5 5-6 6-7 7-8 8-9
1795-1859 0.94 0.93 0.93 0.9 0.89 0.82 0.73 0.67 1860-1895 0.93 0.88 0.87 0.8 0.76 0.7 0.62 0.39
7. Infant and child mortality
Our fertility survey has not so far considered the effect of infant and child mortality, while mortality levels have great consequences for family-building because there may be considerable differences between fertility and the number of children actually raised (van Poppel et al. 2012).
A characteristic of our community is the high mortality with the concentration of deaths especially in the first years of life (Gasparini 2016): although mortality rates had already been relevant in the first half of the 19th century, they increased in the 1850s and reached their highest levels in the period 1876-1885 (table 7).
In the second half of the 19th century, together with a remarkable population increase (fig. 1), repeated cholera epidemics severely affected the community. The period 1870-90 was particularly plagued, with three acute episodes (in 1872-73, 1881 and 1887) when the crude dead rate exceeded 70‰.
Tab. 7. Infant and child mortality rates(‰)
Age
Period < 1 year < 5 years
1795-1805 266 484 1806-1815 167 344 1816-1825 126 310 1826-1835 178 409 1836-1845 166 353 1846-1855 210 453 1856-1865 223 478 1866-1875 237 457 1876-1885 237 534 1886-1895 216 417
Figure 7 depicts three characters of the reproductive process: children ever born, the total number of children surviving up to five years and the number of deaths before that age, all grouped in marriage cohorts of 10 years. After a slight increase in the first half of the 19th century, starting with the cohort 1856-65, there is an almost continuous decline in the number of children ever born, which falls from about 7.6 to 6, while children surviving until the age of 5 decrease after the 1846-55 cohort. The number of children who dies before their fifth birthday is around 2 until the marriage cohort 1816-25 when it begins to increase and reaches the highest value (3.7) at the cohort 1856-65 (when about half of all children dies before the fifth birthday). A subsequent dead reduction is then evidenced.
Fig. 7. Indicators of reproduction by 10 year marriage cohorts
It was observed (Amialchuk, Demitrova 2012) that while a high level of child mortality usually impedes, if not prevents, efforts to reduce the number of children born or to cease childbearing at an early stage or at given parity, but it does not look what happens in our situation. The decreasing trend of the surviving children does not seem to influence the evolution of children ever born, which shows no tendency to increase, but on the contrary begins to decrease. An explanation can be given by the exceptional situation following the repeated cholera epidemics, mainly due to degraded environmental conditions (Scaramuccia 2007), as a consequence of the sudden and remarkable demographic increase of La Spezia and surroundings. The epidemic events act as short-term perturbations of the fertility decline (a slower process consequent to deep economic and social changes), but without altering its trend.
8. Birth interval analysis
The previous results permitted to detect the presence of fertility control and to locate its first phase in the second half of the 19th century. After describing fertility trends, we now move on to multivariate analyses to deepen our understanding of previous findings. Event history methods are applied to estimate the respective risks of having a child, while taking into account simultaneously a number of bio-demographic factors that are known to have varied throughout the examined period. We apply a Cox hazard model using the time since previous birth (starting from the second birth) as the duration variable. In order to account the absence of birth, we censored the last open interval at eight years12. The aim is to detect basic effects on the duration of the
1
prevailing control mechanism, the intent of the model is also to better assess the possible role of birth spacing. In addition, an important aspect that we intend to examine is the interplay between infant and child mortality and reproductive behavior.
The following reduced number of covariates is considered with the aim of evaluating the impact of the selected determinants on birth intervals: mother’s age, included in the form of 5-year age categories to control differences in the risk of childbirth and fecundity at different ages; mother’s age at the time of marriage (3-year age categories), to assess whether and how far later ages can shorten childbirth intervals; the number of children ever born, which reflects fecundity and breastfeeding habits among families (Knodel 1988); survival status of the previous child (three categories), because it is a very important determinant of the interval extent. The death of an infant interrupts breastfeeding, shortening the postpartum amenorrhea.
Table 8 provides information on the distribution of all covariates together with the model results for the two marital cohorts (1795-1859 and 1860-1895), which can be considered representative of pre-transition and onset of transition.
The comparison of the coefficients between the two cohorts reveals differences and similarities. Estimates of the mother's age evidence for both cohorts that the risk of another birth decreases with mother’s age and is consistent with the expectation that women approaching the end of their reproductive years have longer birth intervals. However, for the second cohort, there is a marked interval reduction in correspondence with the first age group (for the first cohort, the influence of the first group on birth interval is not significant). This acceleration is in line with the character of demographic transition, which leads to ever shorter birth intervals, as women tend to bear all their children at an early age. As regards the older age groups, similar trends can be observed for both cohorts.
Considering the age at marriage we have, for both cohorts, that the intervals are extended when woman’s age is lower and shortened when the age is higher. But, for the second cohort, the interval reduction is smaller when her reproductive period is longer and greater when her reproductive period is shorter.
If we now look at the children ever born, we must expect a negative association between the number of childbirths and birth intervals, because a high parity can be seen as an indicator of high fecundity (van Bavel, Kok 2004): the more births a woman already has, the shorter the birth intervals will be. When comparing the two marriage cohorts, the obtained values, considering the associated error, are not significantly different.
A crucial factor is the death of the lastborn child. It is known that when a child dies early (we consider children under two years of age), the next child is conceived much faster because of the shortening of the postpartum
amenorrhea period. We can see this effect in both cohorts, but the replacements of the second cohort take place at intervals longer than the first. Tab. 8. Cox proportional hazard estimates of birth spacing for complete marriage, second
and higher-order births
1795-1859 1860-1895
mean ecoeff (secoeff) mean ecoeff (secoeff)
Covariates Mother’s age <20 year 1.10 1.290 (0.255) 1.89 3.648*** (0.691) 20-24 13.13 Ref. 17.82 Ref. 25-29 24.09 0.426*** (0.032) 27.53 0.517*** (0.041) 30-34 25.99 0.222*** (0.019) 25.16 0.243*** (0.024) 35-39 33.99 0.085*** (0.098) 26.41 0.073*** (0.009) >39 1.70 0.010*** (0.002) 1.18 0.011*** (0.026) Crude legitimate parity 4.76 1.264*** (0.018) 4.41 1.314*** (0.023) Woman age at marriage <20 38.16 0.748*** (0.036) 45.78 0.621*** (0.035) 20-25 46.19 Ref. 44.91 Ref. >25 15.65 2.005*** (0.137) 9.31 2.352*** (0.233)
Life status of the previous child
Alive 70.74 Ref. 68.72 Ref.
Dead <2 year old 26.14 2.166*** (0.101) 19.80 1.780*** (0.099)
Dead >=2 3.11 0.447*** (0.073) 11.47 0.502 *** (0.080)
Dependent variable
Interval between births 23.23 (13.54) 23.95 (15.18) (mean and sd in months)
Number of births 2,536 1,689
Note: Significance levels: * p < 0.10; ** p < 0.05; *** p < 0.01.
These results seem relevant, because the marked increase in infant and child mortality in the second half of the 19th century (tab. 7) does not produce any acceleration in birth replacement, and may suggest that couples deliberately
increased birth intervals, evidencing a certain role of birth spacing. With regard to the ages of two years and more, the results are not significantly different for both cohorts (tab. 8), but the very small percentages of intervals involved (close to 3% for the first marital cohort) make these results poorly representative.
In summary we can state that the two cohorts have a similar behavior, but for the second almost all covariates agree in showing a faster response to younger ages, confirming the prevalence of stopping behavior. Moreover, the child replacement, which is slower for the second cohort, seems to suggest a certain role of spacing.
9. Conclusion and discussion
The objective of this study was to verify the possible presence of a signature of the demographic transition in the community of Riomaggiore during the 19th century, applying the family reconstitution to the micro-longitudinal data. The different parameters led to the conclusion that the voluntary limitation of fertility was a feature of the demographic evolution of Riomaggiore during the second half of the 19th century. Changes in the family size have been determined by the fertility decline, defined in terms of couple’s parity-specific behavior: the decrease of the number of children ever born (especially after ’60s) is in line with the decrease in maternal age at the birth of the last child and the shortening of the reproductive period. The age specific marital fertility rate, while for the first marriage cohort showed a stable development of the entire reproductive interval up to the higher ages, for the second cohort at high fertility rates of the first ages followed low rate values. The Cox model results confirmed a different response of the two marriage cohorts to the infant replacement and the birth distribution throughout the marriage years. As regards the second cohort, the presence of features consistent with a fertility control seems to be verified: stopping control prevails, but spacing also plays a not negligible role.
However, the observed fertility control does not seem to follow the ‘classic regulatory mechanism’ which associates the fertility decline primarily with an improved survivorship. In this case, on the contrary, the decline in fertility was observed at a time when the childhood mortality rate (ages 0-4) was around 500 (tab. 7) and life expectancy at birth was significantly reduced (Gasparini 2016). To understand this behavior, we must consider the wide social and economic transformation induced by industrialization that was taking place in the district of La Spezia (Carozzi 1983). The great job opportunity that has been created has led to a strong immigration in that area and in many neighboring villages: Riomaggiore was mainly involved during the construction period of the railway line, but also in subsequent years. The decade 1860-70, which corresponds to the highest immigration rate due to railway workers (fig. 1), can be considered a turning point towards the onset of fertility control (fig. 2). Testimonies of that period (Bertani 1883; Signorini 1895) describe Riomaggiore as a place with a degraded quality of life and precarious health conditions, primary reasons for
the high infant mortality rate. The typical diseases (cholera epidemic, pulmonary tuberculosis, infant diseases, etc.) related to the unhealthy condition increased, particularly involving young people. It should be noted that this precarious situation was not a peculiarity of Riomaggiore, but was the same present in La Spezia (Carozzi 1983; Scaramuccia 2007), due to the massive immigration attracted by the employment opportunities linked to the new born industry14.
If in the ‘classic regulatory mechanism’ the improved survivorship is responsible for the population increase and the consequent activation of a ‘regulatory mechanism’ of fertility, in our case the main responsibility of the population increase has to be attributed to the high immigration rate. The response to this increase, has caused an increase in mortality and has led to a birth control15. The fertility decline seems to have also overtaken the opposite
contribution resulting from the reduction in the age of women’s first marriage and the decrease in celibacy, both important determinants of parity progression.
Many competing and contrasting factors (at different times, of different duration, of different intensity) act to produce this scenario. The result is a dynamic situation that reflects a large-scale transformation process, which goes to deeply influence the habits of this community when it is reached by new jobs and new people. The easy connection of Riomaggiore with the urban area allowed its inhabitants to be involved in the first industrialization processes and to open the community to greater exchanges of goods and ideas. Through contact with new knowledge and habits, fertility progressively became «within the calculus of conscious choice» (Coale 1973).
1 «When the demographic transition occurred it did not take the form of a move from a situation
in which fertility was uncontrolled to one in which it was reduced by the exercise of prudential restraint. Fertility is under constraint in almost all societies, as the comparison of the levels of natural fertility in preindustrial societies clearly shows. The key change from a system of control through social institution and custom to one in which the private choice of individual couples played a major part in governing the fertility rate. It was a change of profound importance, but the change is not best characterized as a change from lack of control to control. Even though control was not through private choice, it could be very effective nonetheless» (Wrigley 1978, 148).
2 A study of the family of a rural community in Liguria during the 18th century (Levi 1973)
shows how its size was deeply constrained by the availability of land and the number of its adult members, able to produce an income.
3 In the first half of the nineteenth century, the birth rate in eastern Liguria was 38‰ compared
to 34‰ in western Liguria and marital fertility was lower in urban centres than in rural areas, well before the beginning of a fertility control (Necco 1913; Livi Bacci 1977). There were also great differences between the coastal villages, mainly characterized by immigration, and the inland villages, where emigration prevails (Felloni 1961).
4 The population of La Spezia began to increase in the ’60s, following the settlement of the naval
base, and during the period 1881-1901 La Spezia was the Italian city with the highest growth rate (59.3‰) of its inhabitants (MAIC 1904).
5 The remaining 18% were foreign couples who emigrated to the village or were generally mobile,
together with a certain number of endogamous couples whose marriage was not celebrated in the parish of residence. Concerning illegitimate births, their occurrence was very limited.
6 We have also to note that during the second 19th century, major changes in employment led to
various changes in the working lives of the inhabitants, making difficult a socio-professional classification of families. Moreover, at the end of the 19th century, the possibility of reaching La Spezia by train in a short time, favoured the appearance of a new job profile, the part-time farmer, who divided his time between factory and vineyard (Redoano Coppedè 1985).
7 The 25-year averages for contemporaries were calculated by subtracting the age of all persons
over 50 from the date of death in order to obtain the year of birth; then the percentage of single females/males was calculated with respect to all females/males born in the same time interval (25 years). If we consider a long-term period (1680-1950), female celibacy at Riomaggiore can be estimated at 9.8%. It has been observed that, during the same period, about 10% celibacy seems to have been ‘normal’ for the western Europe (Guinnane, Ogilvie 2014).
8 If we consider the distribution of the mean age at marriage in the Kingdom of Italy for the
period 1861-1895 (ISTAT n.d.) we find higher ages. Even the scarce information available on Liguria (Rettaroli 1992) indicates an increasing trend in the age at marriage (1861: 23.4 and 27.7 for women and men respectively; 1901: 24.9 and 29.2) and an almost stable celibacy (14.5-15.5%). All this suggests a certain specificity in the demographic dynamics of Riomaggiore in the second half of the nineteenth century, which seems to differ from the more general trend.
9 More specifically C = 1+(L-F)/I, where C is the number of births per fertile woman; L is the
mean age at last birth (a proxy of stopping behavior); F is the mean age at first birth (when we start to account fertility); I is the mean inter-birth interval among women with at least two births (to evaluate the spacing behavior). The necessity to add one arises because the number of intervals is one less than number of births, given that calculation does not include the interval between marriage and first birth (Knodel 1988, 334).
10 For the Coale-Trussell Indices see Coale and Trussell (1974) and (1978).
11 Negative values of m mean that fertility falls more slowly with age than the natural fertility
(Soliani 1985; Guinnane, Olgivie 2014).
12 The eight-year interval is justified by the possible presence in the village of sailors employed in
ocean navigation or by the temporary emigration of people for long periods. Both can stay away from their families for several years.
13 Event time is the date of conception, which is estimated by subtracting 38 weeks to the birth
date (van Bavel, Kok 2004).
14 See note 4.
15 The decline in child mortality does not always precede the decline in fertility. It has been noted
that there is no clear relationship between the timing of the decline in infant mortality and the decline in fertility (van de Walle 1986).
Archival references
APR Riomaggiore, Archivio parrocchiale
APR-1: APR, Registri dei matrimoni.
APR-2: APR, Registri dei morti.
References
A. Amialchuk, E. Demitrova 2012, Detecting the evolution of deliberate fertility control before the demographic transition in Germany, «Demographic Research», 27, 507-542.
D.L. Anderton, L.L. Bean 1985, Birth spacing and fertility limitation: a behavioral analysis of a nineteenth century frontier population, «Demography», 22, 2, 169-83.
P. Arvati 2007, Il caso demografico ligure, in G. Assareto, M. Doria (eds.) Storia della Liguria, Laterza, Bari, 373-390.
A. Bertani 1883,Relazione sulla VIII Circoscrizione (P. Maurizio, Genova, M. Carrara), in Atti Giunta per l’Inchiesta Agraria e sulle condizioni della classe agricola, vol. X, Roma, 331-332.
M. Breschi, L. Pozzi, R. Rettaroli 1994, Analogie e differenze nella crescita della popolazione italiana, 1750-1911, «Bollettino di demografia storica», 20, 41-94.
M. Breschi, M. Manfredini, R. Rettaroli, 2000. Comportamento riproduttivo e contesto famigliare in ambito rurale: ‘case studies’ sull’Italia di pre-transizione, «Popolazione e Storia», numero unico/2000, 199-216.
M. Breschi, A. Formasin, L. Pozzi, R. Rettaroli, F. Scalone, 2009, The onset of fertility transition in Italy 1800-1900, in A. Fornasin, M. Manfredini (eds.), Fertility in Italy at the turn of the twentieth century, Forum, Udine, 11-29.
M. Breschi, M. Esposito, S. Mazzoni, L. Pozzi 2014, Fertility transition and social stratification in the town of Alghero, Sardinia (1866-1935), «Demographic Research», 30, 28, 823-852.
F. Carozzi 1983, Lo sviluppo economico dello spezzino nell’800, in Conversazioni su “La storia della Spezia”, Zappa, Sarzana, 83-102.
A.J. Coale, 1973, The demographic transition reconsidered, in International Population Conference, Liège, vol. 1, 53-72.
A.J. Coale 1986, The decline of fertility in Europe since the Eighteenth century as a chapter in human demographic history, in A.J. Coale, S.C. Watkins (eds.), The Decline of Fertility in Europe, Princeton University Press, Princeton, 1-30.
A.J. Coale, J. Trussell 1974, Variation in the Age Structure of Childbearing in Human Populations, «Population Index», XL, 185-258 (See also “Erratum”, «Population Index», XLI, 572).
A.J. Coale, J. Trussell 1978, Technical Note: Finding the two Parameters that specify a model schedule of marital fertility, «Population Index», XLIV, 203-2013.
A.J. Coale, S.C. Watkins (eds.) 1986, The Decline of Fertility in Europe, Princeton University Press, Princeton.
L. Del Panta, L. Pozzi, R. Rettaroli, E. Sonnino (eds.) 2002, Dinamiche di popolazione, mobilità e territorio in Italia. Secoli XVII-XX, Forum, Udine.
G. Felloni 1961, Popolazione e sviluppo economico della Liguria nel XIX secolo, ILTE, Torino. A. Fornasin, M. Manfredini (eds) 2009, Fertility in Italy at the turn of the twentieth century, Forum, Udine.
P.R. Galloway 1988, Basic patterns in annual variations in fertility, nuptiality, mortality, and prices in pre-industrial Europe, «Population Studies», 42, 275-303.
G.P. Gasparini 2004, Crescita demografica e agricoltura delle Cinque Terre nella prima metà dell’Ottocento: il comune di Riomaggiore, «Rivista di Storia dell’Agricoltura», XLIV, 65-123. G.P. Gasparini 2016, L’evoluzione demografica di Riomaggiore (Cinque Terre) dal XVIII al XX secolo, «Popolazione e Storia», 2/2016, 37-59.
C. Ge Rondi, M. Manfredini, R. Rettaroli (eds.) 2008, Transizioni di fecondità in Italia tra Ottocento e Novecento, Forum, Udine.
T.W. Guinnane, S. Ogilvie 2014, Two-Tiered demographic systems: ‘insiders’ ad ‘outsiders’ in three Swabian communities, 1558-1914, «The History of the Family», 19, 77-119.
ISTAT n.d., Sposi e spose per classi d’età - Anni 1865-2014. Available at http://seriestoriche.istat.it/.
J.E. Knodel 1988, Demographic behavior in the past, Cambridge University Press, Cambridge.
G. Levi 1973, Famiglie contadine nella Liguria del settecento, «Miscellanea di storia ligure», V(II), 207-290.
M. Livi Bacci 1977, A history of Italian fertility during the last two century, Princeton University Press, Princeton.
M, Livi Bacci 1986, Social-Group forerunners of fertility control in Europe, in A.J. Coale, S.C. Watkins (eds.), The Decline of Fertility in Europe, Princeton University Press, Princeston, 182-200.
MAIC 1904, Censimento della popolazione del Regno d’Italia al 10 febbraio 1901. Relazione sul metodo di esecuzione e sui risultati del censimento, raffrontati con quelli dei censimenti italiani precedenti e di censimenti esteri, vol. X, p. XX, Roma.
A. Necco 1913, Il problema della popolazione in Italia. Perchè la natalità declina più rapida in Piemonte e Liguria, Società Tipografico-Editrice Nazionale, Torino.
G. Redoano Coppedè 1985, Il trasporto extraurbano dei pendolari per la città di La Spezia nella seconda metà del XIX secolo, in Scritti in onore del prof. Paolo Emilio Taviani, tomo I, Genova, 297-314.
D.S. Reher, A. Sanz-Gimeno 2007, Rethinking historical reproductive change: insights from longitudinal data for a Spanish town, «Population and development review», 33, 4, 703-727. R. Rettaroli 1992, L’età al matrimonio, in M. Bargagli, D.I. Kerster (eds.), Storia della famiglia italiana 1750-1950, Il Mulino, Bologna, 63-102.
A. Scaramuccia 2007, La Spezia ai tempi del colera, Ed. Cinque Terre, La Spezia.
L. Soliani 1985, Incrementi di fecondità alla fine della fecondità naturale? Un caso italiano, in La popolazione italiana dell’Ottocento. Continuità e mutamenti, CLUEB, Bologna, 335-353.
T. Signorini 1895, Riomaggiore, ed. 1942, Le Monnier, Firenze.
E. Spolaore, R. Wacziarg 2016, Fertility and modernity, UCLA CCPR Population Working Papers - 128.97.186.17.
J. Van Bavel 2004, Deliberate birth spacing before the fertility transition in Europe. Evidence from 19th century Belgium, «Population Studies», 58, 1, 95-107.
J. Van Bavel, J. Kok 2004, Birth Spacing in the Netherlands. The effects of family composition, occupation and religion on birth intervals, 1820-1885, «European Journal of Population», 20, 119-140.
F. van de Walle 1986, Infant mortality and the European demographic transition, in A.J. Coale, S.C. Watkins (eds.), The decline of fertility in Europe, Princeton University Press, Princeton, 201-233.
F. van Poppel, M. Sanchez-Dominguez, D.S. Reher, E. Beekink, A. Sanz-Gimeno 2012, Mortality decline and reproductive change during the Duch demographic transition: Revisiting a traditional debate with new data, «Demographic Research», 27, 299-338.
E.A. Wrigley 1978, Fertility strategy of the individual and the group, in C. Tilly (ed.), Historical Studies of Changing Fertility, Princeton University Press, Princeton, 135-154.
E.A. Wrigley, R.S. Davies, J.E. Oeppen, R.S. Schofield 1997, English Population History from Family Reconstituction 1580-1837, Cambridge University Press, Cambridge.
Summary
Reproductive change in Riomaggiore (Cinque Terre) during the 19th century
This paper analyses the fertility evolution of Riomaggiore, a village along the eastern Ligurian coast. Micro-longitudinal data from parish registers, covering a period extending from last years of 18th century to the late 19th, permitted to detect the onset of the fertility decline starting from the second half of the examined period. While the classic demographic transition scheme identifies regression in mortality as the key factor able to trigger a decline in fertility, in our situation that decline corresponds to high infant and child mortality. A possible explanation is that in the late 19th century Riomaggiore was involved in the industrial development of the eastern Liguria and was exposed to a considerable immigration. A consequence was an extraordinary demographic increase, associated with sustained mortality levels. These two factors certainly played an important role in activating the typical mechanisms of the fertility control, with consequent decline of fertility.
Riassunto
Cambiamenti riproduttivi a Riomaggiore (Cinque Terre) nel XIX secolo
Questo articolo analizza l’evoluzione della fertilità di Riomaggiore, un borgo lungo la costa ligure orientale. Micro-dati longitudinali provenienti dai registri parrocchiali, che coprono un periodo che va dagli ultimi anni del XVIII secolo all’ultimo decennio del XIX, hanno permesso di rilevare il declino della fertilità a partire dalla seconda metà del periodo esaminato. Mentre il classico schema della transizione demografica identifica il regresso della mortalità come il fattore chiave in grado di innescare un calo della fertilità, nella situazione in esame il declino della fertilità coincide con un’elevata mortalità neonatale e infantile. Una possibile spiegazione è che Riomaggiore negli ultimi decenni del XIX secolo viene coinvolto nello sviluppo industriale del levante ligure ed è interessato da una notevole immigrazione. La conseguenza fu uno straordinario aumento demografico, associato a sostenuti livelli di mortalità. Questi due fattori hanno certamente avuto un ruolo importante nell’attivare i meccanismi tipici del controllo della fertilità con conseguente declino della stessa.
Keywords
Fertility; Demographic transition; Family reconstitution; Infant mortality; Liguria. Parole chiave
Fertilità; Transizione demografica; Ricostruzione delle famiglie; Mortalità infantile; Liguria.