Tracking muscle wasting and disease activity in
facioscapulohumeral muscular dystrophy by
qualitative longitudinal imaging
Mauro Monforte1,2* , Francesco Laschena3, Pierfrancesco Ottaviani3, Maria Rosaria Bagnato2, Anna Pichiecchio4,5, Giorgio Tasca1†& Enzo Ricci1,2†
1Unità Operativa Complessa di Neurologia, Fondazione Policlinico Universitario A. Gemelli IRCCS, Rome, Italy,2Istituto di Neurologia, Università Cattolica del Sacro Cuore,
Rome, Italy,3Radiology Department, IDI IRCCS, Rome, Italy,4Neuroradiology Department, IRCCS Mondino Foundation, Pavia, Italy,5Brain and Behavioral Department, University of Pavia, Pavia, Italy
Abstract
Background Facioscapulohumeral muscular dystrophy (FSHD) is one of the most frequent late-onset muscular dystrophies, characterized by progressive fatty replacement and degeneration involving single muscles in an asynchronous manner. With clinical trials at the horizon in this disease, the knowledge of its natural history is of paramount importance to understand the impact of new therapies. The aim of this study was to assess disease progression in FSHD using qualitative muscle mag-netic resonance imaging, with a focus on the evolution of hyperintense lesions identified on short-tau inversion recovery (STIR+) sequences, hypothesized to be markers of active muscle injury.
Methods One hundred genetically confirmed consecutive FSHD patients underwent lower limb muscle magnetic resonance imaging at baseline and after365 ± 60 days in this prospective longitudinal study. T1 weighted (T1w) and STIR sequences were used to assess fatty replacement using a semiquantitative visual score and muscle oedema. The baseline and follow-up scans of each patient were also evaluated by unblinded direct comparison to detect the changes not captured by the scoring system. Results Forty-nine patients showed progression on T1w sequences after 1 year, and 30 patients showed at least one new STIR+ lesion. Increased fat deposition at follow-up was observed in13.9% STIR+ and in only 0.21% STIR- muscles at baseline (P< 0.001). Overall, 89.9% of the muscles that showed increased fatty replacement were STIR+ at baseline and 7.8% were STIR+ at 12 months. A higher number of STIR+ muscles at baseline was associated with radiological worsening (odds ratio 1.17, 95% confidence interval 1.06–1.30, P = 0.003).
Conclusions Our study confirms that STIR+ lesions represent prognostic biomarkers in FSHD and contributes to delineate its radiological natural history, providing useful information for clinical trial design. Given the peculiar muscle-by-muscle involve-ment in FSHD, MRI represents an invaluable tool to explore the modalities and rate of disease progression.
Keywords Muscle MRI; Muscle wasting; FSHD; Facioscapulohumeral muscular dystrophy; Biomarkers; STIR hyperintensity Received:23 December 2018; Revised: 14 May 2019; Accepted: 12 June 2019
*Correspondence to: Mauro Monforte, MD, Unità Operativa Complessa di Neurologia, Fondazione Policlinico Universitario A. Gemelli IRCCS e Istituto di Neurologia, Università Cattolica del Sacro Cuore, Largo A. Gemelli8, Rome 00168, Italy. Tel.: +39 0630157088, Fax: +39 0635501909, Email: [email protected] †Shared senior authorship.
Introduction
Facioscapulohumeral muscular dystrophy (FSHD), the second most prevalent muscular dystrophy with onset in adulthood,1 is a slowly progressing disorder characterized by a
heterogeneous and often asymmetric muscle involvement, usually starting form facial and scapularfixator muscles and later spreading to upper arms, trunk, and lower limbs.2The clinical spectrum of the disease is wide, ranging from asymp-tomatic or minimally disabled patients to severe wheelchair Published online in Wiley Online Library (wileyonlinelibrary.com) DOI:10.1002/jcsm.12473
bound subjects.3 In its most frequent form (FSHD1), it is inherited as an autosomal dominant trait associated with a contraction of the D4Z4 macrosatellite repeat array on the 4q chromosome which, together with a permissive haplotype distal to the last of these repeats, allows the inappropriate expression of the DUX4 retrogene in adult skeletal muscle.4
Significant efforts have been made to develop therapies that could potentially counteract this disease, for example, preventing or slowing the loss of muscle mass, and promising approaches are emerging.5,6To evaluate the efficacy of such treatments, the research community is committed to identify biomarkers and develop outcome measures for clinical trial purposes.7
In the last years, the increasingly widespread use of stan-dard and quantitative muscle magnetic resonance imaging (MRI) in FSHD patients suggested a non-linear model of dis-ease progression that proceeds with a muscle-by-muscle type of involvement,8in which an early phase of muscle damage, identifiable by increased signal on short-tau inversion recov-ery (STIR) sequences accounting for oedema/inflammation, precedes fatty replacement of single muscles.9–12This would be consistent with the proposed model of disease pathophys-iology, according to which bursts of inappropriate expression of the DUX4 retrogene, normally repressed in adult striated skeletal muscle, lead to a cascade of downstream events, not yet fully understood but potentially inclusive of an in flam-matory-immune response,13–16 that in the end generate skeletal muscle wasting.17 In this context, STIR positive (STIR+) muscle lesions have been proposed as biomarkers of disease activity. Therefore, large studies to confirm that STIR+ lesions can be reliably correlated with phases of disease activity at single muscle level are primarily expected by the FSHD research community, but missing so far.18
Recent longitudinal imaging studies indeed focused on quantitative evaluation of fatty replacement and its correla-tion with clinical measures of disease progression, providing only limited information on the rate of appearance and evo-lution of STIR+ lesions.19–21
To contribute to answer these relevant questions, we de-signed this longitudinal study using conventional muscle MRI with the following aims: (i) to determine the evolution of STIR+ lesions after1 year time, in comparison with the evo-lution STIR- muscles; (ii) to assess the rate of appearance of new STIR+ lesions in the same time frame; (iii) to determine how often fatty replacement is preceded by a STIR+ lesion de-tectable1 year earlier.
Patients and methods
Patients
All FSHD patients routinely followed up at the Fondazione Policlinico Universitario A. Gemelli IRCCS were asked to
participate to this prospective longitudinal study that took place between January2014 and December 2017. The target of enrolment was100 consecutive patients. Among the en-rolled patients,74 were also involved in our previous large cross-sectional MRI study.8 Inclusion and exclusion criteria were identical to that previous study and were designed to include only adult, genetically proven, symptomatic FSHD1 patients. Disease severity was evaluated with the clinical se-verity scale (CSS),22 ranging from asymptomatic patients (score =0) to patients who lost ambulation (score = 5). At the time of clinical examination, patients were asked to un-dergo a baseline (within2 weeks) and a follow-up scan at 1 year distance (365 ± 60 days).
Magnetic resonance imaging protocol and
evaluation
Lower limb muscle MRI scans were performed at a single cen-tre using a 1.5T commercial scanner (Siemens Magnetom Espree, Erlangen, Germany). T1 weighted (T1w) and STIR se-quences were acquired using published protocols.8
One neurologist expert in muscle imaging (M. M.) and one MD student trained in muscle imaging (M. B.) independently assessed all the scans. Baseline and follow-up images were first evaluated using a 5-point semiquantitative scale to as-sess the extent of fatty replacement in single muscles on T1w sequences23and using a binary score (i.e. yes or no) to judge the presence of hyperintensities on STIR sequences. A total of35 muscles were assessed on each side throughout their length. Subsequently, to detect more subtle changes not identified by the former assessment, the observers per-formed a direct visual comparison between the baseline and the follow-up scan of each patient on the same computer monitor. After careful alignment, using bony landmarks (fem-oral head and tibial plateau) as reference, the observers clas-sified every muscle into one of the 16 categories summarizing all the possible combinations of evolution on T1w and STIR sequences (Table1). Radiological worsening in single muscles was defined as an increase in fatty replacement or evident decrease in size and/or an appearance of a new hyperintensity on STIR sequences, as defined in the categories 4–6, 8–12, 14, and15 of Table 1. Time needed to perform the scoring of one scan was 25 min; time needed to perform one comparison was35 min on average.
Statistical analysis
Data are expressed as mean ± standard deviation unless oth-erwise specified and were analyzed using IBM SPSS Statistics ver.22. All P-values <0.05 were considered statistically signif-icant. Shapiro–Wilk test was used to assess data distribution, and each time, the appropriate statistic was chosen
accordingly. T1 score was calculated as the sum of the scores of involvement of the individual muscles in each patient, using the5-point scale for fatty replacement. Independent sample t-test was used to evaluate differences regarding age, EcoRI fragment length, CSS, baseline T1 score, and number of STIR + muscles. Paired t-test was used to ascertain differences in T1 score and number of STIR+ muscles between baseline and follow-up scans; χ2 test was used to assess differences be-tween the number of STIR+ and STIR- muscles with increased fatty replacement at follow-up. Cohen’s κ was used to deter-mine if there was agreement between the two raters on the classification system adopted for this project. A logistic regres-sion was performed to ascertain the effects of age, gender, EcoRI fragment length, CSS, T1 score, and number of STIR+ muscles at baseline on the likelihood that the patients displayed radiological progression in at least one muscle.
Results
Patients and baseline results
Baseline MRI scans were acquired in the period January 2014–December 2016. Forty-nine men and 51 women were enrolled. Mean age at baseline was 44.45 ± 13.99 years (range 18–71), mean EcoRI fragment length was 24.18 ± 5.62 kb (range 10–38), and median CSS was 3.0 (interquartile range1.8, range 0.5–4.5).
All the patients except one, whose CSS was 0.5, showed lower limb involvement on MRI at baseline. Mean number of muscles affected on T1w sequences was 32.56 ± 19.59 (range 0–68) per patient. Mean T1 score was 71.9 ± 50.79 (range 0–183). Eighty-four patients had at least one STIR+ muscle. Mean number of STIR+ muscles per patient was Table1 Classification system used to identify the differences between baseline and follow-up MRI scans and results of the comparisons
STIR, STIR sequences; T1, T1w sequences; -, unaffected; +, affected; ++, worsening of an already affected muscle. An evident change in the size of the muscle (hypotrophy) was also considered as worsening. White background: muscle showing no changes from baseline to follow-up MRI; red background: muscle displaying changes (i.e. radiological worsening); and green background: muscle with STIR+ le-sions only at baseline without progression on T1w sequences.
8.27 ± 6.77 (range 0–33), and the total number of STIR+ mus-cles was827 (11.8% of the total).
We found no differences comparing male and female groups with respect to age, CSS, and T1 score while a statistically significant difference in EcoRI fragment length (men25.98 ± 5.8 kb, women 22.45 ± 4.9 kb, P = 0.001) and number of STIR+ muscles (men10.39 ± 6.85, women 6.24 ± 6.09, P = 0.002) was observed. A summary of clinical, genetic, and radiological features is reported in Supporting Information, Table S1.
Follow-up scans
The observers agreed in classifying muscles in one of the16 categories in93% of cases, and in the remaining 7%, consen-sus was reached by consultation. There was substantial agreement between the two raters’ judgements, with κ = 0.861 (95% confidence interval 0.841–0.878, P < 0.001).
Mean T1 score at follow-up was higher than baseline (72.28 ± 50.92, range 0–184, P < 0.001). Twenty-three pa-tients showed increased T1 score at follow-up, while no pa-tient showed a decrease. The direct comparison of the scans allowed to detect an increase in fat deposition in at least one muscle in 26 additional patients. Overall, 49
patients (25 men and 24 women) showed detectable changes on T1w sequences after 1 year.
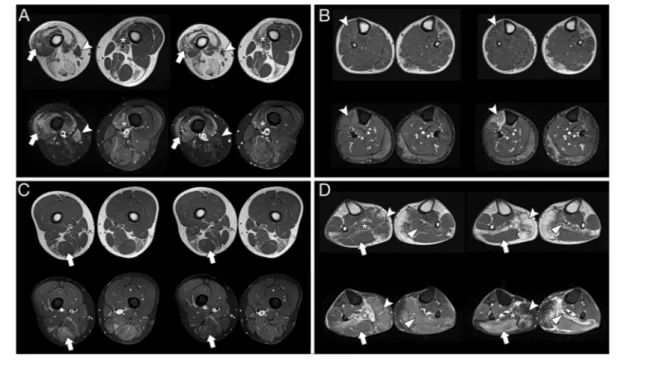
The majority of the muscles (n = 6813, 97.3% of the to-tal, categories 0–3, Table 1) did not show changes at fol-low-up; an increase of at least one point in the semiquantitative score was found in 0.53% of the muscles (n = 37), while the direct comparison showed an increase in fat content in 1.83% (n = 128; categories 5, 6, 8, 9, 11, 12, 14, and 15, Table 1). The muscles that more frequently showed progression on T1w images were the gracilis (n = 14), gastrocnemius medialis (n =14), and tibialis anterior (n = 10) (Supporting Information, Figure S1). This progression consisted in muscle hypotrophy rather than increase of fatty replacement in a minority of cases and only for some muscles that were STIR+ at baseline: tibialis anterior (4out of8cases),gracilis (5out of12 cases), and sartorius (3 out of 8 cases). Examples of different types of progression are shown in Figure1.Thecompletescoring data set is available as Supporting Information, Table S2.
No significant difference was found in the number of STIR+ muscles at follow-up (8.45 ± 6.76, range 0–33) compared with baseline evaluation. A new STIR+ lesion was displayed by 0.73% of the muscles at follow-up (n = 51, 25 with a score 0, 21 with a score 1–2, 5 with a score 3, and none with a score 4). Thirty patients (18 men and 12 women, mean age 40.47 ± 15.6, median CSS 3.0 interquartile range 2.0, mean EcoRI fragment length 24.5 ± 6.53 kb, mean T1 score at baseline Figure1 Different types of progression at 1 year in single muscles (baseline on the left-hand side and follow-up on the right of each panel). (A) Patient 41: worsening on T1w sequences with persistence of STIR hyperintensity in vastus lateralis (arrow) and medialis (asterisk); in the same patient, the STIR + sartorius (arrowhead) becomes atrophic and STIR- at follow-up; (B) Patient35: a new hyperintense lesion in STIR sequences accompanied by volume loss is evident in the tibialis anterior (arrowhead); (C) Patient65: normalization of STIR signal without apparent changes on T1w images in the semitendinosus (arrow); (D) Patient63: right soleus (asterisk, STIR+ at baseline), left soleus (triangle), and right gastrocnemius medialis (arrowhead, STIR+ at follow-up scan) becoming almost completely replaced by fat tissue after1 year; appearance of a new STIR+ muscle (gastrocnemius lateralis, arrow) with normal signal in T1w sequences. STIR, short-tau inversion recovery.
69.2 ± 55.54) showed at least one muscle with a new STIR+ lesion.
Evolution of STIR+ muscles
Out of the 128 muscles that showed progression on T1w images, 115 (89.9%) were STIR+ at baseline and 10 (7.8%) were STIR+ at follow-up.
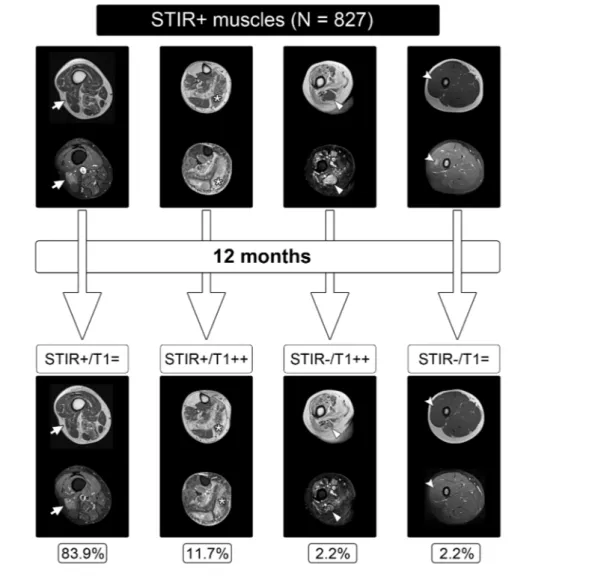
The majority of the STIR+ muscles at baseline (n = 694, 83.9%) showed no changes either on T1w or on STIR sequences at follow-up while 13.9% (n = 115) worsened on T1w sequences, thus displaying increased fatty replacement. On the contrary, only0.21% of the STIR- muscles at baseline (n =13) showed progression on T1w images at follow-up. In 2.2% of the STIR+ muscles (n = 18, corresponding to 11 patients,6 men and 5 women), a normalization of STIR signal without detectable changes on T1w sequences was observed
(Figure2). The difference between STIR+ and STIR- muscles in the progression to fatty replacement at follow-up was statistically significant (P < 0.001). Higher values of T1 score (94.94 ± 41.58 vs. 55.77 ± 48.57, P < 0.001) and CSS (median 3.5 interquartile range 1.0 vs. median 3.0 interquartile range 2.0, P < 0.001) were found in patients (n = 48, 25 men and 23 women) who had at least one STIR+ muscle that progressed on T1w sequences, compared with patients (n = 35, 21 men and 14 women) who had only STIR+ muscles that did not show increase in fatty replacement.
Determinants of radiological worsening
Radiological worsening in at least one muscle, as previously defined, occurred in 59 patients (31 men and 28 women). The logistic regression model built to ascertain the effects of age, gender, EcoRI fragment length, CSS, T1 score, and Figure2 Evolution of STIR+ muscles at baseline. Patients (left to right) 80, 40, 9, 5, and 24. T1, T1w sequences; -, unaffected; +, affected; ++, wors-ening; =, no changes. STIR, short-tau inversion recovery.
number of STIR+ muscles at baseline on the likelihood of displaying radiological worsening in at least one muscle was statistically significant, χ2(6) = 29.89, P < 0.001. The model explained 34.8% (Nagelkerke R2) of the variance and cor-rectly classified 76% of cases. Among all these variables, only an increase in the number of STIR+ muscles was associated with a higher likelihood of radiological worsening at follow-up (odds ratio1.17, 95% confidence interval 1.06–1.30, P = 0.003).
Discussion
Several cross-sectional imaging studies reported the most fre-quent patterns of involvement in FSHD,8,24,25but only scarce longitudinal data are present in the literature, mostly focused on quantitative evaluation of fatty replacement and its corre-lation with clinical measures of disease progression with no or limited information on the rate of appearance and evolution of STIR+ lesions.19–21In this study, we performed a longitudi-nal follow-up of a large cohort of FSHD patients by lower limb muscle MRI. Lower limb MRI was chosen because more widely available and for the higher likelihood offinding STIR+ lesions compared with upper girdle imaging.8 In a heterogeneous and slowly progressive disease such as FSHD, conventional MRI examination was able to detect signs of progression in terms of fatty replacement in almost half of the studied pa-tients after1 year. The direct comparison of the baseline and follow-up scans identified an increase of fat accumulation with higher sensitivity than the 5-point semiquantitative evalua-tion. Other limited natural history data on FSHD are available: a clinical study that followed patients over36 months showed a slight decline in a mean voluntary isometric contraction test after12 months and of an averaged composite manual muscle testing score after 18 months, but no predictors of disease progression were identified in that study.26Quantitative MRI demonstrated that fat fraction progressed in different muscles on average by3.6% per year,19without differential evaluation of STIR+ and STIR- muscles. Clinical tools to more accurately identify disease progression are currently under development; muscle imaging depicts different and complementary aspects of disease progression, and the integration of the two assess-ments could be the best way to define reliable, sensitive, and meaningful outcome measures.
The results provided with the present study are relevant for the upcoming clinical trials in FSHD for different reasons: (i) enrolling patients with STIR+ muscles, thus more prone to show disease progression in a short time frame, would maximize the chances to detect a meaningful effect of an investigational treatment; (ii) slowing down the evolution of STIR+ lesions towards fatty replacement, increasing the rate of disappearance of STIR+ lesions, or lowering the occurrence of new STIR hyperintensities could be considered proof of efficacy of the treatment.
We indeed found that STIR+ muscles progress faster towards fatty replacement: after 1 year, almost 14% of the STIR+ muscles showed signs of increased fat amount, while only 0.2% of STIR- muscles demonstrated such an evolu-tion. The evidence that a higher number of STIR+ muscles at baseline predicts worsening at follow-up further supports the link between STIR+ lesions and disease progression. Similarly, we found that the increase in fatty replacement at single muscle level is almost invariably preceded by a phase characterized by the presence of STIR+ lesions de-tectable 12 months before. Our results thus confirm that STIR hyperintense lesions are prognostic biomarkers as they can identify an active phase of the disease with faster pro-gression towards muscle destruction. We cannot rule out the possibility that even all the evolutions towards fat replacement are preceded by a phase of STIR positivity, which would be virtually impossible to prove. This is how-ever further suggested by the fact that most of the STIR-muscles at baseline that increase in fat content show STIR positivity at follow-up.
The link between STIR+ lesions and disease progression had already been suggested by smaller studies: Friedman et al. found that STIR+ muscles evolved to fatty replacement in3 out of 9 patients followed by MRI of the calves over 2 years, while no evolution was seen in STIR- muscles.11At var-iance, one recent study by the same group on a cohort of15 patients followed for1 year found that only 4 out of 7 mus-cles that progressed on T1w sequences were STIR+ at base-line,27 partly questioning this proposed link. However, we might hypothesize that the small number of patients exam-ined, the heterogeneity of the disease, or even the different MRI protocols and subjective evaluation of STIR images could account for this discrepancy with our and previous studies.10 Here, we also confirmed earlier findings that women dis-play STIR+ muscles less frequently than men,8,28 although without a corresponding significant decrease in radiological worsening over 1 year, thus suggesting that STIR+ lesions are somehow more long lasting in men. This is in keeping with the recent evidences of a proposed protective effect of oestrogens by antagonizing DUX4 activity and at least partially preventing the activation of the cascade of patho-genic events downstream DUX4 transcription,29 while ac-cording to recent clinical study, differences in endogen oestrogen exposure during life did not seem to have a clin-ically relevant modifying effect on disease severity in fe-male patients.30 It also suggests that other sex-related factors might play a role in the development or further pre-vention of DUX4-mediated muscle damage as well.
It is known that STIR+ muscles are characterized by an inflammatory component, whose role is not yet fully under-stood. The fact that the majority of STIR hyperintensities are rather long lasting (83.9% remained unchanged at 1 year) and that some of them may even normalize on MRI
without macroscopic consequences on T1w images is in-triguing. The implementation of quantitative MRI tech-niques and pathology studies might clarify whether this evolution corresponds to an accumulation of fat that is un-der the sensitivity threshold of standard MRI or whether it corresponds to deposition of fibrotic tissue, whose assess-ment is a current limitation of all MRI techniques, but can be for instance visualized by muscle ultrasound.31 The molecular link between DUX4 activation and STIR positivity has been evaluated by a recent study on MRI-targeted muscle biopsies, finding that abnormal STIR signal is a reli-able predictor of the presence of DUX4 target expression.32 Further studies aimed at clarifying if inflammation repre-sents a protective attempt against the DUX4-driven delete-rious effects or a direct detrimental component of the DUX4 cascade are needed to understand more of the dis-ease and for therapy development.
A limitation of the present study is that we did not mea-sure the difference in longitudinal fatty replacement between STIR+ and STIR- muscles with quantitative techniques for fat or water content. It is known that semiquantitative imaging scores globally correlate with the actual fat fraction, but a wide range of fat fractions can exist within the same visual grade, so quantitative imaging is definitely more precise in measuring time differences in single muscles.33Furthermore, advanced MRI techniques allow to measure the water T2, that is more accurate to muscle oedema changes compared with STIR imaging.34,35Our study is however complementary to quantitative ones, providing different information by allowing an extensive and fast evaluation of all the muscles in the lower limbs along all their length. It also helps to in-form longitudinal quantitative MRI studies to find suitable targets and regions of interest to be effectively monitored (or avoided) in a1 year time frame.
In summary, in a slowly progressive disease such as FSHD, where clinical assessment alone may fail to detect modi fica-tions of the natural history of the disease induced by treat-ments in a relatively short time frame, having sensitive prognostic biomarkers is extremely useful for clinical trial de-sign, including correct patient stratification and evaluation of treatment efficacy. Our work sheds light on the radiological natural history of FSHD and further supports the role of this technique in defining predictors of disease progression.
Acknowledgement
We are gratefully to thank the FSHD Italia Onlus Association and all the patients that participated to this study.
Online supplementary material
Additional supporting information may be found online in the Supporting Information section at the end of the article. Figure S1. Progression on T1w images and appearance of new STIR+ lesions in single muscles
Table S1. Summary of clinical, genetic and radiological fea-tures
Table S2. Complete scoring dataset according to the classifi-cation into different categories
Con
flict of interest
Pursuant to the terms of a Master Academic Services Agree-ment with the Catholic University of the Sacred Heart, M.M. and E.R. provided central reading services for MRI scans gen-erated in aTyr’s clinical trials of Resolaris (ATYR1940). E.R. was the site principal investigator for some of these trials. F.L., P.O., M.R.B., A.P., and G.T. have nothing to report.
Ethical standards
The authors certify that they comply with the ethical guide-lines for authorship and publishing of the Journal of Cachexia, Sarcopenia and Muscle.36 This study was approved by the Ethics Committee of the ‘Fondazione Policlinico A. Gemelli IRCCS’ and has been performed in accordance with the ethi-cal standards laid down in the 1964 Declaration of Helsinki and its later amendments. All the involved subjects gave their written informed consent prior to the inclusion in the study.
References
1. Deenen JCW, Arnts H, van der Maarel SM, Padberg GW, Verschuuren JJGM, Bakker E, et al. Population-based incidence and prevalence of facioscapulohumeral dystro-phy. Neurology2014;83:1056–1059. 2. Tawil R. Facioscapulohumeral muscular
dystrophy. Handb Clin Neurol 2018;148: 541–548.
3. Statland JM, Tawil R. Risk of functional im-pairment in facioscapulohumeral muscular dystrophy. Muscle Nerve2014;49:520–527. 4. Lemmers RJLF, van der Vliet PJ, Klooster R, Sacconi S, Camaño P, Dauwerse JG, et al. A
unifying genetic model for
facioscapulohumeral muscular dystrophy.
Science2010;329:1650–1653.
5. Himeda CL, Jones TI, Jones PL. CRISPR/ dCas9-mediated transcriptional inhibition ameliorates the epigenetic dysregulation at D4Z4 and represses DUX4-fl in FSH mus-cular dystrophy. Mol Ther J Am Soc Gene
Ther2016;24:527–535.
6. Lim J-W, Snider L, Yao Z, Tawil R, Van Der Maarel SM, Rigo F, et al.
DICER/AGO-dependent epigenetic silencing of D4Z4 repeats enhanced by exogenous siRNA suggests mechanisms and therapies for
FSHD. Hum Mol Genet
2015;24:4817–4828.
7. Tawil R, Padberg GW, Shaw DW, van der Maarel SM, Tapscott SJ, Workshop Partici-pants FSHD. Clinical trial preparedness in facioscapulohumeral muscular dystrophy: clinical, tissue, and imaging outcome mea-sures 29-30 May 2015, Rochester, New
York. Neuromuscul Disord NMD
2016;26:181–186.
8. Tasca G, Monforte M, Ottaviani P, Pelliccioni M, Frusciante R, Laschena F, et al. Magnetic resonance imaging in a large cohort of facioscapulohumeral muscular dystrophy patients: pattern refinement and implications for clinical trials. Ann
Neurol2016;79:854–864.
9. Kan HE, Scheenen TWJ, Wohlgemuth M, Klomp DWJ, van Loosbroek-Wagenmans I, Padberg GW, et al. Quantitative MR imag-ing of individual muscle involvement in facioscapulohumeral muscular dystrophy.
Neuromuscul Disord NMD 2009;19:
357–362.
10. Janssen BH, Voet NBM, Nabuurs CI, Kan HE, de Rooy JWJ, Geurts AC, et al. Distinct
disease phases in muscles of
facioscapulohumeral dystrophy patients identified by MR detected fat infiltration.
PloS One2014;9:e85416.
11. Friedman SD, Poliachik SL, Otto RK, Carter GT, Budech CB, Bird TD, et al. Longitudinal features of STIR bright signal in FSHD.
Mus-cle Nerve2014;49:257–260.
12. Leung DG. Magnetic resonance imaging in facioscapulohumeral muscular dystrophy.
Muscle Nerve2018;57:872–874.
13. Frisullo G, Frusciante R, Nociti V, Tasca G, Renna R, Iorio R, et al. CD8(+) T cells in facioscapulohumeral muscular dystrophy patients with inflammatory features at
muscle MRI. J Clin Immunol
2011;31:155–166.
14. Tasca G, Pescatori M, Monforte M, Mirabella M, Iannaccone E, Frusciante R, et al. Different molecular signatures in
magnetic resonance imaging-staged
facioscapulohumeral muscular dystrophy muscles. PloS One2012;7:e38779. 15. Tasca G, Monforte M, Corbi M, Granata G,
Lucchetti D, Sgambato A, et al. Muscle mi-crodialysis to investigate inflammatory bio-markers in facioscapulohumeral muscular
dystrophy. Mol Neurobiol 2018;55:
2959–2966.
16. Jagannathan S, Shadle SC, Resnick R, Snider L, Tawil RN, van der Maarel SM, et al.
Model systems of DUX4 expression recapit-ulate the transcriptional profile of FSHD cells. Hum Mol Genet2016;25:4419–4431. 17. Snider L, Geng LN, Lemmers RJLF, Kyba M,
Ware CB, Nelson AM, et al.
Facioscapulohumeral dystrophy: incom-plete suppression of a retrotransposed gene. PLoS Genet2010;6:e1001181. 18. Tawil R, Shaw DW, van der Maarel SM,
Tapscott SJ. Clinical trial preparedness in facioscapulohumeral dystrophy: outcome measures and patient access: 8-9 April
2013, Leiden, The Netherlands.
Neuromuscul Disord NMD2014;24:79–85.
19. Andersen G, Dahlqvist JR, Vissing CR, Heje K, Thomsen C, Vissing J. MRI as outcome measure in facioscapulohumeral muscular dystrophy:1-year follow-up of 45 patients.
J Neurol2017;264:438–447.
20. Dahlqvist JR, Vissing CR, Thomsen C, Vissing J. Severe paraspinal muscle involve-ment in facioscapulohumeral muscular dys-trophy. Neurology2014;83:1178–1183. 21. Fatehi F, Salort-Campana E, Le Troter A,
Lareau-Trudel E, Bydder M, Fouré A, et al. Long-term follow-up of MRI changes in
thigh muscles of patients with
facioscapulohumeral dystrophy: a
quantitative study. PloS One 2017;12: e0183825.
22. Ricci E, Galluzzi G, Deidda G, Cacurri S, Colantoni L, Merico B, et al. Progress in
the molecular diagnosis of
facioscapulohumeral muscular dystrophy and correlation between the number of KpnI repeats at the 4q35 locus and clinical phenotype. Ann Neurol 1999;45: 751–757.
23. Fischer D, Kley RA, Strach K, Meyer C, Sommer T, Eger K, et al. Distinct muscle im-aging patterns in myofibrillar myopathies.
Neurology2008;71:758–765.
24. Tasca G, Monforte M, Iannaccone E, Laschena F, Ottaviani P, Leoncini E, et al.
Upper girdle imaging in
facioscapulohumeral muscular dystrophy.
PloS One2014;9:e100292.
25. Gerevini S, Scarlato M, Maggi L, Cava M, Caliendo G, Pasanisi B, et al. Muscle MRI findings in facioscapulohumeral muscular dystrophy. Eur Radiol2016;26:693–705. 26. Tawil R, Griggs RC, McDermott MP, Cos L,
Personius KE, Langsam A, et al. A
prospective, quantitative study of the natural history of facioscapulohumeral muscular dystrophy (FSHD): implications for therapeutic trials. The FSH-DY Group.
Neurology1997;48:38–46.
27. Ferguson MR, Poliachik SL, Budech CB, Gove NE, Carter GT, Wang LH, et al. MRI
change metrics of facioscapulohumeral muscular dystrophy: Stir and T1. Muscle
Nerve2018;57:905–912.
28. Mul K, Vincenten SCC, Voermans NC, Lemmers RJLF, van der Vliet PJ, van der Maarel SM, et al. Adding quantitative muscle MRI to the FSHD clinical trial tool-box. Neurology2017;89:2057–2065. 29. Teveroni E, Pellegrino M, Sacconi S,
Calandra P, Cascino I, Farioli-Vecchioli S,
et al. Estrogens enhance myoblast
differentiation in facioscapulohumeral muscular dystrophy by antagonizing
DUX4 activity. J Clin Invest
2017;127:1531–1545.
30. Mul K, Horlings CGC, Voermans NC, Schreuder THA, van Engelen BGM. Lifetime
endogenous estrogen exposure and
disease severity in female patients with facioscapulohumeral muscular dystrophy.
Neuromuscul Disord NMD 2018;28:
508–511.
31. Mul K, Horlings CGC, Vincenten SCC, Voermans NC, van Engelen BGM, van Alfen N. Quantitative muscle MRI and ultrasound for facioscapulohumeral muscular dystro-phy: complementary imaging biomarkers.
J Neurol2018;265:2646–2655.
32. Wang LH, Friedman SD, Shaw D, Snider L, Wong C-J, Budech CB, et al. MRI-informed muscle biopsies correlate MRI with
pathology and DUX4 target gene
expression in FSHD. Hum Mol Genet 2019;28:476–486.
33. Willis TA, Hollingsworth KG, Coombs A, Sveen M-L, Andersen S, Stojkovic T, et al. Quantitative magnetic resonance imaging in limb-girdle muscular dystrophy2I: a mul-tinational cross-sectional study. PloS One 2014;9:e90377.
34. Burakiewicz J, Sinclair CDJ, Fischer D, Wal-ter GA, Kan HE, Hollingsworth KG. Quanti-fying fat replacement of muscle by quantitative MRI in muscular dystrophy. J
Neurol2017;264:2053–2067.
35. Strijkers GJ, Araujo ECA, Azzabou N, Bendahan D, Blamire A, Burakiewicz J, et al. Exploration of new contrasts, targets, and MR imaging and spectroscopy tech-niques for neuromuscular disease—a work-shop report of working group 3 of the biomedicine and molecular biosciences
COST action BM1304 MYO-MRI. J
Neuromuscul Dis2019;6:1–30.
36. von Haehling S, Morley JE, Coats AJS, Anker SD. Ethical guidelines for publishing in the journal of cachexia, sarcopenia and muscle: update2017. J Cachexia Sarcopenia Muscle 2017;8:1081–1083.