Universit`
a degli Studi di Catania
Scuola Superiore di Catania
International PhD
in
Stem Cells
XXIII cycle
High resolution molecular karyotyping
and proteomic analysis in hematological
malignancies
Alessandra Romano
Coordinator of PhD:
Prof. Daniele Filippo Condorelli
Tutor: Prof. Francesco di Raimondo
Prof. Lance Liotta
Prof. Vincenza Barresi
A.A. 2007/2010 Alessandr a Romano Digitally signed by Alessandra Romano DN: cn=Alessandra Romano, c=US Date: 2010.12.08 11:23:31 -05'00' Signature Not Verified
Stay hard, stay hungry, stay alive: dedicated to all people helped
me to work on a dream
Abstract
In this work we focused on two hematological malignancies to apply the trans-lational meaning of functional genomics: myelodysplastic syndrome (MDS) and its potential evolution to frank acute myeloid leukaemia, and the broad set of monoclonal gammopathies up to multiple myeloma (MM). In both diseases the recent advances obtained thanks to the application of novel therapeutic agents have enlighten the need to target at the same time both neoplastic and sur-rounding microenvironment cells.
In MDS we applied the last generation of Affymetrix single nucleotide poly-morphism (SNP)/copy number aberrations (CNA) platform to distinguish so-matic and germline tumor-associated CNAs and loss of heterozigosity (LOHs) to identify possible recurring genomic abnormalities in high risk MDS evolving to AML. In particular in one patient, strictly followed in the clinical evolution from MDS to AML, we were able to define the unique features of the aberrant clone through a bioinformatic-based strategy.
For MM, we developed an ex vivo assay to identify signalling associated with differential treatments of fresh bone marrow aspirate samples, confirming the unique constellation of activation in the single patient, and the general trend of a differential behavior among neoplastic and surrounding cells.
Thanks to a global proteomic technique we identified compensatory path-ways potentially responsible of chemoresistance in both MDS and MM sustained by the activation of autophagy and pro-survival signalling. In particular, we identified:
• Msi-2 as potential biomarker of stemness and aggressivity in MDS, 3
• PLC-y1Tyr783, SrcTyr416 and STAT-5Tyr694 as compensatory pathway responsible of side effects of treatment with azacitidine in MDS,
• NFkB status as potential mediator of chemoresistance to dexamethasone in MM,
• Akt/mTOR as biomarker of aggressiveness of plasmacells in MM; • an abnormal compartmentalization of serotonin in MM peripheral blood
and bone marrow, related to bone disease.
Taken together, our data provide potential insights into diagnosis, prognosis, and/or treatment strategies for MDS/AML and MM, through an integrative genomic and proteomic approach.
Contents
Foreword 8
1 Background 11
1.1 Myelodysplastic syndromes as the premalignant form of AML . . 11
1.2 Multiple Myeloma . . . 15
1.2.1 Targeting neoplastic plasmacells as paradigmatic approach 18 1.2.2 Multiple Myeloma bone disease . . . 22
1.3 Serotonin metabolism . . . 23
2 Methods 29 2.1 High-throughput genomic analysis: Affymetrix SNP 6.0 assay and CNV determination . . . 29
2.2 Metaphase Cytogenetics . . . 36
2.3 c-Cbl mutational status screening . . . 36
2.4 Multiplexed ex vivo assay for the detection of proteomic profile in MM . . . 37
2.5 The Reverse Phase Protein Microarray (RPMA) . . . 44
2.6 ELISA for detection of new markers in peripheral blood . . . 48
2.7 Statistics . . . 49
2.8 Ethics Statement . . . 50
3 Results 51 3.1 Accumulation of genomic aberrations in MDS during progression to AML . . . 51
CONTENTS
3.1.1 Small copy number abnormalities (<1 Mb) . . . 52 3.1.2 Genes involved in progression to secondary AML in the
region 11q14.1 . . . 60 3.2 Modulation of MDS proteome by new epigenetic drugs . . . 61
3.2.1 Proteomic profile as a means for combination therapy in MDS . . . 62 3.3 Signal pathway proteomic analysis of MM bone marrow
microen-vironment . . . 67 3.3.1 Correlation between Protein Expression and Clinical
Find-ings . . . 67 3.3.2 Baseline profile of plasmacells . . . 69 3.4 Proteomic changes after ex vivo treatment of bone marrow as a
whole . . . 73 3.5 Role of serotonin in MM . . . 80 3.6 Discussion of the results . . . 84
4 Conclusion and Future Perspectives 89
List of Abbreviations
AML Acute Myeloid Leukemia
BM Bone Marrow
bp base pairs
CNA Copy Number Aberrations
CNV Copy Number Variations
Dx Diagnosis
HDAC Histone deacetylases
HSC Hematopoietic Stem Cell
MAPD Median Absolute Pairwise Difference
MC Methaphase Cytogenetics
MDS Myelodysplasia
MGUS Monoclonal Gammopathy of Unknown Significance
MM Multiple Myeloma
NK-AML Normal Karyotype AML
QC Quality Control
R Remission
RPMA Reverse Phase Micro Array
SD Standard Deviation
SERT Serotonin Transporter
Foreword
Over the last three decades, more comprehensive sequencing of the genome, bet-ter and fasbet-ter bioinformatics systems have played a role in developing -omics (proteomics, genomics, metabolomics, secretomics and so on) into a powerful suite of analytical tools. Faced with the avalanche of genomic sequences and data on messenger RNA expression, biological scientists have piles of informa-tion generated by the new array methods to synthesize into useful knowledge, opening the new era of ’functional genomics’.
Although the genome provides information about the somatic genetic changes existing in the tissue and underpins pathology, it is the proteins that do the work of the cell and are functionally responsible for almost all disease processes. Particularly, cancer can be considered as a deranged cellular protein molecular network. Cell-signaling pathways contain a large and growing collection of drug targets, governing cellular survival, proliferation, invasion, and cell death, with a unique and differential profile in neoplastic and non neoplastic cells that can be followed as new class of biomarkers.
Currently, therapeutics is chosen based on population-based clinical trials us-ing broad phenotypic analysis. Targeted approaches attempt to group patients based on larger histologic context (e.g. HER2 positivity in breast cancers) or mutational status of specific endpoints such as in the choice of second gener-ation inhibitor of tyrosin kinase in chronic myelogenous leukaemia (CML). In view of the growing recognition of the individuality of diseases such as cancer, where each patient appears to possess a unique constellation of molecular de-rangements in their diseased cells and unique constitutional properties of their
Foreword
non- diseased cells, a new opportunity exists to develop approaches and methods whereby each patient acts as his or her own ”clinical trial”.
In the last 5 years new drugs (lenalidomide, Azacitidine, bortezomib) have been developed for hematological malignancies, able of modulating both neo-plastic and microenvironment cells, and the impaired immunological context. For Multiple Myeloma (MM), Food and Drug Administration has approved lenalidomide and bortezomib based on the rapid translation of basic science to clinical medicine, and at least other 20 compounds are under investigation in phase 2-3 clinical trials. After CML and tyrosine kinase inhibitors, MM is a model disease for the development of novel therapeutic agents tested for their abilities to control at the same time both neoplastic and surrounding microen-vironment cells.
In this dissertation we have chosen two paradigmatic models to apply the translational meaning of functional genomics: a myeloid disorder, represented by myelodysplasia (MDS) and its potential evolution to frank acute myeloid leukaemia (AML), and the lymphoproliferative set of monoclonal gammopathies (basically monoclonal gammopathy of unknown significance, MGUS up to evo-lution to multiple myeloma, MM). In fact, they are two excellent examples of incurable disease, with poor prognosis despite of the availability of new drugs, affecting progressively more and more subjects, being typical in the elder pop-ulation.
For MDS/AML we privileged a genomic approach, showing that the new generation of SNP arrays can provide new insights in the pathogenesis, reveal-ing areas of genomic instability, whose magnitude is responsible of progression, as we showed in the samples obtained from one MDS patient refractory to the new drugs lenalidomide and Azacitidine progressed to frank secondary AML. Treatment with an epigenetic drug, such as Vidaza, modifies protein expression in unpredictable pathways, suggesting the importance of integrating information at different level that can help to explain new compensatory pathways and reac-tions. On the other hand, primary AML with normal karyotype at conventional approach showed a pretty stable genome even when analyzed with the SNP
Foreword
arrays, suggesting a different pathological mode, with key smaller alterations sustaining the selective advantage of the neoplastic clone.
For MGUS/MM we focused on the proteomic approach, being a large and contradictory literature on its genomics. We considered two kind of samples: core biopsy, with the bone and bone marrow in toto in order to have a baseline profile of active networks at neat, and cells obtained from the bone marrow aspirate (plasmacells vs microenvironment cells), studying the modulation of main pathways before and after treatment ex vivo with different classes of drugs. In chapter 1 we indicate the background and main aims that have led our work; in chapter 2 we provide details about the methods selected and clinical features of patients involved in our research. Results are reported and discussed in chapter 3. Data included in this dissertation have already been partially published in 3 different papers, have been included in 2 patents and three more manuscripts are in preparation.
Chapter 1
Background
1.1
Myelodysplastic syndromes as the
premalig-nant form of AML
Myelodysplastic syndromes (MDS) are a group of heterogeneous clinical condi-tions characterized by a hyperproliferative bone marrow, reflective of ineffective hematopoiesis, and accompanied by one or more peripheral blood cytopenias (anemia, piastrinopenia, neutropenia). The resulting bone marrow failure leads to death from bleeding and infection in the majority, while the transformation to acute leukaemia occurs in up to 40% of patients [1]. Despite a normal or hyper-cellular marrow, most patients show peripheral blood cytopenias, consequence of an excessive programmed cell death or apoptosis of hematopoietic progen-itors. Apoptosis in early disease may represent a pathophysiological mecha-nism whereby the hematopoietic system is able to abrogate defective and/or potentially harmful clones [2, 3]. Alternatively, an early hit in the multi step pathogenesis of MDS could give rise to a clone with a proliferative advantage. Increased apoptosis may thus represent a homeostatic process to control cell numbers. In turn, leukemic progression arises through the acquisition of genetic lesions that either block programmed cell death or promote proliferation over and above apoptosis [4]. The syndrome appears to represent a spectrum, where
CHAPTER 1. BACKGROUND
the initial lesion in the genome, though clinically undetectable, subsequently evolves with the acquisition of additional lesions to a state of frank neoplasia [5]. The evolution of the disease proceeds in accordance with the multi-step theory of carcinogenesis and can thus serve as an important model in furthering our understanding of the processes involved in cancer transformation [6]. The most common chromosomal abnormalities in MDS are represented by a deletion of the long arm of chromosome 5 (del(5q)) or chromosome 7 (del(7q)), with a WHO-estimated frequency of 10 % and 50 % in therapy-related myelodisplas-tic syndromes [6]. Gondek [7] reported that SNP array karyotyping allows to detect 25-50% of clonal cells carrying abnormal karyotypes. Moreover, they demonstrated that new lesions were discovered by molecular cytogenetics and confirmed that these alterations are exclusively of somatic nature in patients with MDS, myelodysplastic/myeloproliferative disease (MDS/MPD), or MDS-derived acute myeloid leukaemia (MDS/AML). These lesions comprise copy nun-mber variations and loss of heterozigosity (LOH) in 6p21.2-pter, 11q13.5-qter, 4q23-qter and 7q11.23-qter. The recognition of epigenetic changes in DNA struc-ture in MDS [8] has explained the success of two of three commercially available medications approved by the U.S. Food and Drug Administration to treat MDS [9]. Proper DNA methylation is critical in the regulation of proliferation genes, and the loss of DNA methylation control can lead to uncontrolled cell growth, and cytopenias. The recently approved DNA methyltransferase inhibitors take advantage of this mechanism by creating a more orderly DNA methylation pro-file in the hematopoietic stem cell nucleus, and thereby restore normal blood counts and retard the progression of MDS to acute leukaemia. However, the molecular basis for this outcome is unclear as the exact gene targets for the drugs have not been identified yet. Potential target genes are those of the p53 family, affecting cell differentiation and apoptosis, or the p21 and p18 genes affecting the behavior of stem cells. It is also unknown whether these drugs exert their effect by restoring gene expression and blast cell differentiation or by induction of apoptosis [10]. Moreover, the overall survival benefit observed with 5-azacitidine can be independent from the baseline methylation status
CHAPTER 1. BACKGROUND
[10, 11]. Thus, the effects of these agents are not necessarily mediated by their hypomethylating features but might be exerted through non-hypomethylating pathways as well. However, there was no difference in freedom from RBC trans-fusions between patients receiving these treatments and patients treated with conventional care. This could be explained by limited data, since only two trials reported this outcome [10].
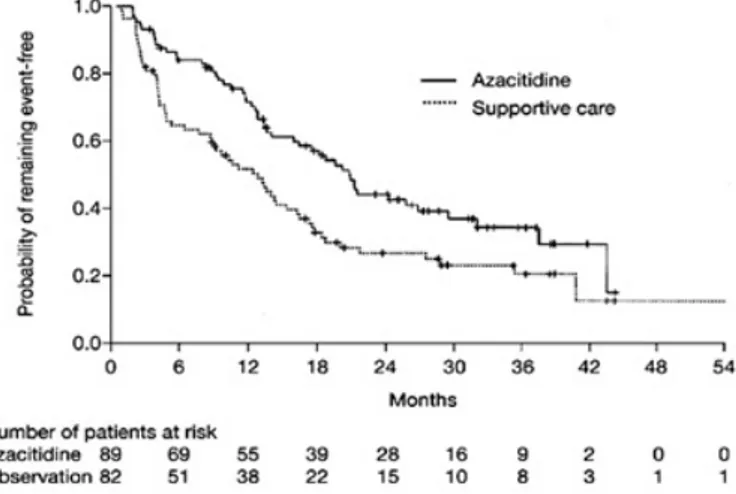
Despite recent advances in the comprehension of pathological mechanisms, progress has been slow with regard to treatment [9]. Five-year disease-free survival rates range from less than10% to 60% for specific risk groups [6]. Support-ive care, with blood product support and hematopoietic growth factors (e.g. erythropoietin), remains the standard of treatment. In fact, the global clinical strategy takes into account the control of symptoms, improve quality of life, improve overall survival, and decrease/retard the progression to acute myeloge-nous leukaemia. The only treatment with a curative potential is allogeneic stem cell transplantation [12], particularly in younger patients (i.e. less than 45 years of age) or in more severely affected patients. However, in the majority of pa-tients, this treatment is not applicable, mainly due to the age of the recipients and co-morbidity. Success of bone marrow transplantation has been found to correlate with severity of MDS as determined by the IPSS score, with patients having a more favorable IPSS score tending to have a more favorable outcome with transplantation. A concrete alternative is the chemotherapy with the novel agents: hypomethylating agents 5-Azacitidine (introduced in ’60s but never ap-proved by FDA for treatment of AML) and its deoxy-derivative decitabine, 10-fold more potent in vitro [9, 10]. However the real advantage for our patients is limited: Azacitidine, but not Decitabine [13], significantly prevents or delays transformation to AML and significantly prolongs AML-free survival globally in high risk- MDS [14]. The larger phase randomized phase III study (CALGB 9221) showed responses in patients with all MDS FAB subtypes. The overall response rates in patients treated with Azacitidine versus those given the best supportive care (BSC) were 60% versus 5% (p<0.0001), with a median response duration of 14 months. The median time to initial response was 64 days and
PhD in Stem Cells, by A. Romano 13
Alessandra
Romano
Digitally signed by Alessandra Romano DN: cn=Alessandra Romano, c=US Date: 2010.12.08 11:29:27 -05'00' Reason: I am the author of this document Signature Not VerifiedCHAPTER 1. BACKGROUND
that to best response was 93 days. The median time to AML or death was 21 months in patients receiving Azacitidine, compared with 12 months in patients receiving BSC (p = 0.007; Fig.1.1). Transformation to AML as the first event occurred in 38% of those patients in the BSC group, as compared with 15% for those in the Azacitidine group. Overall, patients treated with Azacitidine survived longer than patients receiving supportive care (a median of 20 months versus 14 months, p = .01) [15].
Fig. 1.1: Median time to transformation to acute myeloid leukaemia or death in patients with myelodysplastic syndrome treated with azacitidine or given best supportive care, as reported
in [14]
.
Compared to conventional care, treatment with hypomethylating agents and specifically 5-azacitidine, prolongs overall survival and time to AML transfor-mation or death, despite increased treatment-related mortality and lack of dif-ference in early mortality [10, 16, 17, 15]. Azacitidine is listed as the preferred drug for high-risk MDS patients, and decitabine is listed as an alternative in the 2009 National Comprehensive Cancer Network guidelines, on the basis of survival data [18]. Nevertheless, there is still some uncertainty over some issues such as which drug to choose, which patients to treat, and how long to continue treatment.
CHAPTER 1. BACKGROUND
1.2
Multiple Myeloma
Multiple myeloma (MM) is the second most prevalent hematological cancer, with over than 55,000 new cases diagnosed in USA each year [19]. MM and the monoclonal gammopathy of undetermined significance (MGUS) are character-ized by proliferation of clonal B lymphocytes at various stages of maturation in the bone marrow (BM). Despite significant advances in therapy, MM is still an incurable disease: remissions are seldom sustained, the median survival ranges from 2-3 years for high risk MM to better than 5 years for low risk patients [20]. While this suggests the existence of different biologically defined subgroups, the knowledge about such biological differences is still limited.
Many experimental observations support the hypothesis that MM evolves through a multi-step transformation process: an inactive phase in which tumor cells are non-proliferating mature plasma cells, an active phase with a small percentage (<1%) of proliferating plasmablastic cells, and a fulminant phase with the frequent occurrence of extramedullary proliferation and an increase in plasmablastic cells [21].
The malignant plasma cells in MM are localized in the bone marrow (BM) in close association with stromal cells, and are rarely found in other locations. They are long-lived cells with a very low labeling index (LI= 1% to 2%) and a significantly lower rate of immunoglubulin secretion than the normal coun-terpart. It appears that the critical oncogenic events in MM cells either occur after or do not interfere with most of the normal differentiation process involved in generating a long-lived plasma cell [21]. Interaction of MM cells with bone marrow microenvironment cells has a pathogenetic role in the disease and con-fers tumor cell resistance to conventional therapies. Understanding molecular mechanisms triggered by tumor-microenvironment interactions plays a key role to envelop new treatment options and improve response quality [22].
The proliferation, differentiation, and function of lympho-hematopoietic cells are regulated by a complex network of lympho-hematopoietic growth factors and cell surface molecules which establish a fine-tuned communication between stroma cells and lympho-hematopoietic precursors in the BM. The cytokines
PhD in Stem Cells, by A. Romano 15
Alessandra
Romano
Digitally signed by Alessandra Romano DN: cn=Alessandra Romano, c=US Date: 2010.12.08 11:30:24 -05'00' Signature Not VerifiedCHAPTER 1. BACKGROUND
involved in MM pathogenesis are similar to those mediating the proliferation of normal early plasma cells (plasmablastic cells), and their differentiation to mature plasma cells (plasmacytic cells), such as IL-6 or IL-10.
IL-6 has a well defined role in sustaining and progression MM primarily through Bcl-XL and the Ras-mitogen-activated protein kinase (MAPK) cascade [23, 24]. Using IL-6-dependent murine B9 hybridoma/ plasmacytoma cells it has been showed that [25]:
1. drug-mediated reversible G1 arrest triggered apoptosis despite the pres-ence of IL-6;
2. short IL-6 pulse to G1-arrested cells was sufficient to induce S phase entry and prevent apoptosis;
3. phorbol ester and related derivatives promoted S phase entry and survival of IL-6-starved cells without up-regulating bcl-XL expression.
IL-10 is also a growth factor for MM cells, because it enhances the prolifer-ation of freshly explanted myeloma cells in short-term BM culture and supports the growth of myeloma cell lines [21]. IL-10 has inhibitory effects on the pro-duction of IL-6 by MM cells; therefore, its effects are probably not mediated by IL-6. More likely, IL-10 enhances the responsiveness of MM cells by regulating the expression of other cytokines and cytokine receptors [26]. Levels of IL 10 correlate with active disease, since patients in remission have a normalization of IL 10 levels in their bone marrow [27].
Tumor necrosis factor (α TNF-α) is the most potent inducer of NFkB acti-vation and IL-6 secretion from bone marrow microenvironment cells produced by neoplastic plasmacells, although it is not involved in mediating growth or drug resistance [28, 29]. However, circulating TNF-α levels are higher in MM patients with overt bone disease [29].
The NFkB family of transcription factors is composed by an array of homo-and heterodimers (containing p50, p52, c-Rel, p65/RelA, homo-and RelB), held in the cytoplasm of most normal cells as an inactive latent form by specific inhibitor proteins (IkB). Part of NFkB’s importance in regulating cellular responses is
CHAPTER 1. BACKGROUND
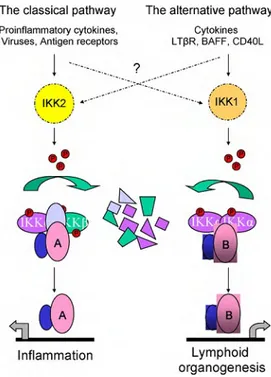
that it belongs to the category of rapid-acting primary transcription factors, i.e., transcription factors that are present in cells in an inactive state and do not require new protein synthesis to be activated (other members of this fam-ily include transcription factors such as c-Jun, STATs, and nuclear hormone receptors). This allows NFkB to act as a first responder to harmful cellular stimuli. Stimulation of a wide variety of cell-surface receptors, such as RANK, TNFR, leads directly to NFkB activation and fairly rapid changes in gene ex-pression [30, 31, 32]. Two major pathways, the classical and the alternative one, summarised in fig. 1.2, lead to the activation of NFkB: in both cases the activa-tion can be effectively blocked by proteasome inhibitors, which interrupt NFkB translocation from the cytoplasm to the nucleus by inhibiting degradation of IkB proteins. This mechanism has been demonstrated in different malignan-cies, where NFkB is aberrantly activated and contributes to the drug resistance [33].
However, Romano et al. [33] and Hideshima et al. [34, 35] recently demon-strated that blocking of IkB degradation is not the only mechanism responsi-ble for proteasome inhibitor-induced apoptosis and for the proven clinical ac-tivity of Bortezomib. Using human MM cell lines and primary tumor speci-mens, Hideshima showed that Bortezomib actually activates 2 upstream NF-kBactivating kinases (RIP2 and IKK), promotes down-regulation of NFkB’s inhibitor (IkB), and increases NFkB DNA binding in vitro. Another struc-turally unrelated proteasome inhibitor (lactacystin) induces the same effects, strongly suggesting that NFkB activation is an on-target effect of the drug. If NFkB inhibition is not involved in bortezomib’s cytotoxic effects,the cell death results from protein build-up and aggregation, as is the case in neurodegen-erative diseases. In this model, the high levels of immunoglobulin production and ER-Golgi protein transport would sensitize MM cells to proteotoxic stress, providing an attractive explanation for bortezomib’s clinical activity and a po-tential means of identifying bortezomib-based combination approaches that will display even greater antitumor effects.
CHAPTER 1. BACKGROUND
Fig. 1.2: Crosstalk between canonical and non-canonical signalling pathways is of current research interest. The so-called classical/canonical NFkB pathway is triggered by many
in-flammatory stimuli to induce IKK2-containing IKK complexes that specifically phosphorylate
the three canonical IkB proteins, thereby marking them for ubiquitination and proteasome-mediated proteolysis. Cytoplasmic RelA (A) as well as cRel-containing dimers are thereby
released to translocate to the nucleus and activate genesmainly involved in inflammatory
pro-cesses. The alternative/non-canonical pathway is mediated by IKK1, is strictly dependent on
IKK homodimers and is activated by lymphotoxin receptor (LTR), B cell-activating factor belonging to the TNF family (BAFF), and CD40 ligand (CD40L). This pathway induces the
release of RelB (B)- containing dimers to the nucleuswhere NFkB plays a central role in the
expression of genes involved in development and maintenance of secondary lymphoid organs. Adapted from [33].
1.2.1
Targeting neoplastic plasmacells as paradigmatic
approach
Most of the commonly used anti-cancer drugs included in MM chemother-apy protocols non-specifically target fundamental cellular processes of DNA metabolism and cell division, like alkylants, complicating efforts to elucidate specific molecular determinants of differential treatment response. The
emerg-PhD in Stem Cells, by A. Romano 18
Alessandra Romano
Digitally signed by Alessandra Romano
CHAPTER 1. BACKGROUND
ing use of ’rationally targeted’ agents, which disrupt specific oncogenic signaling processes, has provided an opportunity to elucidate the molecular basis for dif-ferential clinical sensitivity and, possibly, to implement strategies that match individual patients with cancer to specific drug therapies to which they are more likely to respond. In the last five years, novel therapeutic agents, such as bortezomib and lenalidomide, have showed exciting activity in vitro and in vivo, moving so rapidly from the bench to the bedside to be already included in pivotal phase III trials up to being the backbone of MM clinical management [22, 28, 36]. Nowadays, the major challenge facing clinicians is to determine which combination of drugs will prove to be the most effective and result in a cure, even if a personalized approach is probably needed.
Steroids Glucocorticoids (GCs) are involved in physiological regulation of a variety of processes, including immune responses, metabolism, cell growth, and development. Their therapeutic value is enormous, in a wide range of au-toimmune/inflammatory diseases, and GCs have been widely used since the late 1940s for treating autoimmune disorders, allergy, allograft rejection, and euplastic diseases. Their therapeutic activity reflects the physiological effects of endogenous steroids, although with greater potency and efficacy. Among these effects, GC-mediated inhibition of cell proliferation and modulation of apopto-sis, which is either induced or inhibited-have considerable biological and clinical significance. Indeed, modulation of apoptosis and proliferation has been im-plicated in GC regulation of immune development and provides grounds for the inclusion of GCs in treatment regimens of lymphoid malignancies [37]. In autoimmune/inflammatory diseases, inhibition of apoptosis may result in failure of GC therapy or even in disease worsening. Resistance to GC ther-apy, often because of resistance to GC-induced apoptosis, is a major clinical problem in hematopoietic malignancies and inflammatory/autoimmune diseases [38, 39, 40]. GCs induce their effects mainly through transcriptional regulation of glucocorticoid-receptor (GR) target genes: the activated GR complex up-regulates the expression of anti-inflammatory proteins in the nucleus (a process
CHAPTER 1. BACKGROUND
known as transactivation), such as annexin-1, MAPK, phosphatase 1, IkB,IL-10 and represses the expression of pro-inflammatory proteins in the cytosol by preventing the translocation of other transcription factors from the cytosol into the nucleus (transrepression). In addition, GR mediates GC effects indirectly through protein-protein interactions with other transcription factors, cofactors, regulators, and signaling proteins, such as members of STAT family, NFkB, ac-tivator protein-1 (AP-1), 14-3-3, and Raf-1 protein. Moreover, nongenomic GR-dependent effects are known to contribute to the modulation of signal transduc-tion pathways. As an example, GC-activated apoptosis of murine thymocytes requires both genomic and nongenomic signals. Dexamethasone (DEX) treat-ment of thymocytes first causes release of the dimeric complex GR-associated Src kinase (Src)/phosphatidylinositol-specific phospholipase C (PI-PLC) from the multimeric complex, including GR and HSP-90, and it then results in PI-PLC phosphorylation and activation, acidic sphingomyelinase (aSMase) activation, and ceramide production, which, in turn, regulates both gene transcription and caspase-8 activation [41]. GCs are an integral component of many regimens of MM chemotherapy. However, after an initial response, most patients acquire resistance [42]. This phenomena have been attributed to point mutations in the GR gene, to the expression of HBD (hormon binding domain)-deficient isoforms and to decreased GR expression [43, 44]. For this reason steroids are used in a pulsed way(for example only 4 days/month or week to avoid the continue exposure and the receptors downregulation). However, a unique theory able of explaining steroid refractariety has not been achieved.
Lenalidomide IMiDs (Immuno Modulatory Drugs) CC-5013 (Revlimid TM, Lenalidomide) and CC-4047 (ActimidTM, Pomalidomide) are a series of synthetic compounds derived using structural modifications of glutamic acid derivative (Thalidomide) with anti-angiogenic properties and potent anti-inflammatory effects owing to its anti-TNF-α activity [36, 28]. Research into the mechanism of action of Thalidomide revealed an immunological and immunomodulatory basis for the effect, notably inhibition of denovo IgM antibody synthesis, by
CHAPTER 1. BACKGROUND
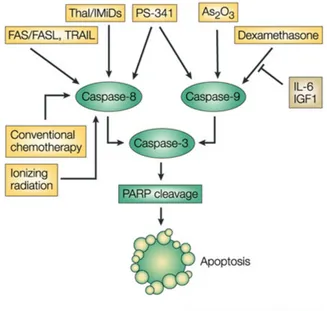
possibly affecting the macrophages, B-cells, helper or suppressor lymphocytes, decreasing TNF-α synthesis and modulating the T cell subsets by increasing the T-helper population after therapy [45, 46]. Lenalidomide has been shown to inhibit production of pro inflammatory cytokines TNF-α, IL-1, IL-6, IL-12 and elevate the production of anti-inflammatory cytokine IL-10 from human peripheral blood mononuclear cells (PBMCs). The downregulation of TNF-α secretion is particularly striking and is up to 50,000 times more when compared to thalidomide [47]. Although the precise mechanism of TNF-α down regula-tion by lenalidomide is not known, it is likely related to a transcripregula-tional effect, similarly to that observed with thalidomide, able of increasing the degradation of TNF-α mRNA. Effects on apoptosis in MM cells is secondary to increased potentiation of TNF-elated Apoptosis inducing ligand (TRAIL), inhibition of apoptosis protein-2, increased sensitivity to Fas mediated cell death, and up reg-ulation of caspase-8 activation, down regreg-ulation of caspase-8 inhibitors (FLIP, cIAP2), down regulation of NFkB activity and inhibition of pro survival effects of IGF-1. The synergic effect of old and new drugs can be explained by their different abilities to trigger apoptosis in neoplastic plasmacells involving differ-ent targets: IMiDs predominantly trigger caspase-8 apoptotic signaling, while dexamethasone uses caspase-9-mediated cell killing (as summarised in fig.1.3).
Bortezomib The dipeptide boronic acid Bortezomib (formerly, PS-341; marketed as Velcade by Millennium Pharmaceuticals) is the first-in-class pro-teasome inhibitor of 26S propro-teasome activity. Bortezomib acts directly on MM cells to induce apoptosis of MM cells resistant to known conventional therapies, overcomes the protective effects of IL-6, and adds to the anti-MM effects of dexamethasone (fig.1.3) by affecting cytokine circuits, cell adhesion and angio-genesis in BM microenvironment [28]. However, there are several experimental evidences that Bortezomib may also act to switch mechanisms different from the simple inhibition of NFkB and it is not clear if there is a correlation between the NFkB status and the response to Bortezomib [33, 35].
CHAPTER 1. BACKGROUND
Fig. 1.3: Ionizing radiation, conventional chemotherapy, FAS/FASL, TRAIL and
thalido-mide/IMiDs trigger 8 activation, whereas As2O3 and dexamethasone trigger caspase-9 activation. Bortezomib induces both the caspase-8 and caspase-9 apoptotic pathways.
Interleukin-6 (IL-6) and insulin-like growth-factor 1 (IGF1) activate the
phosphatidylinosi-tol 3-kinase (PI3K)/AKT cascade, which inhibits caspase-9/caspase-3 apoptotic signalling. IMiDs, immunomodulatory derivatives; PARP, poly-(ADP-ribose) polymerase; TRAIL,
tu-mour necrosis factor TNF-related apoptosis-inducing ligand. Adapted from [47].
1.2.2
Multiple Myeloma bone disease
Bone disease is a mjor cause of morbidity in MM and results in many of the debilitating features of the disease, with high impact on the overall quality of life of our patients. In some series, more than 50% presented vertebre fractures and up to 30% with non vertebral fractures, 60% generalized osteopenia, of which 5% without associated lytic lesions [48, 49].
The integrity of the skeleton, including its initial morphogenesis and the bone remodeling that occurs throughout life, requires the coordinated regula-tion and activity of bone-forming cells (osteoblasts) and bone-resorbing cells (osteoclasts). Disregulated activities between the 2 cell types can result in se-vere skeletal abnormalities, characterized by either decreased or increased bone mass. The number of active osteoclasts is determined by the net result of
dif-CHAPTER 1. BACKGROUND
ferentiation and fusion of osteoclast precursors and by the loss of osteoclasts through apoptosis. An increase in active osteoclast pool size, with increased bone resorption and decreased bone mass, occurs in many osteopathic disorders, including postmenopausal osteoporosis, Paget’s disease, lytic bone metastases and MM related bone disease.
In effects, MM-related bone disease is consequent to an uncoupled osteoblast inactivation and osteoclast activation adjacent to tumor foci within bone. His-tologic studies of bone biopsies show that increased osteoclast activity occurs adjacent to MM cells, including aberrancies in genome and acquired mutations, as consequence of either contact or secretion of growth factors [50]. There is a vicious cycle in which the bone resorptive process releases growth factors that increase MM tumor burden that in turn results in increased bone destruction. In addition, adhesive interaction between MM cells and cells of the bone marrow microenvironment result in production of factors, which also increase angiogen-esis and make the cells more chemotherapy rangiogen-esistant [51].
1.3
Serotonin metabolism
The monoamine serotonin [5-hydroxytryptamine (5- HT)] is found in the cen-tral nervous system, gastrointestinal tract, and blood with broad physiological functions.
As a neurotransmitter it is involved in cognition, feeding behavior, mood, anxiety, aggression and pain, sexual activity, sleep, and other body rhythms; playing as hormone serotonin regulates vascular tone and intestinal activity. These actions are mediated through interaction with membrane-bound recep-tors, which are categorized into 7 families (5HT1-7) with at least 21 subtypes [52, 53]. Overall, serotonin receptors are coupled to G-proteins with the ex-ception of 5HT3, which is an ionotropic receptor [53], for example 5-HT may increase IL-6 production by stimulating 5-HT2BR [54].
Non-receptor-mediated serotonin mechanisms of action have been described as well. For example, in neuronal cells oxidative metabolism of the monoamines
CHAPTER 1. BACKGROUND
has been implicated in apoptosis [55]. In immune cells, a serotonin-associated induction of apoptosis depends on the uptake of serotonin (via 5-HT trans-porters) independent of intracellular oxidative transformation [56] and can be modulated by selective serotonin reuptake inhibitors [57].
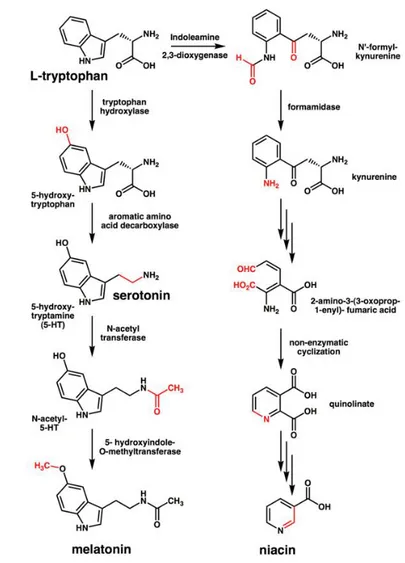
Serotonin is the product of a multistep metabolic pathway showed in fig. 1.4).
Fig. 1.4: The metabolic pathway of serotonin synthesis. Explanation in the text and reviewed
in [58]
.
Serotonin is synthesized from the amino acid L-tryptophan, an essential am-minoacid that can cross membrane thanks to non specific transporter LAT-1,
CHAPTER 1. BACKGROUND
by two enzymes: amino acid decarboxylase (DDC) and tryptophan hydroxylase (TPH) [58]. Although decarboxylase activity is ubiquitous in peripheral tissues, the reaction catalysed by TPH is the rate-limiting step. TPH has been shown to exist in two forms: the brain-specific isoform TPH2 [59] and the peripheral one TPH1. Serotonin released into the blood is actively taken up by platelets and stored in their solid granules; there is active uptake of serotonin by lympho-cytes via serotonin transporters [60], aberrantly expressed universally in B-cell neoplasms [61]. Plasma serotonin is cleared by the liver and lung endothelial cells, where serotonin is stored in vesicles until released or converted (by deam-ination) into 5-hydroxyindoleacetaldehyde through the action of mitochondrial monoaminooxidase (MAO). In turn, 5-hydroxyindoleacetaldehyde may be oxi-dized to 5-hydroxyindole acetic acid, by aldehyde dehydrogenase, or reduced to 5-hydroxytryptophol, by alcohol dehydrogenase.
Extracellular levels of 5-HT are determined by the 5-HT transporter (5-HTT or SERT, coded by the gene SCL6A4), which is involved in the uptake and clearance of extracellular 5-HT. Serotonin itself does not cross the blood-brain barrier, differently from its precursors tryptophan 5-hydroxytryptophan (5-HTP) that can and do cross the blood-brain barrier. Platelets serve as the major reservoir of serotonin in the bloodstream and the treatment with Selec-tive Serotonin Uptake Inhibitors (SSRIs) dramatically reduces platelet serotonin concentrations [62]. When activated, platelets release serotonin into the blood-stream where it acts as a powerful vasoconstrictor. Thus, 2 serotonin systems exist: one known as brain-derived serotonin system (BDSS), active at level of central nervous system and one peripheral, mainly under the control of platelet-derived serotonin (PDSS), both under control of tryptophan availability and TPH1 activity.
Under physiological conditions, TPH1 expression is limited to a few special-ized tissues: raphe neurons, pinealocytes, mast cells, mononuclear leukocytes, beta-cells of the islets of Langerhans, and intestinal and pancreatic enterochro-maffin cells [63]. However several solid cancer cell types (breast, lung, cholan-giocarcinoma)show an aberrant expression of TPH1 [64]. Similarly, LAT-1 is
CHAPTER 1. BACKGROUND
overexpressed in cancer cells [65], and more in general serotonin system seems to be involved in cancer progression and metastasis. Role for serotonin in car-cinogenesis [64] has been reported in skin [66], breast [65], lung [67], prostate [68], and colon cancer [69]. In a fascinating working model, tumour progression could be substained acquire genetic or epigenetic alterations in 5-HT signaling which then make them resistant to suppressive 5-HT actions and favor tumor-promoting actions (e.g., dynamic cell junctions and cell shedding), as well as acquisition of new receptors and functions (e.g., stimulated proliferation and epithelial-mesenchymal transition), in a similar way proposed for the TGF-β, as shown in Fig.1.5.
Fig. 1.5: Double behavior of Serotonin in promoting cancer, from [65]
In cancer progression, the amminoacid metabolism changes. In several solid cancers [70], the tumour metabolism is supported by the recruitment and en-hanced expression of neutral amino acid transporters, included LAT-1 and 4F2hc, following the induction of aberrant growth factors receptors present on the membrane [71] and regulated by mTOR activation status. For example, in vascular smooth muscle the induction of LAT1 by PDGF was dependent on mTOR activity and de novo RNA and protein synthesis [72]. In a murine T-cell
CHAPTER 1. BACKGROUND
line, growth factor withdrawal led to the endocytosis of CD98 and other nu-trient transporters; however, the growth factor requirement was circumvented by expression of a constitutively active Akt isoform, whose maintenance of cell surface 4F2hc was rapamycin-sensitive, implicating mTOR role [73]. Another group, using microarray analysis to study lymphoma cells, confirmed that ra-pamycin treatment selectively downregulates LAT1 and 4F2hc[74].
With respect to the mechanism of bone loss from sympathetic activity, acti-vated adrenergic receptors on osteoblasts suppress critical transcription factors necessary for bone formation but also enhance osteoclastogenesis, principally by up-regulating the osteoclast differentiation factor RANKL. This is not a diver-sion of osteoblasts to osteoclasts, but rather a dynamic process of coupling that involves two cell types originating from distinct progenitor cells.
The brainstem-derived serotonin (BDS) favors bone mass accrual following its binding to Htr2c receptors on ventromedial hypothalamic neurons. Leptin inhibits these functions and increases energy expenditure because it reduces serotonin synthesis and firing of serotonergic neurons. This pathway is coun-terbalanced by noradrenalin at level of neurological synapses of the bone, as showed in figure 1.6 and reviewed in [75, 76].
Immunoglobulins have been shown to induce platelet release a) when partici-pating in immune reactions as antigen-antibody complexes or b) by nonimmune mechanisms such as coating of glass or polymethylmethacrylate beads. More in-terestingly, aggregated immunoglobulins of all the IgG subclasses, isolated from healthy controls or myeloma patients, induce platelet release in the absence of antigen or particulate matter, in a dose dependent manner [78].
The concentration of serum tryptophan, quinolinic acid, and serotonin was increased in the plasma, while that of tyrosine, dopamine, and noradrenaline was decreased in multiple myeloma [79].
No evidences have been reported until now about serotonin involvement in MM. Our group demonstered fort the first time increased levels of serotonin in bone.
CHAPTER 1. BACKGROUND
Chapter 2
Methods
2.1
High-throughput genomic analysis: Affymetrix
SNP 6.0 assay and CNV determination
Today, in addition to high resolution chromosome banding and advanced chro-mosomal imaging technologies, chromosome aberrations in cancer cells can be analyzed with an increasing number of large-scale, comprehensive genomic and molecular technologies such as fluorescence in situ hybridization (FISH), spec-tral karyotyping (SKY), comparative genomic hybridization (CGH), and other high-throughput methods. Among them, array-based karyotyping can be done with several different platforms, both laboratory-developed and commercial [80]. The arrays themselves can be genome-wide(probes distributed over the en-tire genome) or targeted (probes for genomic regions known to be involved in a specific disease) or a combination of both. Arrays used for karyotyping may use non-polymorphic probes, polymorphic probes (i.e., SNP-containing), or a combi-nation of both. Non-polymorphic probes can provide only copy number informa-tion, while SNP arrays can provide both copy number and loss-of-heterozygosity (LOH) status in one assay. The probe types used for non-polymorphic arrays in-clude cDNA, BAC clones (e.g., BlueGnome), and oligonucleotides (e.g., Agilent, Santa Clara, CA, USA or Nimblegen, Madison, WI, USA).CHAPTER 2. METHODS
Commercially available oligonucleotide SNP arrays can be solid phase (Affymetrix, Santa Clara, CA, USA) or bead-based (Illumina, SanDiego, CA, USA). Despite the diversity of platforms, ultimately they all use genomic DNA from disrupted cells to recreate a high resolution karyotype in silico. The main applications of these technologies are the detection of copy number changes and evaluation LOH, Autozygous Segments, and Uniparental Disomy.
Detection of copy number changes
Copy number variations (CNVs) are segments of DNA physiologically present in the normal population at a variable copy number in comparison with a ref-erence genome [81, 82, 83]. This broad definition for CNVs makes no refref-erence to the clinical impact of a given genomic imbalance and can be confusing for clinical genetists who have traditionally understood chromosomal ’variants’ as being alterations that are not clinically significant. Indeed, CNVs can have dra-matic phenotypic consequences as a result of altering gene dosage, disrupting coding sequences, or perturbing long-range gene regulation. For this reason, they are themselves potential predisposition factors in disease. Recent advances in genome-wide analysis of submicroscopic DNA segments (CNVs) may allow the identification of novel molecular tumor-associated abnormalities in the nor-mal cytogenetics group (so-called somatic CNVs). Therefore, the term CNV is now used to describe copy number differences in studies of both disease and normal controls as well as imbalances that cause well-known microdeletion and microduplication syndromes [81, 84]. To minimize confusion, it may be justified to use qualifiers for the term ’CNV’ when discussing functional or clinical signifi-cance. The terms ’pathogenic CNV’, ’benign CNV’ or ’CNV of unknown clinical significance’ may be useful for this purpose. In this report we have chosen to call pathogenic CNV as somatic CNV, because they are present in pathologic tissue (e.g. exclusively at diagnosis) and not at remission, since we cannot es-tablish the real pathogenicity of our findings, while the others as germline CNV, probably related to susceptibility, detectable either at diagnosis as at remission. Human beings are diploid, so a normal copy number is always two for the
CHAPTER 2. METHODS
non-sex chromosomes:
• Gains and deletions. In tumour cells may represent the inactivation of a tumour suppressor gene, and may have diagnostic, prognostic, or ther-apeutic implications. A deletion is the loss of genetic material, either heterozygous (if copy number of 1) or homozygous (when copy number is 0, nullisomy). On the opposite, a copy number gain represents the gain of genetic material. If the gain is of just one additional copy of a segment of DNA, it may be called a duplication. If there is one extra copy of an entire chromosome, it may be called a trisomy;
• Amplifications. Technically, an amplification is a type of copy number gain in which there is a copy number 10. In the context of cancer bi-ology, amplifications are often seen in oncogenes. This could indicate a worse prognosis, help categorize the tumor, or indicate drug eligibility. An example of drug eligibility is Her2Neu amplification and Herceptin [85].
Evaluation of Loss of Heterozygosity (LOH), Autozygous Segments, and Uniparental Disomy
Autozygous segments and uniparental disomy (UPD) are diploid/’copy neutral’ genetic findings and therefore are only detectable by SNP-based arrays. Both autozygous segments and UPD show loss of heterozygosity (LOH) with a copy number of two by SNP array karyotyping.
• Autozygous segment. An autozygous segment is bi-parental and seen only in the germline. They are extended runs of homozygous markers in the genome, and they occur when an identical haplotype block is inherited from both parents. They are also called ’identical by descent’ (IBD) seg-ments, and they can be used for homozygosity mapping.
• Uniparental Disomy (UPD). UPD occurs when both copies of a gene or genomic region are inherited from the same parent. This is uniparental, in contrast to autozygous segments which are bi-parental. When present in the germline, they can be harmless or associated with disease, such as
CHAPTER 2. METHODS
Prader-Willi or Angelman syndromes. Also in contrast to autozygosity, UPD can develop in tumor cells, and this is referred to as acquired UPD or copy neutral LOH in the literature. Acquired UPD is quite common in both hematologic and solid tumors, and is reported to constitute 20 to 80% of the LOH seen in human tumors. Acquired UPD can serve as the second hit in the Knudson Two Hit Hypothesis of Tumorigenesis, and thus can be the biological equivalent of a deletion.
The Affymetrix SNP 6.0 array
In this work we present data obtained with the commercially available SNP 6.0 array, released by Affymetrix, based on oligonucleotide probes homologous to areas located throughout human genome. DNA probes are designed to distin-guish various genotypes, and their distribution is dictated by the location of the SNPs [86, 87]. Areas known to contain more SNPs can be better covered, whereas, as expected, the resolution within SNP deserts is poor.
The chip contains more than 1.8 million markers of genetic variation. Ap-proximately 482,000 SNPs are derived from the previous-generation Mapping 500K and SNP 5.0 Arrays. The remaining 424,000 SNPs include tag SNP mark-ers derived from the International HapMap Project, SNPs on chromosomes X and Y, mitochondrial SNPs, SNPs in recombination hotspots and new SNPs added to the dbSNP database after completion of the Mapping 500K Array. The array also contains 202,000 probes targeting 5,677 known regions of copy number variation from the Toronto Database of Genomic Variants. These re-gions resolve into 3,182 distinct, non-overlapping segments, each interrogated with an average of 61 probes. In addition to the interrogation of these regions of known copy number polymorphism, more than 744,000 probes were chosen, evenly spaced along the genome, to enable the detection of novel CNV. The median inter-marker distance taken over all 1.8 million SNP and copy number markers combined is less than 700 bases (680 bp).
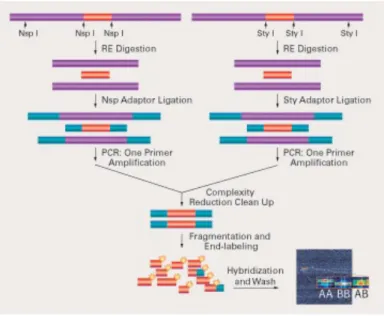
The protocol (schemed in figure 2.1) suggested by the manufacturer has been designed to improve the signal-to-noise ratio: DNA was first digested
CHAPTER 2. METHODS
with restriction enzymes, then ligated to adapters and amplified. During the PCR amplification only the smaller restriction fragments (up to about 1.2 kbp, 200-1100bp size range) were amplified, reducing the complexity (but also the representation) of DNA.
Fig. 2.1: Genotyping Mapping Assay Overview : probes are chosen from restriction
diges-tion fragments selected in order to reduce target complexity before labeling and hybridizadiges-tion.
The main stages are:
1. DNA extraction: Genomic DNA was extracted using the DNA Blood Mini kit (Qiagen, Valencia, CA, USA) from mononuclear cells isolated from bone marrow aspirate samples by Ficoll gradient centrifugation. DNA quantity and quality were assessed using the NanoDrop 1000 Spectropho-tometer (Thermo Scientific,) and for selected cases by agarose gel elec-trophoresis. The high quality DNA is a critical step, since PCR inhibitors, including high concentrations of heme (from blood) or chelating agents (i.e., EDTA) or salts, used to precipitate DNA during extraction, can interfere with the restriction enzymes of following steps;
2. Digestion: two aliquots of each DNA sample (5.00 uL at concentration of 50 ng/uL, totally 500 ng) were digested by two restriction enzymes, Nsp I
CHAPTER 2. METHODS
and Sty I, capable of recognising specific sequences (5’ RCATG Y 3’ and 5’C/CWWGG 3’ respectively) to obtain fragments in the 200 to 1,100 bp size range, compatible with the distribution of SNPs on the array in the human genome. With this approach, it is possible to obtain a set of fragments which guarantee a large coverage of the whole genome (70-80%), except telomers and centromers, characterised by a low SNPs rate; 3. Ligation: all fragments resulting from restriction enzyme digestion,
re-gardless of size, were ligated to two annealed oligonucleotides (which act as adaptators), capable of recognizing the cohesive 4 bp overhangs derived from Nsp l or Sty l restriction site. The key enzyme is the T4-DNA ligase, typical of bacteria infected by T4 phagus, which uses ATP as cofactor and can ligate only sharp extremities. This step is needed for the next PCR, so that a generic primer could recognize the adaptor sequence to amplify adaptor-ligated DNA fragments;
4. PCR: it was performed to select and amplify fragments, using a single primer with the TITANIUMTM DNA Amplification Kit (Clontech Lab-oratories, Inc. Montain View, CA). The reaction conditions have been optimized to preferentially amplify fragments in the 200 to 1,100 bp size range, which guarantee from 30% to 50% genome coverage. The fragments size range was confirmed by an agarose gel running;
5. Purification: PCR products were purified with Agencourt AMPure Mag-netic Beads (Agencourt Bioscience Corporation, Beverly, MA) and the amplicons were quantified using a NanoDrop-1000 spectrophotometer. 6. Labelling: fragmented PCR amplicons were end-labelled with a specific
proprietary biotin-labeled reagent by a Terminal Deoxynucleotidyl Trans-ferase for 4 hours and finally hybridized at 500C overnight (16-18 hours)in
a GeneChip Hybridization Oven 640 (Affymetrix, Inc.);
7. Washing: chips were washed for several minutes in decreasing salt buffers, stained and dried in a GeneChip Fluidics Station 450 (Affymetrix, Inc.).
CHAPTER 2. METHODS
Arrays were scanned with a GeneChip Scanner 3000 7G (Affymetrix, Inc.) and a raw file was generated for each of them. Data coming from scansion were analysed using Affymetrix Genotyping Console(GTC) version 3.0.1, which implements the novel genotype calling algorithm Birdseed, which performs a multiple-chip analysis to estimate signal intensity for each allele of each SNP, fitting probe-specific effects to increase precision. Anyway, the reduced com-plexity of the hybridization brings with it the possibility of amplification bias of different regions of the genome and detection of changes reflecting differences in restriction digestion patterns between individuals rather than in true copy number.
The following algorithms were used: 1) SNP 6.0 Birdseed v2 algorithm for genotyping; 2) BRLMM-P-Plus algorithm and Hidden Markov Model with re-gional GC correction for copy number analysis; 3) the LOH algorithm. As a quality control of the genotyping and copy number results Contrast QC value and Median Absolute Pairwise Difference (MAPD) were calculated as imple-mented in the GTC 3.0.1 software. The log2ratio between signal for each marker in each sample and the corresponding median value in a reference group (270 HapMap individuals) provided an estimate of copy number. The log2ratio has been smoothed using a Gaussian kernel to lower noise to improve per marker Signal to Noise ratio at the expense of blurring boundaries where copy number state changed. For each marker, the smooth was constructed using a weighted mean of the log2ratios of surrounding markers with weights proportional to the Gaussian transform of their genomic distance from that marker. The Gaussian transform had standard deviation equal to 50000. The allele difference value was evaluated as the difference of allele A signal and allele B signal each standard-ized with respect to their median values in the reference HapMap population. A script in Python was implemented in order to calculate the percentage of overlap between the segments revealed at diagnosis and those at remission and to identify tumor-associated somatic CNA.
CHAPTER 2. METHODS
2.2
Metaphase Cytogenetics
Cytogenetic analysis was performed on metaphase cells obtained from unstim-ulated 24 hours culture of patients bone marrow. Cells were treated with col-cemid for 1 hour, with hypotonic for thirty minutes and than fixed in methanol and acetic acid. Metaphase preparations were G-banded using standard trypsin method. The Karyotypic results were described according to the International System for Human Cytogenetic Nomenclature (ISCN 1995-2005). FISH was per-formed using a whole chromosome paint 8 (WCP) probe (Cambio, U.K.) and a two color, two fusion traslocation probe t(15;17) (Cancer Genetic, Inc., Ruther-ford, NJ). Co-denaturation was performed for 5 min at 720C. Hybridization was
done overnight. Slides were post hybridisation washed according to the man-ufacturers instruction and counterstained with 4,6-doamidino-2-phenylindole (DAPI). The preparations were observed with a BX51 Olympus microscope equipped with Olympus filters (Texas Red, FITC, DAPI and Triple-band), a CCD 1300 QDS camera and Applied Spectral Imaging (ASI) BandView5.5 Karyotyping and FISH Software.
2.3
c-Cbl mutational status screening
Direct genomic DNA sequencing was performed as previously described in [88]. Exons 7, 8, and 9 from genomic DNA were amplified using the following primer sets: • 7F, 5-ACACCACGTTGCCCTTTTAG-3; • 7R, 5-GTCAATGGGTTCCAATGAAT-3; • 8F,5-GGACCCAGACTAGATGCTTTCT-3; • 8R, 5-8GAAAATACATTTCCTAGAGATCAAAAA-3; • 9F,5-CTGGCTTTTGGGGTTAGGTT-3; • 9R, 5-TCGTTAAGTGTTTTACGGCTTT-3.
CHAPTER 2. METHODS
PCR reaction conditions were as follows: 94◦C for 4 min, 30 cycles of 94◦C for 30 s, 48.5◦C for 30 s, and 72◦C for 30 s; 1 cycle at 72◦C for 5 min. PCR products were sequenced by standard dideoxy chain termination procedure with the Abi Prism 377 automatic sequencer in both directions.
2.4
Multiplexed ex vivo assay for the detection
of proteomic profile in MM
A workflow using protein kinase signal pathway mapping technology was de-veloped [89] for the ex vivo, short-term drug treatment of fresh, living human multiple myeloma (MM) bone marrow aspirate tumor cells, compared to non MM bone marrow cells for the same patient.
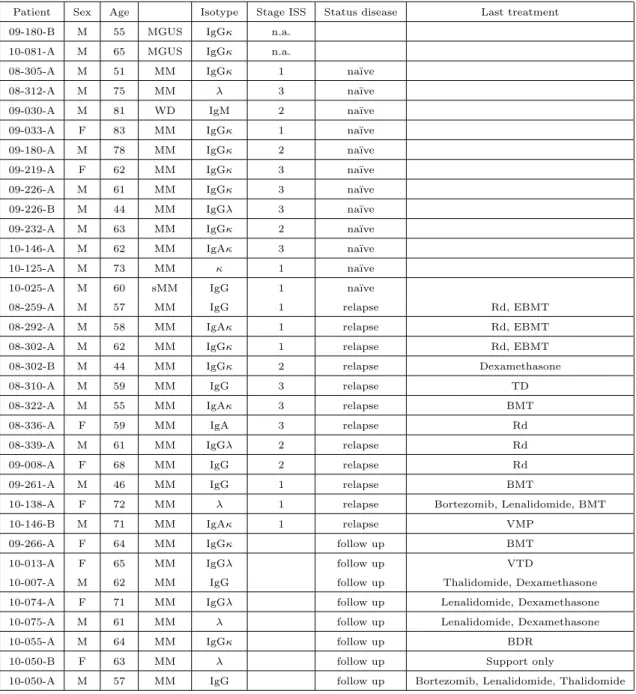
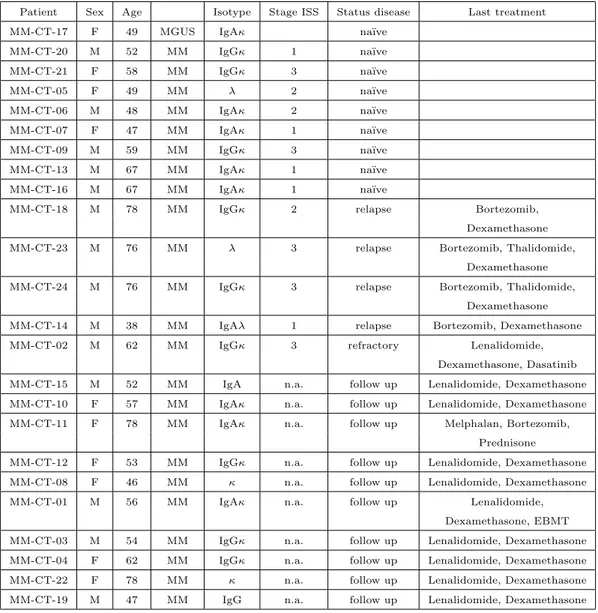
Bone marrow aspirates were immediately subdivided and treated ex vivo with a panel of molecular inhibitors that target a wide range of cellular pathways (e.g. protein degradation, cell proliferation/survival, insulin response, protein translation). In set A (including GMU samples, collected at Virginia Cancer Specialists, Fairfax, VA) we explored changes occurred after exposure to tyrosine kinase inhibitors with a well-defined target on the cancerous cell (e.g. the c-kit inhibitor Imatinib or the multikinase inhibitor Sorafenib), while in set B ((in-cluding CT samples, collected at Division of Hematology, Ospedale Ferrarotto, Catania) was evaluated the predictive ability of the assay, treating the cells with drugs routinely used in clinical practice (dexamethasone, lenalidomide, borte-zomib). Clinical characteristics of enrolled patients are summarised in table 2.1 (for set A) and 2.2 (for set B).
Specifically, IOOuL bone marrow aspirate was mixed with 200uL RPMI-1640 serum free media (ATCC) either alone or in combination with specific kinase inhibitors, drugs, or ligands. The inhibitors listed in Table 2.3 were evaluated.
Drugs were dissolved in dimthyl sulfoxide (DMSO) to prepare stock solu-tions. The final concentration of DMSO was kept at 0.1% for all the assays.
CHAPTER 2. METHODS
Table 2.1: Clinical characteristics of patients included in set A
Patient Sex Age Isotype Stage ISS Status disease Last treatment
09-180-B M 55 MGUS IgGκ n.a.
10-081-A M 65 MGUS IgGκ n.a.
08-305-A M 51 MM IgGκ 1 na¨ıve
08-312-A M 75 MM λ 3 na¨ıve
09-030-A M 81 WD IgM 2 na¨ıve
09-033-A F 83 MM IgGκ 1 na¨ıve
09-180-A M 78 MM IgGκ 2 na¨ıve
09-219-A F 62 MM IgGκ 3 na¨ıve
09-226-A M 61 MM IgGκ 3 na¨ıve
09-226-B M 44 MM IgGλ 3 na¨ıve
09-232-A M 63 MM IgGκ 2 na¨ıve
10-146-A M 62 MM IgAκ 3 na¨ıve
10-125-A M 73 MM κ 1 na¨ıve
10-025-A M 60 sMM IgG 1 na¨ıve
08-259-A M 57 MM IgG 1 relapse Rd, EBMT
08-292-A M 58 MM IgAκ 1 relapse Rd, EBMT
08-302-A M 62 MM IgGκ 1 relapse Rd, EBMT
08-302-B M 44 MM IgGκ 2 relapse Dexamethasone
08-310-A M 59 MM IgG 3 relapse TD
08-322-A M 55 MM IgAκ 3 relapse BMT
08-336-A F 59 MM IgA 3 relapse Rd
08-339-A M 61 MM IgGλ 2 relapse Rd
09-008-A F 68 MM IgG 2 relapse Rd
09-261-A M 46 MM IgG 1 relapse BMT
10-138-A F 72 MM λ 1 relapse Bortezomib, Lenalidomide, BMT
10-146-B M 71 MM IgAκ 1 relapse VMP
09-266-A F 64 MM IgGκ follow up BMT
10-013-A F 65 MM IgGλ follow up VTD
10-007-A M 62 MM IgG follow up Thalidomide, Dexamethasone
10-074-A F 71 MM IgGλ follow up Lenalidomide, Dexamethasone
10-075-A M 61 MM λ follow up Lenalidomide, Dexamethasone
10-055-A M 64 MM IgGκ follow up BDR
10-050-B F 63 MM λ follow up Support only
CHAPTER 2. METHODS
Table 2.2: Clinical characteristics of patients included in set B
Patient Sex Age Isotype Stage ISS Status disease Last treatment
MM-CT-17 F 49 MGUS IgAκ na¨ıve
MM-CT-20 M 52 MM IgGκ 1 na¨ıve
MM-CT-21 F 58 MM IgGκ 3 na¨ıve
MM-CT-05 F 49 MM λ 2 na¨ıve
MM-CT-06 M 48 MM IgAκ 2 na¨ıve
MM-CT-07 F 47 MM IgAκ 1 na¨ıve
MM-CT-09 M 59 MM IgGκ 3 na¨ıve
MM-CT-13 M 67 MM IgAκ 1 na¨ıve
MM-CT-16 M 67 MM IgAκ 1 na¨ıve
MM-CT-18 M 78 MM IgGκ 2 relapse Bortezomib,
Dexamethasone
MM-CT-23 M 76 MM λ 3 relapse Bortezomib, Thalidomide,
Dexamethasone
MM-CT-24 M 76 MM IgGκ 3 relapse Bortezomib, Thalidomide,
Dexamethasone
MM-CT-14 M 38 MM IgAλ 1 relapse Bortezomib, Dexamethasone
MM-CT-02 M 62 MM IgGκ 3 refractory Lenalidomide,
Dexamethasone, Dasatinib
MM-CT-15 M 52 MM IgA n.a. follow up Lenalidomide, Dexamethasone
MM-CT-10 F 57 MM IgAκ n.a. follow up Lenalidomide, Dexamethasone
MM-CT-11 F 78 MM IgAκ n.a. follow up Melphalan, Bortezomib,
Prednisone
MM-CT-12 F 53 MM IgGκ n.a. follow up Lenalidomide, Dexamethasone
MM-CT-08 F 46 MM κ n.a. follow up Lenalidomide, Dexamethasone
MM-CT-01 M 56 MM IgAκ n.a. follow up Lenalidomide,
Dexamethasone, EBMT
MM-CT-03 M 54 MM IgGκ n.a. follow up Lenalidomide, Dexamethasone
MM-CT-04 F 62 MM IgGκ n.a. follow up Lenalidomide, Dexamethasone
MM-CT-22 F 78 MM κ n.a. follow up Lenalidomide, Dexamethasone
MM-CT-19 M 47 MM IgG n.a. follow up Lenalidomide, Dexamethasone
CHAPTER 2. METHODS
Table 2.3: Drugs used for ex vivo assay
Drug Stock Solution Drug Stock Solution
Bortezomib 10mM Dasatinib 1.6 mM
Lenalidomide 30mM Erlotinib 1.6 mM
Thalidomide 100 mM Imatinib 1.6 mM
Pomalidomide 100 mM Dexamethasone 85uM
Imatinib 10mM IGFR inhibitor 4.6mM
Dasatinib 100mM Rapamycin 170uM
Nilotinib 100mM Bcl-2 inhibitor 4mM
Sunitinib 1.6mM Sorafinib 1.6mM
IL-6 ligand 75ng/mL IGF-1 ligand 10 ng/mL
All treatments were performed in duplicate. One aliquot was incubated with RPMI- 1640 media only as an untreated control. The treated and untreated bone marrow aspirates were incubated overnight (about 18 hrs) with constant rotation in a 37◦C incubator at ambient humidity and oxygen saturation. The
overview of sample processing for both GMU and CT set is reported respectively in fig.2.2 and 2.3.
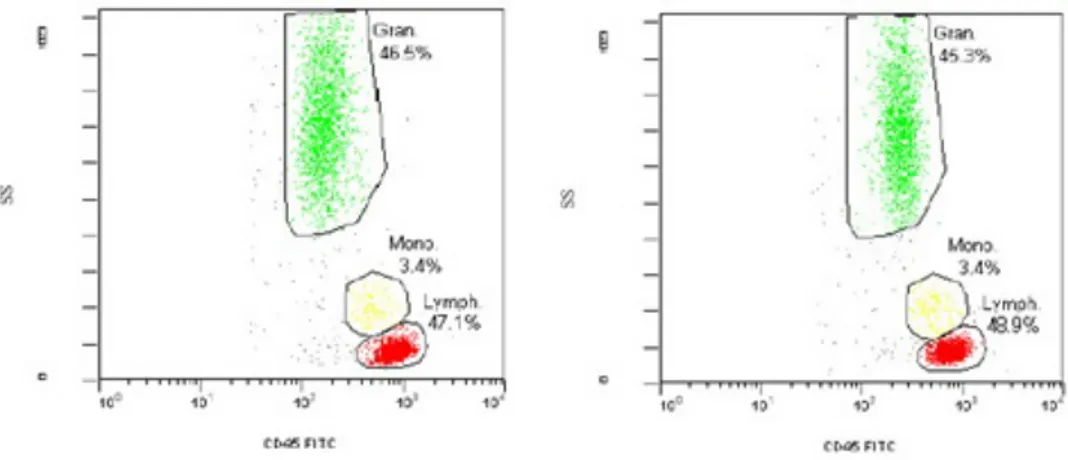
To properly elucidate deranged or hyperactive protein signaling networks within a patient’s tumor, protein signatures in tissue specimens have been sta-bilized prior to cell sorting or separation, since RBC hemolysis, cell separation or centrifugation can perturb the signaling and confound the analysis. In one em-bodiment, a combination of precipitating fixative, PEG and enzyme inhibitors was used to stabilize protein signatures, to prevent the fluctuations in the cellu-lar analytes of interest, according to [90, 91]. This solution effectively stabilizes labile signal pathway phosphoproteins accordingly to [90], preserves cell surface markers for flow cytometry analysis (see fig.2.4) and the cellular morphology for cytological diagnosis (see fig.2.5).
mi-CHAPTER 2. METHODS
Fig. 2.2: Workflow of processing for samples of set A
croenvironment cells via immunomagnetic sorting. Briefly, cells were incubated with magnetic beads (Stem Cell Technologies) coated with antibodies against CD138 and positioned directly on top of a 48 well microtiter plate containing aligned neodymium magnets. Afterwards, the cell solution was transferred in a column placed in a strong magnetic field. In this step, cells attached to the beads (the plasmacells) remained on the column, while the bone marrow mi-croenvironment elements (not expressing the CD138 marker) flow through. An example of worksheet used during the experiments is reported in fig.2.6.
Reverse phase protein arrays (see below, and reviewed in [92, 93, 94] were used to quantitatively map 60 to 75 signal pathway endpoints (as reviewed in [95]) in CD138+ and CD138− cell populations at the same time. The impact
of each treatment was measured on the selected endpoint compared to the ve-hicle control. Comparisons were made for the relative sensitivity between the myeloma cells and the non-myeloma cells for each endpoint and treatment. In-duction of cell death was inferred by activation of a series of apoptosis pathway
CHAPTER 2. METHODS
Fig. 2.3: Workflow of processing for samples of set B
Fig. 2.4: CD45 vs Side Scatter in peripheral blood unfixed (left panel) or treated with GMU fixative for 15 minutes
CHAPTER 2. METHODS
Fig. 2.5: Peripheral blood smear after treatment with GMU fixative for 15 minutes (left panel) and Plasma cells’ morphology in the cytospin after treatment with GMU fixative for
15 minutes.)
Fig. 2.6: Worksheet for the treatment ex-vivo of set A
CHAPTER 2. METHODS
endpoints.
First 15 samples of set A were used to optimize the method, the efficiency of magnetic separation and the stability of phospo-endpoints after collection. Clinical characteristics of resting 15 patients are reported in table 3A. We had 2 main subgroups: nave patients (6/15, 40%) vs relapse/refractory (9/15, 60%).
2.5
The Reverse Phase Protein Microarray (RPMA)
RPMA is a micro-cell lysate dot-blot that allows measurement of protein ex-pression levels in a large number of biological samples, simultaneously, in a quantitative manner when high-quality antibodies are available.
The name ’reverse phase’ is derived from the fact that this type of protein microarray immobilizes the protein to be analyzed. In contrast to the antibody array, where antibody probe is immobilized, in RPMA the protein lysate are denaturated prior to immobilization and thus does not do not require labeling of cellular protein lysates, thus constituting a sensitive high throughput platform for marker screening, pathophysiology investigation and therapeutic monitoring. Technically, minuscule amounts of cellular lysates are immobilized on in-dividual spots on a microarray that is then incubated with a single specific antibody to detect expression of the target protein across many samples, using either a primary or a secondary labeled antibody by chemiluminescent, fluores-cent or colorimetric assays. The array is then imaged and the obtained data is quantified.
Protein extraction Sorted cells (for MM project) or PBMNCs isolated from the bone marrow (MDS project) were lysed into 10 uL of lysis buffer containing a 1:1 mixture of 2x Tris-Glycine SDS sample buffer (Invitrogen Life Technologies) and Tissue Protein Extraction Reagent (Pierce) plus 1.0% beta-mercaptoethanol for 5 min at 1000C, saved at −800C. Once collected all samples
CHAPTER 2. METHODS
Printing This step consists in the analyte immobilization on a nitrocellu-lose coated glass slide (array). A solution of 10% TCEP in T-PER/ 2X SDS Tris-glycine SDS buffer was used to solubilize the cells and denature the cellular proteins.
Immediately prior to arraying, lysates were denatured by heating for 5 min-utes at 1000C, diluted in protein extraction buffer in accord to Test Print
find-ings and loaded into a 384-well plate. Serial two-fold dilutions were printed in duplicate on glass backed nitrocellulose array slides (FAST Slides, Whatman or Schott) using an Aushon 2470 arrayer equipped with 350um pins(Aushon Biosystems, Billerica, MA). Each spot was printed with approximately 30.0 nL of lysate/spot in a dilution curve representing undiluted and 1:4 dilutions. Positive control samples included A431 control and A431+EGF lysates (BD Pharmingen) at 1.0 mg/mL.
Once printed, the slides were either stored with desiccant (Drierite, W.A. Hammond, Xenia, OH) at −200C or immediately processed for immunostaining. For each array, 3 or 4 slides were washed and baked at 800C for ssDNA detection
(see below).
Staining For estimation of total protein amounts, selected arrays were stained with Sypro Ruby Protein Blot Stain (Molecular Probes) according to the manufacturer’s instructions and visualized on a Fluorchem imaging system (Alpha Innotech).
Lysate arrays were treated with Reblot antibody stripping solution (Chemi-con) for 15 min at room temperature, washed 2 x 5 min in PBS, and then incu-bated for at least 1 hour in blocking solution (1g I-block (Tropix), 0.1% Tween-20 in 500 mL PBS) at room temperature with constant rocking. Blocked arrays were stained with antibodies on an automated slide stainer (Autostainer CSA kit, Dako, Carpinteria, CA). using the Catalyzed Signal Amplification System kit according to the manufacturer’s recommendation (CSA; Dako Cytomation). Briefly, endogenous biotin was blocked for 10 min using the biotin blocking kit, followed by application of protein block for 5 min; primary antibodies were
CHAPTER 2. METHODS
luted in antibody diluent and incubated on slides for 30 min and biotinylated secondary antibodies were incubated for 15 min. Signal amplification involved incubation with a streptavidin-biotin-peroxidase complex provided in the CSA kit for 15 min, and amplification reagent, (biotinyl-tyramide/hydrogen perox-ide, streptavidin-peroxidase) for 15 min each. Development was completed using diaminobenzadine/hydrogen peroxide as the chromogen/substrate. Slides were allowed to air dry following development.
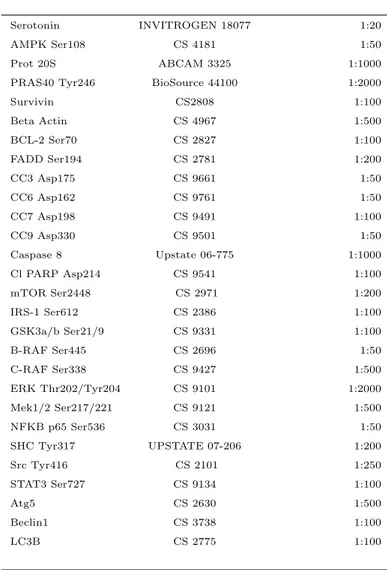
Each array was probed with a single polyclonal or monoclonal primary an-tibody (e.g. see 2.4). The negative control slide was incubated with anan-tibody diluent. Secondary antibody was goat anti-rabbit IgG H+L (1 :7500 for What-man slides, 1:500 for Schott slides) (Vector Labs, Burlingame, CA) or rabbit anti-mouse IgG (1:10) (Dako).
Each array was scanned using an UMAX flatbed scanner at 600 dpi (Adobe Photoshop software), spot intensity analyzed, data normalized to total protein and ssDNA/spot, and a standardized, single data value was generated for each sample on the array (Image Quant v5.2, GE Healthcare, Piscataway, NJ). For samples treated ex vivo changes in proteomic profile was indicated as relative percentage of the correspondant vehicle (DMSO or saline solution for samples treated with the only bortezomib).
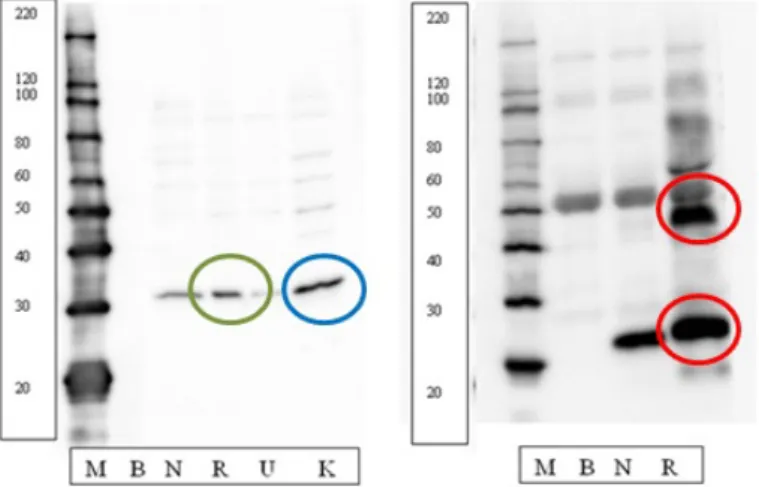
Calibration and quality control arrays Since RPMA uses the whole-cell or tissue lysate, it can provide access to post translationally modified pro-teins that are not accessible with other high-throughput techniques. However, since RPMA does not account for antibody specificity and performance, the signal from a single spot could be due to cross-reactivity. Thus, the antibodies used in RPMA must be validated for specificity and performance against cell lysates by Western blot.
GMU antibodies library contains more than one hundred fifty phosphopro-tein antibodies validated by Western blotting using a heterogenous tissue sample and a series of cell lines as the input. Validation requires a single band at the expected molecular weight (the green circle in fig.2.7 in left panel), or multiple