Organic farming in Italy
BIOREPORT 2013
Publication produced with the grant by EAFRD (European Fund for Agriculture
and Rural Development) in the frame of the activities carried out under the
Program “National Rural Network 2007-2013” - www.reterurale.it
National Rural Network – Italy 2007-2013
Rome, 2014BIOREPORT 2013
This work was carried out as part of the National Rural Network Programme – Italy 2007-2013,
Work Group for the Integration of Rural Development and Other Policies – Director Graziella Romito, and in collaboration with MIPAAF, INEA, ISMEA and SINAB IAM.B.
Coordination: Francesca Marras (INEA).
Coordinating Committee: Carla Abitabile, Francesca Marras, Laura Viganò.
Technical and Scientific Committee: Carla Abitabile (INEA), Giovanna Carlini (MIPAAF-ICQRF), Paolo Carnemolla (FederBio), Enrico De Ruvo (ISMEA), Vincenzo Ferrentino (MIPAAF – DISR IV), Francesco Giardina (SINAB-IAM.B), Giuseppina Iamarino (MIPAAF – PQA V), Francesca Marras (INEA), Cristina Micheloni (AIAB), Giacomo Mocciaro (MIPAAF-PQA V), Leonardo Pugliese (FederBio), Serenella Puliga (MIPAAF-DISR IV), Marta Romeo (SINAB-IAM.B), Caterina Santori (AIAB), Lorena Timi (MIPAAF-ICQRF), Laura Viganò (INEA), Massimiliano Vilardi (MIPAAF-ICQRF), Christian Vincentini (MIPAAF-DISR II). INEA Publishing Committee: Carla Abitabile, Francesca Giarè, Sabrina Giuca, Francesca Marras, Gaetana Petriccione, Antonella Trisorio, Laura Viganò, Raffaella Zucaro.
Texts by:
Chapter 1: Laura Viganò (INEA)
Chapter 2: Marta Romeo (SINAB), Stefano Trione e Alberto Sturla (INEA)
Chapter 3: Simonetta De Leo, Stefano Trione e Alberto Sturla (INEA)
Chapter 4: Enrico De Ruvo (ISMEA)
Chapter 5: Enrico De Ruvo (ISMEA)
Chapter 6: Andrea Arzeni (INEA)
Chapter 7: Sabrina Giuca (INEA)
Chapter 8: Simonetta De Leo (INEA)
Chapter 9: Roberto Henke (INEA)
Chapter 10: Ines Di Paolo (INEA), Serenella Puliga (MIPAAF)
Chapter 11: Marcello De Maria (INEA)
Chapter 12: Carla Agricoli e Placido Mario Iudicello (MIPAAF)
Chapter 13: Emanuele Benetto, Renato Pieri, Daniele Rama (SMEA - Università Cattolica del S. Cuore)
Chapter 14: Alba Pietromarchi (AIAB)
Chapter 15: Antonella Finizia (ISMEA)
Chapter 16: Giovanni Dara Guccione (INEA)
Chapter 17: Sabrina Giuca (INEA)
Processing and technical support: Marco Amato, Anna Lapoli, Stefano Tomassini Technical Secretary: Isabella Brandi
Editorial Coordination: Benedetto Venuto Editorial Secretary: Roberta Capretti
Graphic design and layout: Jacopo Barone,Sofia Mannozzi Translated by : Studio Moretto Group srl, Barbara Perna Cover photo: Giuseppe Argiolas
Photos used: MIPAAF archive.
Photos on pages 40, 60, 72, 80, 122, 148: Giuseppe Argiolas; photos on page 132: Pascal06 –Fotolia.com Reproduction admitted if the source is cited.
Presentation
SECTION I: Organic farming data
1. Profile of the Italian organic farms according
to the census 9
2. Structure of the farms 19
3. Economic situation of the farms 27
4. The market 35
5. Prices 41
6. Technical inputs 53
SECTION II: Organic farming policies
7. Standards in this sector 63
8. Support to the organic sector 75
9. New additions to the CAP reform 79
10. Research and innovation 83
SECTION III:
Sector organisation and characteristics
11. The environmental sustainability of organic farming 93
12. Control 103
13. The dairy sector 109
14. The short supply chain of organic products 124
15. Medicinal plants 134
16. A regional case study: Sicily 142
17. An international case study: Denmark 150
CONTENTS
BIOREPORT 2013 continues in its efforts to offer an updated overview of organic farming in Italy, both presenting and commenting on the available economic data and examining further a number of aspects using ad-hoc surveys.
The data of this edition confirm the increasingly important role of the sector within the context of Italian agriculture: no longer just a niche sector but an innovative production model that is highly attractive in financial, social and environmental terms.
According to the last Agricultural Census, organic farms are mainly situated in the mountainous and hilly areas. This shows how the farms located in the disadvantaged areas are more inclined to enhance their products, also via organic certification, in order to counterbalance the effects on the revenue of the most difficult pedoclimatic conditions. The organic farms are on average larger than the traditional ones (27.7 ha of UAA compared to 7.9 ha of UAA of the total farms) and also differ in other characteristics. These farms are less labour-intensive and are managed by young, educated and innovative entrepreneurs who achieve interesting economic results.
According to the SINAB data, Italy is confirmed as one of the first ten countries in the world for the surface area used for organic farming, for the number of farms and for the highest incidence of organic UAA with respect to the total (over 9%). In 2012, growth indicators were noted both at the level of production (after the decline in the last few years, there are now more producers and therefore an increase in UAA) and also for the market, despite the fact that the economic crisis has also affected food expenditure. The organic sector, at least for the moment, does not seem to be affected by the crisis due to the intrinsically positive values linked to its products – protecting health, respecting the environment and greater equality between the various stakeholders of the supply chain -, and consumers have become increasingly aware of these values.
Preface
Aware of the importance of correctly informing the consumer about the organic values and in particular the environmental sustainability of the organic techniques, this document also includes a detailed assessment of the influence exerted by agricultural production on various elements of the ecosystem; soil, water, biodiversity, landscape, atmosphere and energy. This analysis confirms the organic approach as an example of good practice and as a method capable of making a positive contribution to reducing the negative effects on ecosystems and on the environment, though still with some aspects that need improving.
This edition provides an in-depth study of some organic supply chains in the milk-dairy and medicinal plant sector. The analysis of the milk-dairy sector focuses particularly on the stages of agricultural production and the processing of organic milk, and confirms the vocation of organic farms, and more specifically livestock farms, for diversification of their activities and the choice of production strategies aimed not at the intensification but rather the growth of farm area and the direct processing of the milk produced, also increasing the portfolio of the by-products.
The focus on organic medicinal plants resides in the particular characteristics of this sector, which, as a niche activity, offers significant development prospects, both because it leads to the possibility of cultivating minor agricultural products with very interesting market outlets, and because it can constitute a valid production alternative for marginal and disadvantaged land such as that in the mountains and hills.
The overview of the sector continues with the evolution of the policies and the support that up until now has played an essential role in the expansion of organic farming in many parts of Italy, particularly in the South, albeit with various problems and delays. The year 2013 and particularly 2014 represent authentic turning points in this
sector, with a revision of all the main policies to the benefit of the sector: ranging from the revision of EC Regulation 834/2007 to those of both the pillars of the CAP. Only over the next years will it be possible to assess whether the changes introduced by these policies are able to impact with greater efficiency on the actual needs of the farms and on the organic supply chain.
Lastly, aware that an overview of the Italian organic sector also requires an external comparison, a chapter has been added for further examination of how the sector works in a foreign country, where organic farming plays a significant part in production or the organization of the supply chain or market. This edition is particularly focused on Denmark.
PARTE I:
The 2010 General Census of Agriculture reveals detailed data on Italian organic farms for the first time, responding to the statistical objectives of this survey. Therefore, for informative purposes the census data represents a significant source on the structure of the organic farms and should be considered complementary to those of MIPAAF-SINAB, thanks to some new informative details that enhance the cognitive framework provided each year by MIPAAF-SINAB.
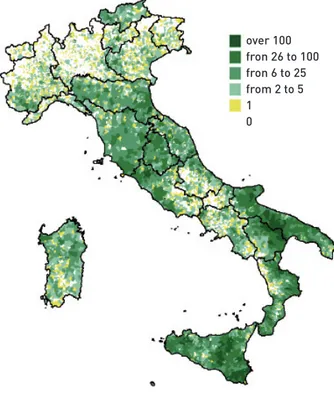
Fig. 1 – Number of organic farms per municipality (n.), 2010
Source: Data processing from the 6th General Agricultural Census
The distribution of the number of organic farms per municipality on the national territory indicates that, of the 8,077 municipalities in Italy, 61.8% have at least one organic farm on their land. The greater concentration in the central and southern regions is evident, while in the North, Emilia-Romagna stands out along with Alto Adige to a lesser extent. With regard to municipalities with organic farms, those having between 2 and 5 units (37.7%) lead, followed by those with a single organic farm (27.8%). Lastly, there are 41 municipalities with over 100 organic farms, and in particular: Noto (Syracuse), with 446 units, Corigliano Calabro (Cosenza; 242) and Poggio Moiano (Rieti; 241).
When considering the distribution of the percentage of organic UAA with respect to the total UAA per municipality, it can be noticed that in 30.6% of the municipalities with organic UAA, the incidence of the latter ranges between 1% and 5%. The remaining distribution proves to be rather balanced, increasing from a minimum of 16.1% in the case of municipalities with organic UAA of over 20% up to a maximum of 18.2% for those falling within the class immediately below. There are respectively 55 and 15 municipalities with an incidence of at least 60% and 80% , 10 of which have a single farm representing the entire municipal organic UAA. The municipalities with a percentage of organic UAA of at least 80% are located in the North, particularly in Lombardy, with the exception of Vejano (Viterbo) and Terravecchia (Cosenza). These include the municipalities of Rhêmes Notre-Dame (Aosta) with an entirely organic municipal UAA, Lardirago (Pavia; 99.5%), Veddasca (Varese; 98.8%) and Introbio (Lecco; 95.4%), the only one featuring 10 organic farms rather than a single unit.
1. Profile of the Italian organic farms according to the census
over 100 fron 26 to 100 fron 6 to 25 from 2 to 5 1 0
10 Fig. 2 – Incidence of the total organic UAA
by municipality (%), 2010
Source: Data processing from the 6th General Agricultural Census
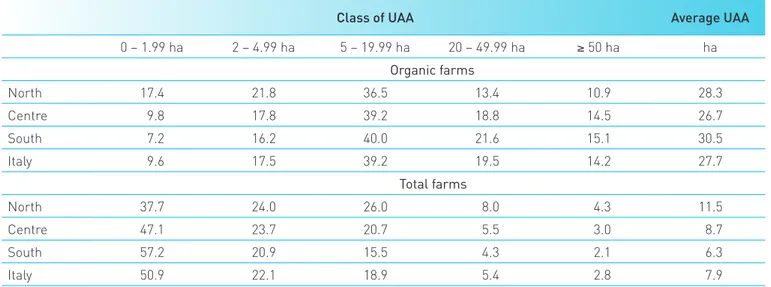
Almost 61% of the organic farms are located on hillsides, with a UAA that represents 12.7% of the total UAA in hilly areas and a smaller average farm size compared to the plains and mountain organic farms. Nevertheless, the distribution of the organic farms by altitude in northern Italy is characterised by a greater number of farms located in the mountain areas (38%), whereas those of the plains and the hills in both cases constitute around 30% of the northern organic farms. In fact, the farms located in the areas subject to less tendency for intensive farming often see organic certification as a way to enhance their products and thus make up for the negative effects on the revenue of the more difficult pedoclimatic conditions. The distribution of the organic farms by class of UAA is very different to that of the total farms considered. Only 9.6% of the first, in fact, fall within the class relating to a UAA of less than 2 hectares, compared to 50.9% of the other. However, considering the class of UAA ranging between 5 and 30 hectares, the organic farms always show a greater incidence with respect to that of the total farms. Therefore, the average UAA of the organic farms, equal to 27.7 ha, is much higher than that of the total farms (7.9 ha).
Table 1 - Organic farms and relative UAA by altitude zoe, 2010
Organic farms Organic farm UAA farms/farmsOrganic Organic farm UAA /UAA organic UAA Average
per farm No. % ha % % % ha Mountain 9,384 20.8 265,664 21.2 3.4 9.4 28.3 Hill 27,398 60.7 730,270 58.3 3.3 12.7 26.7 Plains 8,385 18.6 255,798 20.4 1.6 6.0 30.5 Total 45,167 100.0 1,251,732 100.0 2.8 9.7 27.7
including cooperatives (excluding social cooperatives) and this gap is much more accentuated in the Centre than in other parts of Italy. The cooperative in particular constitutes a legal and organizational form particularly suited to the situation of organic farms, which are often subject to problems relating to processing – requiring dedicated plants or in any event systems that enable the timely separation of processing of organic product from that of conventional products and marketing, given that they are scattered over a vast territory. The cooperative status, thanks to shared decision-making systems enables farms to deliver products directly, thereby obtaining higher added value than when selling them to general processing companies and/or sales companies, thus solving problems of under-representation and production positioning, while facilitating diversification of the sales channels.
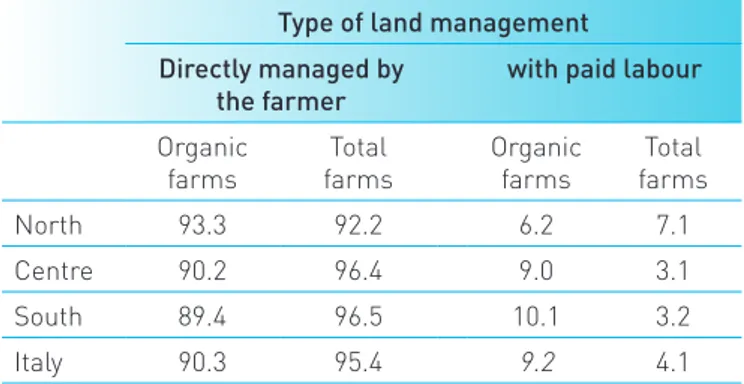
Moreover, in the organic farms of the Centre and particularly the South there is a greater tendency to resort to salaried labour.
The highest concentration of organic farms in the largest size classes can be partly explained by the greater tendency to hire land. Overall, in fact 32.2% of these farms have land that is completely rented or partly rented and partly owned, compared to 14.5% of all surveyed farms. Moreover, the percentage of organic farms with land that is owned, rented or loaned free of charge (5.3%) greatly differs from that of the total farms surveyed (2.4%). In both cases there is a more widespread combination in the mountain, where the phenomena of abandonment makes the land more available for renting or loaning and is often used by bordering farms so as to extend their grazing areas.
However, the organic farms differ from the total farms in many other characteristics and the subsequent economic results. These characteristics and results are often linked to the greater frequency of organic farms in the larger classes of UAA. In fact, in reference to the legal status, the corporate business entity is most spread among organic farms (8.3% compared to 3.6% of the total farms),
Table 2 – Percentage distribution of the farms by class of UAA and average farm UAA by regional distribution, 2010
Class of UAA Average UAA
0 – 1.99 ha 2 – 4.99 ha 5 – 19.99 ha 20 – 49.99 ha ≥ 50 ha ha Organic farms North 17.4 21.8 36.5 13.4 10.9 28.3 Centre 9.8 17.8 39.2 18.8 14.5 26.7 South 7.2 16.2 40.0 21.6 15.1 30.5 Italy 9.6 17.5 39.2 19.5 14.2 27.7 Total farms North 37.7 24.0 26.0 8.0 4.3 11.5 Centre 47.1 23.7 20.7 5.5 3.0 8.7 South 57.2 20.9 15.5 4.3 2.1 6.3 Italy 50.9 22.1 18.9 5.4 2.8 7.9
12
The opposite occurs in the North of the country, although the difference between organic farms with paid labour out of the total is negligible.
The organic farms are also less labour-intensive as one agricultural work unit (AWU) is 20.7 ha on average, compared to 14.4 ha of the total farms surveyed. This depends both on the lower intensity of the organic livestock, never in tie stalls, compared to the conventional sites, and on the high incidence of crops that do not require a relatively high use of workforce (fodder, meadows and pastures, legumes, potatoes, oil seeds, citrus fruit and fruit trees). Moreover, in the organic farms, the farm manager is on average younger. 22% of organic farms have a farm manager aged between 20 and 39 compared to 9% in the case of the total farms. A similar situation, but with a less marked difference, concerns the later age range, up to a maximum of 64 years.
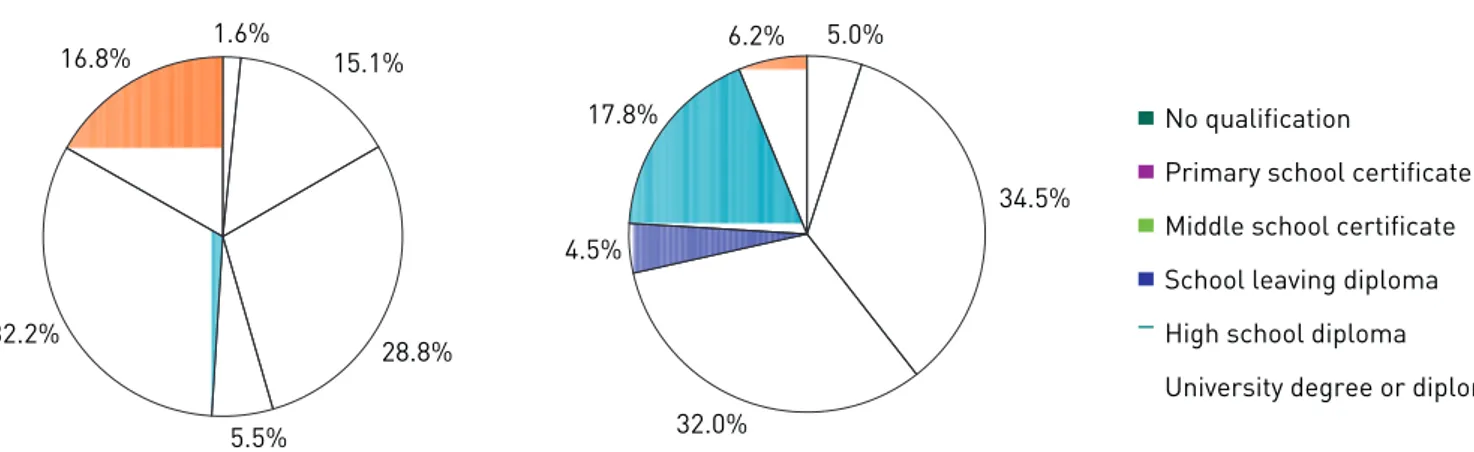
The youngest age category also corresponds to an educational qualification of the farm manager that is on average higher, particularly in the central regions. As regards the distribution of organic farms there is a relatively higher concentration of those with a farm Table 3 – Percentage distribution of the farms by land possession, 2010
Only
ownership Only rent Only free use Ownership and rent
Ownership and free use Rent and free use Ownership, rent and
free use No land Total (no.)
Organic farms Mountain 44.6 12.0 3.0 25.3 6.6 1.1 7.2 0.2 9,384 Hill 54.2 11.9 3.8 19.2 5.0 0.7 5.0 0.1 27,398 Flatland 54.5 11.8 4.8 18.2 5.5 0.8 4.3 0.1 8,385 Total 52.3 11.9 3.9 20.3 5.4 0.8 5.3 0.1 45,167 Total farms Mountain 68.3 4.7 3.8 12.1 6.7 0.6 3.5 0.2 275,950 Hill 76.0 4.5 3.6 8.1 5.2 0.3 2.2 0.1 833,317 Flatland 71.5 5.1 3.9 11.2 5.7 0.4 2.1 0.1 511,617 Total 73.3 4.7 3.8 9.8 5.6 0.4 2.4 0.1 1,620,884
Source: Data processing from the 6th General Agricultural Census Fig 3 – Distribution of the farms by legal status (%), 2010
Source: Data processing from the 6th General Agricultural Census
86.0 88.0 90.0 92.0 94.0 96.0 98.0 100.0
Organic farms Total farms
other legal status non-business associations cooperative
shareholding company
non-business association
other forms of partnerships different simple company
manager with educational qualifications at least equal to a school leaving diploma. Moreover, the differences between the organic and total farms in terms of percentage seem even more marked when considering a secondary school leaving certificate and even more so for a degree certificate.
The size of the farm, its organisation, the age and educational qualification of the farm manager influence the degree of innovation of the farms, some aspects of which include the computerization of one or more business activities (management, administration, operation etc.), diversification of the production activities and active sales channels. Also in this case, there are significant differences with the entirety of farms subject to the census. In fact, the organic farms using IT systems represent 15.6% of the total, more than four times the value revealed for the overall farms, a particularly significant divide found in the South, although the highest incidence is shown in the Centre and particularly the North. The central regions are however distinguished by the greater frequency, among organic farms, of those that have a website and use e-commerce to sell their products.
Fig. 4 - Distribution of the farms by age group of the farm manager, 2010
Source:Data processing from the 6th Agricultural Census. Table 4 – Distribution of the farms by type of land management (%), 2010
Type of land management Directly managed by
the farmer with paid labour
Organic
farms farmsTotal Organic farms farmsTotal
North 93.3 92.2 6.2 7.1
Centre 90.2 96.4 9.0 3.1
South 89.4 96.5 10.1 3.2
Italy 90.3 95.4 9.2 4.1
Source: Data processing from the 6th Agricultural Census. Table 5 – UAA available by AWU (ha), 2010
Organic farms Total farms
North 14.4 13.0
Centre 23.2 16.2
South 22.5 14.9
Italy 20.7 14.4
Source: Data processing from the 6th Agricultural Census.
Organic farms Total farms
0.1% 22.2% 58.7% 19.1% up to 19 years old 20-39 years old 40-64 anni 65 years old 0.0% 9.9% 52.8% 37.2%
14 The ability to diversify business activities is also greater in organic farms, given that the activities related to agriculture and livestock are practiced by around 17% of the certified businesses, more than three times the value attributable to businesses overall. Nevertheless, while some related types of activities are more practised by organic farms, others are relatively more frequent among the overall farms considered. The organic farms in fact are distinguished for the activities more frequently associated with organic production – such as agri-tourism, social and recreational activities, educational farms, initial processing of agricultural products, the processing
of animal and vegetable products and the production of renewable energy – while the total farms surveyed are associated with the relatively more traditional activities, such as subcontracting with farm production equipment for agricultural and non-agricultural activities, livestock services, the rehabilitation of parks and gardens, forestry. On the other hand, crafts, wood working, aquaculture, and the production of complete and complementary animal feed show no or almost no difference between the general and organic farms in the census.
It is interesting to note the significant number of organic farms selling their own produce with respect to the total Fig 5. - Distribution of the farms by educational qualification of farm manager, 2010
Source: Data processing from the 6th General Agricultural Census
1.6% 15.1% 28.8% 5.5% 32.2% 16.8% Organic farms No qualification
Primary school certificate Middle school certificate School leaving diploma High school diploma
University degree or diploma 5.0% 34.5% 32.0% 4.5% 17.8% 6.2% Total farms
Table 6 – Farms using IT systems, with websites and using e-commerce (%), 2010
Farms using IT systems With website E-commerce
Organic farms Total farms Organic farms Total farms Organic farms Total farms
North 27.9 9.1 17.7 3.5 7.3 1.1
Centre 21.4 4.0 20.7 3.2 9.3 1.2
South 10.2 1.5 5.6 0.7 3.3 0.3
Italy 15.6 3.8 10.7 1.8 5.2 0.7
Fig 6. - Farms by type of related activity (%), 2010
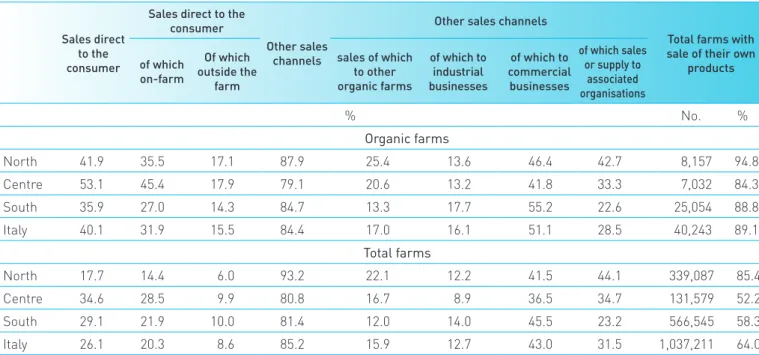
Table 7 – Farms by sales channel of products, 2010 Sales direct
to the consumer
Sales direct to the consumer
Other sales channels
Other sales channels
Total farms with sale of their own
products of which on-farm Of which outside the farm sales of which to other organic farms of which to industrial businesses of which to commercial businesses of which sales or supply to associated organisations % No. % Organic farms North 41.9 35.5 17.1 87.9 25.4 13.6 46.4 42.7 8,157 94.8 Centre 53.1 45.4 17.9 79.1 20.6 13.2 41.8 33.3 7,032 84.3 South 35.9 27.0 14.3 84.7 13.3 17.7 55.2 22.6 25,054 88.8 Italy 40.1 31.9 15.5 84.4 17.0 16.1 51.1 28.5 40,243 89.1 Total farms North 17.7 14.4 6.0 93.2 22.1 12.2 41.5 44.1 339,087 85.4 Centre 34.6 28.5 9.9 80.8 16.7 8.9 36.5 34.7 131,579 52.2 South 29.1 21.9 10.0 81.4 12.0 14.0 45.5 23.2 566,545 58.3 Italy 26.1 20.3 8.6 85.2 15.9 12.7 43.0 31.5 1,037,211 64.0
Source: Data processing from the 6th General Agricultural Census
Total farms Organic farms
0 5 10 15 20 25 30 35 40 45 50
Agri-tourism Recreation and social activities Educational farms Crafts Initial processing of farm products Processing of vegetable products Processing of animal products Production of renewable energy Wood working (cutting, etc.) Aquaculture Subcontracting using farm production equipment for agricultural activity Subcontracting using farm production equipment for non-agricultural activities Breeding services Rehabilitation of parks and gardens Forestry Production of complete and complementary animal fodder Other remunerative activities related to the farm
16 (89.1%), considerably higher than that of the overall surveyed farms (64%), indicating their greater inclination and ability to organise their supply from a sales point of view, also supported by certification, mainly requested by the farms where only part of or none of their own produce is destined for self-consumption. The distinctive element between these and the total farms surveyed is the direct sale to the consumer, both at the farm and elsewhere. This channel is particularly used in the organic sector – and especially in the central regions – where the direct relation between the producer and consumer is prioritised so as to increase the consumer’s trust in the producers themselves. However, as regards the other sales channels, the organic farms are above all distinguished for the sale of their own products to the industrial processing and commercial businesses,
while they constitute a smaller number compared to the total farms that send their products on to associations. The distribution of organic farms by economic size class highlights a greater concentration in the classes related to standard production1 of between 8,000 and 100,000 euros. Moreover, the incidence of the number of organic farms out of the national total is greater in the case of the larger economic categories (at least 50,000 euros), thanks to the higher overall standard production level obtained by organic farms compared to that of the total farms, a phenomenon related to the average UAA per farm, which is relatively larger for organic farms than for total farms. The scarcity of the organic farms in the economic class below 8,000 euros could indicate, among other things, a reduced cost effectiveness for the farms to be certified if sufficiently high production levels have
1 The farm production standard is the sum of the standard production of each agricultural activity multiplied by the number of units of hectares
of land or animals at the farm for each of the aforementioned activities. The standard production of a specific agricultural product, whether vegetable or animal, is the monetary value of the production, which includes the sales, the reuse, self-consumption and the changes in the stock of the products. The standard productions are calculated at the regional level (referring to the geographical units used for the RICA and SPA surveys) as a five-year average. The standard production of the data relating to the 6th Agriculture Census is determined via the coefficients of the 2007 production standard calculated on the basis of the average values of the production and prices referring to the years 2005 to 2009. Table 8 – Organic farms and relative UAA by economic size class, 2010
Economic Size Class Organic farms Average organic UAA per
farm media per aziendaSAU biologica
no. % % ha ha
< 8,000 euros 6,963 15.4 25,650 2.0 3.7
From 8,000 to less than 25,00 euros 11,972 26.5 114,579 9.2 9.6
From 25,000 to less than 50,00 euros 9,365 20.7 166,901 13.3 17.8
From 50,000 to less than 100,000 euros 8,183 18.1 251,080 20.1 30.7
From 100,000 to less than 250,000 euros 6,157 13.6 352,944 28.2 57,3
From 250,000 to less than 500,000 euros 1,667 3.7 164,337 13.1 98.6
≥ 500,000 euros 860 1.9 176,241 14.1 204.9
Total 45,167 100.0 1,251,732 100.0 27.7
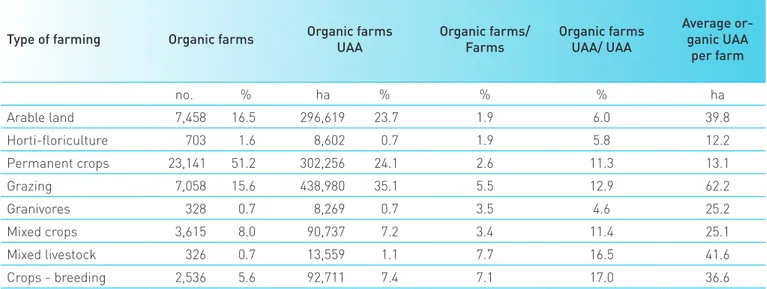
grazing land and the production of fodder. A similar but more balanced situation in terms of farms and relative UAA is that of the ‘arable’ TF. Among the TF that show the lowest incidence of organic farms with respect to the total, ‘mixed livestock breeding’ and ‘crops-breeding’ stand out when compared to the total number of agricultural farms, both in terms of number and above all of UAA, of 7% and 17% respectively.
not been reached, due to the cost of certification and bureaucratic charges.
The organic farms with ‘permanent crop’ type of farming (TF) represent over half of those surveyed, but the relative UAA exceeds just 24%, with a situation diametrically opposed to those farms with ‘grazing’ TF. The average UAA of the grazing farms amounts to 62 ha, given the need to arrange larger areas for the livestock
Table 9 – Organic farms and relative UAA by TF, 2010
Type of farming Organic farms Organic farms UAA Organic farms/Farms Organic farms UAA/ UAA
Average or-ganic UAA per farm no. % ha % % % ha Arable land 7,458 16.5 296,619 23.7 1.9 6.0 39.8 Horti-floriculture 703 1.6 8,602 0.7 1.9 5.8 12.2 Permanent crops 23,141 51.2 302,256 24.1 2.6 11.3 13.1 Grazing 7,058 15.6 438,980 35.1 5.5 12.9 62.2 Granivores 328 0.7 8,269 0.7 3.5 4.6 25.2 Mixed crops 3,615 8.0 90,737 7.2 3.4 11.4 25.1 Mixed livestock 326 0.7 13,559 1.1 7.7 16.5 41.6 Crops - breeding 2,536 5.6 92,711 7.4 7.1 17.0 36.6
The international context
The overall profile of the diffusion of organic farming worldwide has been quite stable now for approximately three years, following the sustained growth in the previous three-year period (FiBL
– IFOAM DATA1). The global area in question is
arranged over 37.2 million hectares of which 81%
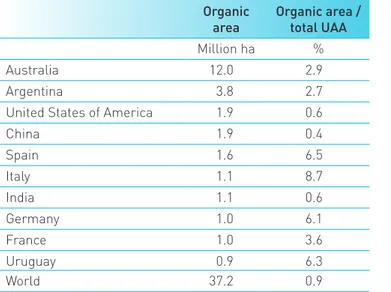
is concentrated in Oceania, Europe and Latin America. Italy remains among the top ten countries in the world for areas cultivated using the organic method, and among these it is the one with the highest percentage of UAA compared to the total UAA. Moreover, Italy is top in Europe for number of producers and in general, for certified operators (including processers and importers).
2. Structure of the farms
Table 1 – The first ten countries in the world for areas cultivated with the organic method, 2010
Organic
area Organic area / total UAA
Million ha %
Australia 12.0 2.9
Argentina 3.8 2.7
United States of America 1.9 0.6
China 1.9 0.4 Spain 1.6 6.5 Italy 1.1 8.7 India 1.1 0.6 Germany 1.0 6.1 France 1.0 3.6 Uruguay 0.9 6.3 World 37.2 0.9
Source FiBL –IFOAM (2013)
Table 2 – The first ten countries in the world by number of organic farms, 2010
Organic farms Million ha India 547,591 Uganda 188,625 Mexico 169,570 Tanzania 145,430 Ethiopia 122,359 Turkey 43,716 Peru 43,661 Italy 42,041 Spain 32,195 Dominican Republic 24,161 World 1,798,359
Source: FiBL – IFOAM (2013)
20
Organic farming in Italy
SINAB produces an annual report Bio in cifre/Organic numbers with which MIPAAF issues official data on
Italian organic farming as of 31st December of the
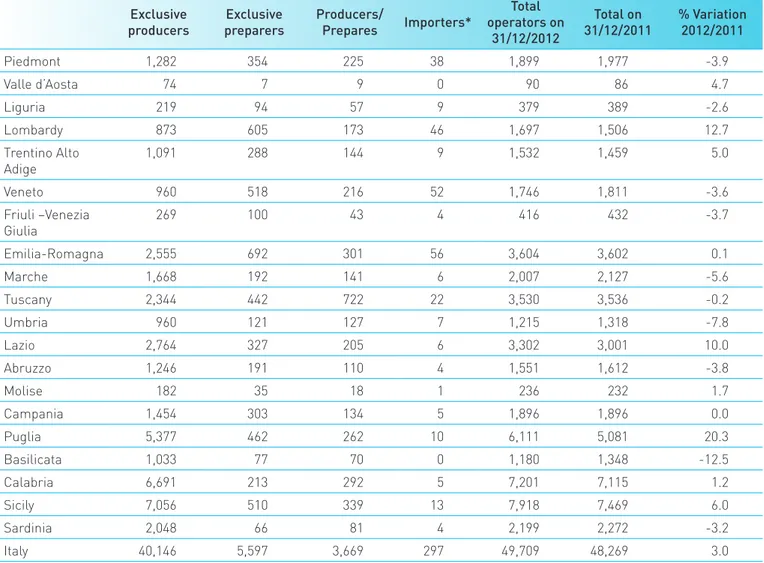
previous year, gathered by inspection bodies. This data reveals that there are 49,709 sector operators of which around 81% are exclusive producers, followed after a large gap by the preparers, which include farms carrying out retail sale activities (11.3%), mixed preparers or also producers (7.4%) and importers (0.6%). In comparison to the data of 2011, a 3% increase in the number of operators is shown.
The distribution of the organic operators throughout the national territory shows that there is a greater presence of organic farms in Sicily and Calabria, in line with the previous years. However, the leader in terms of the number of processing farms is Emilia-Romagna, Fig. 1 – Organic operators in the main European
countries (no.)
Source: SINAB (IT), Agence Bio (FR), Bundesministerium für Ernährung (DE), Ministerio de Agricultura, Alimentación y Medio Ambiente (ES).
Fig 2. - Organic areas in the main European countries (ha)
Source: SINAB (IT), Agence Bio (FR), Bundesministerium für Ernährung (DE), Ministerio de Agricultura, Alimentación y Medio Ambiente (ES).
0 5,000 10,000 15,000 20,000 25,000 30,000 35,000 40,000 45,000 50,000
Italy France Germany Spain 2011 Operators 2012 Operators 0 200,000 400,000 600,000 800,000 1,000,000 1,200,000 1,400,000 1,600,000 1,800,000 2,000,000
Spain Italy Germany France
2011 area 2012 area
followed by Veneto.
There is a significant increase in organic production in Puglia, both in terms of number of farms and cultivated hectares. This was also by virtue of a call for financial aid applications, in April 2012, in the name of the Organic Farming Action of the Agro-Environmental Measure of the RDP.
The organic surface area is, at a national level, equal to 1,167,362 hectares, with a 6.4% increase compared to the previous year.
The main production areas are fodder, cereal and grazing land. The area invested in olive growing follows in order of importance.
The data on the sector’s trend certainly demonstrates its substantial strength: it is not just the number of operators and the area that is on the increase, but also the percentage of the organic UAA on the total UAA, which is higher than 9%.
Table 3 – Organic operators by type and region (no.) 2012
Exclusive
producers preparersExclusive Producers/Prepares Importers*
Total operators on 31/12/2012 Total on 31/12/2011 % Variation 2012/2011 Piedmont 1,282 354 225 38 1,899 1,977 -3.9 Valle d’Aosta 74 7 9 0 90 86 4.7 Liguria 219 94 57 9 379 389 -2.6 Lombardy 873 605 173 46 1,697 1,506 12.7 Trentino Alto Adige 1,091 288 144 9 1,532 1,459 5.0 Veneto 960 518 216 52 1,746 1,811 -3.6 Friuli –Venezia Giulia 269 100 43 4 416 432 -3.7 Emilia-Romagna 2,555 692 301 56 3,604 3,602 0.1 Marche 1,668 192 141 6 2,007 2,127 -5.6 Tuscany 2,344 442 722 22 3,530 3,536 -0.2 Umbria 960 121 127 7 1,215 1,318 -7.8 Lazio 2,764 327 205 6 3,302 3,001 10.0 Abruzzo 1,246 191 110 4 1,551 1,612 -3.8 Molise 182 35 18 1 236 232 1.7 Campania 1,454 303 134 5 1,896 1,896 0.0 Puglia 5,377 462 262 10 6,111 5,081 20.3 Basilicata 1,033 77 70 0 1,180 1,348 -12.5 Calabria 6,691 213 292 5 7,201 7,115 1.2 Sicily 7,056 510 339 13 7,918 7,469 6.0 Sardinia 2,048 66 81 4 2,199 2,272 -3.2 Italy 40,146 5,597 3,669 297 49,709 48,269 3.0
* this item includes both the exclusive importers and the importers that also perform production and preparation activities Source: SINAB
22 Table 4 – Organic areas by type of crop (ha)
Conversion areas Organic areas TOTAL
2011 2012 2011 2012 2011 2012
Cereal 35,654 36,175 148,456 174,368 184,111 210,543
Protein, legume and grain crops 3,867 2,907 17,577 17,930 21,445 20,837
Root vegetables 393 239 1,445 936 1,838 1,175
Industrial crops 1,899 1,658 14,126 11,910 16,024 13,567
Fodder crops 50,567 39,160 200,016 215,844 250,583 255,003
Other arable crops 2,239 1,198 8,314 3,833 10,553 5,031
Vegetables 4,464 3,457 18,942 17,879 23,405 21,336 Fruit 6,011 6,387 17,226 16,645 23,237 23,033 Nuts 6,949 7,108 20,890 22,963 27,839 30,071 Citrus fruits 6,097 6,048 15,843 19,292 21,940 25,340 Vines 18,735 20,410 34,077 36,937 52,812 57,347 Olive 41,980 46,935 99,588 117,553 141,568 164,488
Other permanent crops 776 1,323 6,768 5,062 7,543 6,386
Fields and pastures (excluding rough
grazing) 40,408 39,781 141,652 165,375 182,060 205,156
Rough grazing 29,987 20,273 63,544 65,272 93,531 85,545
Fallow land 9,756 10,516 28,644 31,988 38,400 42,504
Total crops 259,782 243,575 837,107 923,786 1,096,889 1,167,362
Other categories to exclude from the total: forest areas and/or areas of wild harvesting; other
4,886 4,211 10,082 13,847 14,968 18,058
Organic livestock breeding
In Italy there are 7,700 agricultural livestock farms managed using organic farming methods, around 12% more than the previous year. A substantial part of the organic livestock is concentrated on the larger islands (42% of the total), but there are also several hundred organic livestock farms in various central and northern regions. Moreover, the organic livestock tends to be concentrated in specific areas as in the case of the Val di Vara in the province of La Spezia and of Val d’Ayas in Valle d’Aosta.
In the case of all animals in livestock production, the trend shows an increase in the number of organic livestock compared to 2011, and this trend is particularly marked in relation to pigs (+32.2%), while the increase of cattle (+5.2%), and sheep and goats (+1.2%) is more contained. Lastly, there was also an increase of around 19,500 hectares compared to 2011 in the fodder areas, the produce of which support the breeding of cattle, sheep and goats (+3.7%). As regards the increase of small ruminants, organic farming techniques show a
Graph 3 – Evolution of the number of operators and of the Italian organic area
Source: SINAB.
Graph 4 – Organic livestock farms by region, 2012
Source: SINAB. 0 200 400 600 800 1.000 1.200 1.400 0 10,000 20,000 30,000 40,000 50,000 60,000 70,000 1990 1991 1992 1993 1994 1995 1996 1997 1998 1999 2000 2001 2002 2003 2004 2005 2006 2007 2008 2009 2010 2011 2012 Thousands of hectares
number of operators UAA
Number of operators 1,510 1,735 328 185 117 58 2 54 766 311 130 474 662 102 42 180 436 230 54 338 0 500 1,000 1,500 2,000 Piedmont Valle d’Aosta Lombardy Trentino Alto Adige Veneto Friuli –Venezia Giulia Liguria Emilia-Romagna Tuscany Umbria Marche Lazio Abruzzo Molise Campania Puglia Basilicata Calabria Sicily Sardinia
24
different distribution, as they correspond to 10% of the national sheep livestock and 9% of the goat livestock. The organic methods amount only to 2.3% compared to that of the total livestock in Italy.
Imports
Each year SINAB processes the data gathered on the basis of the information that organic product importers from non-EU countries not restricted by import equivalency are required to submit to MIPAAF every year (Ministerial Decree no. 700/2011 and no. 18378/2012). For the first time, in addition to the operations carried out under the so-called transitional regime, the data relating to 2012 also includes the imports under
the equivalence regime2 or assessed as equivalent
by inspection bodies authorised by the European Commission. In any event, the intra-EU trade activity is not recorded and consequently the import data do not include organic products that enter Italy from non-EU countries via other EU countries.
Overall, in 2012, a sharp reduction by 57% was noted in total imports, over the previous year; this reduction is more significant when considering the fact that the SINAB data from last year regarded exclusively imports Graph 5 –Organic livestock population, by species bred
Source: SINAB.
Graph 6 - Organic fodder area and grazing animal numbers Source: SINAB. 0 500,000 1,000,000 1,500,000 2,000,000 2,500,000 3,000,000 0 50,000 100,000 150,000 200,000 250,000 2008 2009 2010 2011 2012
No. of heads (poultry)
No. of heads (cattle, pigs, sheep and goats
)
Cattle Pigs Poultry Sheep and goats
430,358 455,568 480,353 526,174 545,704 1,307,492 918,722 954,888 971,804 991,129 0 200,000 400,000 600,000 800,000 1,000,000 1,200,000 1,400,000 2008 2009 2010 2011 2012
Surface area (ha)
Fodder area Grazing animals (no.)
Table 5 – Organic livestock population by species, 2012
Number of
animals LSU % of total livestock
Cattle 203,823 169,466 2.3
Sheep 707,623 70,579 10.1
Goats 79,683 7,234 8.9
Pigs 42,872 11,677 0.5
Poultry 2,824,978 29,545
-Bees (no. of hives) 128,241 -
-Source: SINAB, ISTAT.
2 The transitional regime is that provided by article 19 of regulation (EC) 1235/08; the equivalence regime is defined by article 33 of the same
Graph 7 – Quantity of organic product imported in Italy by geographical area of origin (t)
Source: SINAB.
authorised by MIPAAF. The application of the new EU legislation, which in 2014 abolished the possibility of importing on authorization of the Member State (i.e. the elimination of the transitional regime), is in fact causing an increase in the imports carried out under the equivalence regime.
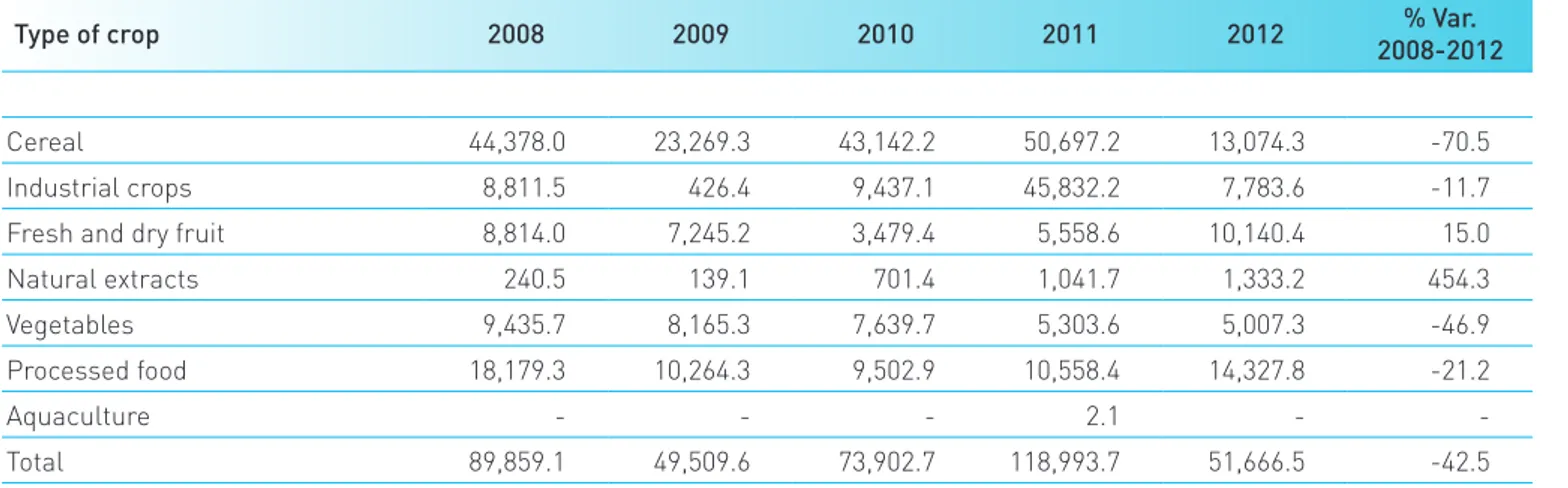
In the specific case of 2012, the imports under the equivalence regime, to the detriment of those under the transitional regime, relate above all to the processed food, fresh and dry fruit and industrial crops.
Industrial crops and cereals are the products that suffered the greatest reduction in quantity imported, with a particularly significant drop in some geographical areas such as non-EU Europe.
On the other hand, an increase in the imports was noted above all for fruit, where trade is particularly intense in South America, while the purchases from non-EU
Europe have decreased considerably.
In more detail, for the cereal imports with a 74% decrease compared to 2011, trade is concentrated on three products: soft wheat from North America and Non-EU Europe, rice from Asia and corn from Non-EU Europe. Imports of durum wheat have all but disappeared, in line with the trend of recent years.
As regards the industrial crops with an 83% decrease in imports compared to 2011, only soya from Asia is imported in large quantities.
On the other hand fresh fruit imports increase to around 82% and mainly regard bananas from South America, as well as kiwis and pears. A reduction is noted of around 5% in the quantity imported compared to 2011 for vegetables, mainly potatoes from North Africa, followed by beans and lentils.
Among the processed products imported in 2012, the
Africa Central America North America South America Asia Non-EU Europe 2009 2010 2011 2012 0 5,000 10,000 15,000 20,000 25,000 30,000 35,000 40,000 45,000 50,000 55,000 60,000 65,000 70,000 75,000 80,000 85,000 90,000 95,000 100,00 0
26 increase of 35% compared to the previous year is linked essentially to the imports of extra-virgin olive oil from North Africa. It should therefore be highlighted that this increase is strongly affected by the variation in the type of data processed compared to the previous year. In fact,
the imports of extra-virgin olive oil from North Africa were presumably already substantial over the last year, but were not included in notification by the importers and therefore not counted in the MIPAAF data under import equivalency.
Table 6 – Imports of organic products by category (t)
Type of crop 2008 2009 2010 2011 2012 2008-2012% Var.
Cereal 44,378.0 23,269.3 43,142.2 50,697.2 13,074.3 -70.5
Industrial crops 8,811.5 426.4 9,437.1 45,832.2 7,783.6 -11.7
Fresh and dry fruit 8,814.0 7,245.2 3,479.4 5,558.6 10,140.4 15.0
Natural extracts 240.5 139.1 701.4 1,041.7 1,333.2 454.3 Vegetables 9,435.7 8,165.3 7,639.7 5,303.6 5,007.3 -46.9 Processed food 18,179.3 10,264.3 9,502.9 10,558.4 14,327.8 -21.2 Aquaculture - - - 2.1 - -Total 89,859.1 49,509.6 73,902.7 118,993.7 51,666.5 -42.5 Source: SINAB
3. Economic situation of the farms
Among the organic farms included in the 2011 national register, 863 farms are also listed via the FADN, with part of the 2011 Italian accountancy sample that overall accounts for 11,204 farms including both conventional and organic. In order to analyse their structural profile and the economic results, the subsample of FADN
organic farms was compared with a subsample of 6,280 conventional FADN farms, which proved similar to the first in terms of economic size, production orientation and geographical location. The FADN organic farms are mainly concentrated in the central and southern regions of the peninsula (77%) and almost half (48%) are Table 1 – Structural comparison of the FADN organic and conventional farms, 2011
Indicators Organic Conventional
Average farm data
Utilised Agricultural Area - UAA (ha) 47.5 33.2
Livestock unit – LSU (no.) 21.3 15.5
Farm work unit TWU (no.) 2.3 1.7
Land capital – KF (euros) 556,927 440,382
Structural indicators
UAA/TWU (ha) 21.1 19.6
LSU/TWU(ha) 9.4 9.2
LSU/UAA(no.) 0.4 0.5
Land capital/UAA (euros) 11,723 13,249
Source: INEA, FADN database
What is FADN?
The Farm Accountancy Data Network (FADN*) is an EU tool aimed at monitoring the economic situation of farms in Europe. In Italy, the FADN provides annual economic data of a representative sample of commercial farms, i.e. farms whose production is market-oriented, with economic size greater than 4,000 euros gross standard production.
The farm production standard is equivalent to the amount of standard production values of each agricultural activity multiplied by the number of units of hectares of land or animals at the farm for each of the aforementioned activities. The standard production of a specific agricultural product, whether vegetable or animal, is the monetary value of the production, which includes the sales, reuse, self-consumption and the changes in the stock of the products. The standard productions are calculated at the regional level as a five-year average.
28 specialised in permanent crops, compared to 38% of the conventional sample.
Moreover, the farms with a non-specialised production orientation are more greatly represented in the organic sample with respect to the conventional farms (18% compared to 13%). In fact the mixed systems suit well with the organic set-ups in terms of rotations, organic fertilization and the presence of pioneer crops.
The organic farms are on average greater in size than the same conventional versions: its average farm area exceeds 14.3 hectares (47.5 hectares compared to 33.2 for conventional farms); the average number of livestock
units – the presence of which plays an important role in the recovery of the fertility of the land as well as creating a source of revenue – is greater than 5.7 LSU (21.3 LSU compared to 15.5 for the conventional farms). The greater use of labour (2.3 AWU compared to 1.7 for the conventional farms) and of capital (the average land capital is equal to 556,972 euros, significantly higher than the value 440,382 euros indicated for conventional farms) is related to the greater physical size.
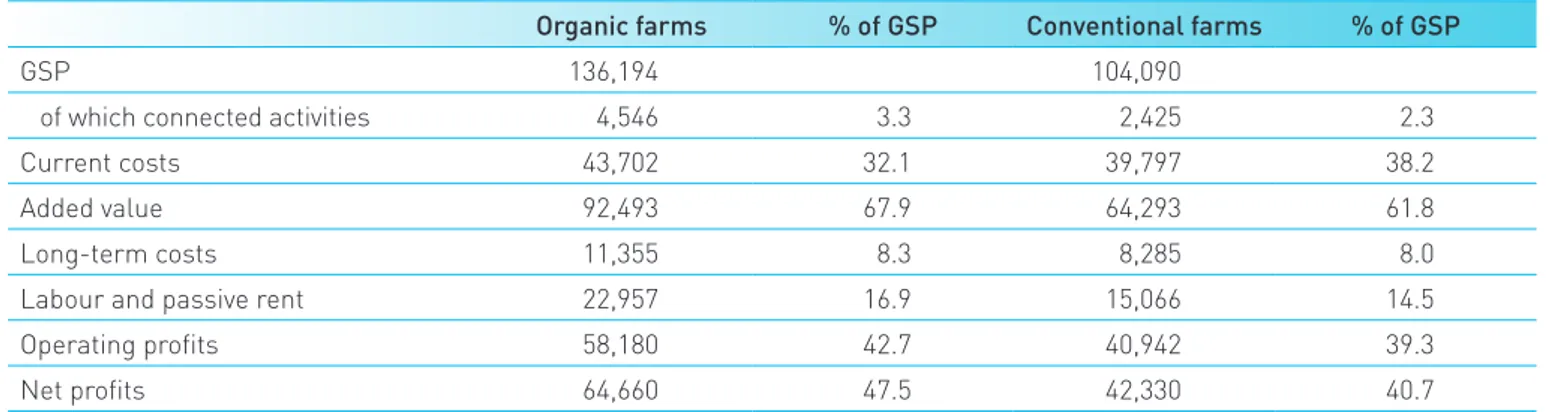
The organic farms show smaller production intensity compared to the conventional ones, confirmed by a greater availability of utilised agricultural area by work Table 2 –Economic results of the FADN organic and conventional farms (euros), 2011
Organic farms % of GSP Conventional farms % of GSP
GSP 136,194 104,090
of which connected activities 4,546 3.3 2,425 2.3
Current costs 43,702 32.1 39,797 38.2
Added value 92,493 67.9 64,293 61.8
Long-term costs 11,355 8.3 8,285 8.0
Labour and passive rent 22,957 16.9 15,066 14.5
Operating profits 58,180 42.7 40,942 39.3
Net profits 64,660 47.5 42,330 40.7
Source: INEA, FADN database.
Table 3 – Productivity and profitability of the land and labour (euros), 2011
Organic farms Conventional farms % Variation
GSP/UAA 2,867 3,132 -9.2 GSP/AWU 60,414 61,474 -1.8 Current costs/UAA 920 1,197 -30.2 Long-term costs/UAA 239 249 -4.3 Net profit/UAA 1,361 1,273 6.4 Net profit/FWU 51,478 34,294 33.4 Net profit/GSP 47 41 14.3
unit (21.1 hectares/AWU compared to 19.6 hectares/AWU in the conventional farms) and by a smaller livestock density per hectare of UAA (0.4 LSU/ha compared to 0.5 LSU/ha for conventional farms). Moreover, the lower value of land capital per hectare of agricultural area is also often linked to the more extensive production processes (11,723 euros/ha in organic farms and 13,249 euros/ha in conventional farms).
The largest physical dimensions are also accompanied by the best economic results. At organic FADN farms, the gross saleable product3 is on average 136,194 euros compared to 104,090 euros recorded in the conventional farms, while the net profit, intended as compensation for all the factors produced by the entrepreneur, is equal to 60,910 euros in the organic farms and 41,066 euros in the conventional ones. The economic results correspond to both the sale of products and agriculture-related activities (agri-tourism, farm contractors, education farms etc.), which on organic farms have slightly more impact than on the conventional ones
(3% and 2% respectively on the GSP) demonstrating a greater tendency of the first to diversify their activities. In addition to generating economic values above those of the conventional farms, organic farms proved to be more efficient. In fact, the added value represents 68% of the GSP in the organic farms compared to 62% in the conventional farms, with a subsequent reduction of ongoing costs (technical methods, services loaned by third parties and other direct expenditures), the main item of holding expenditure. This is the result of adopting less intensive production processes, in which a lesser quantity of outsourced farm technical production methods is used. By contrast, the cost of labour impacts greatly on the production of the organic farms, probably as a result of a greater tendency to use external labour, with farm sizes larger on average in terms of area than those of the conventional farms, where there is more family labour. The family work units constitute 72.9% of the total farms compared to 55.7% in relation to the organic farms.
Graph 1 – Economic results by main production types, 2011
Source: INEA, FDNA database
Net profit 0 10,000 20,000 30,000 40,000 50,000 60,000 70,000 80,000 90,000 Vegetable
types Livestocktypes
Mixed types Organic euros Conventional % Current Costs/GSP Organic % Conventional 0 10 20 30 40 50 60 Vegetable
types Livestock types Mixed types
3 In addition to proceeds from sales of the products, gross saleable product also includes those agriculture-related activities as well as subsidies
of the First CAP pillar. The operating profits are obtained by subtracting the current costs from this value (consumption; other expenses and subcontracting services), the long-term costs (depreciations and allocations), the distributed revenue (labour, salaries, social security contributions and passive rents).
30 The best results in organic farming have also been achieved thanks to EU contributions and in particular, specific aid for the sector, received by virtue of the agro-environmental measure for rural development, contributing by 15% to the revenue of beneficiary farms compared to 12% on conventional farms.
The analysis of the production indexes by land and labour shows the extensive character of the organic production techniques: here the production value is less both in terms of hectares and unit of labour. Nevertheless, the profitability of land and labour remains in favour of organic farms. The economic results vary depending on the production systems, but profitability of organic production remains on average higher in the macro sections of vegetables, livestock and mixed products (crops and livestock).
Result for the main organic production
sections
The FADN organic farms are strongly concentrated both in terms of territory, being largely located in Central-Southern Italy and on the islands, and in terms of crop
orientation given that the farms with permanent crops prevail.
The farms with vegetable product 4 groups have a large UAA and, particularly in the South and the islands, there is a tendency towards a significant number of extra-family labour that is especially employed in the harvesting work. The indexes that express the productivity of the land and the profitability of labour have clearly higher values for farms located in northern Italy, especially in the case of the North-East regions where the crops, even if managed according to the organic farming methods, have a more intensive character compared to the situation in the other geographical areas.
The organic farms that practice livestock breeding are well represented in the FADN sample: in fact, there are around 140 livestock businesses specialised in the breeding of grazing animals and 90 mixed farms cultivating arable crops and breeding grazing livestock. On average, this regards farms with extended fodder area and in general a very low number of livestock, particularly in the regions of the North-West, also due to the availability of extended alpine grazing areas
4 TF 1 “Farms specialised in arable crops”, TF 3 “Farms specialised in permanent crops” and TF 6 “Mixed cultivation farms”. TF is an acronym Type
of Farming.
Table 4 – Structural parameters of FADN organic farms specialised in vegetable produce and mixed farming, 2011
Farms UAA LSU FWU TWU UAA/TWU FWU/TWU UAA Land
capital n. ha n. n. n. ha % € North-West 54 50.7 0.9 1.6 2.3 22.2 70.0 7,755 North-East 60 38.8 3.6 1.4 2.3 17.2 62.8 34,632 Centre 162 40.5 0.7 1.3 2.0 20.4 65.3 14,821 South 273 29.9 0.3 1.0 2.4 12.6 40.0 13,060 Islands 75 41.8 0.2 0.9 2.8 15.1 31.2 11,685
Table 5 – Economic results of FADN organic farms specialised in vegetable produce and mixed crops, 2011
Farms GSP/UAA costs/UAACurrent Long-term costs/UAA profit/UAAOperating Net profit/FWU Net profit/GSP
n. € € € € € € North-West 54 5,082 1,675 288 2,506 77,597 48.0 North-East 60 5,790 1,565 388 3,093 91,232 57.7 Centre 162 2,719 779 336 1,171 41,254 48.5 South 273 3,131 818 215 1,287 47,061 47.9 Islands 75 3,237 1,064 167 1,156 55,550 35.5
Source: INEA, FADN database.
Table 6 – Structural parameters of the FADN organic livestock farms, 2011
Farms UAA of which UAA for
fodder LSU FWU TWU LSU/UAA
UAA/
TWU FWU/TWU UAA land capital
n. ha ha n. n. n. ha % €
Organic farms specialised in the breeding of grazing animals
North-West 13 56.1 55.6 40.1 1.6 1.8 0.7 31.4 91.1 4,655
North-East 32 58.6 48.3 92.1 2.0 2.5 1.6 23.3 78.6 11,227
Centre 40 96.8 77.9 92.7 1.6 2.3 1.0 42.1 70.2 6,905
South 23 64.0 49.2 77.7 1.6 2.3 1.2 28.1 68.4 6,512
Islands 35 104.8 91.2 84.0 1.4 1.7 0.8 61.4 80.7 4,685
Organic farms of mixed crops-breeding
North-West 20 35.0 30.7 35.7 1.2 1.4 1.0 24.9 88.9 9,771
North-East 11 21.8 15.8 43.5 1.9 1.9 2.0 11.2 100.0 12,593
Centre 36 76.5 60.0 52.5 1.7 2.0 0.7 38.6 83.8 10,420
South 13 119.1 62.2 52.5 1.3 2.4 0.4 48.8 51.5 5,087
Islands 10 86.5 83.6 49.1 1.0 1.7 0.6 50.6 58.7 8,780
32 and in the islands, where sheep-goat breeding is also notably widespread. A greater herd density is observed in the North-East regions (especially in the Veneto and Emilia-Romagna Po Valley), because of the presence of livestock businesses that are large in size and strongly capitalised, as can be inferred from the high value of the land capital/UAA index.
Breeding according to the organic methods guarantees satisfying economic results, although heterogeneous in reference to the various geographical areas. The profitability of labour is greater in the case of the specialised livestock farms of the North-East and Centre while in the case of non-specialised farms, the best performance in terms of NI/FWU can be observed for organic farming in central Italy and the Islands. The North-East farms are distinguished by the greater intensity of the production processes, testimony both to the greater productivity of the land, expressed by the GSP/UAA ratio, and by the high current costs with LSU,
and a greater tendency to outsource farm production such as animal feed.
Public support for FADN organic farms
The information in the FADN confirms how the support envisaged by the Common Agricultural Policy (CAP) considered overall, significantly influences the revenue of the farmers. In both the subsamples in question (organic and conventional), the majority of farms receive a total CAP contribution (EU, national and regional share) which accounts on average for 40% of the net profit on beneficiary organic farms and 37% on conventional farms.
In particular, the support from the first CAP pillar in both production systems represents the greatest amount of overall CAP aid received by the agricultural holdings, even if it has a smaller relative impact on organic farms (63% of the total CAP aid compared to 83% of the conventional farms). The greater inclination of organic farms to multi-Tab. 7 – Risultati economici delle aziende biologiche zootecniche RICA, per ripartizione geografica, 2011
Farms GSP/UAA Current costs/
LSU Long-term costs/LSU Operating pro-fit/LSU Net profit/LSU Net profit/GSP
n. € € € € € %
Organic farms specialised in livestock
North-West 13 1,093 497 337 510 21,266 56.4
North-East 32 4,668 1,466 181 987 53,107 38.3
Centre 40 1,661 523 238 751 49,639 49.8
South 23 2,125 665 194 672 37,301 42.8
Islands 35 795 323 130 421 36,120 59.7
Mixed organic farms crops-livestock
North-West 20 1,951 586 273 801 26,022 47.6
North-East 11 7,199 2,412 173 863 20,370 25.2
Centre 36 1,760 936 267 1,130 39,576 48.8
South 13 957 744 274 765 33,339 36.8
Islands 10 749 269 147 601 42,229 65.4
functionality, which enables compliance with a greater number of rural development measures, along with specific support aimed at the organic production system, explains the diverse distributions of CAP aid between the first and second pillar in the two production systems. Moreover, production orientations also influence aid distribution, as in the case of arable crops where a particularly predominant contribution of the first pillar is shown in both the production models. The aid related to the first pillar on average influences the net profit of conventional farms more than that of organic farms (32% compared to 27%). On the other hand, the support related to the second pillar accounts for 25% of the net profit of the organic farms compared to 20% of the conventional farms.
The organic farms greatly benefit from EU aid, both in relation to the first and second pillar. In particular, the percentage of organic farms that receive aid of the second pillar amounts to 67%, compared to 26% of the conventional farms. This can be mainly explained by the agro-environmental measures, including specific support for organic farming. However, it must be said that not all organic farms considered in the FADN sample receive this aid, for two reasons: the available funds are limited and therefore do not allow all requests for aid from farms to be accepted, furthermore the bureaucratic difficulties in requesting the aid discourage the farmers from applying, and the level of payment is not always deemed sufficient for the heavy costs involved in organic production methods.
Graph 2 – Incidence of farms receiving EU aid by type of contribution received (%) - 2011
Source: INEA, FADN database
Graph 3- Incidence of EU subsidies on the net profit of farms (%) – 2011
Source: INEA, FADN database
Organic Conventional 0 20 40 60 80 100 120
CAP subsidies 1st pillar
subsidies subsidies 2nd pillar Agro-environmental subsidies
Organic Conventional 0 5 10 15 20 25 30 35 40 45
CAP/RN 1st pillar/RN 2nd pillar subsidies
34
Graph 4 – Distribution of CAP subsidies between first and second pillars, 2011
Source: INEA, FADN database
1st pillar subsidies 2nd pillar subsidies
Organic farms 0% 20% 40% 60% 80% 100% Arable crops Permanent Crops Grazing Mixed All
1st pillar subsidies 2nd pillar subsidies
Conventional farms 0% 20% 40% 60% 80% 100% Arable crops Permanent Crops Grazing Mixed All
4. The market
Despite a general reduction in the consumption of farm food products, the global turnover of organic products and foods continues to grow. Organic Monitor estimates a total turnover of 63 billion dollars in 2011 (equal to 47.8 billion euros), showing a 6.3% increase on 2010. The demand is mainly concentrated in North America and Europe which together represent 96% of the sales.
The countries to record the highest turnover on the domestic market are the United States with 21 billion euros, Germany (6.6 billion euros) and France (3.8 billion euros). Italy is in sixth place after Canada and the United Kingdom with a domestic market value of 1.7 billion euros. The market value is therefore concentrated in North America and Europe, while the organically farmed areas are not always located in these same zones. For example, North America represents around 50% of the total market Graph 1 – Comparison between the % weight on total surface areas and value of the organic market in various continents, 2011
Source: FIBL-IFOAM.
Graph 2 – The top ten countries in the world by national turnover (million euros), 2011
*Data refers to 2010. Source: FIBL-IFOAM 50,0 46,0 2,1 1,9 7,5 28,5 9,9 54,0 0 10 20 30 40 50 60 North America Europe Asia Other continents
surface area % share % market share
965 1.000 1.065 1.411 1.720 1.882 1.904 3.756 6.590 21.038 0 5.000 10.000 15.000 20.000 25.000 Spain japan* Austria Switzerland Italy United Kingdom Canada* France Germany Usa
value compared to its rating of just 7.5% in terms of area. On the other hand, in other continents such as Asia, Oceania and Latin America, the amount of surface area is much higher compared to that of the market.
As regards the European market, in 2011 it was estimated at 21.5 billion euro (19.7 billion in the EU) by FIBL-IFOAM , with an increase of 9% compared to 2010. In 2011, the market grew more than the surface areas and at higher rates compared to those of the previous six-month period. The country with the most significant turnover was Germany (6.6 billion euros in 2011) followed by France (3.8 billion) and the United Kingdom (1.9 billion). Italy is ranked in fourth place with 1.7 billion euros and a rating of 8% on the total EU market value. A remarkable seven European countries are included among the first ten in the world for national turnover.
36 Italy is also the fourth European country by greatest increase on the market in 2011 (+11%), after Croatia (+20%), Holland (+15%) and Denmark (+13%).
Many of these large markets depend even more on imports, such as France, for example, which imports around 30% of its organic products.
The countries with an organic sector that is higher compared to the total food market are Denmark, Austria and Switzerland, with an incidence of no less than 5%. Moreover, the annual per capita expenses are concentrated above all in these countries; Switzerland is in first place with 177 euros followed by Denmark with 162 euros and Luxembourg (134 euros). However this mainly regards small and medium sized markets.
The household purchases of packaged
organic products in large-scale retail in Italy
The Italian market of organic products is recording a growth in all channels. In particular, according to ISMEA findings, the trend of domestic consumption of packaged organic products in large-scale retail has been continually increasing since 2005.
On analysis of the most recent data, it can be observed that also in 2012, the purchases of packaged organic products continued to grow (+7.3%1 in value) in contrast to farm food purchasing that has remained stationary. The organic sector does not seem to be affected by the crisis, probably due to the growth in consumer awareness of safeguarding health and respecting the environment. Moreover, in 2012 the consumer prices of organic products (see Chapter 5) grew less than the conventional prices, possibly influencing the consumer’s choice of purchase. This dynamic depended greatly on the two-figure increases shown for purchases of organic biscuits, confectionery and snacks (+22.9%) and non-alcoholic drinks (+16.5%) and to a lesser extent on increases of pasta, rise, bread substitutions (+8.9%) and fresh and processed fruit and
vegetables (+7.8%). There was a more contained increase in organic milk and dairy products (+4.5%) while eggs were the only sector that showed a slight fall in price (-1.9%). A large part of the consumption of organic products is concentrated in just a few categories: the first four (fresh and processed vegetables, milk-dairy, egg, biscuits,
confectionery and snacks) covered three quarters of the total spending on organic products by Italian families at large-scale retail in 2012.
The optimal performance of the organic sector is highlighted further when compared with relative trends of quality certified products and the entire farm food sector in general. In fact, as in the case of the last five years, 2012 also saw improved performance in the purchase of organic products with respect to those for PDO and PGI wine and produce, and for farm food in general.
1 Also in consideration of exports, a value of around 3.1 billion euros is estimated.
Source. ISMEA Panel Famiglie GFK-Eurisko
Tab. 1 - Acquisti domestici in valore di prodotti bio confezionati, 2012
Var. %
2012/11 % impact on total,
2012 Total packaged organic products
of which: 7.3 100.0
Fresh and processed vegetables 7.8 30.5
Milk and dairy 4.5 22.6
Eggs -1.9 12.5
Biscuits, confectionery and snacks 22.9 9.4
Pasta 5.5 2.4
Rice and bread substitutes 10.3 6.1
Non-alcoholic drunks 16.5 6.5
Sugar, coffee, tea 0.4 3.2
Fresh and processed meat 4.8 2.0
The most purchased products in 2012 were eggs (around 13% of the overall expenditure on packaged organic products), maintaining its ranking of 2011. Nevertheless, eggs showed a 1.9% decrease compared to 2011 as was also the case of yoghurt (-4.1%). However, positive trends were seen for jam and marmalade (+15.7%) and for drinking milk (+8.6%), which account for more than 8% of consumption in both cases.
Moreover there were significant increases for the bread substitutes, fruit juices and soya drinks with only a very slight increase for organic biscuits.
The sector of organic products includes food with a high penetration potential with respect to the overall consumption of food products (organic and non-organic). This regards for the most part high consumption articles, where evidently the consumer’s awareness of the method of organic production is more marked (salads, eggs, stock) but also products of mass consumption (milk,
Graph 3 – Trend in purchases of organic packaged products and other quality sections and of farm foods in general* (% variation on the previous year)
*The data include the 87-90% of the total value of packaged organic products purchased for domestic consumption. % Variation on the previous year.
Source. ISMEA Panel Famiglie GFK-Eurisko.. -4,1% 1,2% 9,2% 8,5% 5,2% 6,7% 11,7% 8,8% 7,3% -12% -10% -8% -6% -4% -2% 0% 2% 4% 6% 8% 10% 12% 2004 2005 2006 2007 2008 2009 2010 2011 2012
Doc-DOCG Wines PDO and PGI products Total farm foods Organic packaged products
(large-scale retail)
Table 2 – Trends of household purchases in value of main packaged organic products, 2012
Var. %
2012/11 Peso % sul tot. 2012
Total organic packaged of which:
7.3 100.0
Eggs -1.9 12.5
Jam and marmalade 15.7 8.8
Milk 8.6 8.6
Yogurt -4.1 8.2
Bread substitutes 14.5 5.6
Fruit Juice 19.2 3.0
Soya non-alcoholic drinks 55.8 3.0
Biscuits 1.9 3.0
38 yogurt, pasta, jam), offered in a wide range in the organic sector.
Household consumption of packaged organic products continues to grow in value in all the geographical areas with the exception of the South. In particular, purchases in the Centre (+15%) increase while the increase in the North is more contained (+10.2% in the North-East and +1.9% in the North-West), still maintaining the highest number in value of organic purchases (70.8%). However, spending in the South has decreased (-7.1%) where the market values were already rather limited (around 7% of the total).
The other channels
ISMEA monitors the data relating to household consumption in the non-specialised channels for which the statistics relating to the purchases in the large-scale retail channel are examined in detail. There are no official quantitative statistics relating to the sales2 trends on the other channels, including that of the specialised shops, although some information is available from the Bio Bank data.
According to the Bio Bank, the number of specialised shops in Italy amounts to 1,270 units in 2012 (4.8% compared to 2011). 65% of these shops are located in the North, 21.2% in the Centre and 13.8% in the South (including the Islands). Besides the important channel of specialised shops, there is a constant growth in other forms of sale that, even if still presenting limited market shares, attract a growing interest from the consumer. This refers to direct sale, Ethical Purchasing Groups (EPG) and organic markets.
The number of sales points, monitored by Bio Bank, is constantly increasing in relation to almost all the channels, at a more sustained pace in the case of Ethical Purchasing Groups and direct sales. On the other hand, the organic markets have shown a renewed increase after two years of slight decline.
In recent years there have also been significant increases in terms of units in the non-household channels (organic school canteens, restaurants, agri-tourisms), particularly for agri-tourisms and canteens. The latter of these generates significant market values.
Table 3 – Trends of household purchases in value of packaged organic products in 2012 by geographic area
% variation 2012/2011 % incidence on the total, 2012 Total Italy 7.3 100.0 Of which: North West 1.9 36.8 North East 10.2 34.0 Center1 15.0 22.3 South2 -7.1 6.9 1 Including Sardinia 2 Including Sicily
Source: ISMEA, Panel Famiglie GFK-Eurisko
Table 4 – Trends of household purchases of organic packaged products by distribution channel, 2012
Var. % 2012/11
Total packaged organic products 7.3
Of which:
Super and Hypermarkets 5.5
Discount stores 25.5
Traditional shops 10.7
Mobile vendors 6.7
Source: ISMEA, Panel Famiglie GFK-Eurisko
Graph 4 – Evolution of the number of sales points in some organic channels (index-linked data, 2005=100)
Source: Processing on Bio Bank Data
Graph 5 – Evolution of the number of sales points in some extra-household organic channels (index-linked data, 2005 = 100)
Source: Processing on Bio Bank Data
100 150 200 250 300 350 400 450 2005 2006 2007 2008 2009 2010 2011 2012 Organic farms with direct sales
Organic
markets Ethical Purchasing Groups 100 110 120 130 140 150 160 170 180 190 200 2005 2006 2007 2008 2009 2010 2011 2012
School canteens Agri-tourisms Restaurants
Table 5. – The evolution of the number of some organic product distribution channels
2005 2006 2007 2008 2009 2010 2011 2012
Organic farms with direct sale 1,199 1,324 1,645 1,943 2,176 2,421 2,535 2,795
Organic markets 185 193 204 208 225 222 213 234
Ethical Purchasing Groups 222 288 356 479 598 742 861 891
Source: Bio Bank
Table 6 – The evolution of the number of some non-household channels of organic products
2005 2006 2007 2008 2009 2010 2011 2012
School canteens* 647 658 683 791 837 872 1,116 1,196
Agri-tourisms 804 839 1,002 1,178 1,222 1,302 1,349 1,541
Restaurants 171 177 174 199 228 246 267 301
* The number refers to the municipalities in which there are organic school canteens. Source: Bio Bank