Water 2020, 12, 305; doi:10.3390/w12010305 www.mdpi.com/journal/water Review
Surface Water and Groundwater Quality in South
Africa and Mozambique—Analysis of the Most
Critical Pollutants for Drinking Purposes
and Challenges in Water Treatment Selection
Paola Verlicchi * and Vittoria Grillini Department of Engineering, University of Ferrara, Via Saragat 1, 44122 Ferrara, Italy; [email protected] * Correspondence: [email protected]; Tel.: +39‐(0)‐532‐974‐938 Received: 10 December 2019; Accepted: 16 January 2020; Published: 20 January 2020Abstract: According to a recent report by the World Health Organization (WHO), the countries
which still have limited access to water for drinking purposes are mainly those in the Sub‐Saharan region. In this context, the current study provides an overview of the quality of surface water and groundwater in rural and peri‐urban areas of the Republic of South Africa (RSA) and Mozambique (MZ) in terms of concentrations of conventional pollutants, inorganic chemicals, microorganisms, and micropollutants. Their values were compared with the drinking water standards available for the two countries. Regarding surface water, it was found that microorganisms occur at high concentrations; nickel (RSA) and boron (MZ) are other critical parameters. Regarding groundwater, arsenic and lead (RSA) and boron, sodium, and chloride (MZ) are the main critical substances. With regard to micropollutants, their surface water concentrations are much higher than those in European rivers. The highest values were for ibuprofen, acetylsalicylic acid, clozapine, and estriol. Suitable treatment is necessary to produce safe water depending on the main critical pollutants but, at the same time, action should be taken to improve wastewater treatment in rural areas to improve and safeguard surface water bodies and groundwater which are sources for drinking needs. Keywords: drinking water; groundwater quality; Mozambique; peri‐urban area; rural area; rural water cycle; Republic of South Africa; surface water quality 1. Introduction According to the recent World Health Organization (WHO) report [1], the countries which still have limited access to water for drinking purposes are mainly those in the Sub‐Saharan region.
In the case of small rural communities, it may be very expensive to guarantee safe water by means of small decentralized water treatment plants (including investment, and operational and maintenance costs) fed by surface water or groundwater. Pollution of source water may be due to many different natural and anthropic causes, including: geochemical processes, heavy rain, flooding, release of untreated wastewater (generated within the rural communities) and industrial effluents, manure spreading on soil, land runoff, acid mine drainage, and infiltration‐percolation of water from polluted sites [2–5]. In addition, in order to produce a safe water, the (decentralized) treatment train must be able to face sudden changes in the feeding water and in order to always guarantee a safe water, the personnel managing the treatment system must know the contamination risks occurring from the water source to the different users and also evaluate which actions should be taken to face them [6].
In the case of centralized water treatment plants, namely water works in urbanized areas, characterized by a high flow rate to treat, these issues have been deeply investigated over the years
[7–9]. For them, the designing phase (i) takes into considerations the expected variability of the water sources, (ii) selects treatment technologies resulting adequate from a technical and economic view point, (iii) includes a monitoring system able to control the quality of the water under the whole treatment. Once completed the waterworks, the remote monitoring system is able to provide information about the status of the operations and in case of malfunctions, the personnel is immediately informed and may face and solve the problem.
In the case of decentralized water treatments, less is known from many points of view. Referring the attention to the rural and peri‐urban areas of the Sub‐Saharan region, the qualitative and quantitative characteristics of the potential water sources are often not well defined, access to safe water is still limited [1], existing small treatment plants frequently present technical and management problems due to scarce and inadequate maintenance, and security culture is missing [10]. In this context, the European project H2020 SafeWaterAfrica (https://safewaterafrica.eu/en/home) contributed to filling some knowledge gaps. The aim of this project is to investigate the possibility of developing a water treatment plant for small communities in the rural and peri‐urban areas of the Republic of South Africa (RSA) and Mozambique (MZ). In order to support the choices for the treatment train to adopt, it is necessary to know the quality of surface water and groundwater in the study area and of its variability around the year.
Bearing this in mind, the current study provides an overview of the surface water and groundwater quality in rural and peri‐urban areas in terms of macropollutants (namely conventional parameters), inorganic chemicals, and micropollutants as well as microorganisms in RSA and MZ and discusses the possibility of withdrawing the water for drinking purposes. In order to evaluate how polluted these waters are, the water quality standards for potable use established in RSA and MZ are provided and compared with the observed variability ranges of concentrations. In this way, it is possible to identify the most critical pollutants in surface water and groundwater and relate them to their potential origin. Finally, the paper highlights interventions which could improve the quality of source water for drinking needs and provides recommendations on water treatment selection. 2. The Area under Study
The area under study is RSA and MZ (approximately 1.2 million km2 and 800,000 km2
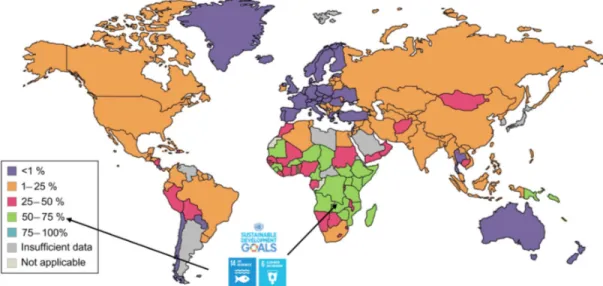
respectively). In RSA, the resident population in 2019 is estimated at around 58.8 million [11]. According to statistical data from the last formal census in 2018, 80.1% of the population are living in formal settlements, 13.1% in traditional settlements, and 5% in informal housing (corresponding to 2,940,000 people) [12]. Based on the World Bank data referring to 2018, (https://data.worldbank.org/ indicator/SP.RUR.TOTL.ZS?locations=ZA), the rural population in RSA corresponds to 34% of the whole inhabitants. In MZ, the population in 2017 was around 28 million inhabitants [13], with 69% living in rural areas [14]. Access to (safe) drinking water is limited in some regions of RSA and in most of MZ. Figure 1 shows the percentage of the rural population using untreated surface water or groundwater for potable needs all over the world. The data is taken from 2017. A look at the online map of Figure 1 [15] shows that, in MZ, rural population using untreated surface or groundwater corresponds to 60% and the remaining 40% of the rural population uses improved water which is available at a distance from their households. In RSA, the corresponding percentages are 19% and 81%, respectively. Safely managed water in these rural areas is not available. According to local regulations in RSA, basic water services are defined as 25 L/day per person [16], and, as suggested by the Department of Water Affairs, this is equal to 60 L/d per person [17]. In MZ, this figure is less than 10 L/d per person, according to the United Nations Development Programme report [18]. These values are much lower than those reported by [18] for European countries (around 200–300 L/person day) and for the US (around 575 L/person day). Table S1 reports details of the average per capita water requirements for different categories of settlement according to the report by the Department of Water Affairs, South Africa [17].
Figure 1. Percentage of the rural population using surface water or groundwater for drinking needs
without any treatment. Focus on Sub‐Saharan region. (Adapted from [15]).
In RSA and MZ, the treatment of wastewater generated in rural and peri‐urban areas (namely: rural settlement wastewaters) is absent or scarce [15]. This practice leads to deterioration of the quality of the local surface water and also of the local groundwater resources due to percolation/infiltration. In addition, livestock farms, which represent an important activity for the rural communities, are not safely managed from an environmental view point and generally their household wastewaters, zootechnical effluents, and manure are directly released into surface water bodies or are directly spread on soil [19]. 2.1. Investigations Included in this Overview—Collected Parameters This study collects quality data on the surface water and groundwater in RSA and MZ from 44 peer reviewed papers published between 2001 and 2019. Forty‐two papers refer to RSA and only 3 to MZ (one paper [20] presents data from both countries); 36 papers provide concentrations of pollutants in surface water bodies (20 for a first group of contaminants including: macropollutants, polycyclic aromatic hydrocarbons (PAHs), inorganic chemicals, and microorganisms, and 16 for a second group covering different classes of micropollutants) and 11 in groundwater (9 for the first group of contaminants and 2 for the second group).
The selection of papers to include in this review was based on these criteria. The study has to present investigations in rural or peri‐urban area in RSA or MZ; it has to monitor surface water or groundwater in terms of common macropollutants (also called conventional pollutants), inorganic chemicals (namely heavy metals), polycyclic aromatic hydrocarbons (PAHs), microorganisms, as well as micropollutants (mainly pharmaceuticals, fragrances, parabens, X‐ray contrast media). Values of concentration were included in this review, if a satisfactory description of the sampling mode and frequency was reported in the corresponding reference and analytical methods were well reported. In some cases, papers were included even if they investigated urban areas in addition to peri‐urban or rural areas. This is the case of long rivers in RSA and MZ which cross urbanized areas and then peri‐urban and rural areas before discharging into the ocean. Table S2 in the Supplementary Material reports the main characteristics of the study areas in which sampling campaigns took place in each of the papers included in the review (namely: types of areas, place of investigations, monitored parameters and, where available, number of withdrawn samples). The selected parameters consist of 12 macropollutants, 25 inorganic chemicals (mainly heavy metals), 5 microorganisms, total PAHs, and 103 micropollutants (mainly pharmaceuticals, hormones, plasticizers, and pesticides), which are all reported in Table 1. Three thousand five hundred and thirty‐four (3534) pieces of data were collected for macropollutants, inorganic chemicals, PAHs, and microorganisms, and 1640 values for micropollutants. Their occurrence is
reported in graphs and compared with the standards established in RSA and MZ for drinking purposes. The data are then discussed in order to identify the main critical pollutants in cases where the water containing such contaminants is used for drinking purposes. Table 1. Selected macropollutants, polycyclic aromatic hydrocarbons (PAHs), inorganic chemicals, microorganisms, and micropollutants included in the review. Group Compounds Macropollutants Ammonium, bicarbonate, chloride, chlorite, fluoride, nitrate, nitrite, phosphate, phosphorus, sulfate, total dissolved solids, total nitrogen PAHs Total PAHs Inorganic chemicals Aluminum, arsenic, barium, boron, bromine, cadmium, calcium, chromium, copper, iron, lead, lithium, magnesium, manganese, mercury, molybdenum, nickel, potassium, rubidium, silver, sodium, strontium, uranium, vanadium, zinc Microorganisms E. coli, Enterococci, heterotrophic bacteria, fecal coliform, total coliforms
Group Class Compounds
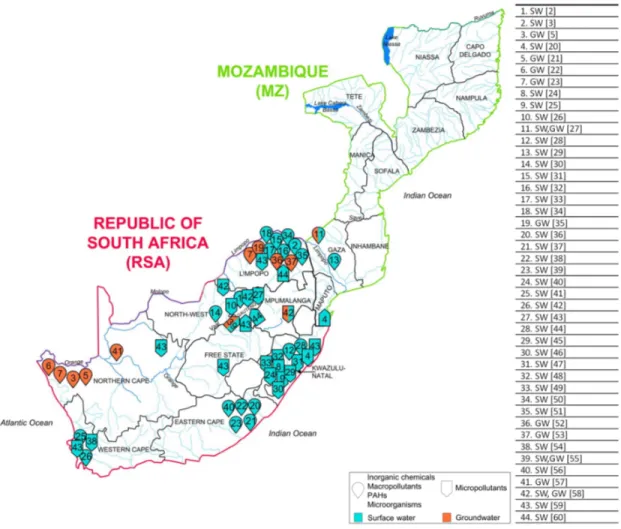
Micropollutants Analgesics and anti‐ inflammatories (A) Acetaminophen, acetylsalicylic acid, codeine, diclofenac, ibuprofen, ketoprofen, meclofenamic acid, mefenamic acid, methocarbamol, n‐desmethyltramadol, naproxen, o‐ desmethyltramadol, phenacetin, tramadol Antiarrhythmic agent (B) Amiodarone Antibiotics (C) Ampicillin, azithromycin, chloramphenicol, chlortetracycline, ciprofloxacin, clarithromycin, dehydroerythromycin, erythromycin, nalidixic acid, oxytetracycline, streptomycin, sulfadimidine, sulfamethazine, sulfamethoxazole, sulfapyridine, sulfasalazine, tetracycline, trimethoprim, tylosin Antidiabetics (D) Gliclazide, metformin Antihistamines (E) Fexofenadine Antihypertensives (F) Irbesartan, valsartan Antiseptics (G) Triclocarban, triclosan Antivirals (H) Didanosine, efavirenz, emtricitabine, lamivudine, lopinavir, nevirapine, stavudine, tenofovir, zalcitabine, zidovudine Beta‐blockers (I) Atenolol Drug precursor (J) Pseudoephedrine Fragrances (K) Galaxolide, musk ketone, tonalide Hormones (L) 17‐ethinylestradiol, 17‐oestradiol, androstenedione, estriol, estrone, cortisone, progesterone, testosterone Lipid regulators (M) Atorvastatin, bezafibrate Parabens (N) Methylparaben, propylparaben Psychiatric drugs (O) Carbamazepine, carbamazepine‐10, 11‐epoxide, clozapine, diazepam, desvenlafaxine, licarbazepine, venlafaxine Stimulants (P) 1, 7‐Dimethylxantine, amphetamine, caffeine, cotinine, methamphetamine, nicotine UV filters (Q) Benzophenone‐3, benzophenone‐4 X‐ray contrast media (R) Iopromide Pesticides (S) Atrazine, bromacil, carbendazim, chlorpyrifos, diazinon, diuron, lindane, linuron, metolachlor, simazine, terbuthylazine, terbutryn Plasticizers (T) 2, 4, 6 Trichlorophenol, 4‐nonylphenol, 4‐t‐amylphenol, 4‐ t‐butylphenol, 4‐t‐octylphenol, bisphenol A, dibutylphthalate The map in Figure 2 reports where the investigations included in this study took place, with the corresponding references. Due to lack of information, it is not possible to specify with a higher level
of detail the place of the reviewed investigations. They generally refer to rural and peri‐urban areas, in a few exceptions, they refer to urbanized areas, in case of monitoring of micropollutants in long rivers (see Table S2). Looking at Figure 2, it is easy to distinguish between the investigations dealing with macropollutants, PAHs, inorganic chemicals, and microorganisms or micropollutants, and surface water or groundwater.
Figure 2. Map showing the places where the reviewed investigations took place, together with the
type of water analyzed (surface water or groundwater), the group of monitored pollutants (macropollutants/inorganic chemicals/PAHs/microorganisms or micropollutants) and the corresponding references [2,3,5,20–60].
2.2. National Standards for Potable Use in RSA and MZ
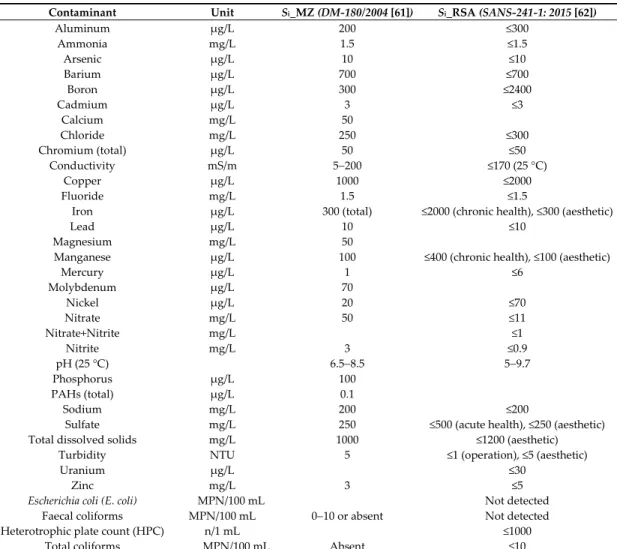
Table 2 reports the legal limits for most of the selected macropollutants, inorganic chemicals,
and microorganisms according to the regulations in Mozambique, Si_MZ (DM‐180/2004 [61]), and
the South African national standards Si_RSA (SANS‐241‐1: 2015 [62]). These values will be compared
with the measured concentrations found in the two types of water sources (surface water and groundwater) in the areas under study.
Table 2. Drinking water quality standards established in Mozambique (Si_MZ) and South Africa
(Si_RSA).
Contaminant Unit Si_MZ (DM‐180/2004 [61]) Si_RSA (SANS‐241‐1: 2015 [62])
Aluminum μg/L 200 ≤300 Ammonia mg/L 1.5 ≤1.5 Arsenic μg/L 10 ≤10 Barium μg/L 700 ≤700 Boron μg/L 300 ≤2400 Cadmium μg/L 3 ≤3 Calcium mg/L 50 Chloride mg/L 250 ≤300 Chromium (total) μg/L 50 ≤50 Conductivity mS/m 5200 ≤170 (25 °C) Copper μg/L 1000 ≤2000 Fluoride mg/L 1.5 ≤1.5
Iron μg/L 300 (total) ≤2000 (chronic health), ≤300 (aesthetic)
Lead μg/L 10 ≤10 Magnesium mg/L 50 Manganese μg/L 100 ≤400 (chronic health), ≤100 (aesthetic) Mercury μg/L 1 ≤6 Molybdenum μg/L 70 Nickel μg/L 20 ≤70 Nitrate mg/L 50 ≤11 Nitrate+Nitrite mg/L ≤1 Nitrite mg/L 3 ≤0.9 pH (25 °C) 6.58.5 59.7 Phosphorus μg/L 100 PAHs (total) μg/L 0.1 Sodium mg/L 200 ≤200 Sulfate mg/L 250 ≤500 (acute health), ≤250 (aesthetic) Total dissolved solids mg/L 1000 ≤1200 (aesthetic)
Turbidity NTU 5 ≤1 (operation), ≤5 (aesthetic)
Uranium μg/L ≤30
Zinc mg/L 3 ≤5
Escherichia coli (E. coli) MPN/100 mL Not detected
Faecal coliforms MPN/100 mL 010 or absent Not detected
Heterotrophic plate count (HPC) n/1 mL ≤1000
Total coliforms MPN/100 mL Absent ≤10
Based on the comparison, the selected parameters will be divided into six groups according to the criteria defined in Table 3 called the Variability Range‐Standards criteria. To complete the analysis of the collected data, for each pollutant, the percentage of the exceeding of the corresponding standard for the two different water supplies (surface water and groundwater) will be evaluated. Table 3. Criteria defining the classification of monitored pollutants based on their concentration ci found in this review with respect to the corresponding standard Si_C defined in the country C (C = RSA or MZ) reported in Table 2. Group Variability Range‐Standards Criteria 1 Maximum measured concentrations of pollutant ci,max < standard Si_C 2 75° percentile < Si_C ≤ 100° percentile of collected values of concentrations 3 50° percentile < Si_C ≤ 75° percentile of collected values of concentrations 4 25° percentile < Si_C ≤ 50° percentile of collected values of concentrations 5 Si_C ≤ 25° percentile of collected values of concentrations 6 Minimum measured concentrations ci,min > Si_C
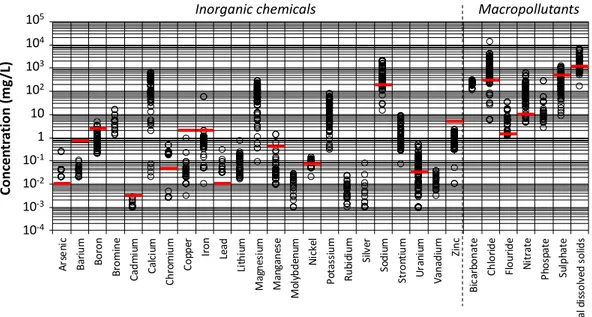
3. Results 3.1. Occurrence of Macro‐Pollutants, Inorganic Chemicals, PAHs, and Microorganisms in Surface Water Figures 3 and 4 refer to concentrations of chemical parameters measured in surface water in RSA and MZ, grouped according to class of inorganic chemicals, macropollutants, and PAHs. In addition, the values of the corresponding standards Si_C established in national laws for drinking water (Table 2) are reported (red dash) to show how far the investigated parameter (in the water source which could be withdrawn for drinking purposes) is from the corresponding standard.
Limiting the attention to macropollutants, it emerges that only nitrite in RSA (Figure 3) and chloride, sulfates and total dissolved solids in MZ (Figure 4) occurred in concentrations higher than the corresponding national legal limit. It is interesting to observe that in Figure 3, most data refer to inorganic chemicals, such as some common heavy metals (727 versus 107 which regard the other groups: macropollutants and PAHs). This may be related to the fact that mining is one of the most important economic activities in RSA and different investigations were carried out to monitor the quality of surface water receiving mine drainage. Moreover, heavy metals in surface water may also be due to runoff of soil where fertilizers and biocides were used for agriculture needs [42]. Only a few data (176) are available for MZ (see Figure 4) referring to [27,29]. The highest concentration was found for iron in surface water in RSA (513 mg/L, [42]). Very high values were often found in rivers (as well as in groundwater due to leaching) near ferrochrome smelters [63], a fairly common activity of which RSA is world leader.
A wide variability range was reported for many metals (mainly Al, Zn, Cd, and Cu): this variability is correlated to intense rain events responsible for land runoff and the resuspension of sediments in the river beds, resulting in the release of adsorbed substances [32,34].
A high level of arsenic in surface water may also be due to agricultural drains, local sediments disposal, and pollutants falling to the ground which have been emitted from incineration of municipal and industrial wastes as well as to geochemical origin, as discussed in the following. However, mining activities remain one of the main sources of surface water pollution. The maximum value reported in Figure 3 refers to a rural area characterized by the presence of mining activities [29]. Figure 3. Observed concentrations (circle) of inorganic chemicals, macropollutants, and total PAHs in surface water in the reviewed studies referring to RSA and the corresponding limits (red dashes) set by SANS‐241 for drinking water. Data from: [3,30–34,36–39,41,42,44,50]. Al um in u m Ar se ni c Ca d m iu m Ch ro m iu m Co pp er Ir on Le ad Ma n gan es e Me rc ur y Ni ck el Ur an iu m Zi n c A m m oni um Ch lo ri d e Fl ou ri d e Ni tr at e Ni tr it e Ph os p at e Ph os ph or us Su lp ha te To ta l di ss o lv ed s olid s To ta l ni tr og en To ta l PA H s Inorganic Chemicals 104 103 102 10 1 10‐1 10‐2 10‐3 10‐4 Co nc e n tr at io n (m g /L ) 10‐5 10‐6 Macropollutants
With regard to polycyclic aromatic hydrocarbons (PAHs), [33,50] report that they are associated with the presence of industrial activities in rural and peri‐urban areas; improper waste disposal in the facility area, which could cause the release of organic chemicals, including PAHs; and fumes from fossil fuel combustion being deposited back on the land.
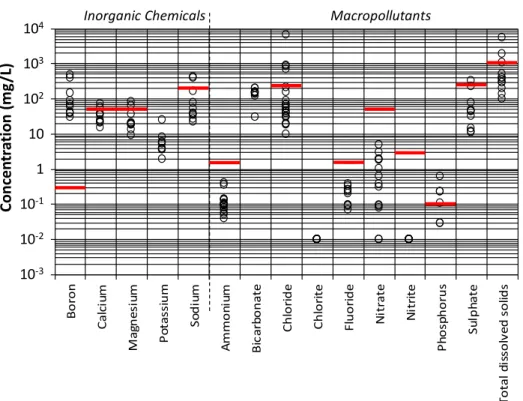
Figure 4. Observed concentrations (circles) of inorganic chemicals and macropollutants in surface
water in the reviewed studies referring to Mozambique and the corresponding limits (red dashes) set by current national legislation (red line) for drinking water. Data from: [27,29].
As to pollutants in MZ surface water (Figure 4), it was found that based on the modest number of collected data (176 data), concentrations are generally lower than the corresponding ones found in South African rivers. In both countries, it emerges that the main causes of pollution can be associated with inorganic chemicals. Analysis of the observed ranges of concentrations for the different pollutants and the corresponding legal standards leads to the classification of the compounds, as reported in Table 4. Table 4. Classification of the compounds occurring in surface water, according to Variability Range‐ Standard criteria (Table 3) applied to specific RSA and MZ regulations for drinking water (Table 2). Group South Africa Mozambique Parameter % of Exceeding the Standard Parameter % of Exceeding the Standard ci,max < Si Uranium, zinc, ammonium, chloride, fluoride, nitrate, sulfate, Total dissolved solids 0% Ammonium, fluoride, nitrite, nitrate 0% 75° perc. < Si ≤ 100° perc Arsenic, copper, manganese, nitrite 17% 2% 9% 20% Total dissolved solids calcium, magnesium, sodium, chloride, sulfate 24% 20% 20% 20% 18% 10% 50° perc. < Si ≤ 75° perc. Mercury 44% ‐ 25° perc. < Si ≤
50° perc. Cadmium, chromium, lead 60% 75% 64% Phosphorus 67%
Si ≤ 25° perc. Aluminum, iron 97% 76% ‐ Bo ro n Ca lc iu m Ma gn e si u m P o ta ssi um So di u m A m m o ni um Bi c a rb o n ate Ch lo ri d e Ch lo ri te Fl uor ide Ni tr a te Ni tr it e P h osp h or us Su lp h a te To ta l di ss o lv e d s o lid s 103 102 10 1 10‐1 10‐2 10‐3
Co
n
ce
n
tr
at
io
n
(m
g
/L
)
Inorganic Chemicals Macropollutants 104ci,min > Si Nickel 100% Boron 100% Comparison not possible Phosphate, phosphorus, total nitrogen, PAHs ‐ Potassium, bicarbonate, chlorite ‐ It emerges that nickel, in RSA, and boron, in MZ, are the parameters with concentrations that always exceed the corresponding standards for drinking water set by local regulations (see Table 2). Other pollutants with a high percentage of exceeding the corresponding standard were found only in RSA and correspond to: aluminum (97%), iron (76%), and chromium (75%).
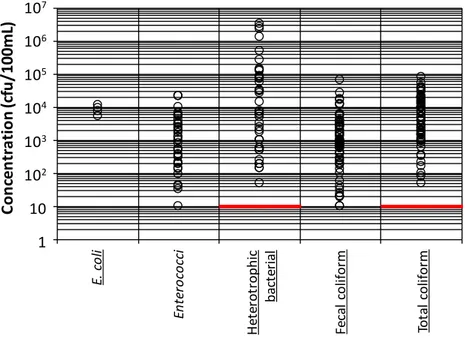
With regard to microorganisms, surface water contains high concentrations of all the investigated species (Figure 5). In addition, pathogenic bacteria such as Vibrio cholerae, Aeromonas hydrophila, Shigella, Plesiomonas shigelloides, and Salmonella species were isolated from the various river water sources in RSA [64]. This could be due to land runoff from areas characterized by the presence of grazing animals where manure may be applied on the soil, and where untreated rural and zootechnical wastewater may be directly released in the water bodies or spread on the soil, thus contributing to the emission of microorganisms in the rural water cycle [65].
Figure 5. Observed concentrations of microorganisms (circles) in surface water in the reviewed
studies referring to South Africa and the corresponding limits set by SANS‐241 (red dashes) for drinking water. In the X axis, the underlined names refer to indicator bacteria, those not underlined refer to pathogen bacteria. Data from: [2,3,28,37,44,51,56].
Matlou et al. [66] found that in 170 water samples collected from springs, dams, and rivers in the North West province of South Africa, 45 samples were positive for the presence of the three species of Enterococcus: E. faecium, E. faecalis, and E. saccharolyticus frequently associated with vancomycin resistance determinants, usually responsible for in‐hospital and community‐acquired infections in humans.
Microorganisms have to be included among the design pollutants in drinking water treatment [51] and an adequate disinfection step should be selected to guarantee the removal of the different species occurring in the water source and also to guarantee the safe quality at the user point.
In addition, in order to reduce the potential development of antibiotic resistant bacteria, proper treatments of the different types of wastewater, including hospital effluents, should be adopted before their release into surface water bodies [26,67,68]. E. C o li E n te ro co cc i H e te ro tr ophi c ba ct er ia l Fe ca l Co lif o rm To ta l Co lif o rm E. co li En te ro co cc i He te ro tr o p h ic ba ct er ia l Fe ca l colif o rm To ta l co lifo rm
10
710
610
510
1
10
410
310
2Co
n
ce
n
tr
a
ti
o
n
(c
fu
/100mL
)
3.2. Occurrence of Macro‐Pollutants and Microorganisms in Groundwater
A higher number of pollutants were investigated in groundwater in RSA with respect to surface water, however, in a smaller number of papers (8 versus 15 for surface water). Also in this water compartment, most data refer to inorganic chemicals as reported in Figures 6 and 7 (1619 for inorganic chemicals versus 710 for other macropollutants). Based on the collected data, it emerges that, in RSA, only the measured concentrations of barium, cadmium, copper, and zinc are always below the corresponding standard limits for drinking purposes. The collected values for concentrations of arsenic and lead always exceed the corresponding drinking standard. In MZ, based on the limited number of collected data (195 overall in one investigation [27]), it is possible to observe that in many cases, the monitored parameters exceed the national standard for drinking purposes. Only the observed ranges of ammonia and nitrite concentrations are always lower than the corresponding limits. Regarding chloride, the high concentrations may be associated with the improper management and treatment of domestic wastewater and fertilizers, as this element has long been used as a biocide. It could also be due to natural sources such as brines and seawater intrusion [27]. The high concentrations of metals in groundwater may be due to infiltration and percolation of acidic mine drainage, but also to natural causes. The main geochemical processes are often oxidation reactions, leaching, evaporation, and other interactions between host rocks and water [5]. Whereas arsenic, of which the levels are often higher than the corresponding standard limit (Figure 6), may be present in sulfide ores associated with other metals (pyrite, arsenopyrite, and chalcopyrite) such as copper, lead, silver, and gold. Arsenic can be released from these natural sources by the combined effects of mineral weathering and high‐evaporation rates. It can also come from the desorption of mineral oxides and reductive dissolution of iron and manganese oxides in reducing conditions. It is often associated with the presence of volcanic rocks and geothermal water. Finally, this could also be due to the discharge of industrial activities (glass manufacturing, steel melting process, and its use as a wood preservative) and to agricultural activities (the use of pesticides as mentioned above) [21]. In addition, microorganisms may be present in groundwater due to percolation/infiltration of untreated wastewater. This is the case reported by [19] for the groundwater below 37 dairy farms in the central Free State province of South Africa: E. coli was occasionally found up to 2.4 104 CFU/100 mL and its mean value in the monitoring campaign was equal to 84.5 CFU/100 mL in 2009 and 3.9 CFU/100 mL in 2013. Another example is given by [69] who investigated the occurrence of bacteria (E. coli, fecal, and total coliforms) in boreholes in the peri‐urban areas of Maputo where small‐scale independent water providers are present. It emerged that fecal coliforms were found in four sites in the range from 9 to 240 CFU/100 mL; E. coli occurred in three sites between 1 and 13 CFU/100 mL, and finally, total coliforms were present in 13 sites from 4 to 460 CFU/100 mL. An analysis of the characteristics of the sites around the boreholes with the highest levels of bacteria contamination shows that the main reasons of the contamination were due to absence of sewer and seepage from on‐site sanitation.
According to the recent study [27], in the Limpopo National Park, Gaza province, in the south of Mozambique, only 13.3% of the groundwater was suitable for drinking purposes and the remaining was brackish and undrinkable due to the high content of chloride and sodium, which are naturally present. Regarding surface waters, it was found that 80% was suitable for drinking water. Based on the collected data in this review, it emerges that further investigations are necessary to improve the knowledge of the quality level of river water, in order to establish the proper actions to increase access to water in rural areas of this country which is currently very low. Table 5 groups the compounds according to the Variability Range‐Standard criteria defined in Table 3. In addition to the reported pollutants whose concentration always exceeds the corresponding standard, it emerges that nitrate and sodium in RSA and calcium in MZ present high percentage of exceeding: 78%, 77%, and 93% respectively. A comparison between Tables 4 and 5 shows that, for Mozambique, boron and chloride were also critical for surface water, while, for South Africa, nickel was the most critical compound for surface water bodies.
Figure 6. Observed concentrations (circles) inorganic chemical and macropollutants in groundwater
in the reviewed studies referring to South Africa and the corresponding limits (red dashes) set by SANS‐241 (red line) for drinking water. Data from: [5,21–23,35,52,53,57]. Figure 7. Observed concentrations of macropollutants and heavy metals (circle) in groundwater in the reviewed studies referring to Mozambique and the corresponding limits set by local legislation (red line) for drinking water. Data from: [27]. Ar se ni c Ba ri u m Bo ro n Bro m in e Ca d m iu m Ca lc iu m Ch ro mi u m Cop p er Ir o n Le ad Li th iu m Ma gn es iu m Ma ng an es e Mo ly bde nu m Ni ck el Po ta ss iu m Ru bi di u m Si lv er So di um Str o nt iu m Ur an iu m V ana di um Zinc Bi ca rb o n at e Ch lo ri d e Fl our id e Ni tr at e Ph o sp at e Su lp ha te Tot al di ss o lv ed s o lid s Inorganic chemicals Macropollutants 105 104 102 10 1 10‐1 10‐2 10‐3 10‐4 103 Con cen tr at ion (m g /L ) 1 1 0 0 0 Bo ro n Ca lc iu m Ma gn es iu m P ot assi um So di um A mmon iu m Bi ca rb o n at e Ch lo ri d e Ch lo ri te Fl ou ri de Ni tr at e Ni tr it e Su lp ha te
10
410
310
210
1
10
‐110
‐210
‐3Co
n
ce
n
tr
at
io
n
(m
g
/L
)
Inorganic chemicals
Macropollutants
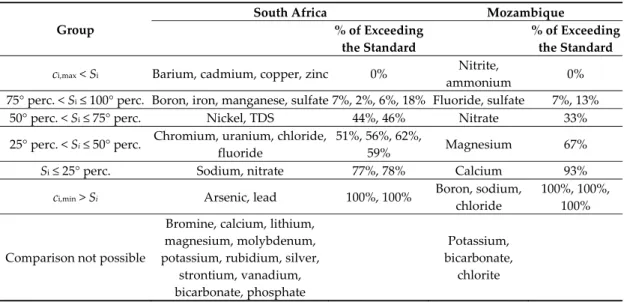
Table 5. Classification of the compounds occurring in groundwater, according to the Variability Range‐Standard criteria (see Table 3) applied to specific South African and Mozambican regulations for drinking water (see Table 2). Group South Africa Mozambique % of Exceeding the Standard % of Exceeding the Standard ci,max < Si Barium, cadmium, copper, zinc 0% Nitrite,
ammonium 0%
75° perc. < Si ≤ 100° perc. Boron, iron, manganese, sulfate 7%, 2%, 6%, 18% Fluoride, sulfate 7%, 13%
50° perc. < Si ≤ 75° perc. Nickel, TDS 44%, 46% Nitrate 33%
25° perc. < Si ≤ 50° perc. Chromium, uranium, chloride, fluoride
51%, 56%, 62%,
59% Magnesium 67%
Si ≤ 25° perc. Sodium, nitrate 77%, 78% Calcium 93%
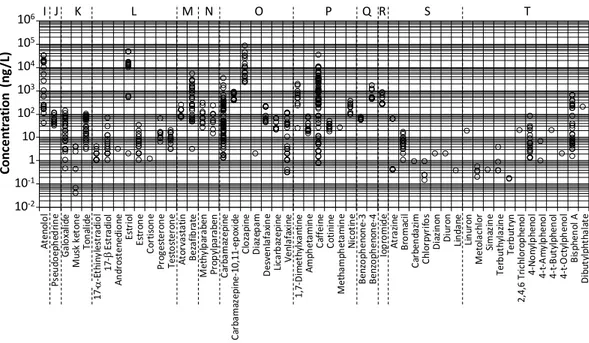
ci,min > Si Arsenic, lead 100%, 100% Boron, sodium, chloride 100%, 100%, 100% Comparison not possible Bromine, calcium, lithium, magnesium, molybdenum, potassium, rubidium, silver, strontium, vanadium, bicarbonate, phosphate Potassium, bicarbonate, chlorite 3.3. Occurrence of Micropollutants in Surface Water and Groundwater Selected investigations dealing with micropollutants refer to different surface water bodies in RSA (see Figure 2) and provide concentrations of compounds belonging to the 20 classes compiled in Table 1. The collected data are reported in Figures 8 and 9, grouped according to their class. Figure 8. Observed concentrations of micropollutants belonging to classes (A) (Analgesics and anti‐ inflammatories), (B) (Antiarrhythmic agents), (C) (Antibiotics), (D) (Antidiabetic), (E) (Antihistamines), (F) (Antihypertensives), (G) (Antiseptics), and (H) (Antivirals) in surface water in the reviewed studies referring to South Africa. Data from: [20,24–26,40,43,45,46,48,49,55,59,60]. Ac et am in op he n Ac et yl sa lic yl ic ac id Co de in e Di cl of en ac Ib u pr of en Ke to pr o fe n Me cl o fe n am ic ac id Me fe n am ic ac id Me th o ca rb amo l N ‐de sm et hy lt ra m ad ol Na pr ox en O ‐de sm et hy lt ra m ad ol Ph en ac et in Tr am ad ol A m io da ro ne A m pi ci llin Az it hr om yc in Ch lo ra m ph en ic ol Ch lo rt et rac yc lin e Ci pr of lo xa ci n Cl ar it hr om yc in De hy d ro er yt hr om yci n Er yt hr om yc in Na lid ix ic ac id O xy te tr acy cl in e St em p to m yc in Su lfad im id in e Su lfa m et ha zi n e Su lfa m et ho xa zol e Su lfap yr id in e Su lfas ala zi n e Te tr ac yc lin e Tr ime th op rim Ty lo si n Gl ic la zi ne Me tf or m in Fe xo fe na di ne Ir be sa rt an Va ls ar ta n Tr ic lo ca rb an Tr ic lo sa n D ida no si n e Efa vi re nz Em tr ic it ab in e La m iv ud in e Lo p in av ir Ne vi ra p in e St av ud in e Te no fo vi r Za lc it ab in e Zi d ov u di ne 104 106 105 103 10 1 10‐1 102 Co n ce n tr at io n (n g /L ) A B C D E F G H
Figure 9. Observed concentrations of micropollutants belonging to classes (I) (Beta‐blockers), (J)
(Drug precursors), (K) (Fragrances), (L) (Hormones), (M) (Lipid regulators), (N) (Parabens), (O) (Psychiatric drug), (P) (Stimulants), (Q) (UV filters), (R) (X‐ray contrast media), (S) (Pesticides), and (T) (Plasticizers) in surface water in the reviewed studies referring to South Africa. Data from: [24– 26,43,47–49,54,55,58–60]. It emerges that the most frequently monitored classes were antibiotics (372 values), analgesics and anti‐inflammatories (347 values), psychiatric drugs (155 values), and antivirals (154 values). It was found that concentrations of pharmaceuticals may be very high in surface water: this occurs for acetylsalicylic acid (159,900 ng/L, [48]), ibuprofen (84,600 ng/L, [49]), clozapine (78,300 ng/L, [48]), phenacetin (68,300 ng/L, [40]), estriol (46,200 ng/L, [54]), caffeine (33,200 ng/L, [49]) and atenolol (30,000 ng/L, [24]). Most investigations noted that higher concentrations were found in winter than in summer depending on the typical consumption pattern. The highest values refer to over‐the‐ counter drugs which can be administered without any prescription and thus their use is very frequent and concentrations are found in all the investigated rivers [24]. A comparison with observed values in some European countries [4] shows that concentrations in African surface water are, with a few exceptions, 2–185 times higher than concentrations found in European surface water bodies. Regarding the antibiotics azithromycin and sulfapyridine and the antidiabetic metformin, the concentrations were lower than those found in European rivers, whereas values for the hormone 17‐ β‐oestradiol, it was up to 4750 times higher.
With regard to antiviral substances, it is worth noting that the focus is mainly on anti‐retroviral compounds used for HIV treatment (reverse transcriptase inhibitors and protease inhibitors) in surface water [55,59,60]. Fekadu et al. [4] underlined that in European countries, high detection frequencies of these compounds were less reported and appear to be much more region‐specific. This fact is strictly related to the different consumption patterns of antiretroviral drugs typical of European countries and South African regions, as reported by [70].
The occurrence of micropollutants in surface water may be related to the release of scarcely‐ treated effluents from urban wastewater treatment plants; untreated wastewater from rural areas [45,48]; zootechnical farm effluents; or runoff from land on which livestock graze or sludge and manure are spread on the soil [54].
Regarding the occurrence of micropollutants in groundwater, only a few studies are available [47,55] and refer to some boreholes and shallow wells in RSA. It was found that the antivirals nevirapine, efavirenz, and the psychiatric drug carbamazepine, always occurred around 2–13 ng/L in different samples withdrawn from the Dam Hartbeespoort, Gauteng province, over the year
At en ol o l Ps eu do ep h ed ri n e Ga lo xa lid e Mu sk ke to ne To n al id e 17 ‐a ‐E thi ny le st ra di o l 17 ‐b Es tr ad io l A n dr os te ne di o ne Es tr io l Es tr on e Co rt is on e Pr og es te ro n e Tes to st er on e At or va sta ti n Be za fib ra te Me th yl p arab en Pr op yl pa ra be n Ca rb am az ep in e Ca rb am az ep in e‐ 10 ,1 1‐ ep ox id e Cl o zap in e Dia ze p am De sv en la fa xi n e Li ca rb az ep in e Ve nl af ax in e 1,7 ‐Dim et hy lx an ti ne Am ph et am in e C affei ne C oti ni ne Me th am ph et am in e Ni co ti n e Be nz o ph en on e‐ 3 Be nz o ph en on e‐ 4 Io p ro m id e At ra zi ne Br o m ac il Ca rb en da zi m C hlo rp yr ifo s Di az in on Di ur on Li n da ne Li n ur on Me to lach lo r Si m az in e Ter b ut hy la zi n e Te rb ut ry n 2, 4, 6 Tr ic hl or op he no l 4‐ No ny lp he no l 4‐ t‐ Am yl p he no l 4‐ t‐ Bu ty lp he n ol 4‐ t‐ Oc ty lp h en o l Bi sp he n ol A D ibu ty lp ht ha la te 104 106 105 103 10 1 10‐1 102 Conc e n tr at io n (n g /L ) I J K L M N O P Q R S T 10‐2
(samples were taken in the four seasons) [55]. In [58], it was found that in Mpumalanga province, bisphenol A and the fragrances galaxolide and tonalide were found respectively around 181, 3477, and 26 ng/L. With regard to Mozambique, one study [20] investigated the urban rivers around Maputo and reported high concentrations of antibiotics. In particular, they found sulfamethizole varying between 511 and 53,828 ng/L, erythromycin‐H20 in the range of 20–2700 ng/L, trimethoprim in the range of 289–6223 ng/L, and clarithromycin in the range of 5–13 ng/L. Other antibiotics were found below the corresponding limit of quantification or were not detected during the sampling campaign. This was the case for oxytetracycline and sulfapyridine (respectively found only once equal to 1793 and 6 ng/L). 5. Discussion and Conclusions Based on the collected data, it emerges that the release into surface water bodies of untreated or inadequately treated effluents from households, industries, and zootechnical farms are quite often one of the main causes of different contaminants occurring in the water. Once in the environment, such contaminants may be subjected to different natural removal mechanisms (hydrolysis, photodegradation, biodegradation, sorption, sedimentation, etc.), reducing their dissolved concentrations. For more persistent compounds, this attenuation could be quite modest and their concentrations may keep high for a long time and at great distances. If the release of untreated or scarcely‐treated effluents is continuous or frequent, the quality of the receiving water body is destined to deteriorate over time. In designing a waterworks for rural areas in these regions, it is quite difficult to define the quality of the water source feeding into the potential water treatment plant, as the quality of this water is destined to worsen. The plant will in fact have some difficulties coping with the changes in the water being fed into the plant and in guaranteeing the production of safe water that is suitable for drinking. Variability in the main chemical and microbiological characteristics of the water fed into the plant is tolerated and is mainly due to natural events such as heavy rainfall, which leads to increased turbidity and resuspended contaminants due to induced turbulence. In this context, a preliminary study investigating the expected variability of the feeding is absolutely necessary [8].
A waterworks consists of a multibarrier system, which is a sequence of steps where different removal mechanisms may retain, transform, and remove different pollutants from the water: raw materials, turbidity, colloidal substances, inorganic compounds, and microorganisms, etc. If well managed, the waterworks should guarantee continuous water purification in line with the legal requirements over the long term. Specific treatments could be added after the construction of the waterworks if revised local regulations lead to the definition of new standards for some pollutants (of emerging concern, or introduced for the first time in the specific regulation) or more restrictive standards for contaminants that are already regulated. With regard to the current situation in the rural areas of RSA and MZ, it emerges that the quality of surface water and groundwater will worsen over time due to the release of insufficiently treated or untreated wastewater linked to the existing anthropic activities (rural settlements, industries, and livestock farms) and their expected development. In order to guarantee that the construction of waterworks will produce safe water in the long term in areas where access to drinking water is still modest, such as those under study, other actions must be planned and completed at the same time. This refers to the whole rural or peri‐urban water cycle. A quick look at the graph of Figure 10 could help better understand this concept. The graph represents the water quality in a rural or peri‐urban water cycle in terms of quality level (Y axis) at the different steps (i.e., withdrawal, potabilization, wastewater production by different users, wastewater treatment, release into the environment) versus time (X axis). It shows that in the case of improper treatment of wastewater released into the receiving body, the surface water quality will worsen and thus, over a short period of time, the local waterworks will require specific and further treatments to guarantee the production of safe water for the users over time. In some areas, such as those under study, access to safe water could be increased for the local population if interventions are planned to increase the percentage of properly‐treated wastewater
(domestic, industrial, and zootechnical). These actions will guarantee that the surface water quality level will not worsen and the suggested waterworks will be able to function as planned without the need for any upgrading during its lifespan. In Figure 10, the blue dotted line refers to the water quality level in an urban water cycle, where treatments for drinking purposes and for wastewater are already present. The release of the treated effluent is regulated and would not lead to deterioration of the receiving water body. Sometimes, wastewater should be subjected to specific treatments that are able to produce “restored” water or “purified” water for specific needs (direct reuse, recycling in an activity). In this way, the reclaimed water is not discharged and directly destined to other functions and, at the same time, natural water is preserved and protected. Figure 10. Water quality versus time in the case of inadequate treatments are present for wastewater produced by anthropic activities. The dashed line refers to the case in which treatment is present and properly works. The graph reports two “cycles” (cycle 1 and n) occurring over two periods in the same place where no wastewater treatments are present, thus the quality of the surface water receiving the untreated wastewater gets worse and worse.
With regard to the characteristics of proper drinking water plants in rural areas, for small communities, based on the main results of the outlined overview, it emerges that great attention should be paid to the accurate selection of adequate pre‐treatments that are able to face the expected wide variability ranges of concentrations for the main contaminants in the withdrawn water.
In addition to turbidity and microorganisms, which may reach very high values in the case of rain events [10], it was found that the most critical compounds are metals. The coagulation‐ precipitation treatment is the recommended step able to reduce suspended solids and metals. In this context, the system proposed by [71], known as PRE‐Disinfection‐Column PREDICO, could be a valuable solution as a pre‐treatment: it combines coagulation–flocculation, lamellar sedimentation, and filtration into a single‐column unit. In addition, it is able to treat highly polluted surface water which may occur quite often in South African and Mozambican rivers. It is also able to act as a reliable barrier for the subsequent disinfection steps which could be performed by conventional chemical systems (namely chlorination [69]) as well as by the electrochemical disinfection steps investigated in [68,72] by means of the CabECO© cell, specifically tested in surface water in RSA and MZ. To conclude, efforts to increase the access to safe water in small rural communities in the sub‐ Saharan areas must include: in depth investigations on the source water quality; selection of reliable, flexible, and adequate water treatments on the basis of the expected feeding water quality and its variability; monitoring of the waterworks in order to control the status of the plant and to face any type of malfunctioning and to reduce the risk of producing unsafe water. These three points underline that the concept of water security must be taken into consideration in any step from the water treatment plant design to its operation. Wastewater Drinking water Treated water Surface water Groundwater Spring Untreated wastewater directly in surface water “Purified”water “Restored” water Time Wa te r qual it y Legend:
Urban water cycle
Rural and peri-urban water cycle
Worsening of the fresh water quality
first cycle n cycle
Supplementary Materials: The following are available at www.mdpi.com/link, Table S1. Average per capita
water requirements for different categories of settlements; Table S2. Main characteristics of the sampling pounts in the peer reviewed papers included in this study.
Author Contributions: P.V. conceived and designed the study; V.G. collected and processed the data; P.V. and
V.G. wrote the paper. All authors have read and agreed to the published version of the manuscript.
Funding: This project received funding from the European Union’s Horizon 2020 research and innovation
programme under grant agreement No. 669925 (the “SafeWaterAfrica” project). Conflicts of Interest: The authors declare no conflict of interest. Abbreviations The following abbreviations are used in this manuscript: MZ Mozambique PAHs Polycyclic aromatic hydrocarbons RSA Republic of South Africa WHO World Health Organization References
1. WHO. Progress on Drinking Water, Sanitation and Hygiene 2017. Available online: https://apps.who.int/iris/bitstream/handle/10665/258617/9789241512893‐eng.pdf?sequence=1 (accessed on 26 November 2019).
2. Abia, A.L.K.; Ubomba‐Jaswa, E.; Momba, M.N.B. Impact of seasonal variation on Escherichia coli concentrations in the riverbed sediments in the Apies River, South Africa. Sci. Total Environ. 2015, 537, 462– 469, doi:10.1016/j.scitotenv.2015.07.132.
3. Edokpayi, J.N.; Odiyo, J.O.; Msagati, T.A.M.; Potgieter, N. Temporal variations in physico‐chemical and microbiological characteristics of Mvudi river, South Africa. Int. J. Environ. Res. Public Health 2015, 12, 4128– 4140, doi:10.3390/ijerph120404128.
4. Fekadu, S.; Alemayehu, E.; Dewil, R.; Van der Bruggen, B. Pharmaceuticals in freshwater aquatic environments: A comparison of the African and European challenge. Sci. Total Environ. 2019, 654, 324–337, doi:10.1016/j.scitotenv.2018.11.072.
5. Abiye, T.; Leshomo, J. Metal enrichment in the groundwater of the arid environment in South Africa. Environ. Earth Sci. 2014, 72, 4587–4598, doi:10.1007/s12665‐014‐3356‐9. 6. Vörösmarty, C.J.; McIntyre, P.B.; Gessner, M.O.; Dudgeon, D.; Prusevich, A.; Green, P.; Glidden, S.; Bunn, S.E.; Sullivan, C.A.; Liermann, C.R.; et al. Global threats to human water security and river biodiversity. Nature 2010, 467, 555–561, doi:10.1038/nature09440. 7. Hoekstra, A.Y.; Buurman, J.; Van Ginkel, K.C.H. Urban water security: A review. Environ. Res. Lett. 2018, 13, doi:10.1088/1748‐9326/aaba52. 8. Flindt Jørgensen, L.; Villholth, K.G.; Refsgaard, J.C. Groundwater management and protection in Denmark: A review of pre‐conditions, advances and challenges. Int. J. Water Resour. Dev. 2017, 33, 868–889, doi:10.1080/07900627.2016.1225569.
9. Lapworth, D.J.; Nkhuwa, D.C.W.; Okotto‐Okotto, J.; Pedley, S.; Stuart, M.E.; Tijani, M.N.; Wright, J. Urban groundwater quality in sub‐saharan africa: Current status and implications for water security and public health. Hydrogeol. J. 2017, 25, 1093–1116, doi:10.1007/s10040‐016‐1516‐6.
10. Momba, M.N.B.; Obi, C.L.; Thompson, P. Survey of disinfection efficiency of small drinking water treatment plants: Challenges facing small water treatment plants in South Africa. Water SA 2009, 35, 485– 494, doi:10.4314/wsa.v35i4.76795.
11. STATS SA. Statistics South Africa. Statistical release P0302. Mid‐year Population Estimates for 2019. Available online: http://www.statssa.gov.za/publications/P0302/P03022019.pdf (accessed on 26 November 2019).
12. STATS SA. Statistics South Africa. Statistical Release P0318. General Household Survey for 2018. Available online: http://www.statssa.gov.za/publications/P0318/P03182018.pdf (accessed on 26 November 2019).
13. INE (Istituto Nacional de Estatistica). Censo 2017, IV Recenseamento Geral da População e Habitação (RGPH) 2017 (In Portuguese). Available online: http://www.ine.gov.mz/operacoes‐ estatisticas/censos/censo‐2007/censo‐2017/divulgacao‐de‐resultados‐preliminares‐do‐iv‐rgph‐
2017.pdf/view (accessed on 26 November 2019).
14. FAO. Food and Agriculture Organization of the United Nations. AQUASTAT Report 2016. Country Profile—Mozambique. Available online: http://www.fao.org/3/i9805en/I9805EN.pdf (accessed on 26 November 2019).
15. WHO/UNICEF. World Health Organization/ United Nations Children’s Fund. JMP Global Database, 2017. Available online: https://washdata.org/data/household#!/ (accessed on 26 November 2019).
16. RSA. Republic of South Africa. GNR.509 of 8 June 2001: Regulations Relating to Compulsory National Standards and Measures to Conserve Water. Regulation Gazette 7079, Government Gazette 22355. Available online: https://cer.org.za/wp‐content/uploads/2011/10/Regulations‐relating‐to‐compulsory‐ national‐standards‐and‐measures‐to‐conserve‐water.pdf (accessed on 26 November 2019). 17. DWA. Department of Water Affairs, South Africa 2009. Development of Reconciliation Strategies for all Towns in the Southern Planning Region: Inception Report; Prepared by Umvoto Africa (Pty) Ltd. in Association with Aurecon (Pty) Ltd. on behalf of the Directorate: National Water Resource Planning; Department of Water Affairs: Pretoria, South Africa, 2009. 18. UNDP (United Nations Development Programme). Human Development Report 2006. Beyond Scarcity:
Power, Poverty and the Global Water Crisis. Available online:
http://hdr.undp.org/sites/default/files/reports/267/hdr06‐complete.pdf (accessed on 26 November 2019). 19. Esterhuizen, L.; Fossey, A.; Potgieter, E. Groundwater quality on dairy farms in central South Africa. Water
SA 2015, 41, 194–198, doi:10.4314/wsa.v41i2.04.
20. Segura, P.A.; Takada, H.; Correa, J.A.; El Saadi, K.; Koike, T.; Onwona‐Agyeman, S.; Ofosu‐Anim, J.; Sabi, E.B.; Wasonga, O.V.; Mghalu, J.M.; et al. Global occurrence of anti‐infectives in contaminated surface waters: Impact of income inequality between countries. Environ. Int. 2015, 80, 89–97, doi:10.1016/j.envint.2015.04.001.
21. DM 180/2004. Diploma Ministerial n. 180/2004. Boletim da República de Moçambique I (Serie, n. 37). Regulamento Sobre a Qualidade da agua para o Consumo Humano. Available online: http://extwprlegs1.fao.org/docs/pdf/moz65565.pdf (accessed on 26 November 2019).
22. SANS 241‐2015. South Africa National Standard 2015. Drinking Water; Part 1: Microbiological, Physical, Aesthetic and Chemical Determinands; Part 2: Application of SANS 241‐1. Available online: https://www.mwa.co.th/download/prd01/iDW_standard/South_African_Water_Standard_SANS_241‐ 2015.pdf (accessed on 26 November 2019).
23. Jackson, V.A.; Paulse, A.N.; Odendaal, J.P.; Khan, W. Investigation into the Metal Contamination of the Plankenburg and Diep Rivers, Western Cape, South Africa. Water SA 2009, 35, 289–300, doi:10.4314/wsa.v35i3.76766. 24. Barbieri, M.; Ricolfi, L.; Vitale, S.; Muteto, P.V.; Nigro, A.; Sappa, G. Assessment of groundwater quality in the buffer zone of Limpopo National Park, Gaza Province, Southern Mozambique. Environ. Sci. Pollut. Res. 2019, 26, 62–77, doi:10.1007/s11356‐018‐3474‐0. 25. Chilundo, M.; Kelderman, P.; Ókeeffe, J.H. Design of a water quality monitoring network for the Limpopo river basin in Mozambique. Phys. Chem. Earth 2008, 33, 655–665, doi:10.1016/j.pce.2008.06.055.
26. Loock, M.M.; Beukes, J.P.; van Zyl, P.G. Conductivity as an indicator of surface water quality in the proximity of ferrochrome smelters in South Africa. Water SA 2015, 41, 705–711, doi:10.4314/wsa.v41i5.14. 27. Edokpayi, J.N.; Odiyo, J.O.; Popoola, O.E.; Msagati, T.A.M. Assessment of trace metals contamination of
surface water and sediment: A case study of Mvudi river, South Africa. Sustainability 2016, 8, 135, doi:10.3390/su8020135. 28. Edokpayi, J.N.; Odiyo, J.O.; Popoola, O.E.; Msagati, T.A.M. Evaluation of temporary seasonal variation of heavy metals and their potential ecological risk in Nzhelele river, South Africa. Open Chem. 2017, 15, 272– 282, doi:10.1515/chem‐2017‐0033. 29. Dzoma, B.M.; Moralo, R.A.; Motsei, L.E.; Ndou, R.V.; Bakunzi, F.R. Preliminary findings on the levels of five heavy metals in water, sediments, grass and various specimens from cattle grazing and watering in potentially heavy metal polluted areas of the north west Province of South Africa. J. Anim. Vet. Adv. 2010, 9, 3026–3033, doi:10.3923/javaa.2010.3026.3033.
30. Edokpayi, J.N.; Odiyo, J.O.; Popoola, O.E.; Msagati, T.A.M. Determination and distribution of polycyclic aromatic hydrocarbons in rivers, sediments and wastewater effluents in Vhembe district, South Africa. Int. J. Environ. Res. Public Health 2016, 13, 387, doi:10.3390/ijerph13040387.
31. Nekhavhambe, T.J.; van Ree, T.; Fatoki, O.S. Determination and distribution of polycyclic aromatic hydrocarbons in rivers, surface runoff, and sediments in and around Thohoyandou, Limpopo Province, South Africa. Water SA 2014, 40, 415–424, doi:10.4314/wsa.v40i3.4.
32. Edokpayi, J.N.; Odiyo, J.O.; Olasoji, S.O. Assessment of heavy metal contamination of Dzindi River, in Limpopo Province, South Africa. Int. J. Nat. Sci. Res. 2014, 2, 185–194. 33. Fatoki, O.S.; Awofolu, R. Levels of Cd, Hg and Zn in some surface waters from the Eastern Cape Province, South Africa. Water SA 2003, 29, 375–380, doi:10.4314/wsa.v29i4.5042. 34. Fatoki, O.S.; Muyima, N.Y.O.; Lujiza, N. Situation analysis of water quality in the Umtata river catchment. Water SA 2001, 27, 467–473, doi:10.4314/wsa.v27i4.4959. 35. Fatoki, O.S.; Lujiza, N.; Ogunfowokan, A.O. Trace metal pollution in Umtata river. Water SA 2002, 28, 183– 189, doi:10.4314/wsa.v28i2.5160. 36. Fatoki, O.S.; Awofolu, O.R.; Genthe, B. Cadmium in the Umtata river and the associated health impact on rural communities who are primary users of water from the river. Water SA 2004, 30, 507–513, doi:10.4314/wsa.v30i4.5103.
37. Jackson, V.A.; Paulse, A.N.; Van Stormbroek, T.; Odendaal, J.P.; Khan, W. Investigation into metal contamination of the Berg river, Western Cape, South Africa. Water SA 2007, 33, 175–182, doi:10.4314/wsa.v33i2.49057.
38. Lin, J.; Biyela, P.T.; Puckree, T.; Bezuidenhout, C.C. A study of the water quality of the Mhlathuze river, KwaZulu‐natal (RSA): Microbial and physico‐chemical factors. Water SA 2004, 30, 17–22, doi:10.4314/wsa.v30i1.5021.
39. Nevondo, T.S.; Cloete, T.E. Bacterial and chemical quality of water supply in the Dertig village settlement. Water SA 1999, 25, 215–220.
40. Verlicchi, P.; Aviles Sacoto, E.C.; Zanni, G. Zootechnical Farm Wastewaters in Ecuador: A Treatment Proposal and Cost‐benefit Analysis. Water 2019, 11, 779, doi:10.3390/w11040779. 41. Bezuidenhout, C.C.; Mthembu, N.; Puckree, T.; Lin, J. Microbiological evaluation of the Mhlathuze river, KwaZulu‐natal (RSA). Water SA 2002, 28, 281–286, doi:10.4314/wsa.v28i3.4895. 42. Sibanda, T.; Chigor, V.N.; Okoh, A.I. Seasonal and spatio‐temporal distribution of faecal‐indicator bacteria in Tyume river in the Eastern Cape Province, South Africa. Environ. Monit. Assess. 2013, 185, 6579–6590, doi:10.1007/s10661‐012‐3048‐4. 43. Obi, C.L.; Potgieter, N.; Bessong, P.O.; Matsaung, G. Assessment of the microbial quality of river water sources in rural Venda communities in South Africa. Water SA 2002, 28, 287–292, doi:10.4314/wsa.v28i3.4896.
44. Matlou, D.P.; Bissong, M.E.A.T.; Tchatchouang, C.‐D. K.; Adem, M.R.; Foka, F.E.T.; Kumar, A.; Ateba, C.N. Virulence profiles of vancomycin‐resistant Enterococci isolated from surface and ground water utilized by humans in the north west Province, South Africa: A public health perspective. Environ. Sci. Pollut. Res. 2019, 26, 15105–15114, doi:10.1007/s11356‐019‐04836‐5.
45. Odjadjare, E.E.; Igbinosa, E.O.; Mordi, R.; Igere, B.; Igeleke, C.L.; Okoh, A.I. Prevalence of multiple antibiotics resistant (MAR) pseudomonas species in the final effluents of three municipal wastewater treatment facilities in South Africa. Int. J. Environ. Res. Public Health 2012, 9, 2092–2107, doi:10.3390/ijerph9062092.
46. Archer, E.; Petrie, B.; Kasprzyk‐Hordern, B.; Wolfaardt, G.M. The fate of pharmaceuticals and personal care products (PPCPs), endocrine disrupting contaminants (EDCs), metabolites and illicit drugs in a WWTW and environmental waters. Chemosphere 2017, 174, 437–446, doi:10.1016/j.chemosphere.2017.01.101. 47. De Battisti, A.; Formaglio, P.; Ferro, S.; Al Aukidy, M.; Verlicchi, P. Electrochemical disinfection of
groundwater for civil use—An example of an effective endogenous advanced oxidation process. Chemosphere 2018, 207, 101–109, doi:10.1016/j.chemosphere.2018.05.062.
48. Abiye, T.A.; Bhattacharya, P. Arsenic concentration in groundwater: Archetypal study from South Africa. Groundw. Sustain. Dev. 2019, 9, doi:10.1016/j.gsd.2019.100246.
49. Matsinhe, N.P.; Juízo, D.; Rietveld, L.C.; Persson, K.M. Water services with independent providers in peri‐ urban Maputo: Challenges and opportunities for long‐term development. Water SA 2008, 34, 411–420, doi.org/10.4314/wsa.v34i3.180636.