Current Pharmaceutical Biotechnology, 2017, 18, 000-000 1
RESEARCH ARTICLE
1389-2010/17 $58.00+.00 © 2017 Bentham Science Publishers
Water-in-Oil Microemulsions for Protein Delivery: Loading Optimization
and Stability
Diego R. Perinelli
1, Marco Cespi
1, Stefania Pucciarelli
2, Silvia Vincenzetti
2,*, Luca Casettari
3,
Jenny K.W. Lam
4, Serena Logrippo
1, Elisa Canala
1, Mahmoud E Soliman
5, Giulia Bonacucina
1,*and Giovanni F. Palmieri
11School of Pharmacy, University of Camerino, via Gentile III da Varano, 62032 Camerino, MC, Italy; 2School of Biosciences and Veterinary Medicine, University of Camerino, via Gentile III da Varano, 62032 Camerino, MC, Italy; 3Department of Biomolecular Sciences, School of Pharmacy, University of Urbino, Piazza del Rinascimento, 6, 61029 Urbino (PU), Italy; 4Department of Pharmacology & Pharmacy, Li Ka Shing Faculty of Medicine, The University of Hong Kong, Pokfulam, Hong Kong; 5Department of Pharmaceutics and Industrial Pharmacy, Faculty of Pharmacy, Ain Shams University, Cairo, Egypt
Abstract: Background: Microemulsions are attractive delivery systems for therapeutic proteins and
peptides due to their ability to enhance bioavailability. Although different proteins and peptides have been successfully delivered through such ternary systems, no information can be found about protein loading and the formulation stability when such microemulsions are prepared with pharmaceutically-approved oils and surfactants. The aim of this work was to optimise a ternary system consisting of water/ ethyl oleate/SpanÒ 80-TweenÒ 80 and to determine its protein loading capacity and stability, using bovine serum albumin (BSA) as a model of biomolecule.
Methods: The optimization was carried out using a Central Composite Design and all the prepared
formulations were characterised through dynamic light scattering, rheology, optical and polarized mi-croscopy. Subsequently, the maximum loading capacity was determined and the stability of the final microemulsion with the highest content of protein was followed over six months. To investigate the structural features of the protein, BSA was recovered from the microemulsion and analysed through fluorescence spectroscopy.
Results: After incorporation of the protein in the microemulsion, a decrease of its aqueous solubility
was observed. However, the formulation remained stable over six months and the native-like state of the recovered protein was demonstrated by fluorescence spectroscopy
Conclusion: This study demonstrated the feasibility of preparing microemulsions with the highest
con-tent of protein and their long-term stability.
A R T I C L E H I S T O R Y Received: March 07, 2017 Revised: May 02, 2017 Accepted: May 02, 2017 DOI: 10.2174/1389201018666170508112947
Keywords: Design of experiments (DoE), formulation stability, protein loading, protein solubility, SDS-PAGE, ternary system. 1. INTRODUCTION
Microemulsions are optically isotropic and thermody-namically stable liquid systems [1], composed of water, oil and amphiphilic molecules, which find wide applications in several research fields (e.g. pharmaceutical, cosmetic and chemical industries) [2, 3].
*Address correspondence to these authors at the School of Pharmacy, Univer-sity of Camerino, via Gentile III da Varano, 62032 Camerino (MC), Italy; Tel: 0737/402289; Fax: 0737/402727; E-mail: [email protected]; and School of Biosciences and Veterinary Medicine, University of Camerino, via Gentile III da Varano, 62032 Camerino, MC, Italy; Tel: 0737/402722; Fax: 0737/402727; E-mail: ?????????????????
In the pharmaceutical field, microemulsions have been proposed as drug delivery systems for different routes of administration [4, 5] due to their favourable properties, such as spontaneous formation, thermodynamic stability, drug solubility enhancement, low viscosity and the possibility to be sterilized [6-9]. Particularly, microemulsions which pre-sent oil as the dispersant and water as the inner phase (some-times referred as water in oil, i.e. w/o microemulsion or re-verse micelles), have attracted interest by the scientific community since they could represent a suitable vehicle for the delivery of biological therapeutics [10]. In fact, formula-tions of microemulsion systems for the oral delivery of ther-apeutically-active peptides have already reached the market
(cyclosporine; Sandimmune Neoral®) or are under clinical trial evaluation (insulin, MacrulinTM) [11]. Their efficacy to improve the bioavailability of orally-administered macromo-lecular drugs is related to the ability of protecting protein or peptides from acidic or enzymatic degradation or enhancing their intestinal absorption [12, 13].
Many biological products have been reported to be en-capsulated in microemulsions [14-17]. Cheng et al. [18], demonstrated that a fibrinolytic enzyme, when incorporated in a w/o microemulsion, possesses a higher intestinal perme-ability and efficacy in vivo, with the respect to the protein solution. Moreover, Liu et al. found that the HIV transactiva-tor protein loaded in a w/o microemulsion, was protected against acid degradation [19]. The ability of w/o microemul-sions to improve storage stability of proteins and catalytic activity of enzymes was also reported [20-22].
However, to act as drug vehicles, the protein loading ca-pacity and the folding state of the protein loaded inside the microemulsions are critical issues.
To date, most of the data on protein loading and formula-tion stability are available only for microemulsions prepared with organic solvents (e.g. iso-octane) as external phase and high toxic surfactants (e.g. di-octyl sodium sulfosuccinate, AOT) [23-26]. On the contrary, there is a lack of information on microemulsions prepared with pharmaceutical grade ex-cipients and potentially suitable for the in vivo administration of proteins or peptides.
In the present study, a microemulsion, prepared with a pharmaceutically-approved oil (as external phase) and sur-factants, has been optimized using a response surface meth-odology (RSM). Protein loading capacity and formulation stability at the highest content of the protein were studied using bovine serum albumin (BSA) as a model of a macro-molecule. Due to the concerns related to the direct investiga-tion of the state of the protein inside the microemulsion, BSA was recovered from the ternary system and analysed by SDS-PAGE and fluorescence spectroscopy.
2. MATERIALS AND METHOD 2.1. Materials
Ethyl oleate, Tween® 80 (Polysorbate 80) and Span® 80 (Sorbitan monooleate) were supplied by ACEF (Fiorenzuola D’Arda, Italy). Sodium dodecyl sulphate (SDS) (BioReagent ≥ 98.5%) and bovine serum albumin (purity >96%) were purchased by Sigma Aldrich (UK). Sodium chloride (NaCl), disodium hydrogen phosphate (Na2HPO4) and potassium dihydrogen phosphate (KH2PO4) were purchased from Carlo Erba (Italy). Deionised water was obtained using a laborato-ry deionizer (Osmo lab UPW2, Gamma 3, Italy). Isotonic phosphate buffer at pH 7.4 was prepared by dissolving Na2HPO4 (22.2 mM) KH2PO4 (5.6 mM) and NaCl 123.3 mM in deionised water.
2.2. Formulation of Microemulsions 2.2.1. Experimental Design
Response Surface Methodology (RSM) is a reliable sta-tistical approach through which it is possible to study how
several factors affect the properties of a pharmaceutical for-mulation, by generating a mathematical model to predict how the variation of such factors (independent-variables) influence one or more responses (dependent variables).
A “central composite design (CCD) was used to investi-gate the influence of three factors (e.g. amount of water, amount of surfactant mixture Span® 80-Tween® 80 and total hydrophilic-lipophilic balance (HLB value) on droplets size, viscosity and stability of ternary systems made up of water/ ethyl oleate/Span® 80-Tween® 80.
The experiments necessary to study three factors systems through a CCD were the following:
• 8 (23) factorial experiments, defined by the coded variables -1 or 1.
• 6 (2*3) axial experiments, defined by the coded var-iables -1.682 or +1.682.
• 3 repetition of the central point, defined by the cod-ed variable 0.
All the compositions prepared according to the experi-mental design are listed in Table 1.
The results for each response were processed by a multi-ple linear regression on the base of a full quadratic model:
! = !"#$ + !!!+ !!!+ !!!+ !!!!!+ !!!!!+ !!!!!+ !!!!+ !!!!+ !!!!
Eq. (1) The significance of the regression and of the individual coefficients was determined by ANOVA analysis and t-test, respectively. Subsequently, this mathematical model was simplified by deletion of not significant terms.
Results were presented using contour plots for each re-sponse and then optimized using the graphical method of the overlay plot.
More details concerning the CCD experimental plan and analysis can be found in the literature [27]. The experimental design and its statistical analysis were performed with the software MINITAB® Release 14.1 (Minitab Inc. 1972-2003).
2.2.2. Sample Preparation
Tween® 80, Span® 80 and ethyl oleate were mixed to-gether until a homogeneous system was obtained. Then, the relative amount of deionised water was added dropwise and the mixture was stirred for 6 h. Each system was stored in tight closed glass vial at 25°C for 24 hours before further use.
2.2.3. Rheological Analysis
Viscometry tests were used to measure the viscosity of the samples at 25°C. All tests were performed by increasing the shear rate (γ) from 1 to 150 s-1 and the corresponding shear stress (σ) was measured, using a rotational rheometer (Stress–Tech, Rheologica, USA) equipped with a 4/40 cone-plate geometry.
The shear rate vs shear stress curves was fitted by using the power law equation (equation 2) to calculate the power law viscosity (K) and the power law index (n).
Table 1. List of the samples prepared according to the central composite design and relative coded and uncoded variables (surfac-tant mixture %, water % and HLB index) values.
Samples Coded Variables Uncoded Variables
Surfactant Mixture (%) Water (%) HLB Index Surfactant Mixture (%) Water (%) HLB Index
1 -1 -1 -1 20 8 9 2 -1 +1 -1 20 12 9 3 +1 -1 -1 30 8 9 4 +1 +1 -1 30 12 9 5 -1 -1 +1 20 8 13 6 -1 +1 +1 20 12 13 7 +1 -1 +1 30 8 13 8 +1 +1 +1 30 12 13 9 0 -1.682 0 25 6.64 11 10 0 +1.682 0 25 13.36 11 11 -1.682 0 0 16.59 10 11 12 +1.682 0 0 33.41 10 11 13 0 0 -1.682 25 10 7.64 14 0 0 +1.682 25 10 14.64 15 0 0 0 25 10 11 16 0 0 0 25 10 11 17 0 0 0 25 10 11 ! = !!! Eq. (2)
All the analyses were performed in triplicate.
2.2.4. Microscopy and Particle Size Analysis
All samples were observed with an optical polarised mi-croscope (MT92000, Meiji Techno, JP) to identify whether the systems were nanodisperse and/or isotropic. When the samples were not isotropic, image analysis was used to measure the size of the droplets and/or surfactants aggregates in the micrometric range. Images of samples were collected using a 10X objective lens (MA832 U. Plan Objective 10X, Meiji Techno, JP) and a 3 megapixel camera (Invenio 3S, DeltaPix, DK). Size analyses were performed by using Im-age Pro Plus Software (Media Cybernetics Inc., USA) meas-uring the size of at least 100 particles e/o droplets.
The size of isotropic and nanodisperse systems, instead, was characterized by dynamic light scattering measurements (Zetasizer NanoS, Malvern, UK). 1 mL of the sample was loaded inside a disposable cuvette and analysed at 25°C after 180 s for thermal equilibration. The size of the droplets was calculated according to the distribution model (Malvern Software), correcting the viscosity (10 mPa*s) and the refractive index (1.46) of the dispersant phase (ethyl oleate/Span® 80-Tween® 80). Each sample was analysed in duplicate.
2.2.5. Stability Test
All the samples prepared according to the experimental design were stored for six months at 25°C in tight closed
glass vials. Stability was determined assigning to each sam-ple a value corresponding to the time (months) required to turn from a transparent into a turbid or separate system.
2.3. Hemolytic Assay
Hemolytic assay was performed to assess the hemolytic activity of the optimized microemulsions selected by the experimental design analysis. The test was performed for a general evaluation of the toxicological properties of the de-signed formulations. Erythrocytes were collected from mice blood by centrifugation (6500 rpm for 10 min; 4°C), washed three times in an isotonic phosphate buffer solution. A stock suspension was prepared by suspending erythrocytes in the same buffer (cell density of 8x10⁹ cells/ml). Different vol-umes of microemulsions, from 5 µL to 500 µL, were tested against 25 µL of erythrocytes suspension. The final volume was adjusted to 1 ml with isotonic buffer. The negative con-trol was prepared by suspending 25 µL of erythrocytes in 950 µL of isotonic buffer, while the positive control was obtained with the same procedure of the negative one but finally frozen at -20°C [29]. All the samples, including posi-tive and negaposi-tive controls, were gently shaken for 10 minutes at room temperature and centrifuged at 3000 rpm for 5 min. Supernatant was collected and the absorbance was measured at 540 nm with a UV-Vis spectrometer (UV-1800, Shimadzu corporation). The extent of hemolysis, expressed as percentage (H%), was determined by using following equation:
! % = !"#!!!"#!"
!"#!"!!"#!"· 100 Eq. (3)
where:
AbsNC is the absorbance measured in the negative control
(0% of hemolysis);
AbsPC is the absorbance measured in the positive control
(100% of hemolysis);
AbsS is the absorbance measured in the samples
contain-ing the microemulsion.
The aqueous solution of the two surfactants (Span® 80 and Tween® 80) at the same ratio used in the optimized mi-croemulsion was tested for comparison. Furthermore, sodi-um dodecyl sulphate (SDS) was used as an example of a well-characterised hemolytic surfactant. All samples were tested in triplicate.
2.4. Microemulsion Loading Capacity
The maximum protein loading capacity, using BSA as model protein, was determined on the optimized formulation. BSA was dissolved inside the aqueous phase used for the microemulsion preparation according with the procedure reported in the section 2.2.2. The final BSA concentration ranged between 1 mg/ml and 24 mg/ml calculated with re-spect to the total volume of the microemulsion.
2.5. Characterization and Stability of BSA Loaded Mi-croemulsion
The microemulsion loaded with the highest amount of BSA was characterized in terms of viscosity and size of the dispersed phase following the methodology previously de-scribed (sections 2.2.3 and 2.2.4). All these parameters were monitored over a six months period at 4° and 25°C for stabil-ity evaluation.
2.6. Quantification of the BSA Recovery from the Micro-emulsion
In order to recover the protein, 1 ml of the microemulsion loaded with the highest amount of BSA was diluted 1:5 with the extraction solution (water/acetonitrile 75:25) and gently mixed. The formed emulsion was centrifuged at 13000 rpm for 30 min at 4°C. The protein was recovered as pellets and resuspended in isotonic phosphate buffer (22.2 mM Na2HPO4, 5.6 mM KH2PO4 and 123.3 mM NaCl). The re-covered protein was quantified through an image analysis of the electrophoretic bands obtained after a polyacrylamide electrophoresis performed under denaturing conditions (SDS-PAGE) and by fluorescence measurements.
SDS-PAGE was performed using 12% of polyacryla-mide/bisacrylamide for the running gel and 3.5% for stack-ing gel. 20 µL of the samples were boiled 5 min in the pres-ence of 10 µL of sample loading buffer (1300 µL glycerol, 1200µL of 10% SDS, 600 µl β-mercaptoethanol, 200 µL blue bromophenol saturated solution), subsequently loaded into the well of the stacking gel and run by applying a volt-age of 200 V. After the running, protein bands were stained using Coomassie Brilliant blue R250 (5 grams dissolved in acetic acid/methanol/water 10:50:40) and the excess of the dye was removed using a destaining solution (acetic ac-id/methanol/water 10:50:40). After destaining, the gel was scanned at 600 dpi resolution, and the gel image was ana-lyzed using PDquest software (Version 7.1.1; Bio-Rad La-boratories). Standard BSA solutions in the range of concen-tration between 0.05 mg/mL and 1 mg/ml were also run in the same gel to build up a calibration curve. Three different samples of the resuspended BSA were run in three independ-ent polyacrylamide gels together with standard solutions.
Fluorescence spectra of the recovered protein (diluted 1 to 5 in buffer or in 6 M and 12 M urea) and standard solution of BSA in buffer phosphate at the same concentrations used in SDS-PAGE were collected at 25°C using a Hitachi 4500 spectrofluorimeter. Samples were excited at 280 nm and the emission intensity was recorded in the range of 300-450 nm. The recovery of the protein was expressed as percentage with the respect of the nominal loading of the microemul-sion.
3. RESULTS AND DISCUSSION 3.1. Formulation of Microemulsions
The phase behaviour of ternary systems is generally stud-ied by building a ternary phase diagram, which reports the results of a large number of experiments [28, 29]. However, a quicker screening of the factors influencing microemulsion formation can be performed by applying different type of design of experiments (DoE), such as factorial, fractional factorial, Hadamard or even central composite design.
In this work a response surface methodology, the central composite design (CCD), was employed since the number of the experimental factors to be analysed was limited and con-sequently the number of experiments to be carried out can be kept low.
A CCD allows a mathematical description of the rela-tionship between factors and response, assuring a better un-derstanding of the process, as well as the possibility of the optimization of the process itself [27].
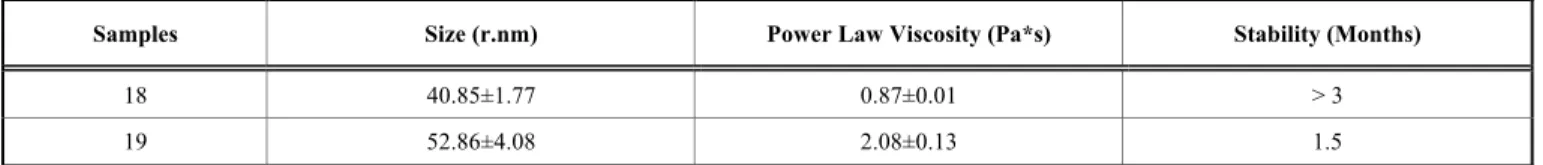
Table 2. Size (r. nm), viscosity (Pa*s) and stability (months) of the microemulsions prepared for the validation of the Central Composite Design (samples 18 and 19).
Samples Size (r.nm) Power Law Viscosity (Pa*s) Stability (Months)
18 40.85±1.77 0.87±0.01 > 3
The CCD was initially used to understand how the amount of water, of surfactant mixture and the surfactant ratio (HLB value) affected the systems properties such as the size of dispersed phase, the viscosity and the stability.
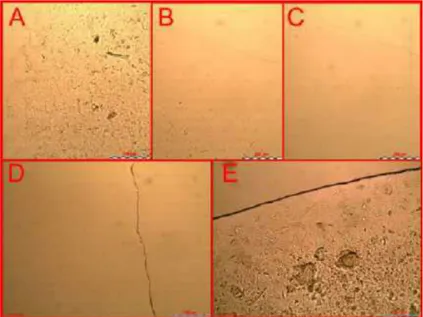
The presence of micrometric oil droplets in all the sam-ples was evaluated by optical and polarised microscopy. For instance, water droplets in the micrometric range were ob-served in several samples, e.g. sample 11 (Fig. 1A), indicat-ing the formation of a coarse emulsified system at a macro-scopic level. Conversely, other samples, e.g. number 7 (Fig.
1B), appeared homogeneous under observation and
conse-quently were analysed using polarised light and DLS. Under polarised light, these samples did not show any birefrin-gence, appearing as isotropic systems (Fig. 1C and 1D) and showed a monomodal size distribution in the nanometric range when analysed using DLS.
The effect of the three factors on the size of the dispersed phase was analysed with the CCD and the results were de-scribed by the following model:
Eq. (4) The multilinear regression resulted to be significant (Pvalue = 0.016) when tested with ANOVA. The significant coefficients were only the amount of water (x1), the HLB value (x3) and the interaction between the amount of surfac-tant and the HLB (x2x3) (SF1). The effect of x1 and x2 on the size, when the surfactant amount is kept constant at 30%, is reported in Fig. (2).
The second analysed response is the viscosity of the sys-tems. All the formulations prepared showed different ap-pearance, from transparent (sample 9) or white (sample 1) liquid, to white (sample 10) or transparent (sample 8)
semi-solid. When analysed with the viscometry test, the samples generated stress-strain traces with different trends, repre-sentative of both Newtonian and non-Newtonian systems. For example, sample 1 had a power law index of around 1, typical of a Newtonian behaviour, while sample 7 showed a value of 0.68, characteristic of a pseudoplastic system.
Fig. (2). Analysis of size response. Contour plot representing the
effect of water (%) and total HLB on the size response of the Cen-tral Composite Design. The parameter (surfactants %) is set at 30%. 3 2 3 1 2 1 3 2 1 2.000 3.425 1.825 0.733 3.558 946 . 2 716 . 10 x x x xx xx xx Radius= + − − − − −
Fig. (1). Microscopy analysis. Optical and polarised light microscope images (10X) of an emulsified system (sample 11) prepared according
to the experimental design (A and C). Optical and polarised light microscope images (10X) of a homogeneous and isotropic system (sample 7) prepared according to the experimental design (B and D).
Examples of stress-strain traces of samples having differ-ent rheological behaviour are reported in Fig. (3) (the figure refers to sample 1, 7 and 9).
Fig. (3). Rheological analysis. Flow curves from viscometry test
performed on sample 1, 7 and 9 prepared according to the experi-mental design. The figure shows the different rheological behaviour from Newtonian (sample 1) to pseudoplastic (samples 7 and 9).
The model describing the effect of the amount of water (x1), amount of surfactant mixture (x2) surfactants HLB (x3) on the power law viscosity (PLV) is reported below:
Eq. (5) The multilinear regression resulted to be significant (Pvalue = 0.014) when tested with the ANOVA, while all the coefficients were significant with the exception of x2 and the interactions x1x2 and x1x3 (SF2). As previously observed for the size, also in this case, the HLB value and water content were the most important factors. The increase of both pa-rameters determines a raise of the consistency of the sys-tems. The results of the CCD analysis are reported in Fig. (4) using the contour plot.
Finally, the stability of the systems was analysed. The formulations prepared according to the experimental design were stable for different periods after the end of the stirring, ranging from few minutes (samples 6 and 11) up to several months (samples 7 and 9), with intermediate values of few hours or days.
Fig. (4). Analysis of viscosity response. Contour plot representing
the effect of water (%) and total HLB on the viscosity response of the Central Composite Design. The third parameter (surfactants %) is set at 30%.
The model describing how the stability time (min) is in-fluenced by the different factors is reported below:
Eq. (6) As for the others responses analysed, the multilinear re-gression resulted to be significant (Pvalue = 0.011) when test-ed with the ANOVA, while only the coefficients relative to the amount of water, both as linear and quadratic terms, were significant (SF3). The results of the CCD analysis, when the surfactant amount is kept constant at 30%, are reported in Fig. (5) using the contour plot.
The three determined models allowed understanding how the different factors affect each single response, which could be therefore optimized (find specific experimental conditions able to generate a certain response) individually. However, in order to obtain the best system, it is necessary to optimize all the three responses at the same time. To achieve this goal, the graphical optimization procedure was selected. Such pro-cedure involves the superposition of each contour plot on top of each other in a single graph (overlay plot). The optimized systems are those having values of the responses all within the acceptability range. The acceptability limits were select-ed to define the experimental conditions at which the size of the internal phase and the viscosity of the ternary systems were minimized, while the stability of the same system was maximized. By selecting a size (radius) for the internal phase lower than 300 nm, a power law viscosity lower than 0.5 Pa*sec and a stability higher than three months (129600 min), a feasibility area can be found only on the overlay plot water (%) vs. HLB with a total amount of surfactant at 30% (Fig. 6). From this specific overlay plot it can be observed that a suitable system can be formed only in a very narrow
3 2 3 1 2 1 3 2 1 0.245 0.797 0.264 0.534 0.606 531 . 0 824 . 0 x x x xx xx xx PLV= + + + + + + 2 1 3 2 1 19172 19091 44339 50947 4872 x x x x Stability=− − + + +
Fig. (5). Analysis of stability response. Contour plot representing
the effect of water (%) and total HLB on the stability response of the Central Composite Design. The third parameter (surfactants %) is set at 30%.
Fig. (6). Optimization of the ternary system. Overlay plot
combin-ing the effect of water (%) and total HLB on the three responses (size, viscosity and stability) of the Central Composite Design. The third parameter (surfactants %) is set at 30%. The red area in the graph represents the region inside the experimental domain where the size, viscosity and stability parameters of the micro-emulsion are optimized. The black circle and triangle represent the composition of the two additional samples used for the validation of the central composite design.
area (red area in the Fig. 6). Specifically, the HLB value has to be between 13.2 and 13.4 and the amount of water be-tween 6.5% and 6.9% (lower amount are also possible but they are not taken into account since they are outside the experimental domain of the CCD) for a total amount of sur-factant at 30%.
The effectiveness of the experimental design was validat-ed by analysing two additional samples (samples 18 and 19). The first one was prepared using the experimental conditions inside the feasibility area whereas the second one using the conditions outside of it but within the limit of the size for a colloidal dispersion. The composition of these two formula-tions (indicated in the Fig. (6) as black circle and triangle respectively) was as follows:
Sample 18: amount of water 6.7%, HLB value 13.3 and amount of surfactant mixture 30%;
Sample 19: amount of water 10%, HLB value 13.4 and amount of surfactant mixture 30%.
According with the overlay plot these two samples should possess similar size of the internal phase but different viscosity and stability.
These two samples were prepared with the same proce-dure used for all the formulations of the experimental design and analysed as before. The experimental values for each
response were quite close to those predicted by the overlay plot. Specifically, an increase in water content from 6.7 % to 10% maintained the size of the internal phase below 0.5 µm, but determined a sharp increase in viscosity (from 0.87 to 2.08 Pa*s). These results confirmed the validity of the pre-diction model and consequently validated the effectiveness of the experimental design in the optimisation of the parame-ters affecting the formulation of a ternary system.
3.2. Haemolytic Assay
A general estimation of the toxicity of the two micro-emulsions prepared for the validation of the experimental design (sample 18 and 19) was assessed by haemolytic as-say. In addition, water solution of surfactant mixtures (Span® 80-Tween® 80) at the same ratio used for the preparation of microemulsions number 18 and 19 were also tested. Fig. (7) shows the haemolysis (%) with respect to the tested volume of microemulsion or surfactant mixtures (µl). To this extent, it is known from the literature [29] that Tween® 80 is a non-haemolytic surfactant, differently to Span 80 that exhibits moderate haemolytic properties [30]. The calculated hae-molysis (%) was found to be much lower than 50% for both the microemulsions (around 5-10%) and surfactant mixtures (around 10-15%). Consequently, the HC50 values could not be calculated. Moreover, no difference between surfactant mixtures and microemulsions can be observed up to 150 µL
and just a slight increase in haemolysis for both the surfac-tant mixtures occurred after the addition of 300-500 µL of samples. The accuracy of the method was evaluated by test-ing SDS, a well-known haemolytic surfactant. In such case, increasing volumes of SDS solution (2 mg/mL) were tested up to 100% of haemolysis and the HC50 value was calculat-ed. Such value (45 µg/mL) was comparable to that reported in the literature [30].
Fig. (7). Haemolytic assay. Haemolysis (%) versus sample volume
(µL) of microemulsions prepared for the validation of the Central Composite Design (samples 18 and 19) in comparison to surfactant mixtures (Tween 80® and Span 80®) and SDS as reference.
3.3. BSA Loading Capacity in Microemulsion
The evaluation of the loading capacity, especially in the case of proteins, is a neglected aspect in the formulation pro-cess of microemulsions. Nevertheless, it is important to know how much protein can be loaded inside the internal aqueous phase when ternary systems are employed as vehi-cles for the delivery of therapeutically-active protein through different routes of administration.
To this extent, an initial screening using BSA at a con-centration between 24 mg/mL and 1 mg/mL was performed and the samples homogeneity was analysed through visual observation. All the systems prepared with a BSA concentra-tion from 24 to 4 mg/mL appeared turbid just after the prepa-ration, while microemulsions loaded with 1 mg/mL and 2 mg/mL BSA appeared clear. All samples were, then, stored at 25°C. Significantly, after 48 h, a phase separation oc-curred in the microemulsions displaying a BSA concentra-tion from 24 mg/mL to 6 mg/mL. On the other hand, sam-ples at 4 mg/ml, 2 mg/ml and 1 mg/ml of BSA concentration did not show any observable changes when compared to the
same samples just after the preparation. 4 mg/mL BSA mi-croemulsion remained turbid, instead, 2 mg/L and 1 mg/mL BSA-microemulsions resulted clear (Fig. 8A and B).
Fig. (8). BSA loading capacity in the microemulsion. Visual
obser-vation after a 48 h of storage time at 25°C of the microemulsion, selected according to the Central Composite Design (sample 18) and prepared at different BSA concentrations from 24 mg/mL to 1 mg/mL (A) and from 6 mg/mL to 1 mg/mL (B).
The samples were also analysed through optical micros-copy to examine whether the presence of BSA could destabi-lize the microemulsion. From the pictures in Fig. (9), it can be observed that there is no presence of large (>1 µm) drop-lets at any BSA concentration after the preparation, denoting that the presence of the protein did not cause the coalescence of the internal phase of the microemulsion. However, sam-ples that appeared turbid at the visual inspection, showed the presence of insoluble particles. The amount of these particles markedly decreased from 24 mg/mL BSA-microemulsion (Fig. 9A) to 6 mg/mL BSA-microemulsion (Fig. 9B) sug-gesting that, at those concentrations, the protein precipitated. Microemulsions at 1 mg/mL and 2 mg/mL appeared clear also under microscopic observation (Fig. 9C). From these results, it can be deduced that BSA does not disrupt micro-emulsion structure, but the turbidity of samples is only due to protein precipitation.
In order to confirm this hypothesis, the upper and the lower phase of 48 h stored samples, in which a phase separa-tion occurred, were collected and observed by optical mi-croscopy. The upper phase appeared clear in all samples (Fig. 9D); the lower phase, instead, showed insoluble parti-cles (Fig. 9E) appearing quite similar to those observed in the same sample immediately after the preparation.
It is interesting to note that the solubility of BSA in pure water is very different from the solubility of BSA in the wa-ter entrapped in microemulsion. In fact, all stock solutions of the protein in water, from which BSA-loaded microemul-sions were prepared, appeared clear or slightly yellowish depending on protein concentration, but no precipitation event occurred within 48 h at room temperature.
On the contrary, when these solutions were incorporated in the oily phase a marked reduction of solubility was ob-served. A decrease in solubility, leading to protein precipita-tion at a certain time after the incorporaprecipita-tion inside the micro-emulsions, has also been reported for AOT-isooctane-water ternary systems [31-33].
Solubility of BSA in water (no particles were observed through optical microscope after 48 h of storage time) was found higher than 358 mg/mL, which is the concentration of BSA solution used to prepare the microemulsion loaded with 24 mg/mL of the protein. Interestingly, if we consider the solubility of BSA respect to water, when incorporated inside
the microemulsion, it decreased to around 29 mg/mL. Thus, the confinement of water inside a microemulsion and/or the presence of high amount of surfactant caused the desolvation of the protein (BSA >2 mg/mL of the total volume of the microemulsion) and consequently its precipitation at a con-centration of protein higher than 6 mg/mL. This is probably due to the fact that water molecules in a ternary systems are mostly bounded on surfactants molecules and are less avail-able to be engaged in solvation shells around the solutes, especially in the case of macromolecules as proteins [34,35]. Comparable solubility values for proteins (lysozyme and chymotrypsin) around 1-2 mg/ml were found in microemul-sions prepared with organic solvents [23].
3.4. Storage Stability of BSA-loaded Microemulsion
The effect of the storage time and temperature (25°C and 4°C) on the stability of the sample 18 loaded with the highest amount of BSA (2 mg/mL) was investigated by visual and microscopic inspection, DLS measurements and viscometry
Fig. (9). BSA loading capacity in the microemulsion. Optical microscope images (10X) of BSA-loaded microemulsions after the preparation:
24 mg/mL (A), 6 mg/mL (B) and 2 mg/mL (C). Images of the upper phase (D) and lower phase (E) from 24 mg/ml BSA-loaded microemul-sion after storage 48 h at 25°C.
Table 3. Viscosity (Pa*s), power law index value (n) and size (r. nm) for the optimized microemulsion (sample 18) and the same microemulsion loaded with 2 mg/mL of BSA, calculated after preparation and after storage at 25°C and 4°C for six months.
Viscosity (Pa*s) Index (n) Size (r.nm)
Microemulsion 0.870±0.120 0.568±0.013 40.85±1.77
BSA-loaded microemulsion 0.970±0.155 0.571±0.032 42.82±3.50
Microemulsion stored 6 months at 25°C 0.902±0.160 0.554±0.021 40.66±2.86
BSA-loaded microemulsion stored 6 months at 25°C 0.992±0.127 0.595±0.024 45.25±4.26
Microemulsion stored 6 months at 4°C 1.292±0.151 0.465±0.049 44.30±4.05
test. The obtained results were compared to those obtained from the same systems without the protein in order to assess if the presence of the protein at the maximum solubility level can affect microemulsion stability.
All the samples remained transparent and isotropic dur-ing all the stability period at the two tested temperatures when visually observed or analysed under microscopy. Table
3 reports the value for power law viscosity, power law index
and size for both free or BSA-loaded microemulsion after preparation and after storage at 4°C and 25°C for six months. The presence of BSA at the maximum solubilisation level (2 mg/ml) did not increase the size of internal droplets both after preparation and after the storage at 25°C and 4°C. The same behaviour has also been observed for BSA-free micro-emulsion. Moreover, the loading of BSA did not change the viscosity of the system nor its pseudoplastic behaviour (power law index ≈ 0.5). A slight increase of the viscosity (from 0.9 to 1.2 Pa*s) was only observed for the samples stored at 4°C both for loaded and unloaded samples. Taken together, the analysis of macroscopic properties (appearance, viscosity) and the measurement of the droplet size of the microemulsion demonstrated the thermodynamic stability of these protein-loaded systems over time for at least six months.
Fig. (10). Quantification of BSA recovery from microemulsion by
SDS-PAGE. (A) SDS-PAGE gel: a-c lanes are the recovered pro-tein in isotonic phosphate buffer, d-f lanes are BSA standard solu-tions in isotonic phosphate buffer at different concentrasolu-tions (from 0.05 mg/mL to 1 mg/mL). (B) Calibration curve build up by plot-ting the pixel intensity of the electrophoretic bands relative to BSA standard solution at different concentrations.
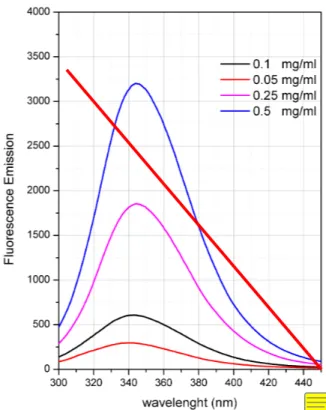
Fig. (11). Fluorescence spectra of the recovered BSA from
micro-emulsion in isotonic phosphate buffer, 6M and 12M urea water solutions.
3.5. Quantification of the Recovered BSA
The protein recovered by the microemulsion loaded with the maximum amount of BSA was quantified through the spot image analysis of the gel from SDS-PAGE (densitomet-ric analysis) as described before. This technique was widely employed in molecular biology or proteomics [36], but its use is yet underestimated for protein quantitative analysis in pharmaceutics.
Figure 10A showed the scanned polyacrylamide gel from electrophoresis. The lanes a-c refer to the samples from mi-croemulsions in triplicates, while the lanes d-g refer to standard solution of BSA at the concentration range 0.1-1 mg/ml. It can be noticed from the lanes referring to BSA standard solutions (d-g), the presence of the main high inten-sity band (indicated by and arrow in the figure) related to the to the 66 kDa fraction of the protein and a secondary less-coloured band at a slighter low molecular weight (BSA puri-ty ≥ 96% from the manufacturer). Nevertheless, when the protein is overloaded inside the gel (f-g; concentration ≥ 0.5 mg/mL) several fainted bands of different molecular weights appeared. According to the literature, the bands at molecular weight lower than 66 kDa can be identified as BSA peptide fragments, while those at higher molecular weight as dimeric or trimeric forms of the protein [37,38].
As shown in the figure 10B, a linear dependence of the pixel intensity of the main band obtained from the running of BSA standard solutions at different concentrations was ob-served and used to build up the calibration curve. The R2 of the fitting linear regression curve obtained from the BSA standard solution in the three independent gels was higher
than 0.976. Using these calibration curves, the percentage of the recovered BSA from microemulsion (69.37± 6.65%) was calculated by the estimation of the pixel intensity of the main band.
Interestingly, the recovered BSA showed bands with shorter electrophoretic path with higher intensity than BSA standard used for the calibration curve. These bands can be ascribed to the formation of protein aggregates due to a polymerization process [39]. In order to understand if these differences in the electrophoretic pattern are due to the con-dition of the protein inside the microemulsion or to the re-covery process, SDS-PAGE was also performed on the pro-tein solution treated with the same extraction mixture (wa-ter/acetonitrile 75:25) and then centrifuged (30 min, 13000 rpm). In this case, the bands relative to the aggregates of the protein were of less intensity with respect to those observed by running the protein extracted from the microemulsion (SF4). This result confirms that the extraction process does not influence the aggregation state of BSA.
The quantification of the protein was also performed by fluorescence measurements. A calibration curve using stand-ard solution of BSA in isotonic buffer was built (R2>0.997) (SF5). The calculated recovery was 51.66 ± 3.1%. As it can be observed from the fluorescence spectra (Figure 11) the maximum emission wavelength of the recovered BSA (dilut-ed 1 to 5 in isotonic buffer) is around 340 nm, which is com-parable to that of a native protein. When urea as denaturing agent is added, the recovered protein showed the characteris-tic spectral changes of a pure BSA solution as reported in the literature [40]. In particular, in presence of 6 M of urea a blue shift from 340 nm to 334 nm occurred due to a change in the hydrophobicity in the microenvironment around tryp-tophans. Instead, by increasing the concentration of urea up to 12 M a red shift occurred to 346 nm due to the unfolding of the protein and the exposure of tryptophan residues to the solvent’s hydrophilic environment. Overall, fluorescence spectra confirmed the maintenance of a native-like state of the recovered protein.
CONCLUSION
In this work, a stable and non-toxic microemulsion sys-tem made up of water/ethyl oleate/ Span®80-Tween®80 was optimized through a central composite design and loaded with the maximum amount of the protein. Our results sug-gest that the confinement of water, as in a microemulsion system, strongly affects the solubility of the protein, when compared with its aqueous solution. Particularly, a marked decrease in water solubility of the protein was observed after incorporation in the microemulsion. This aspect should be considered anytime when such systems are formulated for the delivery of macromolecules, as biotherapeutics. Moreo-ver, the formulation showed a long-term stability, also when the protein was incorporated close to the saturation point in the aqueous compartment, suggesting the feasibility of pre-paring microemulsions at the highest content of proteins. Finally, a method for the recovery of the protein from a mi-croemulsion formulated with approved oil and surfactants has been proposed and the native-like behaviour of the re-covered BSA as a model of macromolecules, has been
demonstrated through SDS-PAGE and fluorescence spec-troscopy.
ETHICS APPROVAL AND CONSENT TO PARTICI-PATE
Not applicable.
HUMAN AND ANIMAL RIGHTS
No Animals/Humans were used for studies that are base of this research.
CONSENT FOR PUBLICATION
Not applicable.
CONFLICT OF INTEREST
The authors confirm that this article content has no con-flict of interest.
ACKNOWLEDGEMENTS Declared none.
SUPPLEMENTARY MATERIAL
Supplementary material is available on the publisher’s web site along with the published article.
REFERENCES
[1] Danielsson, I.; Lindman, B. The definition of microemulsion 1981; 3: 391-92.
[2] Tenjarla S. Microemulsions: An Overview and Pharmaceutical Applications 1999; 16: 62.
[3] Altria K. Application of microemulsion electrokinetic chromatog-raphy to the analysis of a wide range of pharmaceuticals and excip-ients 1999; 844: 371-86.
[4] Lawrence MJ, Rees GD. Microemulsion-based media as novel drug delivery systems 2000; 45: 89-121.
[5] Narang AS, Delmarre D, Gao D. Stable drug encapsulation in micelles and microemulsions 2007; 345: 9-25.
[6] Bonacucina G, Cespi M, Misici-Falzi M, Palmieri GF. Colloidal soft matter as drug delivery system 2009; 98: 1-42.
[7] Paolino D, Ventura CA, Nisticò S, Puglisi G, Fresta M. Lecithin microemulsions for the topical administration of ketoprofen: percu-taneous adsorption through human skin and in vivo human skin tol-erability 2002; 244: 21-31.
[8] Yuan Y, Li S, Mo F, Zhong D. Investigation of microemulsion system for transdermal delivery of meloxicam 2006; 321: 117-23. [9] Špiclin P, Gašperlin M, Kmetec V. Stability of ascorbyl palmitate
in topical microemulsions 2001; 222: 271-79.
[10] Sarciaux JM, Acar L, Sado PA. Using microemulsion formulations for oral drug delivery of therapeutic peptides 1995; 120: 127-36. [11] Park K, Kwon IC, Park K. Oral protein delivery: Current status and
future prospect 2011; 71: 280-87.
[12] Constantinides PP, Scalart J-P, Lancaster C, Marcello J, Marks G, Ellens H, et al. Formulation and Intestinal Absorption Enhance-ment Evaluation of Water-in-Oil Microemulsions Incorporating Medium-Chain Glycerides 1994; 11: 1385-90.
[13] Lyons KC, Charman WN, Miller R, Porter CJH. Factors limiting the oral bioavailability of N-acetylglucosaminyl-N-acetylmuramyl dipeptide (GMDP) and enhancement of absorption in rats by deliv-ery in a water-in-oil microemulsion 2000; 199: 17-28.
[14] Gao Z-G, Choi H-G, Shin H-J, Park K-M, Lim S-J, Hwang K-J, et
al. Physicochemical characterization and evaluation of a
micro-emulsion system for oral delivery of cyclosporin A 1998; 161: 75-86.
[15] Constantinides PP, Lancaster CM, Marcello J, Chiossone DC, Orner D, Hidalgo I, et al. Enhanced intestinal absorption of an
RGD peptide from water-in-oil microemulsions of different com-position and particle size 1995; 34: 109-16.
[16] Fan Y, Li X, Zhou Y, Fan C, Wang X, Huang Y, et al. Improved intestinal delivery of salmon calcitonin by water-in-oil microemul-sions 2011; 416: 323-30.
[17] Sharma G, Wilson K, van der Walle CF, Sattar N, Petrie JR, Ravi Kumar MNV. Microemulsions for oral delivery of insulin: Design, development and evaluation in streptozotocin induced diabetic rats 2010; 76: 159-69.
[18] Cheng M-B, Wang J-C, Li Y-H, Liu X-Y, Zhang X, Chen D-W, et al. Characterization of water-in-oil microemulsion for oral delivery of earthworm fibrinolytic enzyme 2008; 129: 41-48.
[19] Liu D, Kobayashi T, Russo S, Li F, Plevy SE, Gambling TM, et al.
In Vitro and In Vivo Evaluation of a Water-in-Oil Microemulsion
System for Enhanced Peptide Intestinal Delivery 2013; 15: 288-98. [20] Abel S, Waks M, Urbach W, Marchi M. Structure, Stability, and
Hydration of a Polypeptide in AOT Reverse Micelles 2006; 128: 382-83.
[21] Noritomi H, Takasugi T, Kato S. Refolding of denatured lysozyme by water-in-oil microemulsions of sucrose fatty acid esters. 2008; 30: 689-93.
[22] Orlich B, Schomäcker R. Advances in Biochemical Engineer-ing/Biotechnology. Springer Berlin Heidelberg 2002.
[23] Rairkar ME, Hayes DG, Harris JM. Solubilization of enzymes in water-in-oil microemulsions and their rapid and efficient release through use of a pH-degradable surfactant 2007; 29: 767-71. [24] Matzke SF, Creagh AL, Haynes CA, Prausnitz JM, Blanch HW.
Mechanisms of protein solubilization in reverse micelles. 1992; 40: 91-102.
[25] Chemelli A, Maurer M, Geier R, Glatter O. Optimized Loading and Sustained Release of Hydrophilic Proteins from Internally Nanostructured Particles 2012; 28: 16788-97.
[26] Shipovskov S, Oliveira CLP, Hoffmann SV, Schauser L, Suther-land DS, Besenbacher F, et al. Water-in-oil micro-emulsion en-hances the secondary structure of a protein by confinement. 2012; 13: 3179-84.
[27] Lewis GA, Mathieu D, Phan-Tan-Luu R. Pharmaceutical Experi-mental Design. CRC Press 1998.
[28] Bonacucina G, Cespi M, Mencarelli G, Casettari L, Palmieri GF. The use of acoustic spectroscopy in the characterisation of ternary phase diagrams 2013; 441: 603-10.
[29] Bonacucina G, Cespi M, Mencarelli G, Palmieri GF. Characteriza-tion of ternary phase diagrams by means of thermal and rheological analyses. 2013; 39: 1547-54.
[30] Aparicio RM, José García-Celma M, Pilar Vinardell M, Mitjans M.
In vitro studies of the hemolytic activity of microemulsions in
hu-man erythrocytes 2005; 39: 1063-67.
[31] Lye GJ, Asenjo JA, Pyle DL. Extraction of lysozyme and ribonu-clease-a using reverse micelles: Limits to protein solubilization 1995; 47: 509-19.
[32] Hayes DG. Mechanism of protein extraction from the solid state by water-in-oil microemulsions 1997; 53: 583-93.
[33] Iyer M, Hayes DG, Harris JM. Synthesis of pH-degradable nonionic surfactants and their applications in microemulsions 2001; 17: 6816-21.
[34] McClements DJ. Nanoemulsions versus microemulsions: terminol-ogy, differences, and similarities 2012; 8: 1719-29.
[35] Zampieri GG, Jaeckle H, Luisi PL. Determination of the structural parameters of reverse micelles after uptake of proteins 1986; 90: 1849-53.
[36] Magdeldin S, Enany S, Yoshida Y, Xu B, Zhang, Zureena Z, et al. Basics and recent advances of two dimensional- polyacrylamide gel electrophoresis 2014; 11: 16.
[37] Kshirsagar B, Wilson B, Wiggins RC. Polymeric complexes and fragments of albumin in normal human plasma 1984; 143: 265-73. [38] Zhu G, Mallery SR, Schwendeman SP. Stabilization of proteins
encapsulated in injectable poly (lactide- co-glycolide) 2000; 18: 52-57.
[39] Saha S, Deep S. Switch in the aggregation pathway of bovine se-rum albumin mediated by electrostatic interactions. 2014; 118: 9155-66.
[40] Kumaran R, Ramamurthy P. Denaturation Mechanism of BSA by Urea Derivatives: Evidence for Hydrogen-Bonding Mode from Fluorescence Tools 2011; 21: 1499-1508.
DISCLAIMER: The above article has been published in Epub (ahead of print) on the basis of the materials provided by the author. The Edito-rial Department reserves the right to make minor modifications for further improvement of the manuscript.