Volume XXX
Number 4
PAPER
EFFECT OF HEATING ON CHEMICAL PARAMETERS
OF EXTRA VIRGIN OLIVE OIL, POMACE OLIVE OIL,
SOYBEAN OIL AND PALM OIL
A.M. GIUFFRÈ*, M. CARACCIOLO, C. ZAPPIA, M. CAPOCASALE and M. POIANA
Dipartimento di Agraria, Università degli Studi Mediterranea di Reggio Calabria, Contrada Melissari, 89124 Reggio Calabria, Italy
*Corresponding author: Tel.: +39 9651694362 E-mail address: [email protected]
ABSTRACT
This work studied the oxidative stress on the chemical properties of extra virgin olive oil, pomace olive oil, soybean oil and palm oil during heating. The highest relative increase in free acidity was found in pomace olive oil. Peroxide value as an absolute value (meq O2/kg) was lowest in palm oil 1.4 (unheated), 4.0 (180°C - 120 min), 6.4 (220°C - 120 min).
Extra virgin olive oil had lower spectrophotometric indices (K232, K270 and ∆K) compared to the solvent extracted oils. Total phenols were highest in the extra virgin olive oil (196.8 mg/kg) and decreased to 59.8 and to 66.8 mg/kg after 120 min of heating at 180°C and 220°C respectively. A decreasing trend was also found in the tocopherol content with the highest % reduction (-79.5%) in EVOO heated at 220°C for 120 min. This was in agreement with the antioxidant activity trend measured with the ABTS assay (2,2’-azinobis(3-ethylbenzothiazoline-6-sulfonic acid) diammonium salt) (155.9 "M TE/100 g) and with the oxygen radical absorbance capacity (ORAC) assay (316.1 "M TE/100 g) in the unheated extra virgin olive oil.
1. INTRODUCTION
Lipids play a key role in human health. In the human diet, they are an important and essential part along with carbohydrates and proteins, representing not only a source of energy and protection for the organs and the body thanks to their functional properties, but also taking part in the metabolic processes, being components of bio-membranes and serving as carriers of biologically active substances (VASKOVA and BUCKOVA, 2015). Edible oils are chemically unstable and susceptible to oxidation processes, especially if they are in the presence of oxygen, light, moisture, heat (CALVO et al., 2012), enzymes and traces of metals (VASKOVA and BUCKOVA, 2015).
Oxidation is the main cause of deterioration of oils and fats, which besides reducing shelf-life, sensorial characteristics and nutritional value, also produces toxic compounds (POYATO et al., 2014). More than 400 chemical components have been detected in deteriorated fried edible vegetable oils (PAUL and MITTAL, 1996).
Introducing lipid oxidation products into the diet may lead to an increased risk of cardiovascular disorders, such as the formation of atherosclerotic plaques (HALLIWELL and CHIRICO, 1993). Oxidative stress seems to be linked to many multi-factorial diseases, especially cancers, cardiovascular diseases and inflammatory disorders. Oxidation alters physiologically important molecules, including proteins, lipids, carbohydrates and nucleic acids, together with the modulation of gene expression and the inflammatory response (LAGUERRE et al., 2007). The endogenous antioxidants of vegetable oils provide a natural resistance to oxidative stress.
Among all categories of olive oil, extra virgin olive oil has gained significant importance from the gastronomical, nutritional, therapeutic and economic point of view. It is considered the best olive oil for its organoleptic characteristics, stability and chemical composition (CALVO et al., 2012).
The biological activities associated with the consumption of extra virgin olive oil (antioxidant, anti-inflammatory, chemo-preventive and anti-cancer) have promoted the use of this oil, not only as food but also as an ingredient in a wide range of industrial food products (CALVO et al., 2012). Virgin olive oil is fundamental in the Mediterranean diet and contributes to its health benefits (BOSKOU, 2015) and it is widely used in the Countries of the Mediterranean basin, such as Italy (PROTO and ZIMBALATTI, 2015). Pomace olive oil is a secondary product in the olive oil industry, but it is important because otherwise olive pomace would be considered a waste. Although, palm oil is the most widely consumed edible vegetable oil in the world, with a production of 60.96 million metric tons in 2015-2016 (statista.com, 2017), controversial results have been found in relation to its use and human health (MANCINI et al., 2015). Soybean oil is the second most widely consumed edible vegetable oil in the world, with a production of 51.45 million metric tons in 2015-2016 (statista.com, 2017). After oil extraction, the residue is widely used as animal feed. This work has been based on these premises and aims to study the chemical property variations during heating of the three most popular edible vegetable oils (extra virgin olive oil, soybean oil and palm oil), together with pomace olive oil, which could become more important in the edible vegetable oil market.
The aim of this work was to study the variation in the chemical properties of the three most popular edible vegetable oils during heating at 180 and 220°C and for 30, 60 and 120 min.
2. MATERIALS AND METHODS 2.1. Vegetable oils
Four vegetable oils were used in this experiment: extra virgin olive oil (EVOO) and pomace olive oil (PO) were produced in the harvest year 2016-2017 in the Region of Calabria (South Italy) and bought directly from the producer, Palm oil (P) and Soybean oil (SO) were purchased in a supermarket. The oils were analysed before heating and after heating at two different temperatures (180°C and 220°C) for 30, 60 and 120 minutes for each temperature. A 100 g aliquot of each oil was placed in a glass pyrex container which was heated in an oven. Nine glass pyrex containers for each oil and for each temperature (180 and 220°C) were prepared, three of them for each temperature were taken out of the oven after each time established by the experimental design (30, 60 and 120 min) to conduct analyses in triplicate.
2.2. Reagents
Diethyl ether, ethyl alcohol, sodium hydroxide, phenolphtalein, chloroform, acetic acid, potassium iodide, soluble starch, cyclohexane, p-anisidine, methanol, Folin-Ciocalteu reagent, sodium carbonate, gallic acid, 1,1-diphenyl-2-picrylhydrazyl radical (DPPH●),
2,2΄-azobis(2-methylpropionamide) dihydrochloride (AAPH), Trolox, 2,2-azinobis-(3-ethylbensothiazoline)-6-sulfonic acid (ABTS), potassium peroxodisulphate, ethanol were from Sigma-Aldrich (St. Louis, MO, USA), fluorescein, sodium thiosulphate, buffer phosphate were from Carlo Erba, (Milan, Italy).
2.3. Free Acidity (FA)
FA analysis was conducted according to Annex II of the Consleg (2015) for olive oil analyses. A 5 g aliquot of each oil was dissolved in 25 mL solution of diethyl ether/ethylic alcohol (1:1, v/v) and titrated with a 0.1 N NaOH aqueous solution using 1% phenolphthalein in ethanol as an indicator. Results are expressed as g oleic acid/100 g.
2.4. Peroxide Value (PV)
Determination of PV was performed according to Annex III of the Consleg (2015) for olive oil analyses. A 2 g aliquot of each oil was dissolved in a 25 mL solution of acetic acid/chloroform (3:2, v/v) and 1 mL of a saturated aqueous solution of potassium iodide was added. The mixture was shaken for 1 minute before being placed in the dark for five minutes. After this time, it was titrated with a 0.01 N sodium thiosulphate solution using a 1% starch soluble solution as an indicator. Results are expressed as meq O2/kg.
2.5. p-Anisidine Value (p-AnV)
The p-AnV analysis was conducted as described by the Norme Grassi e Derivati method NGD C 36-79 (NGD 1979). Each sample was diluted 1:100 (m/v), with isooctane (for spectrophotometry type), after which it was allowed to react with p-anisidine. The optical density of the solution was measured at 350 nm in a UV/Vis Spectrometer model Lambda 2, Perkin Elmer, Waltham, Massachusetts USA.
2.6. TOTOX
This index is given as the sum of 2PV and p-AnV.
2.7. Spectrophotometric indices
Spectrophotometric indices were determined as described in Annex IX of the European Regulation (Consleg, 2015). Each sample was diluted 1:100 (m/v) with cyclohexane and the specific extinctions were measured at 232, 266, 270 and 274 nm against a blank (only cyclohexane). An UV/Vis Spectrometer model Lambda 2, Perkin Elmer (Waltham, MA, USA), was used.
2.8. Antioxidant Extract (AE)
AE was obtained with the method proposed by GOLDSMITH et al. (2014) modified as follows: 5 g of each sample was mixed for extraction with a 5 mL of methanol/water solution (80:20, v/v). The mixture was vigorously shaken with a Vortex for 1 min and then centrifuged at 5000 rpm for 7 min. The supernatant containing the antioxidants was kept. The operation was repeated one more time and the two extracts were mixed together to obtain the first AE. After this, two more AE were prepared to obtain three different AE from the same oil and to analyse each oil in triplicate.
2.9. Total phenolic content
Total phenolic content of the AE was determined using the Folin-Ciocalteu assay (SINGLETON et al., 1999; GIUFFRÈ et al., 2017a). Two mL of AE, 10 mL of bi-deionised water, 2.5 mL of Folin-Ciocalteu reagent and 10 mL of a 7% sodium carbonate in bi-deionised water solution were placed in a 50 mL glass flask. At this point the volume was made up to 50 mL with deionised water. A blank was prepared substituting AE with bi-deionised water. After 1 hour in the dark, the absorbance was measured at 765 nm in an Agilent 8453 spectrophotometer (Santa Clara, CA, USA). The total phenolic content was calculated on the basis of a calibration curve. Data were expressed as mg gallic acid/kg.
2.10. Antioxidant Activity (DPPH assay) hydrophilic
The DPPH assay measures the radical scavenging activity of a vegetable extract, in this case from a vegetable oil. The DPPH assay method was developed by BRAND-WILLIAMS
et al. (1995) and it was adapted to an olive oil application (KALANTZAKIS et al., 2006). It is
spectrophotometrically determined by measuring the disappearance of the 1,1-diphenyl-2-picrylhydrazyl radical (DPPH●) at 515 nm. A 0.10 mL aliquot of AE was added to 2.40 mL
of a 60 µM DPPH methanolic solution. The mixture was shaken for five minutes in the dark. After this, the decrease in absorbance was measured at 515 nm in an Agilent 8453 spectrophotometer (Santa Clara, CA, USA). Results were expressed as % inhibition (mean ± S.D.) using the following formula: % inhibition = [(T0 – T5)/T0] x 100.
2.11. Antioxidant Activity (DPPH assay) oil
The DPPH assay measures the radical scavenging activity of a vegetable oil. It was conducted in an UV/Vis Spectrometer model Lambda 2, Perkin Elmer (Waltham, MA, USA), using the method proposed by KALANTZAKIS et al. (2006), modified as follows.
were added to 2 mL of a 10-4 M DPPH● solution, previously prepared with ethyl acetate
and, thirdly, the absorbance of the mixture was measured immediately at 515 nm (t0) and after 30 minutes of incubation (t30). The results were calculated with the following formula: % inhibition = [(T0 – T30)/T0] x 100 and they were expressed as % inhibition.
2.12. Antioxidant Activity (ABTS assay)
The ABTS assay determines the radical scavenging activity of an extract using an ethanol solution of 2,2-azinobis-(3-ethylbensothiazoline)-6-sulfonic acid (ABTS) and potassium peroxydisulphate. For its determination the method proposed by RE et al. (1999) was applied, with the following modifications.
A 0.050 mL aliquot of AE was added to 2.450 mL of a 7mM ABTS ethanolic solution and was vigorously shaken in the dark for 6 minutes. After this, the decrease in absorbance was measured at 734 nm in an Agilent spectrophotometer, model 8453 (Santa Clara, CA, USA). Results were expressed as % inhibition using the following formula: % inhibition = [(T0 – T6)/T0] x 100.
2.13. Antioxidant Activity (ORAC assay) AE
The ORAC assay was proposed by CAO et al. (1993). The ORAC assay measures the antioxidant activity of an oil extract and is determined on the basis of the oxidative damage to the fluorescent protein (NINFALI et al., 2001). AAPH was used as the generating species of peroxyl radicals, and Trolox as an antioxidant standard. A 150 µL aliquot of fluorescein solution (96 nM in a 7.4 pH buffer phosphate solution) and 30 µL of AAPH (133 mM in a 7.4 pH buffer phosphate solution) were added to 20 µL of AE previously diluted 1:30 (v/v) in a 7.4 pH buffer phosphate solution. The fluorescence decrease was measured using a Perkin Elmer Victor X2 (Waltham, MA, U.S.A.). The final reaction tested and the concentrations of the different reagents were determined following FERNÁNDEZ-PACHON et al. (2005). Results were expressed as µmol Trolox/100 g.
2.14. Statistical analysis
Analyses of samples were conducted in triplicate and mean and standard deviation were calculated by the Excel 2010 version software. Analysis of variance (one-way ANOVA) was performed by SPSS software version 17.0 for Windows (SPSS Inc., Chicago, IL, U.S.A.), using the Tukey test and the significance level was set at p < 0.05. The effect of temperature and heating duration were analysed by a two-way ANOVA by SPSS software version 17.0 for Windows (SPSS Inc., Chicago, IL, U.S.A.).
3. RESULTS AND DISCUSSION 3.1. Free acidity
A vegetable oil is mainly composed of tryglycerides. Each vegetable oil has a specific triglyceride composition: olive oil contains mainly triolein (GIUFFRÈ, 2013; 2014); palm oil contains mainly dioleylpalmitoylglycerol (21-25%) and dipalmitoyloleylglycerol (30-34%) (ENDO et al., 2011); soybean oil contains mainly trilinolein (21-22%) and dilinoleolein (15-16%) (SUDAR et al., 2003).
The hydrolysis of tryglycerides produces free fatty acids as the main degradation products. When the oil temperature reaches 150°C a part of the glycerol evaporates and
the remaining glycerol promotes the production of free fatty acids by hydrolysis (NAZ et
al., 2005). This process is accelerated when a food containing water is added to the oil. The
higher the water quantity, the higher the oil degradation. In our work, EVOO had the highest initial FA but it showed the lowest percentage increase with temperature and with time. When the oils were heated at 180°C for 30, 60 and 120 min, the highest percentage increase in FA was in P: 30, 40 and 50% respectively. When the oils were heated at 220°C for 120 min, the highest percentage increase in FA was in PO: 146.7% (Table 1). If the absolute FA data are considered, the lowest values were found in P and in SO oils in which 0.18 g/100 g and 0.17 g/100 g (as oleic acid) were found after the most drastic treatment (220°C for 120 min). AZIMAH et al. (2017) used palm oil to fry potatoes at 175°C for 0, 10 and 20 times and found an initial increase in free acidity from 0.18 % (0 times, i.e. no fried oil) to 0.27% (10 times fried) whereas no increase was found from 10 to 20 times of frying. BULUT and YILMAZ (2010) used a refined pomace olive oil to fry 35 g patties whose dough contained flour (56%), water (42%) dry yeast (0.5%), baking soda (0.5%) and salt (0.5%) and found an increase from 0.27% to 0.28%, 0.34%, 0.43%, 0.52% and 0.59% in fried oil after respectively 0, 1, 2, 3, 4 and 5 days.
3.2. Peroxide value
The PV analysis is based on the quantification of the primary oxidation products, mainly hydroperoxides (SAAD et al. 2007). During peroxidation, unsaturated fatty acids are oxidized by O2. This is an auto-catalytic reaction which induces the formation of free
radicals from fatty acids and starts the oxidation of the remaining non-oxidized fatty acids. In EVOO, the initial PV was 8.1 meq O2/kg, i.e. well below the maximum (20 meq O2/kg)
stated by both the Consleg (2015) and the IOC (2015). After 120 min heating, PV increased in EVOO up to 19.4 meq O2/kg (+139.5%) at 180°C and 20.9 meq O2/kg (+158.0%) at 220°C.
Under the worst conditions (220°C and 120 min heating), PO and SO were 11.8 and 9.5 meq O2/kg respectively and P showed at the same time both the lowest absolute PV and
the highest percentage increase (357.1%), this was due to the very low initial PV (1.4 meq O2/kg) which is well below the 10 meq O2/kg required by the Codex Stan (2013) for a
refined edible vegetable oil. After 120 min of P heating, PV increased to 4.0 meq O2/kg
(+185.7%) at 180°C and to 6.4 meq O2/kg (+357.1%) at 220°C. After 60 min heating at
180°C, the PV was 9.9, 4.92, 5.7 and 3.9 meq O2/kg for EVOO, PO, SO and P respectively
(Table 2), i.e. always below the maximum of 10 meq O2/kg, stated by the Codex Stan
(2013). P showed the lowest increase in absolute value: 6.4 meq O2/kg after 120 min at
220°C. GHARBY et al. (2016) heated extra virgin olive oil and refined olive oil from Morocco (cv Picholine) at 100°C for 120 h and found a variation from 2.30 to 32.43 meq O2/kg oil in the former and a variation from 0.60 to 375.10 meq O2/kg oil in the latter.
JAARIN and KAMISAH (2002) fried sweet potatoes in palm oil and soy oil for 10 min at 180°C and used the same oil five times with an interval of at least five hours between each heating and found an increase from 2 (fresh oil) to more than 9 meq O2/kg oil in the palm
oil and an increase from 5 (fresh oil) to 11 meq O2/kg oil in the soy oil.
3.3. p-Anisidine value
p-AnV is an appropriate method for evaluating the secondary products of lipid oxidation
(QING et al., 2016) and it is related to the formation of non-volatile aldehydes (2-alkenals) and ketones which are responsible of the rancid odour and taste in a fat.
Table 1. Free acidity (g oleic acid/100 g). At the top of the table, one-way ANOVA experiment where unheated and heated oils are considered: means followed
by different letters in the same column are significantly different according to Tukey’s test (**, p < 0.01; ***, p < 0.001).
At the bottom of the table, two-way ANOVA experiment where only heated oils are considered: temperature, time, temperature x time (n.s., p > 0.05; *, p < 0.05; **, p < 0.01; ***, p < 0.001). Difference (%) is calculated on the unheated oil.
Sign. *** *** ** ***
EVOO Difference % Pomace Difference % Soybean Difference % Palm Difference %
Unheated oil 0.50±0.02 b -- 0.15±0.01 c -- 0.12±0.01 c -- 0.10±0.01 c -- 180°C/30min 0.51±0.01 b 2.0 0.17±0.01 c 13.3 0.14±0 bc 16.7 0.13±0.01 bc 30.0 180°C/60min 0.53±0.02 b 6.0 0.18±0.01 bc 20.0 0.14±0.01 abc 16.7 0.14±0 b 40.0 180°C/120min 0.53±0.01 b 6.0 0.19±0.01 bc 26.7 0.16±0.02 ab 33.3 0.15±0.01 ab 50.0 220°C/30min 0.51±0.01 b 2.0 0.17±0.01 c 13.3 0.14±0.01 abc 16.7 0.14±0 b 40.0 220°C/60min 0.52±0.01 b 4.0 0.21±0.01 b 40.0 0.16±0.01 ab 33.3 0.16±0.01 ab 60.0 220°C/120min 0.61±0.02 a 22.0 0.37±0 a 146.7 0.17±0.01 a 41.7 0.18±0.01 a 80.0 Temperature n.s. n.s. n.s. n.s. time n.s. ** * n.s. Temperature x time *** n.s. n.s. n.s.
Table 2. Peroxide Value (meq O2/kg). At the top of the table, one-way ANOVA experiment where unheated and heated oils are considered: means followed by
different letters in the same column are significantly different according to Tukey’s test (***, p < 0.001).
At the bottom of the table, two-way ANOVA experiment where only heated oils are considered: temperature, time, temperature x time (n.s., p > 0.05; *, p < 0.05; ***, p < 0.001). Difference (%) is calculated on the unheated oil.
Sign. *** *** *** ***
EVOO Difference % Pomace Difference % Soybean Difference % Palm Difference %
Unheated oil 8.1±0.3 f -- 3.9±0.01 f -- 2.4±0.03 g -- 1.4±0.05 f -- 180°C/30min 9.4±0.1 e 16.1 4.4±0.04 e 12.8 4.3±0.10 f 79.2 3.7±0.06 e 164.3 180°C/60min 9.9±0.2 e 22.2 4.9±0.07 c 25.6 5.7±0.01 d 137.5 3.9±0.04 d 178.6 180°C/120min 19.4±0.5 b 139.5 5.9±0.11 b 51.3 7.3±0.04 b 204.2 4.0±0.05 d 185.7 220°C/30min 11.6±0.6 d 43.2 4.7±0.01 d 20.5 4.6±0.05 e 91.7 4.2±0.04 c 200.0 220°C/60min 14.8±0.2 c 82.7 5.9±0.08 b 51.3 7.1±0.06 c 195.8 5.5±0 b 292.9 220°C/120min 20.9±0.2 a 158.0 11.8±0.03 a 202.6 9.5±0.04 a 295.8 6.4±0.04 a 357.1 Temperature n.s. n.s. n.s. n.s. Time * n.s. * n.s. Temperature x time *** *** *** ***
The importance of p-AnV, mainly in a rectified oil, is due to the scarce effect on removing the secondary oxidisation products by deodorisation which, instead, diminishes the PV. For this reason, if before its rectification, an edible vegetable oil has suffered a heavy and continuous oxidative damage, this can be revealed by the p-AnV analysis. After 120 min heating at 220°C, P showed the lowest initial AnV (31.4) of the studied oils, whereas SO showed the highest p-AnV (94.4) and the highest percentage increase (1715.4%) compared to the unheated oils (Table 3).
Considering values after heating at 180°C for 120 min, the p-AnV was 2.6 (EVOO), 3.1 (PO), 2.8 (SO) and 2.0 (P) times lower than p-AnV found at 220°C heating for 120 min.
If values at 220°C are considered, it is worthy of note that p-AnV after 120 min heating is almost double in PO and P and more than double in EVOO compared to p-AnV found after 60 min heating, whereas a very little increase was observed at 180°C between 60 and 120 min heated oils.
XU et al. (2015) studied the p-AnV variation in palm oil used to fry potatoes at 170°C for 75 frying batches conducted over 3 days and found a constant increase with 85 as the final value. AHMAD TARMIZI and ISMAIL (2014) used refined, bleached, and deodorized palm olein to fry potatoes at 180°C for a 56 h period and found an initial p-AnV increase from 0.8 (0 h – fresh palm olein) to 37.0 (32 h heating), thereafter they measured a constant decrease until 31.4 (48 h) and a final increase 35.6 (56 h). They also mixed palm olein with sunflower oil, canola oil and cotton seed oil and in all cases the p-AnV during heating was higher than in palm olein.
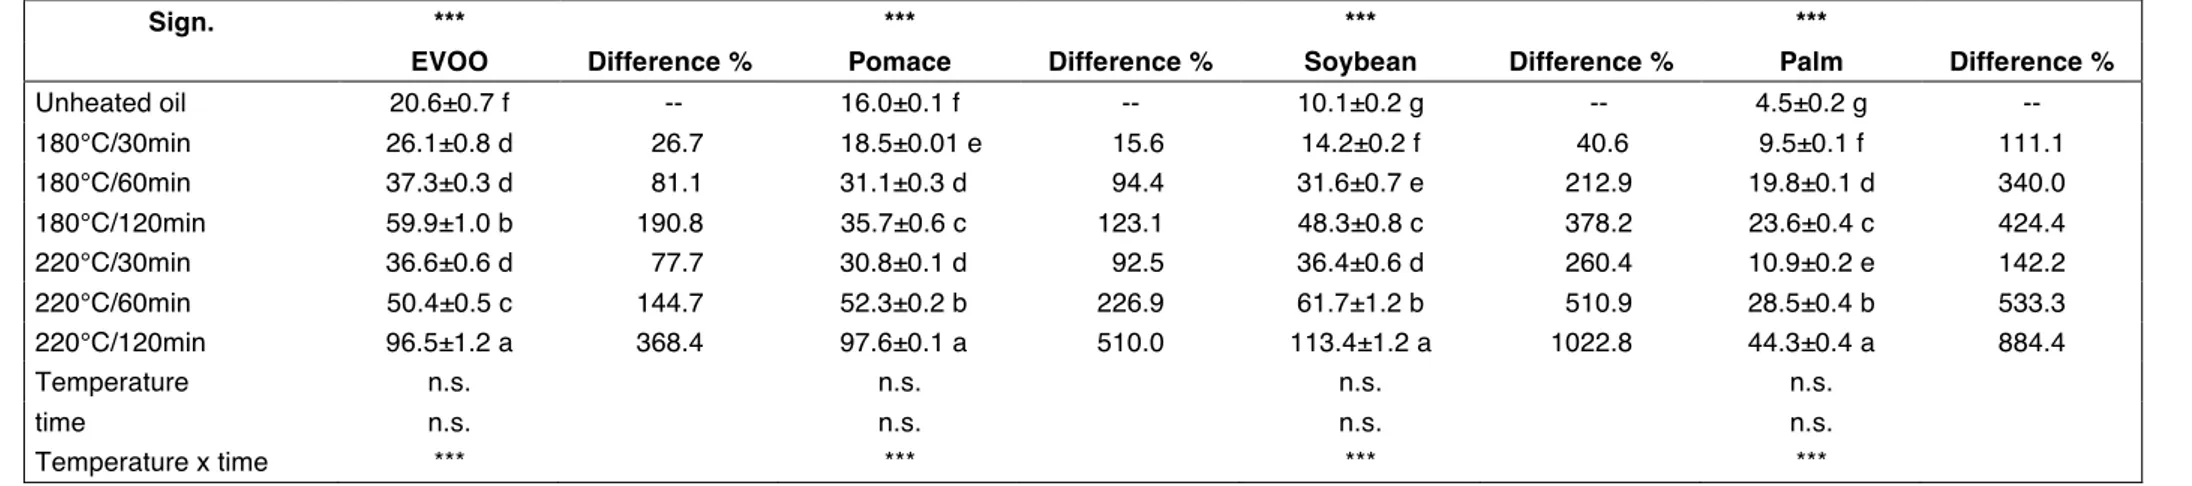
3.4. TOTOX
This is an indicator of the overall oxidation state and quality of the oil (SAAD et al., 2007). The higher the TOTOX the higher the oil’s oxidisation. TOTOX values are listed in Table 4. The initial lowest TOTOX value was found in P (4.5) followed by SO (10.1), PO (16.0) and EVOO (20.6). If TOTOX is considered after 120 min heating at 180°C, the initial classification varies from P (23.6), PO (35.7), SO (48.3) to EVOO (59.9). If TOTOX is considered after 120 min heating at 220°C, the initial value increases to 44.3 in P, 96.5 in EVOO, 97.6 in PO and to 113.4 in SO. This was due to the different antioxidant content and to the different fatty acid composition of each oil. EVOO had the highest total phenolic content (Table 8) and P had the highest saturated fatty acid content (data not published). As a consequence, even if EVOO had the highest initial TOTOX, the heating treatment caused the lowest percentage increase after 120 min at 220°C (368.4%): this was due to the highest phenolic content (Table 8). Another low increase in terms of TOTOX was found in P (44.3 after 120 min at 220°C), because of the lowest unsaturated fatty acid content (less than 60%) and the lowest polyunsaturated fatty acid content (less than 13%) of this oil (data not published).
XU et al. (2015) studied palm oil during the frying of potatoes at 170°C and found a constant increase from 10 (fresh oil) to 115 after 75 frying cycles (5 min each one). SRIVASTAVA and SEMWAL (2015), in coconut oil heated at 180°C for 8 h found a continuous and significant increase in TOTOX value from 8.91 (fresh oil/0 h) to 33.95 after 8 h heating.
3.5. K232, K270 and ∆K
Thermal oxidation causes the isomerisation of double bonds contained in the unsaturated fatty acids and the formation of trans isomers (MARINOVA et al., 2012). The absorbance at 232 nm gives information about the presence of diene conjugates, which are formed during the oil rectification. Also, the oxidation products present in an edible vegetable oil vary the spectrum of UV absorption and increase values read on the spectrophotometer. The lower this value, the better the oil quality.
Table 3. p-Anisidine Value. At the top of the table, one-way ANOVA experiment where unheated and heated oils are considered: means followed by different
letters in the same column are significantly different according to Tukey’s test (***, p < 0.001). At the bottom of the table, two-way ANOVA experiment where only heated oils are considered: temperature, time, temperature x time (n.s., p > 0.05; ***, p < 0.001). Difference (%) is calculated on the unheated oil.
Sign. *** *** *** ***
EVOO Difference % Pomace Difference % Soybean Difference % Palm Difference %
Unheated oil 4.4±0.1 f -- 8.3±0.07 f -- 5.2±0.12 f -- 1.8±0.10 e -- 180°C/30min 7.4±0.6 e 68.2 9.6±0.08 e 15.7 5.6±0.04 f 7.7 2.0±0.07 e 11.1 180°C/60min 17.4±0.5 c 295.5 21.2±0.13 d 155.4 20.2±0.69 e 288.5 11.9±0.04 d 561.1 180°C/120min 21.0±0.1 b 377.3 24.0±0.39 c 189.2 33.6±0.83 c 546.2 15.5±0.33 c 761.1 220°C/30min 13.4±0.6 d 204.5 21.4±0.11 d 157.8 27.2±0.64 d 423.1 2.4±0.15 e 33.3 220°C/60min 20.8±0.1 b 372.8 40.5±0.08 b 388.0 47.6±1.06 b 815.4 17.5±0.36 b 872.2 220°C/120min 54.6±1.2 a 1140.9 73.9±0.01 a 790.4 94.4±1.13 a 1715.4 31.4±0.33 a 1644.4 Temperature n.s. n.s. n.s. n.s. Time n.s. n.s. n.s. n.s. Temperature x time *** *** *** ***
Table 4. TOTOX. At the top of the table, one-way ANOVA experiment where unheated and heated oils are considered: means followed by different letters in the
same column are significantly different according to Tukey’s test (***, p < 0.001). At the bottom of the table, two-way ANOVA experiment where only heated oils are considered: temperature, time, temperature x time (n.s., p > 0.05; ***, p < 0.001). Difference (%) is calculated on the unheated oil.
Sign. *** *** *** ***
EVOO Difference % Pomace Difference % Soybean Difference % Palm Difference %
Unheated oil 20.6±0.7 f -- 16.0±0.1 f -- 10.1±0.2 g -- 4.5±0.2 g -- 180°C/30min 26.1±0.8 d 26.7 18.5±0.01 e 15.6 14.2±0.2 f 40.6 9.5±0.1 f 111.1 180°C/60min 37.3±0.3 d 81.1 31.1±0.3 d 94.4 31.6±0.7 e 212.9 19.8±0.1 d 340.0 180°C/120min 59.9±1.0 b 190.8 35.7±0.6 c 123.1 48.3±0.8 c 378.2 23.6±0.4 c 424.4 220°C/30min 36.6±0.6 d 77.7 30.8±0.1 d 92.5 36.4±0.6 d 260.4 10.9±0.2 e 142.2 220°C/60min 50.4±0.5 c 144.7 52.3±0.2 b 226.9 61.7±1.2 b 510.9 28.5±0.4 b 533.3 220°C/120min 96.5±1.2 a 368.4 97.6±0.1 a 510.0 113.4±1.2 a 1022.8 44.3±0.4 a 884.4 Temperature n.s. n.s. n.s. n.s. time n.s. n.s. n.s. n.s. Temperature x time *** *** *** ***
The best findings were revealed in EVOO (1.686 for unheated EVOO and 2.663 for H-EVOO at 220°C for 120 min). P showed the second lowest values at 180°C and at 220°C after 30 min heating. In P a slight reduction in K232 was found at both 180 and 220°C from 60 and 120 min heating (Table 5). PO showed the second lowest findings at 220°C and 60-120 min heating. The absorbance at 270 nm gives information about the presence of triene conjugates. Linoleate oxidation products or degradation of hydroxylinoleate produce conjugated trienes absorbing at 270 nm (MARINOVA et al., 2012). Findings are listed in Table 6. SO showed the initial absolute highest value and this negative condition was found after all the studied treatments, whereas it showed the lowest relative increase during heating (68.9% after 120 min at 220°C). EVOO always showed both the absolute lowest value and the highest relative increase with time and with temperature. The lowest EVOO values were due to its being the only non-rectified vegetable oil in this study. P showed the second lowest findings after EVOO.
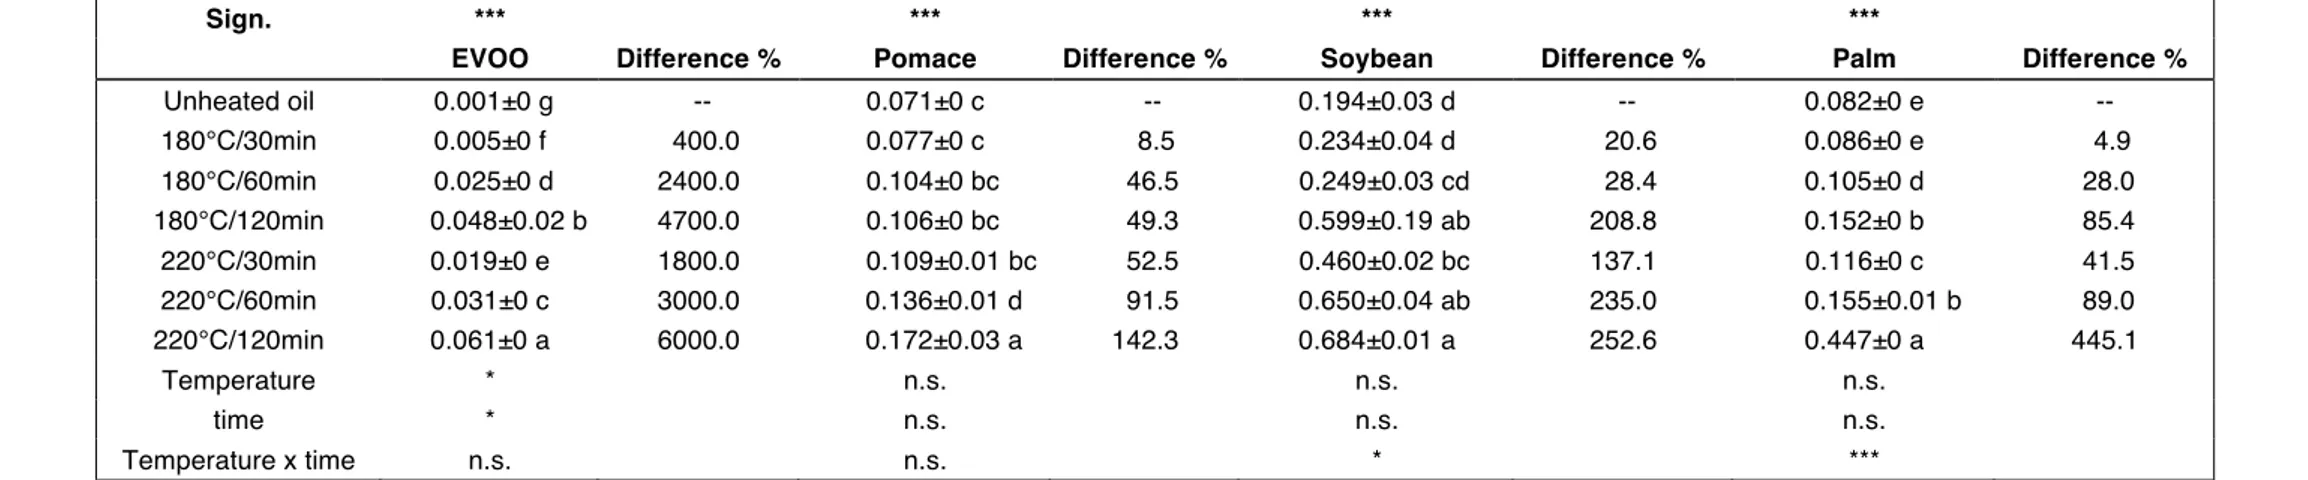
∆K is a spectrophotometric index indicating the maximum absorbance at 270 nm. In the case of a rectified oil, and mainly in the case of PO, the absorbance value in this zone increases and the spectrophotometric profile has a characteristic trend with three maximum levels due to the presence of trienes. Of the three peaks, the most pronounced is the central one at 270 nm. To judge an edible vegetable oil it is also important to take into account the absorbance of the two lateral peaks at 266 nm and 274 nm. EVOO showed the lowest ∆K before and after heating, this was because EVOO is not rectified and because of the low ∆K value before heating (0.001), which was reversed in the subsequent steps during heating (Table 7). It is noteworthy that the ∆K value observed in EVOO after 120 min of heating at 220°C was lower than the ∆K value observed in the three other oils before heating; this demonstrates, if necessary, the better food properties of EVOO if compared to other edible vegetable oils. SO always presented the highest values and from the ∆K point of view this is the worst oil.
GHARBY et al. (2017) treated edible oils at 100°C for 120 h and found an increase from 1.57 (fresh oil) to 2.59 (after 120 h heating) in an EVOO and a progress from 1.78 to 2.79 in a refined olive oil under the same thermal and time conditions. In the same study K270 was found to increase from 0.13 to 0.33 in EVOO and from 0.55 to 1.99 in a refined olive oil. AZIMAH et al. (2017) measured the presence of conjugated dienes at 234 nm in palm oil used to fry potatoes at 175°C, they read 5.36 as a specific extinction in the fresh oil and 5.40 and 5.21 after 10 and 20 frying cycles respectively.
3.6. Total phenolic content
Vegetable oils contain many biologically active components, which exert antioxidant activity, EVOO is consumed unrefined, differently from other edible vegetable oils. This implies that EVOO contains many minor bioactive compounds such as phenols whose content was found to decrease in EVOO during olive fruit ripening (SICARI et al., 2009; SICARI et al., 2010).
Table 8 describes the total phenolic content evolution of the four studied oils during heating treatments. The highest total phenolic content was found in EVOO (196.8 mg/kg) whereas the lowest content was found in SO (15.0 mg gallic acid/kg).
Heating lowered the total phenolic content and a continuous decrease was measured with heating and with time in all the studied oils. The lowest total phenolic content was found in the samples heated for 120 min at 220°C. The highest loss in total phenolic content (as a percentage) was in EVOO because it had (ab origine) the highest total phenolic content, thus, the highest total phenolic content to be lost during heating.
SANTOS et al. (2018) studied EVOO during the frying of white potatoes at 175°C and found a loss in total phenolic content from fresh oil (564 mg/kg) to the 28 hrs fried oil (171 mg/kg), with the minimum content (114 mg/kg) after 16 hrs frying.
Table 5. K 232. At the top of the table, one-way ANOVA experiment where unheated and heated oils are considered: means followed by different letters in the
same column are significantly different according to Tukey’s test (*, p < 0.05; ***, p < 0.001). At the bottom of the table, two-way ANOVA experiment where only heated oils are considered: temperature, time, temperature x time (n.s., p > 0.05; *, p < 0.05; **, p < 0.01; ***, p < 0.001). Difference (%) is calculated on the unheated oil.
Sign. *** * *** ***
EVOO Difference % Pomace Difference % Soybean Differenc % Palm Difference %
Unheated oil 1.686±0.01 -- 2.858±0.02 -- 2.967±0.04 -- 2.287±0.13 -- 180°C/30min 1.802±0.02 6.9 2.898±0.07 1.4 3.012±0.08 1.5 2.568±0.06 12.3 180°C/60min 1.931±0.02 14.5 2.927±0.02 2.4 3.099±0.06 4.4 2.742±0.01 19.9 180°C/120min 2.297±0.01 36.2 2.987±0.12 4.5 3.113±0.01 4.9 2.722±0.01 19.0 220°C/30min 1.820±0.02 7.9 2.922±0 2.2 3.053±0.06 2.9 2.827±0.03 23.6 220°C/60min 2.594±0.01 53.9 2.934±0.01 2.7 3.104±0 4.6 3.518±0.05 53.8 220°C/120min 2.663±0.03 57.9 3.039±0.05 6.3 3.143±0.01 5.9 3.212±0.06 40.4 Temperature n.s. n.s. n.s. n.s. time n.s. * ** n.s. Temperature x time *** n.s. n.s. ***
Table 6. K270. At the top of the table, one-way ANOVA experiment where unheated and heated oils are considered: means followed by different letters in the
same column are significantly different according to Tukey’s test (***, p < 0.001). At the bottom of the table, two-way ANOVA experiment where only heated oils are considered: temperature, time, temperature x time (n.s., p > 0.05; ***, p < 0.001). Difference (%) is calculated on the unheated oil.
Sign. *** *** *** ***
EVOO Difference % Pomace Difference % Soybean Difference % Palm Difference %
Unheated oil 0.113±0.01 g -- 1.203±0.01 g -- 2.174±0.05 e -- 0.971±0.03 f -- 180°C/30min 0.166±0.01 f 46.9 1.466±0.01 f 21.9 2.308±0.10 d 6.2 1.054±0 e 8.5 180°C/60min 0.407±0.01 d 260.2 1.713±0.02 d 42.4 2.550±0.09 d 17.3 1.211±0.02 d 24.7 180°C/120min 0.545±0 b 382.3 1.871±0.02 c 55.5 3.237±0.18 b 48.9 1.555±0 c 60.1 220°C/30min 0.350±0 e 209.7 1.639±0.01 e 36.2 2.841±0.01 c 30.7 1.227±0.02 d 26.4 220°C/60min 0.511±0 c 352.2 2.279±0.01 b 89.4 3.664±0.03 a 68.5 1.639±0.04 b 68.8 220°C/120min 0.890±0.01 a 687.6 2.729±0.03 a 126.8 3.672±0.04 a 68.9 2.364±0.01 a 143.5 Temperature n.s. n.s. n.s. n.s. time n.s. n.s. n.s. n.s. Temperature x time *** *** *** ***
Table 7. ∆K. At the top of the table, one-way ANOVA experiment where unheated and heated oils are considered: means followed by different letters in the
same column are significantly different according to Tukey’s test (***, p < 0.001). At the bottom of the table, two-way ANOVA experiment where only heated oils are considered: temperature, time, temperature x time (n.s., p > 0.05; *, p < 0.05; ***, p < 0.001). Difference (%) is calculated on the unheated oil.
Sign. *** *** *** ***
EVOO Difference % Pomace Difference % Soybean Difference % Palm Difference %
Unheated oil 0.001±0 g -- 0.071±0 c -- 0.194±0.03 d -- 0.082±0 e -- 180°C/30min 0.005±0 f 400.0 0.077±0 c 8.5 0.234±0.04 d 20.6 0.086±0 e 4.9 180°C/60min 0.025±0 d 2400.0 0.104±0 bc 46.5 0.249±0.03 cd 28.4 0.105±0 d 28.0 180°C/120min 0.048±0.02 b 4700.0 0.106±0 bc 49.3 0.599±0.19 ab 208.8 0.152±0 b 85.4 220°C/30min 0.019±0 e 1800.0 0.109±0.01 bc 52.5 0.460±0.02 bc 137.1 0.116±0 c 41.5 220°C/60min 0.031±0 c 3000.0 0.136±0.01 d 91.5 0.650±0.04 ab 235.0 0.155±0.01 b 89.0 220°C/120min 0.061±0 a 6000.0 0.172±0.03 a 142.3 0.684±0.01 a 252.6 0.447±0 a 445.1 Temperature * n.s. n.s. n.s. time * n.s. n.s. n.s. Temperature x time n.s. n.s. * ***
Table 8. Total phenolic content (mg gallic acid/kg). At the top of the table, one-way ANOVA experiment where unheated and heated oils are considered: means
followed by different letters in the same column are significantly different according to Tukey’s test (***, p < 0.001). At the bottom of the table, two-way ANOVA experiment where only heated oils are considered: temperature, time, temperature x time (n.s., p > 0.05; *, p < 0.05; **, p < 0.01; ***, p < 0.001). Difference (%) is calculated on the unheated oil.
Sign. *** *** *** ***
EVOO Difference % Pomace Difference % Soybean Difference % Palm Difference %
Unheated oil 196.8±5.1 a -- 40.0±0.2 a -- 15.0±0.6 e -- 43.0±0.6 a -- 180°C/30min 155.5±3.0 b -21.0 35.5±3.0 b -11.3 12.2±0.3 b -18.7 39.5±1.6 b -8.1 180°C/60min 95.1±4.0 c -51.7 29.6±0.3 c -26.0 10.5±0.4 c -30.0 33.3±0.9 c -22.6 180°C/120min 59.8±2.2 d -69.6 27.6±1.1 cd -31.0 10.1±0.3 c -32.6 26.5±2.0 d -38.4 220°C/30min 91.5±2.9 c -53.5 30.0±0.7 c -25.0 9.6±0.5 c -36.0 33.1±0.6 c -23.0 220°C/60min 63.8±1.8 d -67.6 24.3±0.2 de -39.3 7.1±0.5 d -52.7 27.2±0.9 d -36.7 220°C/120min 66.8±1.2 d -66.1 22.5±1.3 e -43.8 5.2±0.4 e -65.3 21.8±0.6 e -49.3 Temperature n.s. *** * ** time n.s. *** n.s. ** Temperature x time *** n.s. *** n.s.
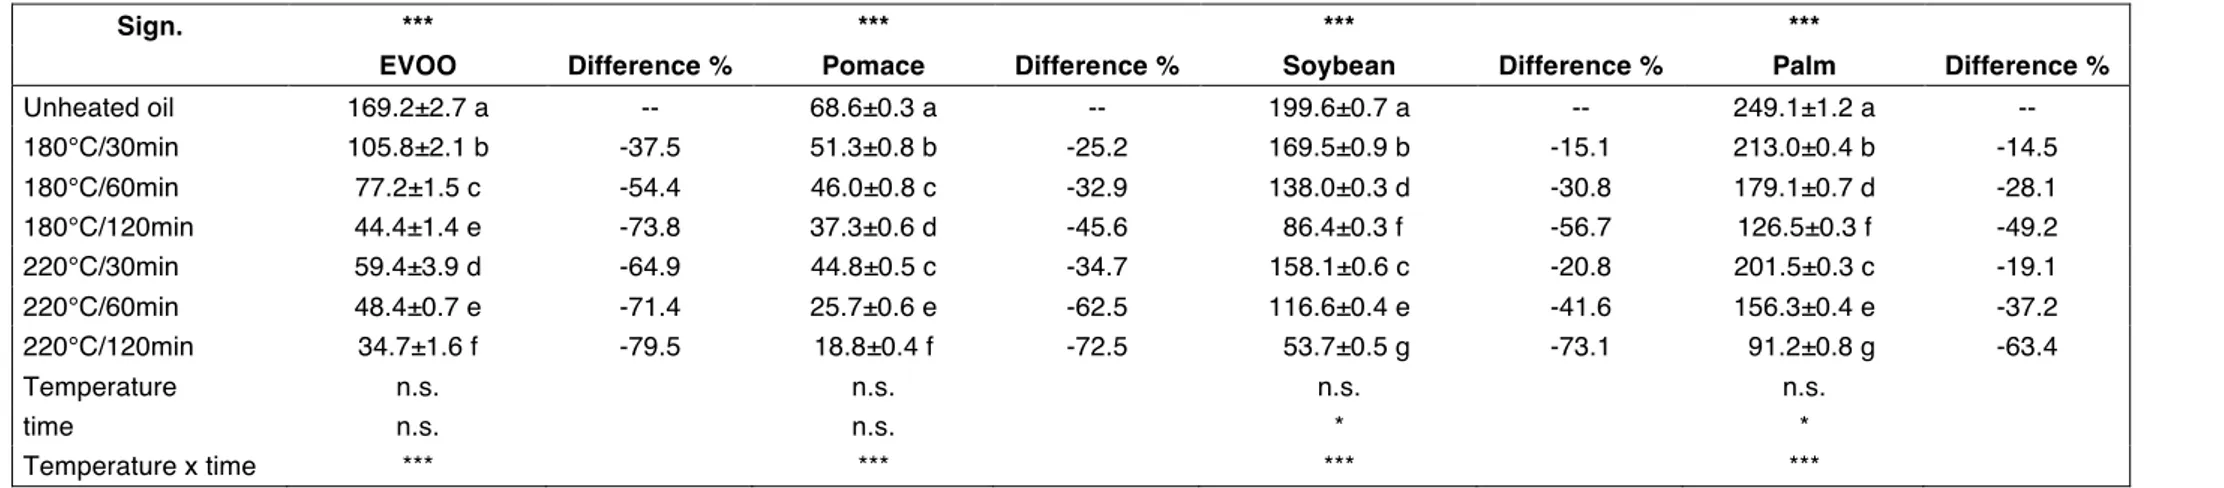
3.7. Total tocopherol content
Tocopherols are important components of Vitamin E which was found to prevent the risk of prostate cancer (COC, 2015), to maintain the integrity of long-chain PUFAs in the membranes of cells and thus maintain their bioactivity (TRABER and ATKINSON, 2007), to have beneficial effects as an antioxidant against reproductive disorders, thus it is recommended for women of reproductive age (MUTALIP et al., 2018), and to exert an antioxidant activity during a vegetable oil’s shelf-life (EVANS et al., 2002).
The initial tocopherol content depends on many factors such as cultivar and extraction procedure, for this reason different tocopherol contents are present in the literature in the unheated oils. The following contents have been reported: for EVOO 125-214 mg/kg (NINFALI
et al., 2002); for PO: 300 mg/kg (PIGNITTER et al., 2016); for S: 1030 mg/kg (EVANS et al., 2002),
340 mg/kg (GRILO et al., 2014); for P: 201 mg/kg (XU et al., 2015), 500 mg/kg (KOUSKI et al., 2015). In the oils studied in our work, P contained the highest initial total tocopherol content (249 α-tocopherol mg/kg) and showed the lowest percentage decreasing trend at 180°C and at 220°C. SO was found to have the second highest tocopherol content (199.6 mg/kg), whereas PO had the lowest content i.e. 68.6 mg/kg in the unheated PO and 37.3 mg/kg after 120 min heating at 180°C and 18.8 mg/kg after 120 min at 220°C heating (Table 9). Our results are confirmed by other Authors who always found a decreasing trend in tocopherol content during heating even if with a different rate depending on the type of oil, cooking system and applied temperature (HASSANEIN et al., 2003; HAMID et al., 2014; JAVIDIPOUR et al., 2017).
3.8. Antioxidant Activity (ABTS assay)
The AA is partially a consequence of total phenolic content and, more generally, it is a consequence of the physico-chemical properties of each oil studied in this work. EVOO showed the highest ABTS-AA at the start of the experiment (155.9 "M TE/100 g) and in all the six applied treatments. Of the refined oils, P and SO showed the lowest percentage difference in all the six treatments, i.e. the lowest decrease in terms of percentage (Table 10). AYDENIZ and YILMAZ (2016) studied a refined winterized peanut oil and found a decreasing trend in Antioxidant Activity during frying of patties at 180°C for four consecutive days (5-5.5 hrs per day): the oil showed 3.1 mM TEAC/100 g oil at 0 day and 1.8 (day 1), 1.2 (day 2), 0.8 (day 3), 0.5 (day 4); in this experiment the Antioxidant Activity was lower than in our experiment but the peanut oil had a very low initial total phenolic content (0.013 g/kg oil).
3.9. Antioxidant Activity (DPPH hydrophilic assay)
P showed the highest AA-DPPH-hydro in the hydrophilic extract after each treatment (51.8-38.9 "M TE/100 g), whereas SO always showed the lowest AA-DPPH-hydro (6.6-3.7 "M TE/100 g). EVOO showed the second highest AA-DPPH-hydro. This was probably due to the high phenolic content in EVOO (Table 8) and to the high tocopherol content in P, in accordance with findings of antioxidant content reported by other authors (HAMID et al., 2014). In all our studied oils a constant decrease in terms of AA was revealed (Table 11).
3.10. Antioxidant Activity (DPPH oil assay)
The highest AA-DPPH-oil was found in unheated SO (117.0 "M TE/100 g) and P (115.7 "M TE/100 g), whereas in unheated EVOO the Antioxidant Activity was 73.5 "mol TE/100 g (Table 12). According to KALANTZAKIS et al. (2006) who compared virgin olive oil with SO during 10 hours heating and found SO to have a higher AA-DPPH-oil before and after heating, this was probably due to the higher presence of tocopherol content in SO.
Table 9. Total tocopherol content (mg α-tocopherol/kg). At the top of the table, one-way ANOVA experiment where unheated and heated oils are considered:
means followed by different letters in the same column are significantly different according to Tukey’s test (***, p < 0.001). At the bottom of the table, two-way ANOVA experiment where only heated oils are considered: temperature, time, temperature x time (n.s., p > 0.05; *, p < 0.05; ***, p < 0.001). Difference (%) is calculated on the unheated oil.
Sign. *** *** *** ***
EVOO Difference % Pomace Difference % Soybean Difference % Palm Difference %
Unheated oil 169.2±2.7 a -- 68.6±0.3 a -- 199.6±0.7 a -- 249.1±1.2 a -- 180°C/30min 105.8±2.1 b -37.5 51.3±0.8 b -25.2 169.5±0.9 b -15.1 213.0±0.4 b -14.5 180°C/60min 77.2±1.5 c -54.4 46.0±0.8 c -32.9 138.0±0.3 d -30.8 179.1±0.7 d -28.1 180°C/120min 44.4±1.4 e -73.8 37.3±0.6 d -45.6 86.4±0.3 f -56.7 126.5±0.3 f -49.2 220°C/30min 59.4±3.9 d -64.9 44.8±0.5 c -34.7 158.1±0.6 c -20.8 201.5±0.3 c -19.1 220°C/60min 48.4±0.7 e -71.4 25.7±0.6 e -62.5 116.6±0.4 e -41.6 156.3±0.4 e -37.2 220°C/120min 34.7±1.6 f -79.5 18.8±0.4 f -72.5 53.7±0.5 g -73.1 91.2±0.8 g -63.4 Temperature n.s. n.s. n.s. n.s. time n.s. n.s. * * Temperature x time *** *** *** ***
Table 10. Antioxidant Activity, ABTS assay ("M TE/100g). At the top of the table, one-way ANOVA experiment where unheated and heated oils are considered:
means followed by different letters in the same column are significantly different according to Tukey’s test (***, p < 0.001). At the bottom of the table, two-way ANOVA experiment where only heated oils are considered: temperature, time, temperature x time (n.s., p > 0.05; *, p < 0.05; **, p < 0.01). Difference (%) is calculated on the unheated oil.
Sign. *** *** *** ***
EVOO Difference % Pomace Difference % Soybean Difference % Palm Difference %
Unheated oil 155.9±3.83 a -- 62.5±2.47 a -- 51.8±0.22 a -- 51.8±0.36 a -- 180°C/30min 145.6±1.28 b -6.6 56.3±1.32 ab -9.9 37.9±0.22 b -26.9 49.1±2.12 a -5.3 180°C/60min 131.3±1.71 c -15.8 52.8±4.56 bc -15.5 36.4±0.27 bc -29.9 44.8±1.20 b -13.5 180°C/120min 112.3±0.31 d -27.9 45.5±1.55 cd -27.1 30.7±0.79 de -40.8 43.1±0.21 b -16.9 220°C/30min 124.6±1.17 c -20.1 44.9±5.51 cd -28.0 32.4±3.27 cd -37.6 44.5±2.14 b -14.2 220°C/60min 111.1±3.69 d -28.7 42.9±3.80 d -31.3 33.8±1.24 bcd -34.8 39.1±0.25 c -24.6 220°C/120min 100.5±3.29 e -35.5 29.1±2.01 e -53.4 27.2±1.58 e -47.5 38.9±0.44 c -24.9 Temperature * * * * time * n.s. * * Temperature x time ** n.s. n.s. n.s.
In all the oils studied in our work, the AA-DPPH-oil assay showed higher values if compared to AA-DPPH-hydro (Tables 11-12). This was in accordance with the findings of ESPÍN et al. (2000) who analysed the AA-DPPH of untreated edible vegetable oils (total fats or FT), of its methanolic extracts (MF) and of the oil after methanolic extraction (LF) and found the sum MF + LF always quantitatively comparable with TF value. The decreasing trend of the AA-DPPH-oil was demonstrated by other Authors in different heating conditions. GOMEZ-ALONSO et al. (2003) studied EVOO used for French fries at 180°C and found a decrease in the AA of the oil from 740 !mol TE/kg (fresh oil) to less than 250 !mol TE/kg during a total of 2 h frying over 6 days. A reduction in radical scavenging activity (DPPH assay) was also found during deep-frying in palm oil and rice bran oil (HAMID et al., 2014). KOBYLIŃSKI et al (2016) studied the effect of specific oil surface in rapeseed oil during heating at 180°C and found 459.5 !mol TE/100g as an AA-DPPH value in the fresh oil and an AA-DPPH value ranging from 3.3 !mol TE/100g to 72.65 !mol TE/100g when the level of oil in pan-five different oil layer heights was changed from 0.5 cm to 2.5 cm; this was expected considering that during heating of a thin oil layer there is a greater oxygen absorption per unit oil than during heating in a larger amount of oil.
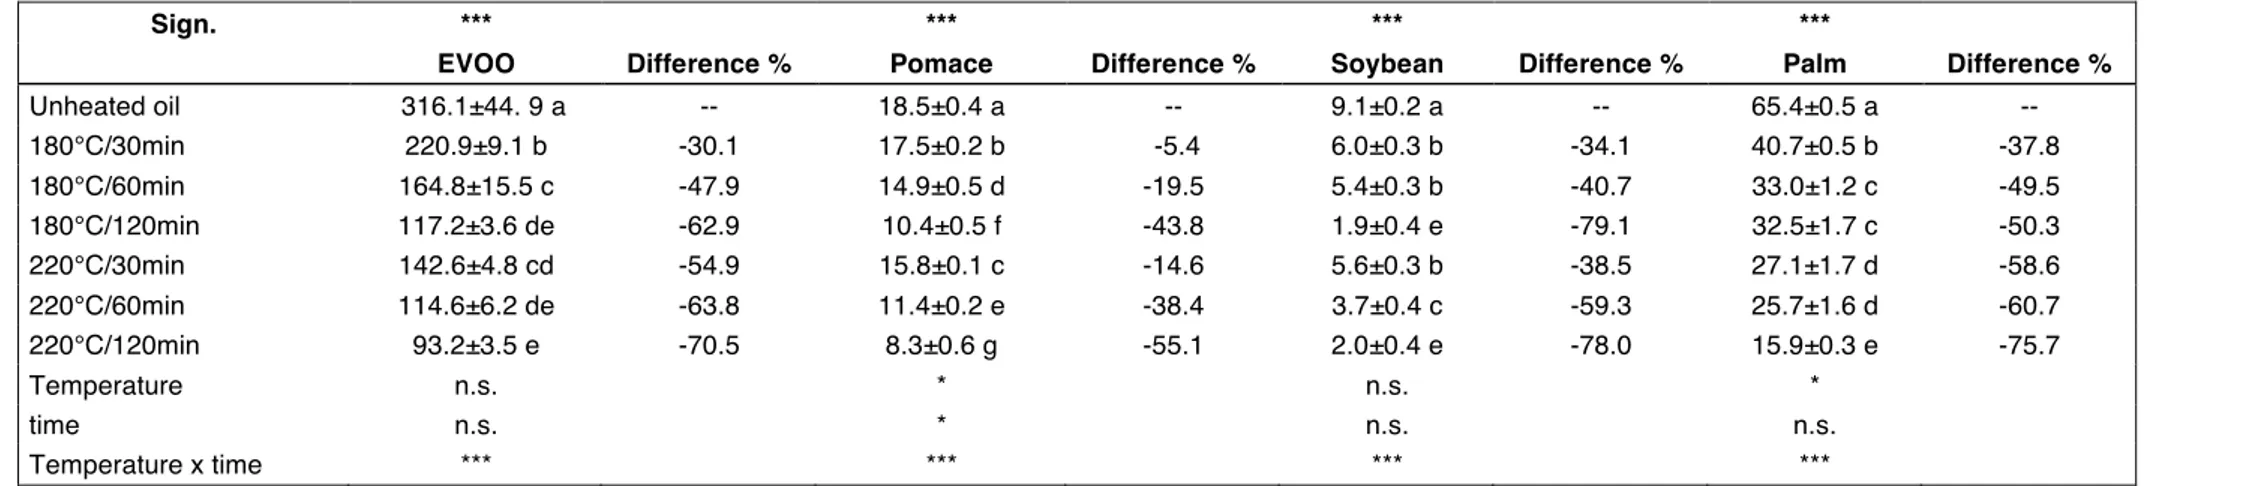
3.11. Antioxidant Activity (ORAC assay)
The ORAC assay confirmed results obtained by ABTS assay with EVOO showing the highest ORAC-AA. Before heating EVOO had the highest ORAC-AA value (316.1 !M TE/100 g), after 30 min heating it decreased to 220.9 !M TE/100 g (-30.1%) and to 142.6 !M TE/100 g (-54.9%) at 180°C and 220°C respectively (Table 13). P showed the second highest ORAC-AA (65.4 !M TE/100 g) and it decreased to 40.7 !M TE/100 g (after 30 min heating) and to 32.5 !M TE/100 g (after 120 min heating) at 180°C. When P was heated at 220°C, the ORAC-AA was 27.1 !M TE/100 g (-58.6%) and 15.9 (-75.7%) respectively after 30 and 120 min heating. It is worthy of note that oils from different cultivars could have a different ORAC even if they have the same total phenolic content, in fact ZULLO and CIAFARDINI (2008) studied some single components of the phenolic fraction in an EVOO and found gallic acid to have a greater influence on ORAC than caffeic acid and oleuropein.
3.12. ONE-WAY ANOVA, TWO-WAY ANOVA, CORRELATION MATRIX
3.12.1 Free acidity
One-way ANOVA showed high significant differences in SO and showed very high significant differences in every other oil (p < 0.001), (Table 1). Two-way ANOVA analysis showed that temperature had no significant effect on the FA variation in the four oils analysed in this study (Table 1). The same was for heating duration on EVOO and P, whereas the heating duration influenced significantly the FA variation in SO (p < 0.05) and highly significantly in PO (p < 0.01). FA showed a very good positive correlation with p-AnV especially in EVOO (0.9175), in PO (0.9567) and in P (0.8193), a good correlation was found in SO (0.7634), (Tables 14-17). FA was negatively very well correlated with AA-DPPH-oil in P (-0.8569), in SO (-0.8372), in EVOO (-0.8067) and a good correlation was found in PO (-0.7820), (Tables 14-17). Similar studies have been conducted on other edible vegetable oils. GIUFFRÈ et al. (2017b), studied the influence of high temperature and time of heating on sunflower seed oil at 180-210-240°C for 15-30-60-120 min and found a constant slight increase in FA which was influenced by time of heating (p < 0.01) and by the interaction between temperature and time of heating (p < 0.001).
Table 11. Antioxidant Activity, DPPH hydrophilic assay (!M TE/100g). At the top of the table, one-way ANOVA experiment where unheated and heated oils
are considered: means followed by different letters in the same column are significantly different according to Tukey’s test (**, p < 0.01; ***, p < 0.001). At the bottom of the table, two-way ANOVA experiment where only heated oils are considered: temperature, time, temperature x time (n.s., p > 0.05; *, p < 0.05; **, p < 0.01; ***, p < 0.001). Difference (%) is calculated on the unheated oil.
Sign. *** ** *** ***
EVOO Difference % Pomace Difference % Soybean Difference % Palm Difference %
Unheated oil 47.0±3.37 a -- 10.7±0.44 a -- 6.6±0.30 a -- 51.8±0.36 a -- 180°C/30min 43.6±0.88 a -7.3 8.3±2.82 b -22.9 6.4±0.14 a -3.9 49.1±2.12 b -13.4 180°C/60min 29.6±1.71 b -37.1 7.8±0.41 b -27.4 6.3±0.17 a -5.5 44.8±1.20 bc -21.5 180°C/120min 19.9±0.35 c -57.7 6.8±1.05 b -37.0 3.8±0.45 b -42.9 43.1±0.21 bc -24.9 220°C/30min 28.8±2.05 b -38.7 7.5±0.06 b -29.8 4.5±0.25 b -32.7 44.5±2.14 b -14.9 220°C/60min 19.6±0.46 c -58.3 6.6±0.11 b -38.7 3.8±0.45 b -42.6 39.1±0.25 cd -32.1 220°C/120min 12.7±2.87 d -73.0 5.0±1.78 b -53.6 3.7±0.24 b -43.7 38.9±0.44 d -43.3 Temperature * n.s. n.s. n.s. Time * n.s. n.s. n.s. Temperature x time ** n.s. *** *
Table 12. Antioxidant Activity, DPPH oil assay (!M TE/100g). At the top of the table, one-way ANOVA experiment where unheated and heated oils are
considered: means followed by different letters in the same column are significantly different according to Tukey’s test (***, p < 0.001). At the bottom of the table, two-way ANOVA experiment where only heated oils are considered: temperature, time, temperature x time (n.s., p > 0.05; *, p < 0.05; **, p < 0.01; ***, p < 0.001). Difference (%) is calculated on the unheated oil.
Sign. *** *** *** ***
EVOO Difference % Pomace Difference % Soybean Difference % Palm Difference %
Unheated oil 73.5±2.02 a -- 69.8±0.14 a -- 117.0±0.21 a -- 115.7±1.97 a -- 180°C/30min 71.7±1.84 a -2.3 68.0±0.19 b -2.6 107.4±0.46 b -8.2 109.9±1.14 ab -5.0 180°C/60min 56.7±1.59 c -22.8 66.2±0.19 c -5.2 105.6±1.06 c -9.8 106.8±0.46 bc -7.7 180°C/120min 43.4±1.82 e -40.9 61.4±0.55 d -12.0 101.2±0.49 e -13.5 101.2±0.34 cd -12.6 220°C/30min 64.5±1.14 b -12.1 49.9±0.19 e -28.5 105.2±0.60 c -10.1 107.4±4.24 bc -7.1 220°C/60min 50.3±1.97 d -31.5 48.5±0.25 f -30.6 103.3±0.42 d -11.7 95.9±2.44 d -17.1 220°C/120min 31.3±0.92 f -57.3 39.0±0.56 g -44.2 96.5±0.28 f -17.5 76.9±3.59 e -33.5 Temperature * ** n.s. n.s. time * n.s. * n.s. Temperature x time * *** ** ***
Table 13. Antioxidant Activity, ORAC assay (!M TE/100 g). At the top of the table, one-way ANOVA experiment where unheated and heated oils are
considered: means followed by different letters in the same column are significantly different according to Tukey’s test (***, p < 0.001). At the bottom of the table, two-way ANOVA experiment where only heated oils are considered: temperature, time, temperature x time (n.s., p > 0.05; *, p < 0.05; ***, p < 0.001). Difference (%) is calculated on the unheated oil.
Sign. *** *** *** ***
EVOO Difference % Pomace Difference % Soybean Difference % Palm Difference %
Unheated oil 316.1±44. 9 a -- 18.5±0.4 a -- 9.1±0.2 a -- 65.4±0.5 a -- 180°C/30min 220.9±9.1 b -30.1 17.5±0.2 b -5.4 6.0±0.3 b -34.1 40.7±0.5 b -37.8 180°C/60min 164.8±15.5 c -47.9 14.9±0.5 d -19.5 5.4±0.3 b -40.7 33.0±1.2 c -49.5 180°C/120min 117.2±3.6 de -62.9 10.4±0.5 f -43.8 1.9±0.4 e -79.1 32.5±1.7 c -50.3 220°C/30min 142.6±4.8 cd -54.9 15.8±0.1 c -14.6 5.6±0.3 b -38.5 27.1±1.7 d -58.6 220°C/60min 114.6±6.2 de -63.8 11.4±0.2 e -38.4 3.7±0.4 c -59.3 25.7±1.6 d -60.7 220°C/120min 93.2±3.5 e -70.5 8.3±0.6 g -55.1 2.0±0.4 e -78.0 15.9±0.3 e -75.7 Temperature n.s. * n.s. * time n.s. * n.s. n.s. Temperature x time *** *** *** ***
Table 14. Correlation matrix between chemical properties of Extra Virgin Olive Oil before and after heating. Free Acidity Peroxide Value p-Anisidine Value TOTOX K232 K270 ΔK Total Phenolic Content Total Tocopherol Content ABTS assay DPPH oil assay DPPH hydro assay ORAC assay Free Acidity 1 Peroxide Value 0.7212 1 p-Anisidine Value 0.9175 0.8327 1 TOTOX 0.8782 0.9339 0.9756 1 K232 0.6966 0.8660 0.8148 0.8692 1 K270 0.8467 0.9097 0.9605 0.9806 0.8886 1 ΔK 0.7308 0.9246 0.8663 0.9257 0.8266 0.9370 1
Total Phenolic Content -0.4955 -0.7815 -0.6420 -0.7242 -0.7787 -0.8193 -0.8114 1
Total Tocopherol Content -0.5516 -0.7862 -0.6825 -0.7522 -0.7590 -0.8258 -0.8059 0.9712 1
ABTS assay -0.6686 -0.9000 -0.8187 -0.8852 -0.8964 -0.9337 -0.8946 0.9420 0.9358 1
DPPH oil assay -0.8067 -0.9410 -0.9067 -0.9583 -0.9017 -0.9751 -0.9476 0.8231 0.8071 0.9180 1
DPPH hydro assay -0.6740 -0.8832 -0.8162 -0.8770 -0.8895 -0.9377 -0.8989 0.9457 0.9151 0.9824 0.9277 1
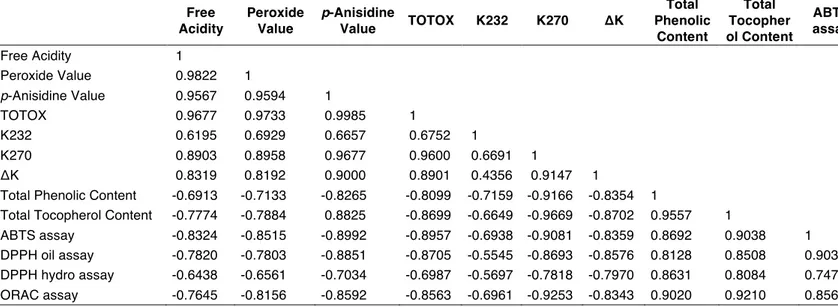
Table 15. Correlation matrix between chemical properties of Pomace Olive Oil before and after heating. Free Acidity Peroxide Value p-Anisidine Value TOTOX K232 K270 ΔK Total Phenolic Content Total Tocopher ol Content ABTS assay DPPH oil assay DPPH hydro assay ORAC assay Free Acidity 1 Peroxide Value 0.9822 1 p-Anisidine Value 0.9567 0.9594 1 TOTOX 0.9677 0.9733 0.9985 1 K232 0.6195 0.6929 0.6657 0.6752 1 K270 0.8903 0.8958 0.9677 0.9600 0.6691 1 ΔK 0.8319 0.8192 0.9000 0.8901 0.4356 0.9147 1
Total Phenolic Content -0.6913 -0.7133 -0.8265 -0.8099 -0.7159 -0.9166 -0.8354 1
Total Tocopherol Content -0.7774 -0.7884 0.8825 -0.8699 -0.6649 -0.9669 -0.8702 0.9557 1
ABTS assay -0.8324 -0.8515 -0.8992 -0.8957 -0.6938 -0.9081 -0.8359 0.8692 0.9038 1
DPPH oil assay -0.7820 -0.7803 -0.8851 -0.8705 -0.5545 -0.8693 -0.8576 0.8128 0.8508 0.9036 1
DPPH hydro assay -0.6438 -0.6561 -0.7034 -0.6987 -0.5697 -0.7818 -0.7970 0.8631 0.8084 0.7472 0.6855 1
ORAC assay -0.7645 -0.8156 -0.8592 -0.8563 -0.6961 -0.9253 -0.8343 0.9020 0.9210 0.8563 0.7379 0.7645 1
Table 16. Correlation matrix between chemical properties of Soybean Oil before and after heating. Free Acidity Peroxid e Value p-Anisidine Value TOTOX K232 K270 ΔK Total Phenolic Content Total Tocophero l Content ABTS assay DPPH oil assay DPPH hydro assay ORAC assay Free Acidity 1 Peroxide Value 0.8486 1 p-Anisidine Value 0.7634 0.9021 1 TOTOX 0.7834 0.9254 0.9984 1 K232 0.7388 0.8092 0.6786 0.7037 1 K270 0.7403 0.8763 0.8545 0.8672 0.6972 1 ΔK 0.6422 0.8081 0.7969 0.8075 0.6311 0.9588 1
Total Phenolic Content -0.7696 -0.9082 -0.9027 -0.9137 -0.7510 -0.9094 -0.8266 1
Total Tocopherol Content -0.8382 -0.9883 -0.8815 -0.9057 -0.7950 -0.8478 -0.8057 0.8532 1
ABTS assay -0.7822 -0.8473 -0.7025 -0.7297 -0.7304 -0.7681 -0.7315 0.8641 0.8297 1
DPPH oil assay -0.8372 -0.9456 -0.8172 -0.8436 -0.7957 -0.8273 -0.7721 0.9095 0.9295 0.9649 1
Table 17. Correlation matrix between chemical properties of Palm Oil before and after heating. Free Acidity Peroxid e Value p-Anisidine Value TOTOX K232 K270 ΔK Total Phenolic Content Total Tocopherol Content ABTS assay DPPH oil assay DPPH hydro assay ORAC assay Free Acidity 1 Peroxide Value 0.8886 1 p-Anisidine Value 0.8193 0.8009 1 TOTOX 0.8656 0.8769 0.9901 1 K232 0.7557 0.8806 0.7031 0.7704 1 K270 0.8501 0.8485 0.9605 0.9695 0.7227 1 ΔK 0.7400 0.7391 0.8894 0.8869 0.5450 0.9507 1
Total Phenolic Content -0.8787 -0.8762 -0.8904 -0.9198 -0.7836 -0.9019 -0.7545 1
Total Tocopherol Content -0.8819 -0.8447 -0.9343 -0.9476 -0.6783 -0.9243 -0.8087 0.9611 1
ABTS assay -0.8357 -0.9083 -0.8202 -0.8709 -0.9062 -0.8264 -0.6571 0.9163 0.8552 1
DPPH oil assay -0.8569 -0.8765 -0.9411 -0.9605 -0.7405 -0.9787 -0.9373 0.8628 0.8971 0.8137 1
DPPH hydro assay -0.8470 -0.9208 -0.9016 -0.9392 -0.8087 -0.8897 -0.7764 0.8892 0.9081 0.9053 0.9203 1
3.12.2 Peroxide value
The two-way ANOVA analysis showed that in all the studied oils, the PV increase was not significantly influenced by temperature but was always very highly significantly influenced by the interaction between temperature and time (Table 2). PV was found to be very good and positively correlated with K270: 0.9097 EVOO, 0.8958 PO, 0.8763 SO and 0.8485 P, whereas a very high and negative correlation was found with AA-ABTS: -0.9000 EVOO, -0.8515 PO, -0.8473 SO and -0.9083 P (Tables 14-17).
3.12.3 p-Anisidine value
The one-way ANOVA analysis showed that very highly significant differences exist in all the studied oils between treatments. The two-way ANOVA analysis showed that in all the studied oils, the p-AnV increase was not significantly influenced by temperature or by time of heating but it was always very highly significantly influenced by the interaction between temperature and time (Table 3). In the three rectified oils, p-AnV was found to have negative and good or very good correlation with the parameters indicating antioxidant activity. In PO, p-AnV was found to be correlated with PV (0.9594), with TOTOX (0.9985) and with K270 0.9677). In SO, p-AnV was found to be correlated with PV (0.9021), with TOTOX (0.9984) and with total phenolic content (0.9027). In P, p-AnV was found to be correlated with TOTOX (0.9901), with K270 (0.9605) and with AA-DPPH Oil 0.9411). In EVOO, a negative and very good correlation was found with ABTS assay (-0.8187), AA-DPPH-oil (-0.9067), AA-DPPH Hydro (-0.8162), (Tables 14-17).
3.12.4 TOTOX
The one-way ANOVA analysis showed very high significant differences between treatments. The two-way ANOVA analysis showed that in all the studied oils, the TOTOX variation was not significantly influenced by temperature or by time of heating but it was always very highly significantly influenced by the interaction between temperature and time (Table 4), according to two-way ANOVA results of p-AnV (Table 3). TOTOX showed a very good positive correlation with K270: 0.9806 in EVOO, 0.9600 in PO, 0.8672 in SO and 0.9695 in P (Tables 14-17).
3.12.5 K232
The two-way ANOVA demonstrated that K232 was not significantly affected by temperature in all oils, whereas the interaction between temperature and heating duration influenced very highly significantly (p < 0.001) EVOO and P (Table 5).
A low correlation with ∆K in all the rectified oils was found in K232: 0.4356 in PO, 0.6311 in SO and 0.5450 in P whereas K232 had a good correlation with ∆K in EVOO (Tables 14-17).
3.12.6 K270
Two-way ANOVA demonstrated that K270 was not influenced by temperature and heating duration in all the four studied oils, whereas a very high significant influence was found in the interaction between the two variables (Table 6).
Both K270 and p-AnV are used as indices to indicate a prolonged oxidation. K270 was found to be very well correlated with p-AnV in EVOO (0.9605), in PO (0.9677), in SO
3.12.7 ∆K
The one-way ANOVA analysis showed very high significant differences between treatments in all the four studied oils (p < 0.001). The two-way ANOVA analysis showed EVOO as the most influenced by heating duration and by the temperatures p < 0.05 for both the applied variables, whereas P was very highly significantly influenced (p < 0.001) by the interaction between the two treatments (Table 7). ∆K was found to have a very good correlation with K270 and the highest correlations were in the two seed oils: 0.9588 in SO and 0.9507 in P (Tables 14-17).
3.12.8 Total phenolic content
The one-way ANOVA analysis showed very highly significant differences between treatments. The two-way ANOVA analysis showed a different situation for each oil. EVOO was not influenced by temperature and by time, but it was very highly significantly influenced by their interaction. PO was very highly significantly influenced by temperature and by time (p < 0.001), but their interaction was not significant. The total phenolic content in SO was not influenced by time but was significantly influenced by temperature (p < 0.05) and very highly significantly influenced by their interaction (p < 0.001). In P, the interaction between time and temperature had no significant effect whereas temperature and time caused a highly significant effect (p < 0.01). Total phenolic content showed a negative very good correlation with K270 in EVOO 0.8193), in PO (-0.9166), in SO (-0.9094) and in P (-0.9019), (Tables 14-17).
3.12.9 Total tocopherol content
One-way ANOVA analysis showed a very high significant lowering (p < 0.001) of the total tocopherol content during heating both at 180 and 220°C. The greatest lowering effect was produced at 220°C with a reduction accounting for -79.5% (EVOO), -72.5% (PO), -73.1% (S) and -63.4% (P) after 120 min of heating treatment (Table 9). The two-way ANOVA experiment demonstrated very high significant differences by the combined effects of temperature x time in all the four studied oils and not significant differences if only the temperature effect was considered (Table 9). A very good positive correlation (minimum 0.8532 in S) was always found with the total phenolic content and with the ORAC assay (minimum 0.8246 in P), (Tables 14-17).
3.12.10 Antioxidant Activity (ABTS assay)
The one-way ANOVA analysis showed very highly significant differences between treatments (p < 0.001). The two-way ANOVA analysis showed that in all the studied oils, the temperature significantly influenced the ABTS-AA (p < 0.05). Time of heating significantly influenced the ABTS-AA in all oils except in PO in which the significance was 0.057. The interaction between the two studied variables was not significant in all the studied oils except in EVOO in which a highly significant effect (p < 0.01) was found (Table 10).
ABTS-AA showed a negative very good correlation with PV in EVOO 0.9000), in PO (-0.8515), in SO (-0.8473) and in P (-0.9083) and a positive very good correlation with total phenolic content: 0.9420 in EVOO, 0.8692 in PO, 0.8641 in SO and 0.9163 in P (Tables 14-17).
3.12.11 Antioxidant Activity (DPPH hydrophilic assay)
The one-way ANOVA analysis showed very highly significant differences between treatments (p < 0.001) in all oils except in PO in which a highly significant difference was found (p < 0.01). The two-way ANOVA analysis showed that temperature caused no significant difference in SO and P, in PO the significance was 0.053 and in EVOO the temperature caused significant differences (p < 0.05). The interaction between temperature and time caused no significant differences in the treatments of PO, whereas in the other oils the significance was p < 0.05 for P, p < 0.01 for EVOO and p < 0.001 for SO (Table 11). 3.12.12 Antioxidant Activity (DPPH oil assay)
One-way ANOVA evidenced very highly significant differences between samples (p < 0.001), (Table 12). Two-way ANOVA showed that the interaction between time and temperature influenced the AA-DPPH-oil as follows: EVOO (p < 0.05), SO (p < 0.01), PO and P (p < 0.001). No significant effect resulted from the temperature treatment in S and P, the same was for the time treatment in PO (Table 13).
3.12.13 Antioxidant Activity (ORAC assay)
The one-way ANOVA analysis showed very highly significant differences between treatments (p < 0.001) in all oils. The two-way ANOVA analysis showed that temperature caused no significant effect in EVOO and SO, whereas in PO and P a significant effect was found (p< 0.05). The time of heating showed no significant effect on EVOO, SO and P. The interaction between temperature and time of heating caused very highly significant effects (p < 0.001) in all the studied oils (Table 13).
ORAC assay showed the highest positive correlation with total phenolic content in EVOO (0.9658) and in PO (0.9020), (Tables 14-15). In SO the highest positive correlation was found with AA-DPPH-oil (0.9489), whereas ABTS was the highest correlated in P (0.8823), (Tables 16-17). The correlation between ORAC values and phenolic content was also studied by Ninfali et al. (2001) who found a positive correlation (R = 0.78925) by analyzing commercially available EVOOs.
4. CONCLUSIONS
The findings of this work suggest how to manage temperatures and heating duration during cooking with an extra virgin olive oil, a pomace olive oil, a soybean oil and a palm oil. The four studied vegetable oils showed four different behaviours in relation to temperature and heating duration. Extra virgin olive oil and palm oil showed the best performances in term of resistance to oxidation. All the heated oils showed a reduction in antioxidant activity when compared to control (unheated oil). A lower antioxidant activity was found in the heated oils because phenols and, in general, the antioxidants are destroyed during heating. The best cooking temperature was found to be at 180°C, which caused the lowest oil deterioration, as well as being less expensive if compared to 220°C. When extra virgin olive oil, pomace olive oil, soybean oil and palm oil are heated at 180°C they can be re-used for 120 minutes but if the heating temperature is 220°C, the suggested maximum time of use must be reduced to 60 minutes.
ACKNOWLEDGEMENTS
This research was supported by PON03PE_00090_1 fund: ‛Process and product innovations in baked products and confectionary food chain’.
REFERENCES
Ahmad Tarmizi A.H. and Ismail R. 2014. Use of pilot plant scale continuous fryer to simulate industrial production of potato chips: thermal properties of palm olein blends under continuous frying conditions. Food Science & Nutrition 2:28. Azimah R., Azrina A. and Khoo H. E. 2017. Stability of blended palm oils during potato frying Int. Food Res. J. 24: 2122. Aydenız B. and Yilmaz E. 2016. Performance of different natural antioxidant compounds in frying oil. Food Technol. Biotechnol. 54:21.
Bulut E. and Yilmaz E. 2010. Comparison of the frying stability of sunflower and refined olive pomace oils with/without adsorbent treatment. J. Am. Oil Chem. Soc. 87: 1145.
Boskou D. 2015. Mediterranean diet food: strategies to preserve a healthy tradition. Journal of Experimental Food Chemistry 1:1.
Brand-Williams W., Cuvelier M.E. and Berset C. 1995. Use of a free radical method to evaluate antioxidant activity. Food Sci. Technol.-Leb. 28:25.
Calvo P., Castaño Á.L., Lozano M. and González–Gómez D. 2012. Influence of the microencapsulation on the quality parameters and shelf-life of extra-virgin olive oil encapsulated in the presence of BHT and different capsule wall components. Food Res. Int. 45:256.
Cao G.H., Alessio H. and Cutler R.G. 1993. Oxygen-radical absorbance capacity assay for antioxidants. Free Radical Bio. Med. 14:303.
COC (2015). Committee on Carcinogenicity of Chemicals in Food, Consumer Products and the Environment (COC). Statement CC/2015/S1. Available on line. Accessed on 16th April 2018.
www.assets.publishing.service.gov.uk/government/uploads/system/uploads/attachment_data/file/446655/CC-2015-S1_Vitamin_E_and_the_risk_of_prostate_cancer_statement_FINAL.pdf
Codex Stan, (2013). Codex standard for named vegetable oils. CODEX-STAN 210 (Amendment 2005, 2011, 2013), (access on 5 January 2017).
Consleg, (2015). 1991R2568-EN-01.01.2015-027.001, on the characteristics of olive oil and olive-residue oil and on the relevant methods of analysis, Annexes II, III, IX, X-A, XVI.
Endo Y., Ohta A., Kido H., Kuriyama M., Sakaguchi Y., Takebayashi S., Hirai H., Murakami C. and Wada S. 2011. Determination of triacylglycerol composition in vegetable oils using high-performance liquid chromatography: a collaborative study. J. Oleo Sci. 60:451.
Espín J.C. and Soler-Rivas H.J. 2000. Wichers: Characterization of the total free radical scavenger capacity of vegetable oils and oil fractions using 2,2-diphenyl-1-picrylhydazyl radical. J. Agr. Food Chem. 48:648.
Evans J.C., Kodali D.R. and Addis P.B. 2002. Optimal tocopherol concentrations to inhibit soybean oil oxidation. J Am. Oil Chem. Soc. 79:47.
Fernández-Pachón M.S., Villaño D., Troncoso A.M. and Garcia-Parrilla M.C. 2005. Antioxidant capacity of plasma after red wine intake in human volunteers. J. Agr. Food Chem. 53:5024.
Gharby S., Harhar H., Matthäus B., Bouzoubaa Z. and Charrouf Z. 2016. The chemical parameters and oxidative resistance to heat treatmentof refined and extra virgin Moroccan Picholine olive oil. Journal of Taibah University for Science 10: 100.
Giuffrè A.M. 2013. Influence of cultivar and harvest year on triglyceride composition of olive oils produced in Calabria (Southern Italy). Eur. J. Lipid Sci. Technol. 115:928.
Giuffrè A.M. 2014. Variation in triacylglycerols of olive oils produced in Calabria (Southern Italy) during olive ripening. Riv. Ital. Sostanze Gr. 91:221.
Giuffrè A.M., Zappia C. and Capocasale M. 2017a. Tomato seed oil: a comparison of extraction systems and solvents on its biodiesel and edible properties. Riv. Ital. Sostanze Gr. 94:149.