1
Sustainable business models for sustainable
decision making: an application to reusing
offshore gas platforms in the Adriatic Sea
Fabio Zagonari
Dipartimento di Scienze per la Qualità della Vita, Università di Bologna
C.so d’Augusto 237, 47921 Rimini (Italy), Phone: 0039 0541 434135, Fax: 0039 0541 434120 Email: [email protected], ORCID: 0000-0002-9872-8731
Sami Ouechtati
Research Fellow, Dipartimento di Scienze per la Qualità della Vita, Università di Bologna
February 2021
Abstract
This paper suggests an empirical methodology to use theoretical Sustainable Business Models (SBMs) in making sustainable (i.e., participatory decisions involving economic, social and environmental features) and rational (i.e., informed and consistent) decisions with respect to what, who, where, when, and how to do. The case study, focused on alternative reuses of offshore gas platforms (i.e., a complicated case due to the absence of previous stakeholders’ experiences at local and national level), identified when (i.e., the end as opposed to the beginning of extraction activities) and where (i.e., the economic, social and environmental contexts of the Adriatic Sea in Abruzzo region, Italy). A questionnaire, submitted to stakeholders, produced the relative weights required by the tested SBM (i.e., a comprehensive model recently proposed by Lüdeke-Freund et al., 2018); it reached a conclusion about how (i.e., in favour of majority decisions as opposed to representative decisions); and it highlighted a sample size issue (i.e., solved with a 50% increase of stakeholders involved). In summary, the methodology suggested in this paper applied to a comprehensive SBM for a complicated case study produced an empirical sustainable decision which is consistent with relative weights expressed by stakeholders. However, this decision is theoretically wrong, since eco-design (empirically correlated with the proper institutional approach for who) should have been preferred to circular economy (empirically correlated with the proper cooperative approach for who). In other words, information gaps about what (mainly due to an overemphasis put on social features) must be solved with additional meetings between experts and stakeholders.
Keywords
Sustainable business model, offshore gas and oil platforms, sustainable decision making
DOI
http://doi.org/10.6092/unibo/amsacta/6618
License
2
1.Introduction
Sustainable decision making requires the consideration of at least three dimensions (i.e., economic, social, and environmental features) (e.g., Grimmel et al., 2019) in a rational decision making methodology (i.e., substantive rationality, which focuses on the ethics of an action, or instrumental rationality, which focuses on whether the means can achieve the desired end, irrespective of the ethics of that means) (e.g., Bolis et al., 2017; Assuad, 2020) with a participatory approach (i.e., group decision making) (e.g., Ardebili and Padoano, 2020). Note that we disregard circular economy approaches, since they are still not defined and measured to be applied in sustainable decision making (Corona et al., 2019).
In traditional business models, firms create, deliver, and capture mere economic value, although business models have then suggested where value creation is outside the firm, with partners, suppliers, stakeholders and customers (Teece, 2010). Sustainable Business Models (SBM) have been theoretically defined as “business models that incorporate pro-active multi-stakeholder management, the creation of monetary and non-monetary value for a broad range of stakeholders, with a long-term perspective” (Geissdoerfer et al., 2018). Lüdeke-Freund et al. (2018) refer to the theory of patterns and practically define a SBM pattern as follows: “A SBM pattern describes an ecological, social, and/or economic problem that arises when an organisation aims to create value, and it describes the core of a solution to this problem that can be repeatedly applied in a multitude of ways, situations, contexts, and domains, by describing the design principles, value-creating activities, and their arrangements that are required to provide a useful problem–solution combination”. Note that considering value creation implies the focus on SBMs for weak sustainability (see Brozovic (2019) on SBMs for strong sustainability).
The the purpose of this paper is to suggest a methodology to make SBMs a theoretical framework to practically recommend what, who, when, where and how to do within sustainable decision making. In particular, we will refer to the SBM by Lüdeke-Freund et al. (2018) as a very comprehensive framework for a synthesis of the SBM literature, with a stronger orientation towards sustainability issues; and to decisions on alternative reuses of offshore gas platforms at the end of the extraction period, by using a case study in the Adriatic Sea, since this decision involves economic, social, and environmental aspects (Abhinav et al., 2020).
Note that we will disregard the Business Model Canvas for sustainability, since they are empirically similar to the SBM by Lüdeke-Freund et al. (2018), although in multi-dimensional frameworks (e.g., Cardeal et al., 2020; Joyce and Paquin, 2016); we will neglect SBM innovation, since reuse is a new business (Shakeel at al., 2020; Velter et al., 2020); and we will disregard circular Business Models, since the decision on alternative reuses is taken after the extraction period (Geissdoerfer et al., 2020; Lewandowski, 2016). Moreover, why to do is required by national and international laws and regulations (Fam et al., 2018) in many countries where a huge number of end-of-life gas and oil offshore platforms must be either decommissioned or reused. Finally, alternative decisions could have been analysed (e.g., decommissioning in Burdon et al. (2018) and Na et al. (2017); decommissioning vs. reuse in Bernstein (2015) and Kolian et al. (2019); or partial vs. complete decommissioning in Bressler and Bernstein (2015) and Sedlar et al. (2019)), but the decision on reuse vs. partial or complete decommissioning is an ethical rather than a business decision (Zagonari, 2021).
2. The theoretical framework
Lüdeke-Freund et al. (2018) identify 45 SBM patterns, arranged into 11 groups (i.e., Pricing & Revenue Patterns, Financing Patterns, Eco-design Patterns, Closing-the-Loop Patterns, Supply Chain Patterns, Giving Patterns, Access Provision Patterns, Social Mission Patterns, Service & Performance Patterns, Cooperative Patterns, Community Platform Patterns) and put into relation to 10 different forms of value creations (i.e., from a to j) (Figure 1). These 11 groups are related to a particular form of value creation, as long as the authors used a sustainability triangle to categorise
3
sustainability problem–solution combinations. The sustainability triangle is divided into ten areas that address ten different forms of value creation to which the pattern groups can be associated with.
Figure 1. The sustainable business model pattern taxonomy at the group level. Lüdeke-Freund et al. (2018).
In particular, we will apply the SBM by Lüdeke-Freund et al. (2018) with the following specifications:
Closing the loop will be assumed to refer to a circular economy as opposed to a linear economy
The sustainability triangle will be considered a 3-dimension simplex to represent the relative weights attached to economic (weco) , social (wsoc) and environmental (wenv) features (i.e., weco
+ wsoc + wenv = 1)
Community platform will be assumed to refer to the involvement of public institutions as opposed to cooperative, where most actors are private
A methodological remark is needed here: some options (i.e., 1 and 2, 3 and 4, 6 and 8) are very close in the 3-dimension simplex.
3. The case study
This section will describe the variables that define the benefits and costs for a specific context: a case study of an offshore gas platform in the Adriatic Sea at ca. 18.5 km from Pineto d’Abruzzo in Teramo Province, in the Abruzzo region of Italy. Thus, in meetings with stakeholders, we will refer to Abruzzo as the relevant region. Note that the large distance from the coast suggests that impacts on the coastline can be disregarded. However, the offshore platform is close to a marine protected area, Torre del Cerrano, which has been classified as a natural site of EU interest. Consequently, in meetings with stakeholders, we will refer to economic and social data from the Abruzzo region and ecological data from the Torre del Cerrano marine protected area to discuss positive and negative impacts as well as benefits and costs of reuse vs. decommissioning.
4
The following issues are relevant for reuse (i.e., a partial decommissioning with carbonate coating of the original structure for tourism activities combined with additional structures for wave energy and mariculture activities):
the economic investment for carbonate coating to protect offshore platforms from corrosion (i.e., a technology that uses low voltage electrolysis of seawater for mineral accretion around artificial structures), and for mariculture and wave energy structures (Bull & Love, 2019)
the economic operating and maintenance cost for wave energy, mariculture and tourism activities
the economic revenues from mariculture and tourism activities (Kruse et al. 2015)
the social costs due to aesthetic worsening of seascape (Cantle & Bernstein, 2015) and interference with navigation
the social benefits from employment in partial decommissioning as well as in mariculture and tourism activities together with ecological monitoring (Wang et al., 2018)
the environmental costs due to air and water pollution caused by partial decommissioning and tourism activities, impacts on the sea bed (Spagnolo et al., 2014), diffusion of jellyfish (Vodopivec et al., 2017), and noise impacts on avian and mammal species (Mangano and Sarà, 2017)
the environmental benefits due to reduction of illegal fisheries and the increased biodiversity (Sommer et al., 2019)
Note that risk reduction from carbonate coating of offshore platforms is not a social benefit, since it is essential for tourism activities. Moreover, in meetings with stakeholders, we provided a picture of the offshore gas platform as it is now (at the end of the gas extraction process) and a layout of the offshore gas platform as it would be in the future (if reuse is implemented). Finally, the reduction of CO2 emission permitted by the generation of wave energy is not an environmental benefit, since
waves are the most feasible energy source for mariculture.
The questionnaire submitted to stakeholders (see Appendix) depicts the decision on decommissioning vs. reuse of an offshore platforms at the end of the gas extraction process (i.e., we neglect a life-cycle assessment which systematically analyses the full range of effects associated with all stage - from creation to disposal - of a product’s life), by referring to positive and negative impacts (i.e., we neglect a cost-benefit analysis which applies a systematic set of rules for comparing economic benefits and costs - expressed in monetary terms - of alternative potential interventions to maximize social welfare).
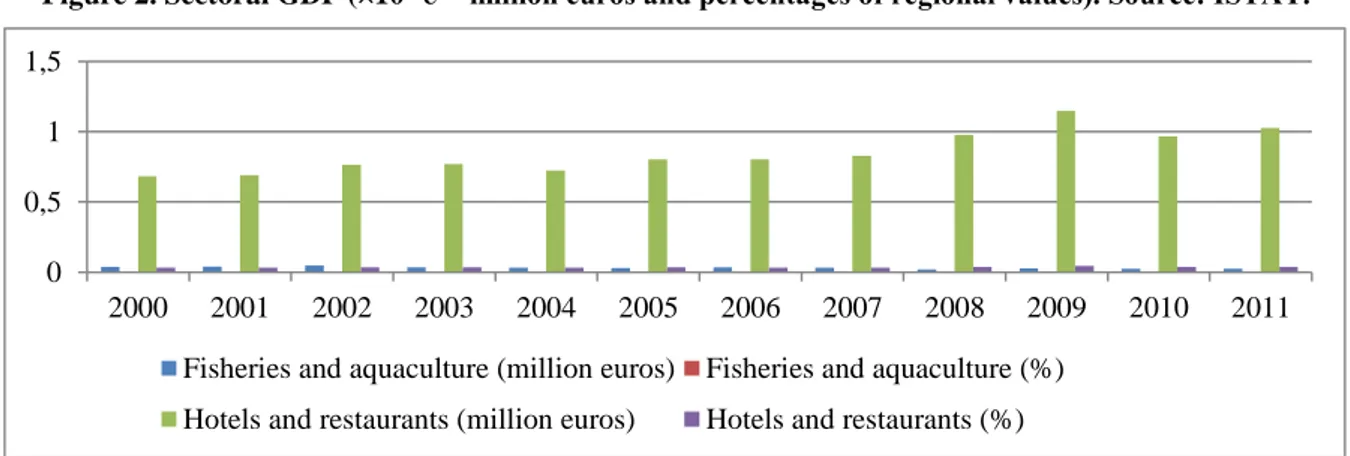
Figure 2, presented to stakeholders during the first meeting as related to questions 8 and 28, depicts GDP data from official statistics for Abruzzo from 2000 to 2011 in the sectors that would potentially be involved in reuse. Note that fisheries and aquaculture represent a small proportion of regional GDP, although tourism achieves GDP levels of around 1×10⁶ euros.
Figure 2. Sectoral GDP (×106 € = million euros and percentages of regional values). Source: ISTAT.
Moreover, Figure 3, presented to stakeholders during the first meeting as related to question 12, shows employment for Abruzzo from 2000 to 2011 in the sectors potentially involved in reuse.
0 0,5 1 1,5
2000 2001 2002 2003 2004 2005 2006 2007 2008 2009 2010 2011 Fisheries and aquaculture (million euros) Fisheries and aquaculture (%)
5
Note that fisheries and aquaculture represent a small proportion of regional employment, whereas tourism achieves employment levels of around 20 000.
Figure 3. Sectoral employment (×103 = thousands people and percentages of regional values). Source: ISTAT
Finally, Table 1, presented to stakeholders during the first meeting as related to questions 17 and 20, depicts the main ecological data for the marine protected area of Torre del Cerrano. Note that
Sabellaria halcocki has a high value for biodiversity, since it is a rare species along the Italian coast
and is unique to the Adriatic Sea.
Table 1. Species identified in article 4 of Directive 2009/147/EC and described in Annexes II and IV of Directive 92/43/EEC. Species groups: B = birds, I = invertebrates, M = mammals, R = reptiles. Population periods: r =
during reproduction, w = in winter, p = permanent. Population categories: V = very rare, P = present. Motivation categories: C = International Conventions; O = other reasons. Source: Torre del Cerrano.
Species Population Motivation Group Scientific Name Period Category Annex Other reasons
B Charadrius alexandrinus r II B Charadrius alexandrinus w II B Charadrius alexandrinus p P II I Ampelisca rubella P O I Balanus sp. P O I Ericthonius punctatus P O I Eriphia spiniformis P O I Gammarus credula P O I Hymedesmia peachii P O I Ischyorocerus inexpectatus P O I Liljeborgia dellavallei P O I Maera grossimana P O I Metaphoxus simplex P O I Nassarius incrassatus P O I Pachigrapsus marmoratus P O I Prosuberites epiphitum P O I Stenothoe cavimana P O I Sycon sp. P O M Tursiops truncatus p V II M Balaenoptera physalus P IV M Delphinus delphis P IV M Stenella coeruleoalba P IV R Caretta caretta r V II R Chelonia mydas P C
The questionnaire applied well established procedures (Zagonari, 2016) to estimate the relative concerns for economic, social and environmental features.
The main characteristics of the 22 stakeholders involved in the first (real) meeting in Pescara (Italy) on 24th January 2020 can be summarised as follows: 18 male and 4 female; 1 below 26 years old, 2
0 10 20 30
2000 2001 2002 2003 2004 2005 2006 2007 2008 2009 2010 2011 Fisheries and aquaculture (thousand people) Fisheries and aquaculture (%)
6
between 26 and 35 years old, 5 between 36 and 50 years old, 12 between 51 and 60 years old, and 2 above 61 years old; 6 with an higher education degree, 9 with a bachelor degree, 4 with a master degree, and 3 with a doctoral degree; 8 employed in public services, 8 employed in private firms, 2 employed in environmental organisations, and 4 in other jobs. Note that the sample of stakeholders is deliberately chosen so small to check for the effectiveness of the suggested methodology in saving time and money required to involve large numbers of stakeholders.
The case study suggests to disregard as irrelevant the options 5 to 8 of the SBM by Lüdeke-Freund et al. (2018). In particular, the estimated relative weights (i.e., 30, 28, 42 for economic, social and environmental features, respectively) suggest that the theoretical choice should be 3 over 4 about
what options, and 11 over 10 about who options. Indeed, Zagonari (2021) showed that reusing
should be preferred to decommissioning within a linear economic rather than a circular economy (i.e., 3 is better than 4) and that reusing vs. decommissioning is an inter-generational equity issues which requires laws and regulations (i.e., 11 is better than 10).
4. The empirical results
In order to identify the sustainable and rational decision practically suggested by the 22 involved stakeholders, we linked each answer to each point in the questionnaire to options from 1 to 4 and option 9 about the what options, and options 10 and 11 about who options (see Appendix). In particular, we will adopt two main perspectives about how: the stakeholder representative perspective, where we calculate the average of responses, under the assumption that the characterisation of stakeholders is unimodal and symmetric; the majority stakeholder perspective, where we calculate the votes that each option would obtain, under that assumption that each stakeholder votes his/her most preferred option. In other words, we refer to group decisions on which use should be chosen (see Herghiligiu et al. (2019) on SBM for management choices). The comparison of the theoretical and empirical choices highlights possible information gaps. Table 2 presents the empirical choices.
Table 2. The empirical choices by the 22 stakeholders (percentages).
What 1 What 2 What 3 What 4 What 9 Who 10 Who 11 Representative stakeholder 51 38 44 50 40 44 33
Stakeholders’ votes 25 0 20 36 18 59 41
Thus, the ranking of options in terms of the representative stakeholder is 1 ~ 4 > 3 > 9 > 2 for what options and 10 > 11 for who options, whereas the ranking of options in terms of the stakeholders’ votes is 4 > 1 > 3 ~ 9 > 2 for what options and 10 > 11 for who options. Therefore, the SBM should be applied by using stakeholders’ votes.
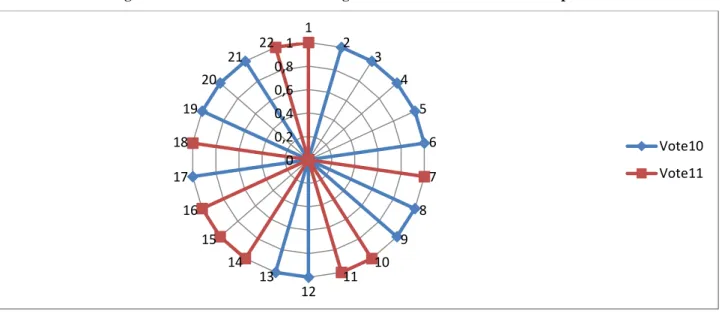
Figures 4 and 5 represent the distribution of scores among the 22 stakeholders for the what and who options, respectively, whereas Figures 6 and 7 represent the distribution of votes among the 22 stakeholders for the what and who options, respectively.
Note that the variance of scores for option what 3 is smaller than for option what 4 (i.e., 0.08 < 0.11). Next, in terms of scores, option what 4 is correlated with option who 11 to a greater extent than with option who 10 (i.e., 0.42 > 0.13) (Table 3).
However, in terms of votes, option what 3 is correlated with option who 11 to a greater extent than option what 4 (i.e., 0.17 > 0.05) (Table 4). Next, there is no uncertainty about the who options, while there is uncertainty about the what option (i.e., the same score for options what 3 and 4 by stakeholders 6 and 10; the same score for option what 1 and 3 for stakeholder 9).
Therefore, the following three issues are identified: 1. option what 1 is preferred to option what 3 2. option who 10 is preferred to option who 11
3. there is no correlation between what option 4 and who option 10.
We enlarged the sample by involving 11 additional stakeholders (i.e., an increase by 50% from 22 to 33 stakeholders) to check if these issues are due to the sample size.
7
Figure 4. Distribution of scores among the 22 stakeholders on the what options.
Figure 5. Distribution of scores among the 22 stakeholders on the who options.
Figure 6. Distribution of votes among the 22 stakeholders on the what options. 0,00 0,20 0,40 0,60 0,80 1,00 1 2 3 4 5 6 7 8 9 10 11 12 13 14 15 16 17 18 19 20 21 22 What1 What2 What3 What4 What9 0,00 0,20 0,40 0,60 0,80 1,00 1 2 3 4 5 6 7 8 9 10 11 12 13 14 15 16 17 18 19 20 21 22 Who10 Who11 0 0,2 0,4 0,6 0,8 1 1 2 3 4 5 6 7 8 9 10 11 12 13 14 15 16 17 18 19 20 21 22 Vote1 Vote2 Vote3 Vote4 Vote9
8
Figure 7. Distribution of votes among the 22 stakeholders on the who options.
Table 3. Correlations of scores by the 22 stakeholders. Underlined = uncertainty between alternative what options; italics = inconsistency between what and who options; bold = consistency between what and who options.
What2 What3 What4 What9 Who10 Who11 What1 -0.23 0.60 -0.16 -0.24 -0.08 -0.10 What2 1 -0.11 -0.09 0.26 0.33 0.14 What3 1 -0.45 -0.42 -0.37 -0.29 What4 1 -0.23 0.13 0.42 What9 1 0.34 0.33 Who10 1 0.35
Table 4. Correlations of votes by the 22 stakeholders. Italics = inconsistency between what and who options; bold = consistency between what and who options.
What2 What3 What4 What9 Who10 Who11 What1 na -0.26 -0.47 -0.28 -0.17 0.17 What2 na na na na na na What3 1 -0.32 -0.27 -0.17 0.17 What4 1 -0.38 -0.05 0.05 What9 1 0.39 -0.39 Who10 1 -1
The relative weights for 33 stakeholders are similar (i.e., 31, 24, 44 for economic, social and environmental features, respectively) and consequently the theoretical choice is the same (i.e., 3 > 4 and 11 > 10). Table 5 presents the empirical choices.
Table 5. The empirical choices by the 33 stakeholders (percentages).
What 1 What 2 What 3 What 4 What 9 Who 10 Who 11 Representative stakeholder 44 36 43 51 43 42 36
Stakeholders’ votes 20 3 24 38 15 55 45
Thus, the ranking of options in terms of the representative stakeholder is 4 > 1 ~ 3 = 9 > 2 for what options and 10 > 11 for who options, whereas the ranking of options in terms of the stakeholders’ votes is 4 > 3 > 1 > 9 > 2 for what options and 10 > 11 for who options. Therefore, the first issue highlighted above (i.e., option what 1 being preferred to option what 3) has been solved by referring to a larger sample. 0 0,2 0,4 0,6 0,8 1 1 2 3 4 5 6 7 8 9 10 11 12 13 14 15 16 17 18 19 20 21 22 Vote10 Vote11
9
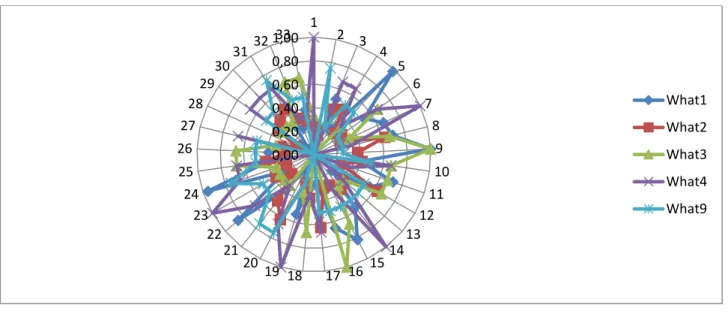
Figures 8 and 9 represent the distribution of scores among the 33 stakeholders for the what and who options, respectively, whereas Figures 10 and 11 represent the distribution of votes among the 33 stakeholders for the what and who options, respectively.
Note that the variance of scores for option what 3 is still smaller than for option what 4 (i.e., 0.07 < 0.10). Next, in terms of scores, option what 4 is correlated with option who 11 to a greater extent than with option who 10 (i.e., 0.37 > 0.24) (Table 6).
However, in terms of votes, option what 3 is correlated with option who 11 and option what 4 is correlated with option who 10 (Table 7). Next, there is no uncertainty about the who options, while there is uncertainty about the what option (i.e., the same score for options what 3 and 4 by stakeholders 6, 10 and 25; the same score for option what 1 and 3 for stakeholder 9).
Therefore, the third issue highlighted above (i.e., there is no correlation between what option 4 and
who option 10) has been solved by referring to a larger sample.
However, an information gap is still relevant, since 4 is preferred to 3 and 10 is preferred to 11 (i.e., the social features are over weighted): an additional meeting between stakeholders and experts seem to be needed to discuss some specific issues.
Figure 8. Distribution of scores among the 33 stakeholders on the what options.
Figure 9. Distribution of scores among the 33 stakeholders on the who options. 0,00 0,20 0,40 0,60 0,80 1,00 1 2 3 4 5 6 7 8 9 10 11 12 13 14 15 16 17 18 19 20 21 22 23 24 25 26 27 28 29 3031 32 33 What1 What2 What3 What4 What9 0,00 0,20 0,40 0,60 0,80 1,00 1 2 3 4 5 6 7 8 9 10 11 12 13 14 15 16 17 18 19 20 21 22 23 24 25 26 27 28 29 3031 32 33 Who10 Who11
10
Figure 10. Distribution of votes among the 33 stakeholders on the what options.
Figure 11. Distribution of votes among the 33 stakeholders on the who options.
Table 6. Correlations of scores by the 33 stakeholders. Underlined = uncertainty between alternative what options; italics = inconsistency between what and who options; bold = consistency between what and who options.
What2 What3 What4 What9 Who10 Who11 What1 -0.15 0.49 -0.08 -0.09 -0.06 -0.02 What2 1 -0.05 0.07 0.27 0.30 0.04 What3 1 -0.36 -0.23 -0.31 -0.12 What4 1 -0.01 0.24 0.37 What9 1 0.19 0.43 Who10 1 0.25
Table 7. Correlations of votes by the 33 stakeholders. Underlined = uncertainty between alternative what options; italics = inconsistency between what and who options; bold = consistency between what and who options.
What2 What3 What4 What9 Who10 Who11 What1 -0.09 -0.26 -0.42 -0.21 -0.16 0.16 What2 1 -0.11 -0.15 -0.07 0.16 -0.16 What3 1 -0.38 -0.26 -0.29 0.29 What4 1 -0.35 0.16 -0.16 What9 1 0.22 -0.22 Who10 1 -1 0 0,2 0,4 0,6 0,8 1 1 2 3 4 5 6 7 8 9 10 11 12 13 14 15 16 17 18 19 20 21 22 23 24 25 26 27 28 29 3031 32 33 Vote1 Vote2 Vote3 Vote4 Vote9 0 0,2 0,4 0,6 0,8 1 1 2 3 4 5 6 7 8 9 10 11 12 13 14 15 16 17 18 19 20 21 22 23 24 25 26 27 28 29 3031 32 33 Vote10 Vote11
11
In summary, the comprehensive SBM proposed by Lüdeke-Freund et al. (2018), combined with the methodology suggested in this paper, lead to an empirical sustainable decision for a complicated case (due to the absence of previous stakeholders’ experiences at local and national level) which is consistent with relative weights expressed by stakeholders. However, this decision is theoretically wrong, since option what 3 (empirically correlated with the proper option who 11) should have been preferred to option what 4 (empirically correlated with the proper option who 10).
Note that if all four indecisive stakeholders (i.e., the same scores attached to two options) removed their uncertainty in favour of option what 3, the choices in terms of votes would be 30% for option
what 3 and 33% for option what 4.
5. Discussion
In this paper we applied established procedures to estimate relative weights attached to economic, social and environmental features (Zagonari, 2016). We applied these relative weights to a comprehensive SBM (Lüdeke-Freund et al., 2018) to identify the theoretical choice consistent with stakeholders’ concerns. We attached an option to each answer of the questionnaire to identify potential biased, inconsistent or wrong decisions. We compared alternative perspectives in taking a collective decision. We checked for sample size issues.
The main results of this paper can be summarised as follows. An adequate (large) sample of involved stakeholders and a necessary involvement of experts enable to practically obtain sustainable and rational (majority) decisions within a theoretical framework provided by SBMs. The main weakness of the present study are the following:
we referred to a specified SBM. However, the theoretical framework by Lüdeke-Freund et al. (2018) includes all essential features of sustainable decision making
we focused on reuse. However, comparing decommissioning and reusing requires the preliminary identification of reuse options (Zagonari, 2021)
The main strengths of the present study are the following:
we provided a general methodology to highlight all problems related to sustainable and rational decisions (i.e., participation, economic, social and environmental features, coherence with concerns, information gaps)
we provided a simple methodology to solve these problems (i.e., majority, relative weights, 3-dimension simplex, involvement of experts)
In summary, we showed that majority decisions (as opposed to representative decisions) can avoid biased choices (i.e., option what 1 preferred to option what 3); a large sample (rather than a small sample) can avoid inconsistent choices (i.e., option what 4 uncorrelated with option who 10); additional meetings between experts and stakeholders can avoid wrong choices (i.e., option what 4 preferred to option what 3).
6. Conclusion
The purpose of this paper was to suggest an empirical methodology to make SBMs a theoretical framework which practically recommends what, who, when, where and how to do within sustainable decision making. The main result obtained in the present study is that a SBM might not be accurate in identifying the best choice. In particular, while when and where depended on the case study, we suggested the involvement of experts to solve information gaps (about what or who); a tight check for sample size issues to improve stakeholders’ representativeness; a perspective based on stakeholders’ votes (about how) to cope with multi-modal and asymmetric preferences.
In summary, in terms of votes rather than in terms of scores and for a large rather than for a small sample of stakeholders, we obtained the right correlation between option what 3 with option who 11 as well as between option what 4 with option who 10, without uncertainty about who options, but with an overemphasis on the cooperation approach as opposed to the institutional approach together with a preference for eco-design (although properly correlated with an institutional approach) over circular economy (although properly correlated with a cooperative approach).
12
Appendix
PART I
1. Which of the following activities, in your opinion, could be considered relevant as a value creation proposal in the process of converting an offshore platform? Select max 2 answers:
◻ Scientific / ecological application activities (artificial reefs, biodiversity hot spots and fish restocking sheltered from fishermen's nets and underwater paradise for underwater, naturalistic and sports tourism). [3]
◻ Productive activities in support of the Circular Economy and Blue Growth (e.g. marine culture or exploitation of renewable energies - off-shore wind-farm). [4]
◻ Environmental activities (environmental monitoring, maritime traffic control, etc.). [9]
◻ Tourist / recreational activities with high experiential content (hotel structures - temporary islands, activities related to underwater tourism and fishing). [1]
◻ Activities related to the construction of a regasification station. [2] ◻ Other (specify what)
2. Which of the following key partners, in your opinion, should play a key role in the conversion process of an offshore platform? Select max 3 answers:
◻ Ship-owners and naval cooperatives [10] ◻ Associations to protect the environment [11] ◻ Diving club [1]
◻ Region and municipalities [11] ◻ Chamber of commerce [1] ◻ Port authority [11]
◻ Zoo prophylactic Institute [11] ◻ University [11]
◻ Research centres [11]
◻ United Nations Convention [11]
◻ International Maritime Organization [11] ◻ Engineering company [2]
◻ Industrial Federation [2] ◻ Other
3. Which of the following key activities, in your opinion, are most important in the process of converting an offshore platform? Select max 3 answers:
◻ Redevelop the offshore structure [3] ◻ Protection of biodiversity [4] ◻ Creation of artificial reefs [9]
◻ Residential conversion of platforms [2] ◻ Encourage tourism in the area [1] ◻ Enhance local resources [9]
◻ Producing energy from renewable sources: photovoltaic systems, wind turbines, collectors of energy from waves [2]
4. Which of the following key resources, in your opinion, should play a key role in the process of converting an offshore platform? Select max 3 answers:
◻ Managerial [2] ◻ Regulations [11]
◻ Safeguarding marine flora and fauna [10] ◻ Policy making [11]
◻ Engineering [1] ◻ Others
5. What, in your opinion, should be the aim to be pursued in a process of converting an offshore platform, from the point of view of customer relations? Select max 1 answer:
◻ Ecology and sustainability [3]
◻ Building a culture that encourages change and innovation [9] ◻ Circular and shared economy [4]
◻ Other
6. In your opinion, what could potential customers be in a hypothesis of converting an offshore platform? Select max 2 answers:
◻ High spending people [2]
◻ People looking for a high experiential content [11] ◻ Athletes and sportsmen [1]
◻ Non-profit organizations and organizations [10] ◻ Other
13
7. The issue of the recovery of offshore platforms has become a key activity for the coming years: both in terms of environmental sustainability and potential source of revenues (in our seas there are currently 120 production platforms, 10 production support platforms and 9 non-operational platforms). How much do you agree with this statement? (on a scale of 1 to 7, where 1 corresponds to "strongly against" and 7 corresponds to "extremely agree"). [1] 8. When an offshore mining platform reaches the end of its production phase, can the alternatives be pursued, from a COST point of view, how do you evaluate the different hypotheses? [2]
Please provide an evaluation for each individual option: OPTION I
TOTAL REMOVAL HYPOTHESIS (dismantling and complete removal of the implant) that implies: - Design and management costs of decommissioning
- Removal, transport and grounding costs
- Remediation and disposal costs of polluting substances Answer options:
◻ Extremely inappropriate hypothesis
◻ Hypothesis neither appropriate nor inappropriate ◻ Extremely appropriate hypothesis
OPTION II
PARTIAL REMOVAL HYPOTHESIS (you only remove a part of the structure, in most cases the deck, while the remaining part immersed is left on site) that implies:
- Design and management costs of partial removal - Installation and maintenance costs
- Cost of disposal of polluting substances Answer options:
◻ Extremely inappropriate hypothesis
◻ Hypothesis neither appropriate nor inappropriate ◻ Extremely appropriate hypothesis
OPTION III
RECONVERSION HYPOTHESIS (whole platform redevelopment for multiple uses) that implies: - Costs of planning and management of the conversion
- Investment costs for the conversion - Installation and maintenance costs Answer options:
◻ Extremely inappropriate hypothesis
◻ Hypothesis neither appropriate nor inappropriate ◻ Extremely appropriate hypothesis
9. In your opinion what other relevant COSTS could be, not listed in the hypotheses mentioned above.
10. When an offshore mining platform reaches the end of its production phase, there may be different alternatives to pursue, from a REVENUE point of view, as it evaluates the various hypotheses. [2]
Please provide an evaluation for each individual option: OPTION I:
TOTAL REMOVAL HYPOTHESIS (dismantling and complete removal of the plant) which implies possible Revenues deriving from:
- Recovery and sale of materials resulting from removal Answer options:
◻ Extremely inappropriate hypothesis
◻ Hypothesis neither appropriate nor inappropriate ◻ Extremely appropriate hypothesis
OPTION II:
PARTIAL REMOVAL HYPOTHESIS (only a part of the structure is removed, in most cases the deck, while the remaining immersed part is left on site) which implies possible Revenues deriving from:
- Different use of the deck moved to other sites - Construction of an artificial reefs
- Renewable energy production (solar, wind, marine waves etc.) - Sale of aquaculture products
Answer options:
◻ Extremely inappropriate hypothesis
◻ Hypothesis neither appropriate nor inappropriate ◻ Extremely appropriate hypothesis
OPTION III:
RECONVERSION HYPOTHESIS (conversion of the entire platform left at sea intact) which implies possible Revenues deriving from different uses of the platform for multiple uses, including possible:
14 - Productive activities (e.g. fish farming)
- Environmental activities and monitoring (e.g. environmental monitoring station)
- Tourist / recreational activities with high experiential content (luxury hotel and restaurant, temporary Islands, issuing and issuing scuba diving patents)
Answer options:
◻ Extremely inappropriate hypothesis
◻ Hypothesis neither appropriate nor inappropriate ◻ Extremely appropriate hypothesis
11. In your opinion, what could be other relevant REVENUES, not listed in the aforementioned hypotheses? 12. How informed do you think you are about the opportunities and challenges arising from the decommissioning of offshore oil and gas infrastructure? (On a scale of 1 to 7, where 1 corresponds to "not at all informed" and 7 corresponds to "strongly informed")
PART II
13. By taking into account the economic, social and environmental impacts of reuse activities, could you please rank three cards representing these issues? (For example, social THEN economic THEN environment)
14. If you had the possibility to divide your cards by introducing blank cards, would you do (i.e., you might decide not to introduce additional cards)? This will suggest us that the card ranked above another card is much more important to you. (For example, social THEN 2 blank cards THEN economic THEN 1 blank card THEN environment)
Acknowledgments
This study was performed within the framework of the project PLaCE (PON Ricerca e Innovazione 2014-2020, project code: ARS01_00891), co-funded by the European Union.
References
Abhinav, K.A. et al. (2020) Offshore multi-purpose platforms for a Blue Growth: a technological, environmental and socio-economic review, Science of the Total Environment 734: 138256
Assuad, C.S.A. (2020) Understanding rationality in sustainable development decision-making; unfolding the motivation of action, Journal of the Knowledge Economy 11: 1086-1119
Bernstein, B.B. (2015) Decision framework of platform decommissioning in California, Integrated Environmental Assessment and Management 11: 542-553
Bolis, I. et al. (2017) Are we making decisions in a sustainable way? A comprehensive literature review about rationalities for sustainable development, Journal of Cleaner Production 145: 310-322 Bressler, A., Bernstein, B.B. (2015) A costing model for offshore decommissioning in California, Integrated Environmental Assessment and Management 11: 554-563
Brozovic, D. (2019) Business model based on strong sustainability: insights form an empirical study, Business Strategy Environment 29: 763-778
Bull, A. S., Love, M. S. (2019). Worldwide oil and gas platform decommissioning: a review of practices and reefing options. Ocean & Coastal Management 168: 274-306
Burdon, D. et al. (2018) Oil and gas infrastructure decommissioning in marine protected areas: system complexity, analysis and challenges, Marine Pollution Bulletin 135: 739-758
Cardeal, G. et al. (2020) Sustainable business models-canvas for sustainability, evaluation method, and their application to additive manufacturing in aircraft maintenance, Sustainability 12: art. no. 9130
Corona, B. et al. (2019) Towards sustainable development through the circular economy - a review and critical assessment on current circularity metrics, Resources, Conservation & Recycling 151: 104498
Fam, M.L. et al. (2018) A review of offshore decommissioning regulations in five countries— strengths and weaknesses, Ocean Engineering 160: 244-263
Geissdoerfer, M. et al. (2018) Sustainable business model innovation: a review, Journal of Cleaner Production 198: 401-416
Geissdoerfer, M. et al. (2020) Circular business models: a review, Journal of Cleaner Production 277: 123741
Grimmel, H. et al. (2019) Integration of the social dimension into marine spatial planning — theoretical aspects and recommendations, Ocean and Coastal Management 173: 139-147
15
Herghiligiu, I.V. et al. (2019) Sustainable environmental management system integration and business performance: a balance assessment approach using fuzzy logic, Sustainability 11: art. no. 5311
Joyce, A., Paquin, R. L. (2016) The triple layered business model canvas: A tool to design more sustainable business models. Journal of Cleaner Production 135: 1474-1486.
Kolian, S.R. et al. (2019) Alternative uses of retired oil and gas platforms in the Gulf of Mexico, Ocean and Coastal Management 167: 52-59
Kruse, S. A. et al. (2015) Considerations in evaluating potential socioeconomic impacts of offshore platform decommissioning in California, Integrated environmental assessment and management 11: 572-583
Lewandowski, M. (2016) Designing the business models for circular economy—Towards the conceptual framework, Sustainability 8: art. no.43
Lüdeke-Freund, F. et al. (2018) The sustainable business model pattern taxonomy 45 patterns to support sustainability-oriented business model innovation, Sustainable Production and Consumption 15: 145-162
Na, K.L. et al. (2017) An expert knowledge based decommissioning alternative selection system for fixed oil and gas assets in the South China Sea, Ocean Engineering 130: 645-658
Sedlar, D.K. et al. (2019) Offshore gas production infrastructure reutilisation for blue energy production, Renewable and Sustainable Energy Reviews 108: 159-174
Shakeel, J. at al. (2020) Anatomy of sustainable business model innovation, Journal of Cleaner Production 261: 121201
Teece, D.J. (2010) Business models, business strategy and innovation, Long Range Planning 43: 172-194
Velter, M.G.E. et al. (2020) Sustainable business model innovation: the role of boundary work for multi-stakeholder alignment, Journal of Cleaner Production 247: 119497
Zagonari, F. (2016) Choosing among weight-estimation methods for multi-criterion analysis: a case study for the design of multi-purpose offshore platforms, Applied Soft Computing 39: 1-10
Zagonari, F. (2021) Decommissioning vs. reusing offshore gas platforms within ethical decision-making for sustainable development: theoretical framework with application to the Adriatic Sea, Ocean and Coastal Management 199: 105409