“
Does the digital divide matter ? The role of Information and Communication
Technology in cross-country level and growth estimates?”
F
ABRIZIOA
DRIANI, L
EONARDOB
ECCHETTICEIS Tor Vergata - Research Paper Series, Vol. 2, No. 4, February 2003
This paper can be downloaded without charge from the Social Science Research Network Electronic Paper Collection:
http://ssrn.com/abstract=382983
CEIS Tor Vergata
R
ESEARCH
P
APER
S
ERIES
Does the digital divide matter ? The role of Information and Communication Technology in cross-country level and growth estimates*
Leonardo Becchetti
University of Rome Tor Vergata, Department of Economics, Via di Tor Vergata snc, 00133 Roma. E-Mail : [email protected]
Fabrizio Adriani
University of Rome Tor Vergata, Department of Economics, Via di Tor Vergata snc, 00133 Roma.
* The paper is part of a CNR research project and CEIS Working Paper n. 146. We thank M.Bagella, I. Hasan, D. Jorgenson, G. Marini, F. Mattesini, L.Paganetto, F. Pigliaru, E.Phelps, D. Quah, P.L. Scandizzo, P.Scaramozzino, P. Temin. P. Wachtel and two anonymous referees for useful comments and suggestions. The usual disclaimer applies.
Does the digital divide matter ? The ICT role in cross-country level and growth estimates
Abstract
The bulk of Information and Communication Technology is made of weightless, implementable and infinitely reproducible knowledge products (such as software and databases). These products are transferred by telephone lines, accessed through internet hosts and processed and exchanged through personal computers.
In this work, the coefficient of the labor augmenting factor in the aggregate production function has been extimated using proxies of variables crucially affecting the diffusion of (non rivalrous and almost non excludable) knowledge products. This specification provides interesting answers to some of the open issues in the existing growth literature. The most recent information, even though available for a limited period, shows that telephone lines, personal computers, mobile phones and internet hosts significantly affect levels and growth of income per worker across countries. The result is robust to changes in sample composition, econometric specification and estimation approach.
1. Introduction
The empirical literature on the determinants of economic growth has progressively tested the significance of factors which were expected to contribute to growth in addition to the traditional labor and capital inputs. In this framework valuable contributions have assessed, among others,1 the role of: human capital
(Mankiw-Romer-Weil, 1992) (from now on MRW), the government sector (Hall-Jones, 1997), social and political stability (Alesina-Perotti, 1994), corruption (Mauro, 1995), social capital (Knack-Keefer, 1997), financial markets (Pagano, 1993; King-Levine, 1992; Wachtel, 2000) and income inequality (Persson-Tabellini, 1994; Perotti, 1996).
The paradox of this literature, though, is that it has left the labor augmenting factor of the aggregate production function unspecified. The impact of technological progress on the differences between rich and poor countries has therefore been neglected. This is the outcome of the implicit assumption that knowledge could be incorporated into production methods as it were a public good, freely available to individuals in all countries (Temple, 1999).
This approach does not properly consider the nature of Information and Communication Technology (from now on ICT) and its role on growth. The core of ICT is made by weightless, expansible and infinitely reproducible knowledge products (software, databases) which create value, by increasing productivity of labor or by adding value to traditional physical products and services. Knowledge products are almost public goods. Expansibility and infinite reproducibility make them
1 Durlauf and Quah (1988) survey the empirical literature on growth and list something like 87
different proxies adopted to test the significance of additional factors in standard growth models. None of them is akin to proxies adopted in this paper to measure factors crucially affecting ICT diffusion.
nonrivalrous, and copyright (instead of patent) protection makes them much less excludable than other types of innovation such as new drugs (Quah, 1999).
Hence, if ICT would consist only of knowledge products, it should be almost immediately available everywhere no matter the country in which it has been created. This does not occur though since the immediate diffusion and availability of knowledge products is prevented by some “bottlenecks”. In our opinion these “bottlenecks” are: i) the capacity of the network to carry the largest amount of knowledge products in the shortest time, ii) the access of individuals to the network in which knowledge products are immaterially transported and exchanged and iii) the power and availability of terminals which process, implement and exchange knowledge products over the internet.
In this framework, economic freedom and the development of financial markets may affect both ICT diffusion and its impact on growth. Insufficient access provision and excess taxation limit the diffusion of personal computers and internet accesses (Quah, 1999). Liberalisation in the telecommunication sector reduces the costs of accessing the network. Well developed financial markets make it easier to finance projects which aim to implement the capacity of the network and the quality of “pheripherals”.2
2 The relationship between ICT and productivity has long been debated over the past three decades. In
the 1980s and in the early 1990s, empirical research generally did not find relevant productivity improvements associated with ICT investment (Bender, 1986; Lovemann, 1988; Roach, 1989; Strassmann, 1990). This research showed that there was no statistically significant, or even measurable, association between ICT investment and productivity at any level of analysis chosen. More recently, as new data were made available and new methodologies were applied, empirical investigations have found evidence that in the second part of the 90es ICT investment was associated with improvements in productivity, in intermediate measures and in economic growth (Oliner and Sichel, 2000; Brynjolfsson and Hitt, 1996 and 2000; Sichel, 1997; Lehr-Licthemberg, 1999; Jorgenson-Stiroh, 2000). The same authors find similar evidence in 2001 despite the 2001 downward revision of
The omitted consideration of Information and Communication Technology, is partially justified so far by the scarcity of data,3 but has relevant consequences on the accuracy
of growth estimates. Suppose, in fact, that ICT variables are proxies for the diffusion of technology. Then, in the case they are significant and omitted, parameters of the other MRW regressors (labor and investment in physical and human capital) are biased as far as they are correlated with them (omitted variable critique). Moreover, (cross-sectional constant critique), the omitted specification of the labor augmenting technological progress biases cross section regressions on the determinants of per capita income level. This arises because technological progress cannot be treated as a cross-sectional constant, implicitly attributing the same level of technology to every observation (Islam, 1995; Temple, 1999).4 The solution of fixed effect panel data
(Islam, 1995) is a partial remedy to it as it takes into account unobservable individual country effects. An alternative approach consists in specifying those factors, like ICT in our example, which are expected to be proxies of unobserved country effects.
In addition, the inclusion of ICT variables in the estimate may also avoid that uncontrolled heterogeneity in levels of per capita income lead to a significant correlation between the lagged level of per capita income and the error term in the convergence regressions, thereby violating one of the required assumptions for consistency of OLS estimates (cross-country heterogeneity critique).5
In this paper accordingly use ICT variables to model the unknown country differences in the diffusion of technology. This approach generates a sharp increase in
3 Quah writes in 1999 that “the latest technologies have not been around for very long. Thus, convincing
empirical time-series evidence on their impact will be difficult to obtain"”
4 The only relevant exception may be when regressions are run on regions with a certain degree of
technological homogeneity such as the US regions in the Barro-Sala-i-Martin (1992) paper on convergence.
5 According to Evans (1997) this problem can be neglected only when at least 90-95 percent of
the explanatory power of cross-sectional estimates of the determinants of levels of income per worker. Therefore, it significantly reduces the effects of the cross-sectional
constant and omitted variable critiques. The increased goodness of fit in the GDP per
worker level regression reduces in turn the effects of the cross-country heterogeneity critique making it possible a cross-sectional estimate of convergence in growth rates. The robustness of the main results of the paper (significance of both the initial level and the rate of growth of ICT technology in cross-section and growth regressions) is accurately tested. With bootstrap estimates we find that it is not affected by departures from the normality assumption for the distribution of the dependent variable and we test its robustness to changes in the composition and weight of sample countries. With Generalised 2-Stage Least Squares (G2SLS) panel estimates we find evidence that the ICT-growth relationship is valid also in shorter subperiods and is not affected by endogeneity.
The paper documents all these findings and is divided into four sections (including introduction and conclusions). In the second section we outline our theoretical hypotheses on the role of ICT variables on aggregate growth. In the third section we present and comment empirical tests on our hypothesis.
2.1 The determinants of differences in levels of per capita growth
The considerations developed in the introduction on the role of ICT on growth lead us to formulate the following hypothesis:
Hypothesis 1: factors affecting ICT diffusion are good proxies for measuring the amount technological progress which augments labor productivity in a MRW human capital growth model.6
Consider the standard MRW (1992) production function taking into account the role of human capital
Yt =F(K, H, AL) = KtαHtβ (AtLt)1-α-β with α + β < 1 (1)
where H is the stock of human capital, while L and K are the two traditional labor and physical capital inputs.
Physical and human capital follow the standard laws of motion.
(
K AL)
K F s K Y s K K K ä -ä -, = = & (2)(
K AL)
H F s H Y s H H H ä -ä -, = = & (3) where sk and sh are the fractions of income respectively invested in physical andhuman capital.
The exogenous growth of the labor input is expressed as
Lt = L0 ent. (4)
Differently from MRW (1992), we model labor augmenting technological progress by assuming that most of it is proxied by weightless, infinitely reproducible, knowledge products (software,databases). These products are conveyed to labor through crucial factors such as the access to the network, the capacity of the network and the availability of “pheripherals” which process and exchange knowledge products.
6 In the empirical analysis which follows we compare estimates of the MRW base case with those
augmented for ICT variables. Hence, in case our hypothesis is rejected, we may discriminate between two alternatives: i) the base case equation fits the data and therefore ICT variables are bad proxies for technical progress; ii) the base case equation does not fit the data and therefore the hypothesis is rejected because the (MRW) model in which conditional convergence is crucially led by human capital is rejected in our sample period.
We accordingly specify the dynamics of technical progress as
A(t) = AKP(t)AICT(t) (5)
with AICT(t) = AICT(0) egICT(t) and AKP(t) = AKP(0) egKP(t)
AICT is a measure of the stock of ICT factors and gICT its rate of growth, whereas AKP(t)
is the contribution to technological progress of the stock of weightless infinitely reproducible knowledge products and gKP its rate of growth.
By rewriting the production function in terms of output per efficiency units as y=kαhβ, we can obtain the two standard growth equations
(
)
t t k t s y n g k k& = - + +ä (6)(
)
t t h t s y n g h h& = - + +ä (7) where g=gICT+gKP.If we set the growth of physical and human capital equal to zero in the steady state we find â -á -1 1 â â 1 ä * + + = g n s s k k h (8) â -á -1 1 á 1 á ä * + + = g n s s h k h . (9)
Substituting h* and k* into the production function and taking logs we obtain
(
*, *)
* * (0) (0) *á *â â á h k e A e A h Ak h k Af L Y g t ICT t g KP ICT KP = = = (10) and(
)
( )
( )
ln(
ä)
â -á -1 â á -ln â -á -1 â ln â -á -1 á ln ln = + (0) + + + + + + g n s s t g A c L Y h k ICT ICT t t (10’) or(
)
[
( ) (
)
]
[
ln( ) (
-ln ä)
]
â -á -1 â ä ln -ln â -á -1 á ln ln = + (0) + + + + + + + g n s g n s t g A c L Y h k ICT ICT t t (10’’)where c=ln(AKP(0))+gKPt is the quasi-public good component of knowledge products and
is therefore assumed constant across countries. The difference with the traditional MRW (1992) specification is that we reinterpret the intercept and we add to it two additional terms respectively accounting for the log of the stock of ICT at the initial period and its rate of growth per time unit.7 Hence, the possibility that all countries
have the same steady state level of per capita income doesn’t depend only on the leveling of their population growth and broad capital investment rates. It is also affected by both initial stock and growth rate of ICT. A second important difference in this equation is that the country specific rate of growth of technology plus depreciation (g+δ in all previous models) is no more treated as fixed and equal to 0.05 for all
countries8 (an heroic assumption). In our specification, it varies being crucially
influenced by the measured country specific growth rates of ICT. .
2.2 The determinants of differences in convergence of per capita growth
Under hypothesis 1 it is possible to show that, in the proximity of the balanced growth path, y converges to y* at the rate (1 - α-β) (n+g)≡λ This result can be obtained from
the solution of the differential equation 9
7 Of course alternative specifications could be acceptable as well. For instance, one might argue that
ICT is a production factor and should be treated like physical and human capital. The advantage of our approach is that it allows to take into account the interactions between the (rivalrous) ICT and the quasi-public component of technological progress.
8 This is the approach followed by Solow (1956), Mankiw-Romer-Weil (1992) and Islam (1995) among
many others.
9 This obviously implies that the speed of convergence differs across countries and is crucially
dln(y)/dt=-λ[ln(y)-ln(y*)] (11)
which is :
ln(yt)-ln(y*)=e-λt[ln(y0)-ln(y*)]. (12)
If we add ln(y*)- ln(y0) to both sides we get an equation explaining the rate of growth:
ln(yt)- ln(y0)=-(1-e-λt)[ln(y0)-ln(y*)].
Replacing ln(y*) with our solution we get
( )
( )
(
)
( )
0 -ë ë --ë -ë 0 ln ) -1 ( ä ln â -á -1 â á ) -1 ( ln â -á -1 â ) -1 ( ln â -á -1 á ) -1 ( ) ln( -) ln( y e g n e s e s e y y t t h t k t t + + + + + = (13) or( )
( )
(
ä)
(1- )ln(
( / )(0))
(1- )ln( ) ln â -á -1 â á ) -1 ( ln â -á -1 â ) -1 ( ln â -á -1 á ) -1 ( ' )) 0 )( / ln(( -) )( / ln(( ) 0 ( -ë -ë -ë -ë ë -ICT t t t h t k t ICT A e L Y e g n e s e s e t g c L Y t L Y + + + + + + + + = (13’) where c'=gKPt+(1−e−λt)ln(AKP(0)).The difference with the traditional MRW approach is in the interpretation of the common intercept (which now incorporates the worldwide diffusion of quasi-public knowledge products) and in the fact that convergence may be prevented by differences both in the initial stocks of ICT and/or in their rates of growth.
3.1 Empirical analysis: the database and descriptive statistics
Variables for our empirical analysis are taken from the WDI (World
Development Indicators) World Bank’s database.10 The dependent variable Y/L is the
using purchasing power parity rates,11 L is the number of people who can be
economically active (population aged between 15-64). sk is gross domestic investment
over GDP, sh is the (secondary education) ratio of total enrolment, regardless of age, to
the population of the age group that officially corresponds to the level of education shown (generally the 14-18 age cohort).12 In order to measure factors reducing ICT
bottlenecks we consider four different proxies: i) the number of main telephone lines per 1,000 inhabitants;13 ii) internet hosts (per 10,000 people) or the number of
computers with active Internet Protocol (IP) addresses connected to the Internet, per 10,000 people; iii) mobile phones (per 1,000 people); iv) personal computers (per 1,000 people).14
Descriptive statistics on the above mentioned variables show that the dependent variable is not normally distributed when we both consider individual year and overall sample datasets.15 This fact, neglected by the existing literature, should be
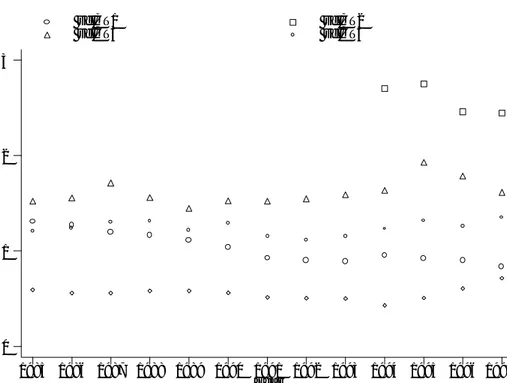
taken into account when running regressions in levels and rates of growth. Furthermore, simple statistics of sigma convergence clearly confirm that ICT indicators are far from being freely available public goods as the variability in the diffusion of ICT across countries is extremely high and persistent (Fig. 1). On average, for the entire observation period, it is higher when we consider internet hosts, i.e. the latest ICT innovation. Cross-country standard deviation of such variable is two and a
11 An international dollar has the same purchasing power over GDP as the U.S. dollar in the United
States.
12 It is also defined as the gross enrolment ratio to compare it with the ratio (net enrolment ratio) in
which the denominator is the enrolment ratio only of the age cohort officially corresponding to the given level of education.
13 Telephone mainlines are telephone lines connecting a customer's equipment to the public switched
telephone network. Data are presented per 1,000 people for the entire country.
14 Since all these factors are expected to ease the diffusion and processing of knowledge products in the
internet a qualitative measure of their “power” (i.e. the processing capacity of PCs) would improve the accuracy of our proxies. Unfortunately this information is not available for long time periods and across the countries observed in our sample.
half its mean whereas the one of the telephone lines variable is almost equal to its mean.
Tab A.1 in the Appendix provides the list of countries included in the estimates. For each country we display the level of the ICT variable in the first and in the last available year. This table documents that we have data for 115 countries from 1983 if we just consider the diffusion of telephone lines, whereas we can rely on much less countries and more limited time, if we consider the other three ICT indicators. For this reason we define a composed indicator which is an unweighted average of each of the four normalized ICT indicators (when available). We then perform our estimates alternatively with the composed and with each single ICT indicator.
3.2 Econometric estimates of the determinants of levels of income per worker
As a first step we regress equation (1) in levels.16 Our time span is quite limited when
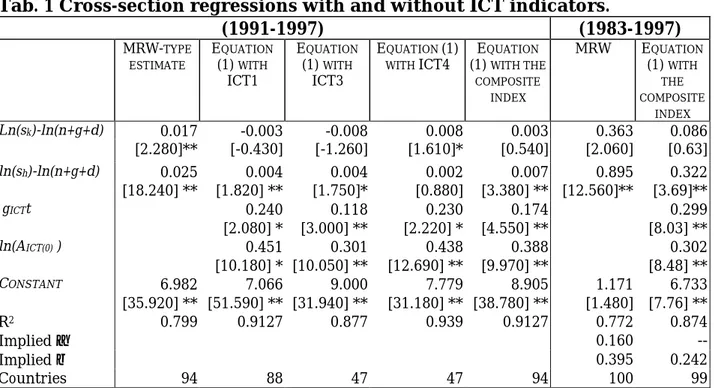
we consider a common starting year for the individual ICT indicators (1991-97), while it becomes much wider when we use the composite indicator. Table 1 compares results from the standard MRW model with the model specified in (1) using different ICT indicators.17
16 We perform the estimate with four different specifications which alternatively consider: 1) either the
ILO labor force or population in working age as labor inputs, 2) either observed income or trend income as a dependent variable. The ILO labor force includes the armed forces, the unemployed, and first-time job-seekers, but excludes homemakers and other unpaid caregivers and workers in the informal sector. We use trend income alternatively to observed income to avoid our results to be influenced by cyclical effects on output (Temple, 1999). Estimates with the alternative proxies for the labor input and the dependent variable do not differ substantially and are available from the authors upon request.
A first aspect to remark is that elasticities of investment in physical and human capital are, as expected, much smaller on such a limited time span (1991-97) even in the traditional MRW estimate. In spite of this, both factors significantly affect levels of income per worker. The introduction of starting year levels (AICT(0)) and rates of
growth of ICT variables (gICT) significantly improves the overall goodness of fit.
Interestingly enough, the model explains almost 94 percent of the cross-sectional heterogeneity when ICT is proxied by the diffusion of personal computers. Both AICT(0)
and gICT are always strongly significant and show the expected sign.18 Our estimates
indicate an elasticity of .3/.4 of the beginning of period stock of ICT variables (A
BR-ICT(0)), indicating that a ten percent higher stock of ICT variables at the beginning of
the sample period corresponds to a 3/4 percent higher level of per capita GDP.
Furthermore, the four regressors included in (10’’) are all significant only when we use the composite index. In almost all other cases the introduction of the ICT variables seems to cast doubts on the significance of the short term elasticity of the investment in physical capital and also on that of human capital when we specify the ICT variable with mobile phones or personal computers.19 The re-estimation of the
model with bootstrap standard errors shows that the significance of the ICT variables remains strong for all the considered indicators and robust to changes in the composition of sample countries.20
18 Our results obviously risk to be affected by endogeneity. We will discuss this issue in the rest of the
paper. In the meanwhile it is worth considering that the dependent variable is measured in the last year of the sample interval, all other regressors are time sample averages and AICT(0) is measured in the
first sample year and therefore lagged at least thirteen years with respect to the dependent variable.
19 The weakness of the human capital variable when we introduce personal computers is consistent with
the hypothesis that the productive contribution of skilled workers passes through (or is enhanced by) the technological factor. For evidence on this point see Roach (1989), Berndt et al. (1992) and Stiroh (1998).
20 Remember that bootstrapping provides an alternative way of estimating standard errors which does
not rely on any a priori given distributional form (Efron, 1979, Efron and Stein, 1981; Efron and Tibshirani, 1986). More specifically, in each trial of the bootstrapping procedure we draw with replacement N observations from the N observation dataset (therefore in each trials some countries
A final estimate done by using the composite index on the 1983-1997 time range suggests what happens when we extend the estimation period and when regression coefficients measure medium and not short term elasticities. Magnitudes of physical and human capital investment coefficients are now higher and closer to those found in MRW. A striking result is that sk is no more significant when ICT variables are
included in the estimate, while sh is significant with an implied β of .23.21 This number
is below the range calculated by MRW for the US.22 Overlooking differences in the
estimation periods, the first result seems to suggest that the physical capital contribution falls when we properly consider the role of ICT factors (which, in a broad sense, are part of physical capital). In the same original MRW (1992) estimate the physical capital factor share drops from 0.41 in the overall sample to 0.14 in the OECD sample. This change may be explained in the light of our results given the higher contribution of ICT technology to output in the first group of countries. Further support for this hypothesis comes from the Jorgenson-Stiroh (2000) empirical paper documenting the dramatic decrease in the selling and rental price of computers in the USA, paralleled by an increase in the same prices for physical capital between 1990 and 1996 and attributing to high firm and household input substitution elasticity part
may have higher weight and other countries may not be included in the sample). We perform two thousands of trials and for each of them we calculated the coefficient magnitude. The estimate of the standard error of that statistics then depends on the variability of the estimate in the different trials. In this sense, and given that in each trial of the bootstrapping procedure we draw with replacement N observations from the N observation dataset, bootstrapping measures the sensitivity of the result to changes in the number of observations. We also estimate the model separately for OECD and non OECD countries and find that the ICT effect is significant in both subsamples, even though it appears to be stronger in OECD countries. Results are omitted for reasons of space and available upon request.
21 The lack of cross-sectional significance of sk can be anticipated even by the simple inspection of
descriptive statistics. If we divide our sample into three equal subgroups of countries according to levels of income per worker (high, medium and low income) we find that values of sh are respectively 83.60,
58.92 and 50.46 percent, while values of sk are much more equal across subgroups (23.57, 23.18 and
of the change in the relative contribution to growth of the two different types of capital.23
Output elasticities of the two ICT variables, when included in our estimate, seem therefore to reduce the output elasticity of human capital and to obscure the cross-sectional contribution of physical capital. They significantly contribute, though, to explain large differences in income per capita which would remain partially unexplained would the role of ICT be neglected. A plausible rationale for this finding is that part of the contribution of human capital to output depends on ICT.24 The
former is overstated if the latter is not accounted for.
The use of a cross-sectional regression to estimate the determinants of levels of per capita income has been strongly criticised by Islam (1995). His argument is that the labor augmenting A-factor in the aggregate production function represents country specific preferences and technological factors. It is therefore not possible to assume that it is absorbed in the intercept and therefore constant across countries
(cross-sectional constant critique). Our estimate partially overcomes the problem by specifying the technological variable. On the other hand, we need to take into account the reasonable possibility that some additional country specific variables (deep fundamentals such as ethos or governance parameters such as economic freedom) are omitted. We therefore consider two alternative solutions: i) a re-estimation of (1) as a cross-section with the introduction of variables which may proxy for those omitted; ii)
23 The same shift in technological patterns induced by the ICT revolution seems to be an autonomous
cause of substitution between ICT and physical capital since ICT investment modifies the trade-off between scale and scope economies. The literature finds that ICT investment fosters the change from a Fordist to a flexible, less-capital intensive, network productive model (see the discussion on the introduction of CAD/CAM technology in Milgrom-Roberts, 1988) in which products and processes are more frequently adapted to satisfy consumers' taste for variety (Brooke, 1991; Barua-Kriebel-Mukhopadhyay, 1991; Becchetti-Londono-Paganetto, 2000).
24 For instance, it is reasonable to figure out that higher word processing capacity or the possibility of
exchanging information in internet increases the productivity of high skilled more than that of low skilled workers.
a panel estimate of the same equation in which fixed effects25 capture all additional
country specific variables.26
With respect to the second approach suggested to overcome the cross-sectional
constant critique, fixed effect panel results confirm the robustness of the significance of
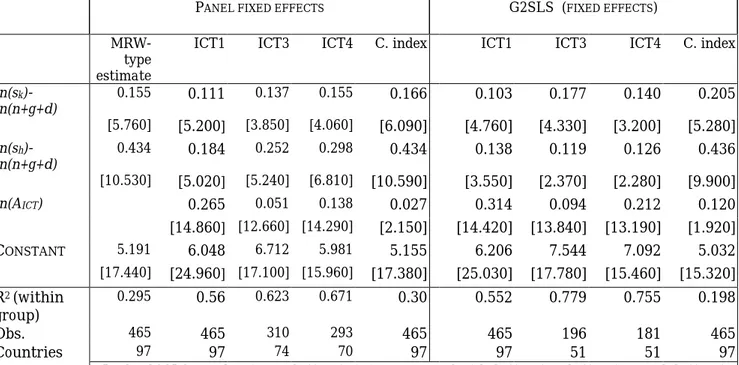
the technological variable (Table 2).27 Our results are a direct answer to Islam (1995)
interpretation of country specific fixed effects in its MRW-type panel estimate. In his specification, country specific technology effects are significantly and positively correlated with GDP growth rates and human capital. Since our ICT variables are positive and significant and their inclusion reduces the impact of human capital they are formally (in definition) and substantially (in data) a relevant part of the fixed effects measured by Islam (1995).
This type of estimate, though, generates an endogeneity problem since the contribution of ICT is no more split into the two components of initial levels and rates of growth and is therefore not completely lagged with respect to the dependent variable. To overcome the endogeneity problem we use the G2SLS methodology which combines fixed effect panel estimates with instrumental variables.28 We use two to
four periods lagged values of ICT indicators as instruments and find that ICT variables are still significant (Table 2). The ICT elasticity in panel estimates is smaller (.02/.12) than the corresponding elasticity in cross-sectional estimates. This
25 The fixed effect is preferred to the random effect approach as the second retains the strong
assumption of independence between regressors and the disturbance term.
26 With respect to the first approach we perform a sensitivity analysis à la Levine-Renelt (1992) adding
to their variables indexes of economic, civil and legal freedom. Results show that all regressors of specification (1) are substantially robust (no change in significance and limited change in magnitude) to the inclusion of any combination of the above mentioned additional explanatory variables. Evidence is omitted for reasons of space and is available from the authors upon request.
27 Panel estimates are robust to the sensitivity analysis performed also on cross-sectional estimates.
Evidence is omitted for reasons of space and is available from the authors upon request.
roughly corresponds to the cross-sectional coefficient since the sample period is divided into five subperiods and therefore we calculate in the panel estimate the effect in a smaller time interval.
3.3 Econometric estimates of convergence in rates of growth of income per worker
The reduced interval for which we dispose of ICT data limits our analysis to short-medium term convergence and prevents us to estimate convergence with panel data. Nonetheless, since the best specification of (10’’) explains almost 94 percent of the observed cross-sectional heterogeneity our attempt at estimating convergence with a cross-sectional estimate is not severely affected by the cross-country heterogeneity
critique (Evans, 1997). The results we obtain are roughly in line with the existing
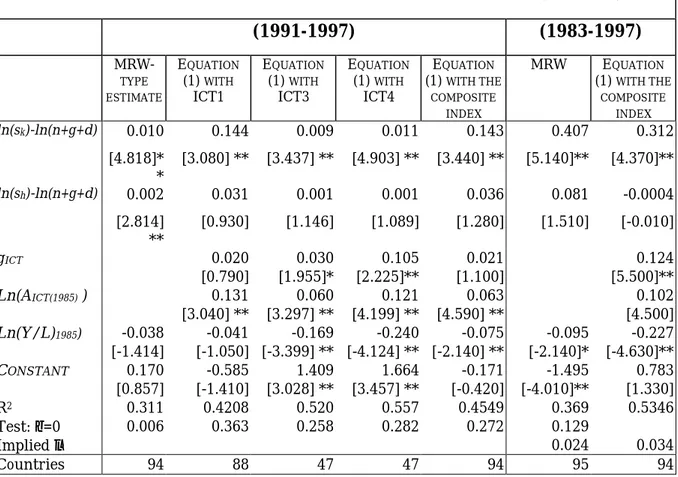
literature and with our theoretical predictions formulated in section 2. Table 3 shows that our ICT-growth model performs better than the MRW model in the 90es. The level of income per working-age person in the starting period (Y/L1985) becomes
significant only if we proxy the labor augmenting technological progress with our ICT variables. The effect of ICT on growth is quantitatively smaller than that on levels with a .06/.13 elasticity (a ten percent higher stock of ICT variables at the beginning of the sample period corresponds to a .6/1.3 percent higher rate of growth in the considered period). Thus, short-run convergence doesn’t appear to be conditional only on investments in physical and human capital,29 it also depends on ICT investments.30
estimates is likely to be small.” Therefore, the difference between the two approaches is only in the computational simplicity of the variance-covariance matrix.
29 The lack of significance of the coefficient of human capital is a well known result in the literature.
Islam (1995) explains it by arguing that the positive cross-sectional effect of human capital is likely to be outweighted by the negative temporal effect (higher levels of investment in human capital did not
Convergence is also slightly larger when we introduce ICT variables. In interpreting our result of faster convergence it is necessary to warn that we are working on a reduced and almost non overlapped sample period with respect to MRW (1983-1997 against 1960-1985). In this period convergence looks faster when it is conditioned to variables relevant in our model.
Sensitivity analysis shows that our results are confirmed even when we use bootstrap standard errors (considering either the composite ICT index or the PC diffusion variable as proxies of ICT). Moreover, they are robust to the inclusion of three by three combinations of all additional variables used in Levine-Renelt (1995) plus several different indicators of quality of institutions and macroeconomic policies.31
Conclusions
The technological revolution originated by the progressive convergence of software and telecommunications and fostered by the advancements in digital technology is dramatically changing the world. This revolution has sharply reduced transportation costs, deeply modified geographical patterns of productive factors across the world and significantly increased the productivity of human capital.
We believe that Information and Communication Technology mainly consists of a core of reproducible and implementable knowledge incorporated in quasi-public “knowledge products” such as software and database libraries which can be accessed
produce positive changes in growth). This is not the case for ICT investment which is shown to have also positive time effects in our estimate.
30 If we arbitrary set (n+δ + g) equal to 0.05 for all countries our implied λ is larger than that in MRW
by everyone at some conditions. These conditions are represented by capacity and access to the network and by the availability of efficient terminal nodes which allow to process, exchange and reproduce these knowledge products. Domestic growth, therefore, is likely to be also affected by the quality of telephone lines and by the number of personal computers, mobile phones and internet hosts. These factors are in fact able to reduce bottlenecks which may limit the diffusion of technological knowledge.
.
The empirical literature on growth has so far neglected this phenomenon for lack of the available information or under the theoretical assumption that technology is a public good which can be easily incorporated without costs into domestic aggregate production functions. Our empirical evidence demonstrates that this is not the case and finds . Even though for a more limited time span than in traditional empirical analyses our results support the theoretical prediction of a significant role of ICT diffusion in explaining levels and rates of growth of income per worker. Moreover, they show that the ICT factor is an additional crucial determinant of convergence in levels as well as in growth rates. These findings are robust to changes in specification, sample composition and in the estimation approach.
Our conclusion is that ICT diffusion is necessary to understand conditional convergence. It bridges the gap between pessimistic concerns that cross country differences in income are structural and are going to persist and even widen on one hand, and optimistic views believing that those who lag behind will be able to catch up on the other hand. By collecting additional information on ICT diffusion in the next years we will be able to know whether ICT contribution to growth is likely to persist also in the future so that our conclusions may be extended to a longer time period.
References
Alesina, A. and Perotti, R., 1994, The political economy of growth: a critical survey of the recent literature, World Bank Economic Review, 8 (3), pp.351-71.
Barro R. and Sala-i-Martin, X., 1992, Convergence, Journal of Political Economy, 100, pp.223-251.
Barua, A., Kriebel, C. and Mukhopadhyay, T. [1991], "Information Technology and Business Value: An Analytic and Empirical Investigation," University of Texas at Austin Working Paper, (May).
Berndt, E. R., Morrison, C. J. and Rosenblum, L. S., [1992], "High-tech Capital Formation and Labor Composition in U.S. Manufacturing Industries: an Exploratory Analysis," National Bureau of Economic Research Working Paper No. 4010, (March). Becchetti, L., Londono Bedoya D.A. and Paganetto, L., 2000, ICT investment, productivity and efficiency: evidence at firm level using a stochastic frontier approach, CEIS Working paper n.126.
Bender, D. H. [1986], Financial Impact of Information Processing. Vol. 3(2): 22-32. Brunetti, A., 1997, Political variables in cross-country growth analysis, Journal of
Economic Surveys, vol. 11. N.2, pp.162-190.
Brynjolfsson. E. and Hitt, L., [1996], "Paradox Lost? Firm-Level Evidence on the Returns to Information Systems Spending", Management Science, (April)
Brynjolfsson, E.; Hitt, L. M., 2000, Beyond Computation: Information Technology, Organizational Transformation and Business Performance, Journal of Economic Perspectives, 14, (4), pp. 23-48
Dawson, J. W., 1998, Institutions, Investment, and Growth: New Cross-Country and Panel Data Evidence, Economic Inquiry; 36(4), pp. 603-19.
Durlauf, S.N.and Quah D.T., 1998, The new empirics of economic growth, Center for Economic Performance Discussion Paper N. 384.
Easterly, W. and Rebelo, S., 1993, Fiscal Policy and Economic growth, Journal of
Monetary Economics, 32 (3), pp.417-58.
Easton, S. T. and Walker, M. A., 1997, Income, Growth, and Economic Freedom, American Economic Review; 87(2), May 1997, pages 328-32.
Efron, B., 1979, Bootstrap methods: another look at the jackknife, Annals of Statistics, 7, 1-26.
Efron, B. and Stein, C., 1981, The jackknife estimate of variance, Annals of Statistics, 9, 586-596.
Efron, B. and Tbishirani, R., 1986, Boostrap measures for standard errors, confidence intervals and other measures of statistical accuracy, Statistical Science, 1, 54-77. Erickson (2001), Constructing instruments for regressions with measurement error when no additional data are available: comment, Econometrica, 69 (1) 221-222.
Evans, P., 1997, How fast do economies converge ?, The Review of Economics and
Statistics, pp.219-225
Gwartney, J., R. Lawson and D. Samida ,2000, “Economic Freedom of the World: 2000”, Vancouver, B.C., The Fraser Institute.
Hall, R. E.; Jones, C. I., 1997, levels of economic activities across countries, American Economic Review, 87 (2), pp. 173-77
Jorgenson, D. W., Ho, M. S. and Stiroh K. J., 2002, Projecting Productivity Growth: Lessons from the U.S. Growth Resurgence, Federal reserve Bank of Atlanta Economic Review, 87(3), pp.1-12.
Jorgenson, D. W.; Stiroh, K. J., 2000, Raising the Speed Limit: U.S. Economic Growth in the Information Age, Brookings Papers on Economic Activity, 0(1), pp. 125-211 Jorgenson, D. and Stiroh, K.J., 1999, Information technology and growth, American
Economic Review, Vol. 89, No. 2, pp. 109-115.
King, R.G. and Levine, R., 1992, Finance and growth: Schumpeter might be right" The
Quarterly Journal of Economics, August.
Knack, Stephen and Phillip Keefer, 1997, "Does Social Capital Have an Economic Payoff? A Cross-Country Investigation" Quarterly Journal of Economics 112, pp. 1251-88
Lehr, B. and Lichtenberg, F., 1999, Information Technology and Its Impact on Productivity: Firm-Level Evidence from Government and Private Data Sources, 1977-1993, Canadian Journal of Economics; 32(2), pp. 335-62.
Levine, R. and Renelt, D., 1992, A sensitivity analysis of cross-country growth regressions, American Economic Review, 82(4), 942-63.
Loveman, G. W. "An Assessment of the Productivity Impact of Information Technologies," MIT Management in the 1990s, Working Paper # 88 – 05, July 1988.
Mankiw, N.G., Romer, D. and Weil, D., 1992, A contribution to the empirics of economic growth, Quarterly Journal of economics, pp. 407-437.
Mauro, P., 1995, Corruption and growth, Quarterly Journal of Economics, 110 (3), pp.681-712.
Milgrom P. and Roberts R., 1988, The Economics of Modern Manufacturing: Products,
Technology and Organization, Stanford Center for Economic Policy Research
Discussion Paper 136
Oliner S. D., Sichel D. E., 2002, Information Technology and Productivity: Where Are We Now and Where Are We Going? Federal reserve Bank of Atlanta Economic Review, 87(3), pp. 15-44.
Oliner, S. D.; Sichel, D. E., 2000, The Resurgence of Growth in the Late 1990s: Is Information Technology the Story? Journal of Economic Perspectives, 14 (4), pp. 3-22 Pagano, M., 1993, Financial markets and growth: an overview, European Economic
Review 37, pp. 613-622.
Persson, T. and Tabellini, G., 1994, Is inequality harmful for growth?, American
Economic Review, 84:3, pp. 600-21.
Perotti, R., 1996, Growth, income distribution and democracy: what the data say,
Journal of Economic Growth, 1, pp.149-87.
Roach, S. S. 1991, "Services under Siege: the Restructuring Imperative," Harvard
Business Review 39(2): 82-92.
Oliner, S. D. and Sichel, D. E., 1994, Computers and Output Growth Revisited: How Big is the Puzzle?, Brookings Papers on Economic Activity, 1994(2), pp. 273-334. Quah, D., 1999, Technology and Growth, The Weightless Economy in Economic Development , LSE Discussion Paper no.417.
Roach, Stephen S., 1989, America's White-Collar Productivity Dilemma, Manufacturing Engineering , pp. 104.
Sichel, A., 1997. The Computer Revolution: An Economic Perspective. Brookings Institution Press, Washington, DC.
Solow, R.M., 1956, A contribution to the theory of economic growth, Quarterly Journal
of Economics, 70, pp.65-94.
Stiroh, K.J., 1998, Computers productivity and input substitution, Economic Inquiry, 36 (2), pp. 175-91.
Strassmann, P. A., 1990, The Business Value of Computers: An Executive's Guide. New Canaan, CT, Information Economics Press.
Temple, J., 1999, The new growth evidence, Journal of Economic Literature, 37, pp.112-156.
Wachtel, P., 2000, Equity Markets and Growth: Cross-Country Evidence on Timing and Outcomes, 1980-1995, Journal of Banking and Finance, v. 24, iss. 12, pp. 1933-57
Fig. 1: Sigma convergence of ICT indicators (standard deviation to mean ratios)
Note: sdICT1: standard deviation/mean ratio of main telephone lines per 1.000 people; sdICT2: standard deviation/mean ratio of internet hosts (or the number of computers with active Internet Protocol (IP) addresses connected to the internet) per 10,000 people; sdICT3: standard deviation/mean ratio of mobile phones (per 1,000 people). sdICT4: standard deviation/mean ratio of personal computers (per 1,000 people). The last symbol represents sdICT (COMPOSITE INDEX): unweighted average of ICT1,
ICT2, ICT3 and ICT4.
Year sdICT1 sdICT2 sdICT3 sdICT4 1985 1986 1987 1988 1989 1990 1991 1992 1993 1994 1995 1996 1997 0 1 2 3
Tab. 1 Cross-section regressions with and without ICT indicators. (1991-1997) (1983-1997) MRW-TYPE ESTIMATE EQUATION (1) WITH ICT1 EQUATION (1) WITH ICT3 EQUATION (1) WITH ICT4 EQUATION (1) WITH THE COMPOSITE INDEX MRW EQUATION (1) WITH THE COMPOSITE INDEX Ln(sk)-ln(n+g+d) 0.017 -0.003 -0.008 0.008 0.003 0.363 0.086 [2.280]** [-0.430] [-1.260] [1.610]* [0.540] [2.060] [0.63] ln(sh)-ln(n+g+d) 0.025 0.004 0.004 0.002 0.007 0.895 0.322 [18.240] ** [1.820] ** [1.750]* [0.880] [3.380] ** [12.560]** [3.69]** gICTt 0.240 0.118 0.230 0.174 0.299 [2.080] * [3.000] ** [2.220] * [4.550] ** [8.03] ** ln(AICT(0) ) 0.451 0.301 0.438 0.388 0.302 [10.180] * [10.050] ** [12.690] ** [9.970] ** [8.48] ** CONSTANT 6.982 7.066 9.000 7.779 8.905 1.171 6.733 [35.920] ** [51.590] ** [31.940] ** [31.180] ** [38.780] ** [1.480] [7.76] ** R2 0.799 0.9127 0.877 0.939 0.9127 0.772 0.874 Implied α 0.160 -- Implied β 0.395 0.242 Countries 94 88 47 47 94 100 99
Note: the Table reports results on the estimation of equation (1). In the second to fourth column the traditional MRW approach is augmented with ICT variables. ICT1: main telephone lines per 1.000 people. ICT3: Mobile phones (per 1,000 people). ICT4: Personal computers (per 1,000 people); ICT COMPOSITE INDEX: unweighted average of ICT1, ICT2, ICT3 and ICT4 where ICT2 is the number of
computers with active Internet Protocol (IP) addresses connected to the internet) per 10,000 people. g is gICT+gKP, where gICT is the growth rate of the selected ICT variable, and gKP is assumed constant across
countries. sh , sk and gICTt are calculated as estimation period averages, while the dependent variable
has the end of period value. T-stats are reported in square brackets. ** 95 percent significance with bootstrap standard errors, * 90 percent significance with bootstrap standard errors. We use the percentile and bias corrected approach with 2000 replications.
Tab. 2 The determinants of levels of income per worker estimated with panel data fixed effects and G2SLS fixed effects
PANEL FIXED EFFECTS G2SLS (FIXED EFFECTS)
MRW-type estimate
ICT1 ICT3 ICT4 C. index ICT1 ICT3 ICT4 C. index
ln(sk )-ln(n+g+d) 0.155 0.111 0.137 0.155 0.166 0.103 0.177 0.140 0.205 [5.760] [5.200] [3.850] [4.060] [6.090] [4.760] [4.330] [3.200] [5.280] ln(sh )-ln(n+g+d) 0.434 0.184 0.252 0.298 0.434 0.138 0.119 0.126 0.436 [10.530] [5.020] [5.240] [6.810] [10.590] [3.550] [2.370] [2.280] [9.900] ln(AICT) 0.265 0.051 0.138 0.027 0.314 0.094 0.212 0.120 [14.860] [12.660] [14.290] [2.150] [14.420] [13.840] [13.190] [1.920] CONSTANT 5.191 6.048 6.712 5.981 5.155 6.206 7.544 7.092 5.032 [17.440] [24.960] [17.100] [15.960] [17.380] [25.030] [17.780] [15.460] [15.320] R2 (within group) 0.295 0.56 0.623 0.671 0.30 0.552 0.779 0.755 0.198 Obs. 465 465 310 293 465 465 196 181 465 Countries 97 97 74 70 97 97 51 51 97
In the G2SLS panel estimate ln(AICT )t is instrumented with ln(AICT )t -2, ln(AICT )t -3, and ln(AICT )t-4
Tab. 3 Growth regressions with and without ICT indicators
DEPENDENT VARIABLE: LOG DIFFERENCE GDP PER WORKING AGE PERSON (1985-1997)
(1991-1997) (1983-1997) MRW-TYPE ESTIMATE EQUATION (1) WITH ICT1 EQUATION (1) WITH ICT3 EQUATION (1) WITH ICT4 EQUATION (1) WITH THE COMPOSITE INDEX MRW EQUATION (1) WITH THE COMPOSITE INDEX ln(sk)-ln(n+g+d) 0.010 0.144 0.009 0.011 0.143 0.407 0.312 [4.818]* * [3.080] ** [3.437] ** [4.903] ** [3.440] ** [5.140]** [4.370]** ln(sh)-ln(n+g+d) 0.002 0.031 0.001 0.001 0.036 0.081 -0.0004 [2.814] ** [0.930] [1.146] [1.089] [1.280] [1.510] [-0.010] gICT 0.020 0.030 0.105 0.021 0.124 [0.790] [1.955]* [2.225]** [1.100] [5.500]** Ln(AICT(1985) ) 0.131 0.060 0.121 0.063 0.102 [3.040] ** [3.297] ** [4.199] ** [4.590] ** [4.500] Ln(Y/L)1985) -0.038 -0.041 -0.169 -0.240 -0.075 -0.095 -0.227 [-1.414] [-1.050] [-3.399] ** [-4.124] ** [-2.140] ** [-2.140]* [-4.630]** CONSTANT 0.170 -0.585 1.409 1.664 -0.171 -1.495 0.783 [0.857] [-1.410] [3.028] ** [3.457] ** [-0.420] [-4.010]** [1.330] R2 0.311 0.4208 0.520 0.557 0.4549 0.369 0.5346 Test: β=0 0.006 0.363 0.258 0.282 0.272 0.129 Implied λ 0.024 0.034 Countries 94 88 47 47 94 95 94
** 95 percent significance with bootstrap standard errors, * 90 percent significance with bootstrap standard errors. We use the percentile and bias corrected approach with 2000 replications.
DATA APPENDIX
Variabili ICT Telephone mainlines (per
1000 people) Internet hosts (per 10,000 people) Mobile phones (per 1,000 people) Personal computers (per 1,000 people)
id Country Name
First year Last year First year Last year First year Last year First year Last year
1 Algeria 1965 6.0 1997 47.5 1994 0.004 1997 0.011 1990 0.019 1997 0.508 1990 0.996 1997 4.200 2 Angola 1960 1.3 1997 5.3 1994 0.000 1997 0.015 1993 0.107 1997 0.608 1997 0.700 1997 0.700 3 Argentina 1960 44.3 1997 191.0 1994 0.368 1997 5.321 1989 0.072 1997 56.303 1988 4.430 1997 39.216 4 Australia 1960 148.0 1997 505.0 1994 90.037 1997 381.828 1987 0.271 1997 264.324 1988 103.030 1997 362.162 5 Austria 1960 60.8 1997 492.0 1994 34.002 1997 108.283 1985 1.291 1997 143.742 1988 39.474 1997 210.657 6 Bangladesh 1977 0.9 1996 2.6 1994 0.000 1996 0.000 1992 0.002 1995 0.021 #N/D -- 7 Barbados 1960 30.0 1997 404.0 1994 0.000 1997 0.755 1991 1.884 1997 29.888 1995 57.471 1995 57.471 8 Belgium 1960 85.1 1997 468.0 1994 17.250 1997 84.511 1986 0.385 1997 95.490 1988 50.556 1997 235.294 9 Benin 1960 0.9 1997 6.3 1994 0.000 1997 0.022 1995 0.192 1997 0.752 1995 0.547 1997 0.900 10 Bolivia 1980 25.2 1997 68.8 1994 0.000 1997 0.693 1991 0.074 1997 14.929 -- -- 11 Botswana 1970 7.3 1997 56.0 1994 0.000 1997 1.553 1995 0.000 1996 0.000 1994 6.993 1996 13.400 12 Brazil 1975 20.3 1997 107.0 1994 0.383 1997 4.196 1990 0.005 1997 27.500 1988 1.786 1997 26.250 13 Burkina Faso 1970 0.2 1997 3.2 1994 0.000 1997 0.046 1995 0.000 1997 0.135 1990 0.113 1997 0.700 14 Burundi 1965 0.4 1997 2.5 1994 0.000 1997 0.012 1993 0.061 1997 0.100 -- -- 15 Cameroon 1960 0.5 1997 5.3 1994 0.000 1997 0.054 1994 0.124 1997 0.302 1990 1.304 1995 1.504 16 Canada 1960 278.4 1997 609.0 1994 63.728 1997 227.928 1985 0.463 1997 138.900 1980 4.065 1997 270.627 17 Cape Verde 1960 0.9 1997 81.8 1994 0.000 1997 0.399 1995 0.000 1997 0.049 -- -- 18 Central African Republic 1978 1.1 1997 2.8 1994 0.000 1997 0.018 1995 0.013 1997 0.200 -- -- 19 Chad 1965 0.4 1997 1.1 1994 0.000 1995 0.000 1995 0.000 1997 0.000 -- -- 20 Chile 1960 17.3 1997 180.0 1994 2.181 1997 13.109 1989 0.376 1997 28.082 1988 4.688 1997 54.110 21 China 1975 1.8 1997 55.7 1994 0.005 1997 0.209 1987 0.001 1997 10.476 1988 0.268 1997 5.952 22 Colombia 1960 17.2 1997 148.0 1994 0.327 1997 1.724 1994 2.516 1997 34.807 1992 9.581 1997 33.425 23 Comoros 1970 1.1 1997 8.4 1994 0.000 1995 2.656 1995 0.000 1997 0.000 1970 0.000 1995 0.266 24 Costa Rica 1970 23.1 1997 169.0 1994 2.440 1997 12.295 1992 1.003 1997 18.559 -- -- 25 Denmark 1960 182.0 1997 633.0 1994 35.396 1997 259.278 1982 1.406 1997 272.727 1988 58.480 1997 360.200 26 Dominican Republic 1980 19.0 1997 87.5 1994 0.000 1997 0.031 1990 0.442 1997 16.049 -- -- 27 Ecuador 1965 9.3 1997 75.2 1994 0.290 1997 0.903 1994 1.598 1997 13.445 1991 1.905 1995 13.043 28 Egypt, Arab Rep. 1960 7.9 1997 55.6 1994 0.027 1997 0.314 1987 0.052 1997 0.116 1994 3.368 1997 7.300 29 El Salvador 1965 4.0 1996 56.1 1994 0.000 1997 0.337 1993 0.302 1997 6.779 -- -- 30 Ethiopia 1960 0.3 1997 2.6 1994 0.000 1997 0.000 1995 0.000 1997 0.000 -- -- 31 Fiji 1960 13.1 1997 91.9 1994 0.065 1997 0.000 1994 1.438 1997 6.658 -- -- 32 Finland 1960 96.6 1997 556.0 1994 133.847 1997 653.631 1982 0.549 1997 417.476 1990 100.000 1997 310.680 33 France 1960 48.0 1997 575.0 1994 14.447 1997 49.840 1986 0.163 1997 99.487 1988 55.258 1997 174.359 34 Ghana 1965 2.2 1997 5.7 1994 0.000 1997 0.153 1992 0.025 1997 1.200 1983 0.000 1997 1.600 35 Greece 1960 21.8 1997 516.0 1994 3.381 1997 18.733 1993 4.615 1997 89.333 1988 12.000 1997 44.762 36 Guatemala 1960 4.4 1997 40.8 1994 0.000 1997 0.839 1990 0.033 1997 6.114 1993 1.047 1995 3.006 37 Guinea 1960 0.6 1997 2.5 1994 0.003 1997 0.003 1993 0.006 1997 0.377 1994 0.054 1997 0.344 38 Guinea-Bissau 1960 0.5 1997 6.8 1994 0.000 1997 0.088 1995 0.000 1997 0.000 -- -- 39 Haiti 1981 3.6 1997 8.0 1994 0.000 1997 0.000 1995 0.000 1997 0.000 -- -- 40 Honduras 1975 5.6 1997 36.8 1994 0.000 1997 0.986 1995 0.000 1997 2.271 -- -- 41 Hong Kong, China 1960 25.7 1997 565.0 1994 20.591 1997 74.839 1984 0.186 1997 343.077 1988 25.688 1997 230.769 42 Hungary 1960 24.3 1997 304.0 1994 6.627 1997 33.302 1990 0.255 1997 69.314 1988 8.286 1997 49.020 43 Iceland 1960 187.5 1997 617.0 1994 169.551 1997 521.481 1986 10.864 1997 241.544 1990 39.063 1995 205.224 44 India 1960 0.7 1997 18.6 1994 0.004 1997 0.050 1995 0.083 1997 0.924 1988 0.185 1997 2.094 45 Indonesia 1960 0.8 1997 24.7 1994 0.009 1997 0.542 1984 0.011 1997 4.557 1988 0.581 1997 7.960 46 Ireland 1960 39.0 1997 411.0 1994 15.281 1997 90.224 1985 0.085 1997 146.027 1990 106.286 1997 241.300 47 Israel 1960 30.6 1997 450.0 1994 22.645 1997 104.764 1990 3.207 1997 282.572 1988 44.346 1997 186.125 48 Italy 1960 60.9 1997 447.0 1994 4.951 1997 36.849 1985 0.112 1997 204.100 1986 9.353 1997 113.043 49 Ivory Coast 1960 0.9 1997 9.3 1994 0.000 1997 0.175 1995 0.000 1997 2.353 1996 1.351 1997 3.268 50 Jamaica 1960 12.2 1996 140.0 1994 0.308 1997 1.366 1991 1.059 1996 21.667 1994 3.457 1996 4.563 51 Japan 1960 38.9 1997 479.0 1994 7.731 1997 75.794 1981 0.113 1997 303.968 1985 17.355 1997 202.381 52 Jordan 1960 13.7 1997 69.7 1994 0.000 1997 0.383 1990 0.338 1995 2.114 1994 5.769 1997 8.700 53 Kenya 1965 2.8 1997 8.1 1994 0.000 1997 0.160 1992 0.044 1997 0.162 1990 0.348 1997 2.300 54 Korea, Rep. 1965 7.7 1997 444.0 1994 4.020 1997 28.782 1986 0.172 1997 150.217 1988 11.190 1997 150.652 55 Luxembour g 1960 116.1 1997 669.0 1994 12.525 1997 91.435 1985 0.109 1997 160.766 1996 375.303 1996 375.303 56 Madagascar 1965 1.5 1997 2.7 1994 0.000 1997 0.029 1994 0.021 1997 0.300 1997 1.300 1997 1.300
DATA APPENDIX(continued)
Variabili ICT Telephone mainlines (per
1000 people) Internet hosts (per 10,000 people) Mobile phones (per 1,000 people) Personal computers (per 1,000 people)
id Country Name
First year Last year First year Last year First year Last year First year Last year
57 Malawi 1965 0.9 1997 4.0 1994 0.000 1997 0.000 1995 0.039 1996 0.366 -- -- 58 Malaysia 1960 5.8 1997 195.0 1994 0.815 1997 18.707 1986 0.675 1997 113.364 1988 4.142 1997 46.083 59 Mali 1960 0.3 1997 2.0 1994 0.000 1997 0.028 1995 0.000 1997 0.247 1995 0.278 1997 0.600 60 Malta 1960 29.7 1997 498.0 1994 0.000 1997 20.933 1991 6.333 1997 47.074 1990 14.045 1995 80.645 61 Mauritania 1970 0.4 1997 5.4 1994 0.000 1997 0.000 1995 0.000 1997 0.000 1996 5.319 1996 5.319 62 Mauritius 1960 9.1 1997 195.0 1994 0.000 1997 1.838 1990 2.075 1997 32.456 1987 0.456 1997 78.947 63 Mexico 1960 9.7 1997 96.0 1994 0.720 1997 3.735 1988 0.018 1997 18.154 1988 4.469 1997 37.344 64 Morocco 1960 6.7 1997 49.9 1994 0.000 1997 0.325 1987 0.003 1997 2.709 1993 1.149 1997 2.545 65 Mozambiqu e 1960 1.2 1997 3.6 1994 0.000 1997 0.026 1995 0.000 1997 0.137 1996 0.843 1997 1.600 66 Myanmar 1960 0.5 1997 4.6 1994 0.000 1997 0.001 1993 0.015 1997 0.183 -- -- 67 Namibia 1981 31.1 1997 58.0 1994 0.000 1997 2.157 1995 2.258 1997 7.764 1996 12.658 1997 18.600 68 Nepal 1975 0.5 1997 7.7 1994 0.000 1997 0.074 1995 0.000 1997 0.000 -- -- 69 Netherlands 1960 90.8 1997 564.0 1994 55.807 1997 218.851 1985 0.331 1997 109.554 1988 50.676 1997 280.255 70 New Zealand 1960 225.9 1997 486.0 1994 87.193 1997 413.927 1987 0.738 1997 149.077 1991 96.802 1997 263.852 71 Nicaragua 1970 8.2 1997 29.3 1994 0.114 1997 1.589 1993 0.079 1997 1.818 -- -- 72 Niger 1960 0.2 1997 1.6 1994 0.000 1997 0.035 1995 0.000 1997 0.010 1997 0.200 1997 0.200 73 Nigeria 1960 0.4 1996 3.5 1994 0.000 1997 0.001 1993 0.086 1995 0.117 1993 3.810 1997 5.100 74 Norway 1960 126.8 1997 621.0 1994 111.43 1997 474.635 1981 0.407 1997 380.700 1991 145.54 1997 360.800 75 Pakistan 1960 1.3 1997 18.5 1994 0.000 1997 0.075 1990 0.018 1997 0.797 1990 1.339 1996 4.478 76 Panama 1978 59.6 1997 134.0 1994 0.066 1997 1.434 1995 0.000 1997 6.250 -- -- 77 Papua New Guinea 1965 1.9 1996 10.6 1994 0.000 1997 0.176 1995 0.000 1996 0.693 -- -- 78 Paraguay 1960 4.6 1997 42.8 1994 0.000 1997 0.470 1992 0.332 1997 16.600 -- -- 79 Peru 1965 7.2 1997 67.5 1994 0.073 1997 2.671 1990 0.076 1997 17.869 1995 5.957 1997 12.300 80 Philippines 1965 2.5 1997 29.0 1994 0.050 1997 0.586 1991 0.557 1997 17.687 1988 2.058 1997 13.600 81 Poland 1960 18.1 1997 194.0 1994 2.796 1997 11.225 1992 0.057 1997 22.145 1988 3.968 1997 36.176 82 Portugal 1960 11.5 1997 402.0 1994 5.100 1997 18.247 1989 0.284 1997 151.911 1988 14.344 1997 74.447 83 Puerto Rico 1975 81.1 1997 351.0 1994 0.222 1997 0.298 1987 1.153 1996 45.187 -- -- 84 Qatar 1960 13.3 1997 249.0 1994 0.000 1997 4.787 1990 7.856 1997 76.450 1994 46.555 1996 62.724 85 Reunion 1970 18.2 1997 351.0 1994 0.000 1997 0.000 1991 4.484 1997 39.673 -- -- 86 Romania 1965 16.0 1997 167.0 1994 0.230 1997 2.659 1993 0.035 1997 8.900 1990 0.431 1997 8.900 87 Rwanda 1960 0.4 1996 2.7 1994 0.000 1997 0.008 1995 0.000 1997 0.000 -- -- 88 Senegal 1960 2.9 1997 13.2 1994 0.000 1997 0.313 1994 0.012 1997 0.792 1981 0.002 1997 11.400 89 Seychelles 1965 4.9 1996 196.0 1994 0.000 1997 4.508 1995 4.329 1996 15.132 -- -- 90 Sierra Leo. 1965 1.1 1997 3.9 1994 0.000 1997 0.000 1995 0.000 1997 0.000 -- -- 91 Singapore 1960 22.7 1997 543.0 1994 15.631 1997 195.502 1988 3.789 1997 273.400 1988 42.105 1997 399.500 92 Solomon Islands 1982 6.1 1997 19.3 1994 0.000 1997 0.050 1994 0.393 1997 1.629 -- -- 93 Somalia 1960 0.3 1996 1.5 1994 0.000 1995 0.000 1995 0.000 1997 0.000 -- -- 94 South Afr. 1960 37.3 1997 107.0 1994 6.693 1997 28.932 1989 0.107 1997 36.951 1988 4.144 1997 41.570 95 Spain 1960 42.1 1997 403.0 1994 7.053 1997 30.980 1986 0.044 1997 110.433 1988 17.857 1997 122.137 96 Sri Lanka 1960 2.3 1997 17.0 1994 0.000 1997 0.329 1990 0.059 1997 6.183 1990 0.176 1997 4.086 97 Sudan 1960 1.5 1997 4.0 1994 0.000 1997 0.001 1995 0.000 1997 0.136 1994 0.195 1997 1.147 98 Suriname 1975 28.8 1997 146.0 1994 0.000 1997 0.000 1993 2.609 1997 9.359 -- -- 99 Swaziland 1970 5.9 1996 24.0 1994 0.000 1997 2.504 1995 0.000 1997 0.000 -- -- 100 Sweden 1960 279.3 1997 679.0 1994 84.741 1997 321.464 1981 2.452 1997 358.192 1988 59.242 1997 350.282 101 Switzerland 1960 203.4 1997 661.0 1994 67.597 1997 208.843 1987 0.827 1997 146.685 1988 52.317 1997 394.922 102 Syrian A. R. 1960 8.5 1997 87.7 1994 0.000 1997 0.000 1995 0.000 1997 0.000 1994 0.362 1997 1.700 103 Tanzania 1960 0.7 1997 3.3 1994 0.000 1997 0.020 1994 0.013 1997 0.641 1997 1.600 1997 1.600 104 Thailand 1960 1.4 1997 80.0 1994 0.294 1997 2.111 1986 0.016 1997 33.003 1988 1.842 1997 19.802 105 Togo 1960 0.7 1997 5.8 1994 0.000 1997 0.014 1995 0.000 1997 0.694 1995 3.623 1997 5.787 106 Trinidad and Tobago 1965 24.7 1997 190.0 1994 0.000 1997 3.236 1991 0.361 1997 13.594 1991 4.237 1995 20.000 107 Tunisia 1960 6.2 1997 70.1 1994 0.061 1997 0.016 1987 0.030 1997 0.821 1990 2.602 1997 8.574 108 Turkey 1960 6.4 1997 250.0 1994 0.308 1997 3.602 1986 0.007 1997 25.596 1988 2.235 1997 20.668 109 Uganda 1965 1.2 1997 2.4 1994 0.000 1997 0.013 1995 0.091 1997 0.240 1995 0.518 1997 1.400 110 Un. Kingdom 1960 96.1 1997 540.0 1994 38.713 1997 148.834 1985 0.883 1997 151.300 1985 37.102 1997 242.373 111 United 1960 272.7 1997 644.0 1994 121.80 1997 442.013 1984 0.386 1997 206.343 1981 9.217 1997 406.716
114 Yemen,
Rep. 1980 2.0 1997 13.3 1994 0.000 1996 0.001 1992 0.124 1996 0.554 1997 1.200 1997 1.200
115 Zambia 1965 4.7 1996 9.4 1994 0.087 1997 0.270 1995 0.165 1996 0.329 -- --