I
Alma Mater Studiorum – Università di Bologna
DOTTORATO DI RICERCA IN
ONCOLOGIA, EMATOLOGIA E PATOLOGIA
Ciclo XXXI
Settore Concorsuale: 06/D3 Settore Scientifico Disciplinare: MED/06
RESISTANCE MECHANISMS AND
NOVEL THERAPEUTIC OPPORTUNITIES
IN GASTROINTESTINAL STROMAL TUMORS (GISTs)
Presentata da:
Gloria Ravegnini
Coordinatore Dottorato Supervisore
Chiar.Mo Prof.
Pier-Luigi Lollini
Chiar.Ma Prof.ssa
Maria Abbondanza Pantaleo
Index
General background ... 1
1. Gastrointestinal Stromal Tumor ... 1
1.1. Brief history of GISTs ... 1
1.2. Epidemiology, clinical features and prognosis of GISTs ... 1
1.3. Histopathology ... 3
1.4. Oncogenic mutations in KIT and PDGFRA genes ... 4
1.5. KIT/PDGFRA wild-Type GISTs ... 8
1.6. Treatment of GISTs ... 12
2. Pharmacogenetics and Epigenetics ... 19
3. microRNA ... 21
3.1. Biogenesis of miRNAs ... 22
3.2. Mechanism of action ... 23
3.3. miRNAs and cancer ... 23
4. Aim ... 25
5. Fist aim: identification of potential novel biomarkers correlated with GIST pathogenesis ... 26
5.1. Materials and Methods ... 26
5.2. Results ... 34
5.3. Discussion ... 51
6. Second aim: Characterization of novel mechanisms of pharmacological resistance to a PI3KCA inhibitor from an omic point of view ... 54
6.2. Results ... 59
6.3. Discussion ... 67
7. Conclusion ... 70
1
General background
1. Gastrointestinal Stromal Tumor
1.1. Brief history of GISTs
Gastrointestinal stromal tumors (GISTs) are rare sarcomas, which represent the most common mesenchymal tumor of the gastrointestinal (GI) tract 1. Three milestones have characterized the history of GISTs. In 1941, for the first time, Golden and Stout characterized a group of mesenchymal tumor arising in the bowel wall 2, but in 1983 Mazur and Clark proposed the term “stromal tumor” for this specific disease 3. The second milestone was in 1998, when a groundbreaking publication by Hirota and colleagues reported activating mutations in the KIT receptor tyrosine kinase (RTK) gene in GISTs as well as expression of KIT protein by immunohistochemistry (IHC) 4. Finally, the last milestone took place with the introduction of tyrosine kinase receptor inhibitor (TKI), imatinib, which led to a terrific improvement of GIST patients’ prognosis 5.
1.2. Epidemiology, clinical features and prognosis of GISTs
Even if rare, GISTs represent the most common mesenchymal neoplasia of the GI tract. The true incidence of GIST in the US and Europe is hard to determine, as GISTs have only been accurately recognized and diagnosed as an entity since the late ‘90s. The incidence of these tumors is geographically variable, from 4.3–6.8 cases per million to 19–22 cases per million 6. It is estimated that incidence rates of GIST in US is 11-14 cases/ 1000000 with 4000-6000 new cases per year 7; similar incidence rates have been found in Europe 8,9.
Regarding to sex differences, there is a slight prevalence in males. The median age is around 60– 65 years, but cases in patients younger than 40 are rare, and only 1% interest patients aged < 21. However, pediatric GISTs represent a clinically and molecularly distinct subset 10,11.
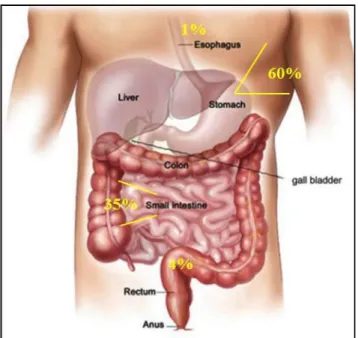
GISTs occur throughout the GI tract and are most commonly found in the stomach (60%), small intestine (35%, specifically, jejunum and ileum (30%) and duodenum (5%)), colorectum (4%), and rarely in the esophagus and appendix (Figure 1) 10,12,13.
The tumors are generally between 1 and 40 cm in diameter at the time of diagnosis and may cause mass-related symptoms or anemia as a result of mucosal ulceration 14. Patients with GIST, often, do not experience any specific symptoms or signs and when symptoms do occur, they may be vague. Clinical symptoms associated with GIST include abdominal pain, fatigue, dysphagia, satiety, nausea and vomiting, vomiting blood, blood in the stool and obstruction. Patients may present with chronic GI bleeding (causing anemia), or acute GI bleeding (caused by erosion through the gastric or bowel mucosa) or rupture into the abdominal cavity causing life-threatening intraperitoneal hemorrhage. It is not uncommon that a GIST is discovered by chance when a person has an imaging test for an unrelated concern or condition 15.
1.3. Histopathology
As mentioned above, GISTs – commonly arising within the muscle of GI tract – may range from 1 cm to more than 40 cm in size, and 5 cm is considered the average size.
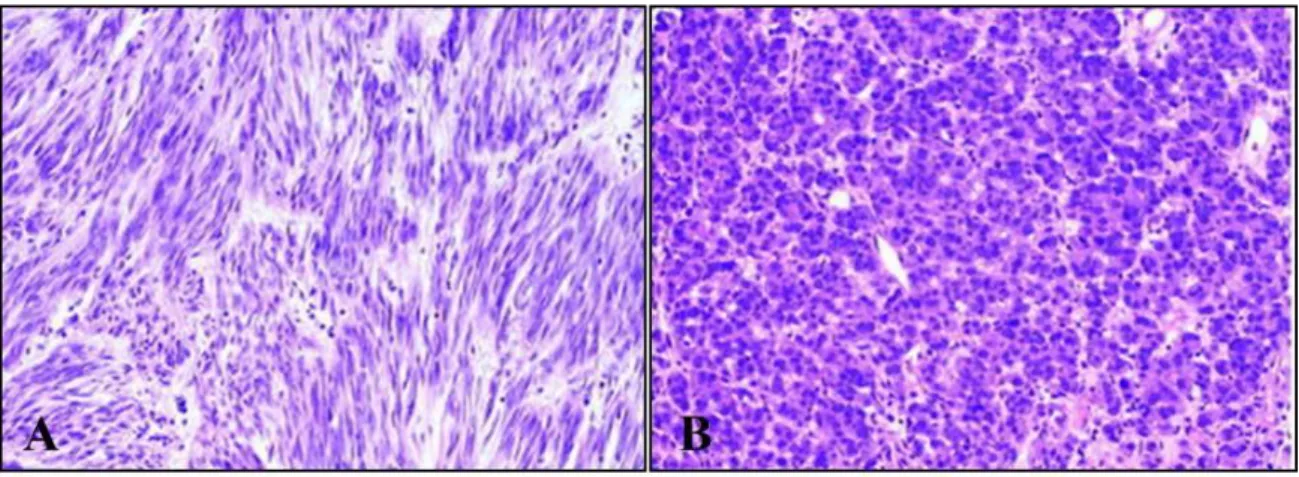
GISTs probably originate from the interstitial cells of Cajal (ICC) or their precursors 16. ICCs generate a periodic depolarization – referred to as pacemaker activity – in the GI tract controlling intestinal motility 16,17. Moreover, similar to GISTs, ICCs express the RTK KIT, encoded by c-KIT gene. In general, small GISTs tend to form intramural masses, while larger GISTs make external masses and involve muscular layers 14. Morphologically, it is possible to distinguish three main histological subtypes in GISTs: i) spindle cell type (~70% of the cases), ii) epithelioid type (~20%), and iii) mixed spindle cell and epithelioid type (~10%) (Figure 2). The spindle cells are monomorphic, with rounded to elongated nuclei and made up of cells in short fascicles. Epithelioid cell GISTs are characterized by round cells arranged in nests or sheets and with eosinophilic to clear cytoplasm; cells are polygonal with round, centrally located nuclei. Finally, approximately 10% of GISTs show mixed morphology, being composed of both spindle and epithelioid cells 18.
Figure 2. Example of GIST cells’ morphology. A) GIST composed of spindle cells (hematoxylin-eosin, original magnification ×200). B) GIST composed of epithelioid cells (hematoxylin-eosin, original magnification ×200) 18
1.4. Oncogenic mutations in KIT and PDGFRA genes
With the identification of the specific mutation in KIT gene in 1998 by Hirota et al 4, the history of this tumor was completely changed. Today, it is well established that about 80-85% of GISTs harbor a gain of function mutation in KIT or PDGFRA genes. KIT and PDGFRA genes are
Figure 3. Structure of RTK
adjacently located on chromosome 4q12 and encode RTK class 3. KIT and PDGFRA receptors share structural features and are composed of an extracellular (EC) ligand-binding domain, a transmembrane domain, a juxtamembrane domain (JM), and two cytoplasmic kinase domains (TK1, which includes ATP binding pocket, and TK2, the kinase activation loop) (Figure 3) 19,20. In physiological conditions, KIT and PDGFRA are activated by binding of their ligands to the EC domain, stem cell factor (SCF) and Platelet Derived Growth Factor Subunit A (PDGFA), respectively. Ligand binding leads to the receptor homodimerization and subsequent cross phosphorylation of specific cytoplasmic tyrosine residues, which act as binding sites for a plethora of signaling proteins involved in pivotal processes, such as cell proliferation, adhesion, motility, apoptosis, chemotaxis, and survival 21. The via activated by phosphorylation includes RAS/RAF/MEK, and PI3K/AKT/mTOR, and MAPK cascade 21,22 (Figure 4).
Figure 4. Main pathways activated by the tyrosine-kinase receptor - KIT and its effects on carcinogenesis 22 Figure from De Melo et al, 2012
In KIT, different tyrosine residues including Tyr 568, Tyr 570, Tyr 703, Tyr 721, Tyr 730, Tyr 823, Tyr 900, and Tyr 936 may be phosphorylated.
Phosphorylated tyrosines, and adjacent aminoacidic residues, form specific binding sites for downstream signaling molecules and promote activation of specific downstream signaling pathways (Figure 5) 23. For example, it has been reported that Tyr 721 acts as the docking site for the activation of PI3 kinase and its downstream signaling pathway regulates cell survival and proliferation; Tyr 703 and Tyr 936 are docking sites for activation of Grb2 protein, which is involved in activation of RAS/RAF/MEK/ERK signaling cascade 23.
Figure 5. Schematic representation of the Tyr residues that may be phosphorylated and their interaction
molecules
Genetic alterations in KIT or PDGFRA genes involve two main regions, the receptor regulatory domains (dimerization region in the EC and JM domains) and the enzymatic domains (TK1 and TK2).
The mutations characterizing GISTs are gain of function mutations and lead to a constitutive receptor activation, in a ligand-independent manner.
Figure 6. Schematic representation of KIT exons harboring primary mutations in GISTs
Approximately 80% of GISTs carry KIT pathogenic activating mutations, whereas 5% to 10% harbor activating mutations of the PDGFRA 24,25. Regarding KIT receptor, in GISTs the majority of mutations (~65%) involve the JM domain (exon 11) followed by mutations involving the EC dimerization domain (exon 9), retrieved in about 10% of cases. Primary KIT mutations can also involve exon 13 (TK1) and exon 17 (TK2), but these mutations are quite rare (~2%) (Figure 6) 26.
With regard to PDGFRA, the most common PDGFRA mutation involves the exon 18 at codon 842 (~5%), and leads to a substitution of an aspartic acid (D) with a valine (V) (D842V) 27, while mutations on exon 12 and 14 are less frequent 27. KIT and PDGFRA oncogenic alterations are mutually exclusive in GISTs and are driver events in GIST pathogenesis 28.
1.4.1. Mutations in KIT gene
Figure 7. Schematic representation of main mutations in KIT exon 11
As mentioned before, the majority of mutations in KIT involve exon 11 and exon 9. Mutations can be aminoacid substitutions, in-frame deletions or insertions
.
With regard to exon 11, it has been observed that these kinds of alterations are associated with rupture ofsecondary structure of JM domain, leading to dimerization and receptor autophosporylation with consequent activation. The kinds of mutations occurring in this hot-spot are heterogeneous, including in-frame deletions of variable sizes, point mutations, deletions preceded by substitutions or a combination of these. The most common site of KIT mutations is in the 5’end of exon 11. In general, exon 11 deletions are associated with a more aggressive behavior if compared with the single aminoacid substitution; in particular, deletions affecting codons WK557–558 indicate a poor prognosis. Another hot spot, but less frequent, is located at the 3’ end of exon 11, that is characterized mostly by internal tandem duplication. GISTs with these type of mutations usually show a more indolent clinical evolution 29
.
Figure 7 shows the major mutations harbored in KIT exon 11 (K549 to W581) reported in COSMIC. It is possible to observe the wide heterogeneity in genetic alterations’ type. The main hot spots are aminoacids 557-558 and 559-560 30,31. With regard
to exon 9, the most frequent mutation is represented by a duplication of six nucleotides (nts) encoding Ala-Tyr (at position 502–503) at the COOH terminus of the EC domain. Usually, GISTs harboring KIT exon 9 mutations have small bowel location and an aggressive clinical behavior 32.
1.4.2. Mutations in PDGFRA gene
GISTs with PDGFRA mutations represent a small subset; it has been previously reported that tumors with these specific alteration arise primarily in the stomach, mesentery and omentum 33. PDGFRA mutant GISTs have an epithelioid morphology, while spindle cells dominate the KIT
mutant ones; in addition, up to 40% of these tumors are weak or negative for KIT expression in IHC. The mutational hot-spot in PDGFRA is codon 842 on exon 18, but other codons may be involved in aminoacid substitution or in-frame deletions and deletion/substitutions, as codon 845 to 848. PDGFRA exon 18 mutations are believed to aberrantly stabilize the kinase activation loop 34. The principal difference with respect to KIT mutant GISTs is the location of primary mutations. Indeed, the majority of KIT mutations in GISTs arise in the JM domain (exon 11), but only ~10% of PDGFRA mutations are in this region (exon 12). On the contrary, mutations in the activation loop
of KIT (exon 17) are rare events (<1%), but they are predominant in PDGFRA mutant GISTs (exon 18) 33. The tumor genotype and specific type of KIT/PDGFRA mutation are important for the clinical outcome to TKIs and they will be discussed in the following paragraphs.
1.5. KIT/PDGFRA wild-Type GISTs
1.5.1. SDH-deficient GISTs
About 10-15% of adult GISTs and 85% of the pediatrics do not present any alteration in KIT or PDGFRA genes and are referred to as KIT/PDGFRA wild-type (WT) GISTs. The major part of
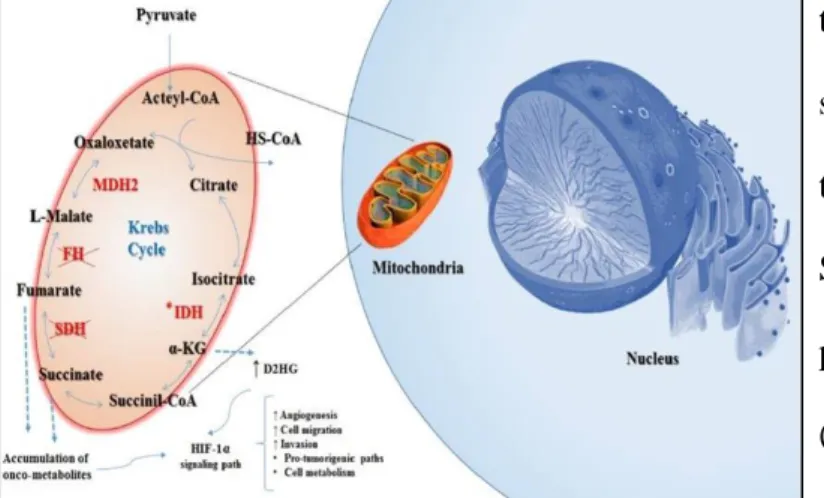
Figure 8. SDH deficiency promotes accumulation of oncometabolites, which leads to HIF1α-pathway activation
these are associated with hereditary syndromes, including neurofibromatosis type 1 (NF1), Carney triad (CT), Carney-Stratakis syndrome (CSS), and hereditary paraganglioma/pheocromocitoma
(HPGL/PCC) syndrome. In the last years, substantial advances in knowledge of GISTs led to
understand that KIT/PDGFRA WT GISTs are a heterogeneous group of different diseases 35. Indeed, it is well known that between 20-40% of all KIT/PDGFRA WT GISTs are succinate dehydrogenase complex (SDH)-deficient GISTs. SDH is a mitochondrial enzyme composed of four subunits, each of which encoded by four different genes SDHA, SDHB, SDHC, and SDHD 6. KIT/PDGFRA WT-(SDH)-deficient GISTs are recognized by IHC SDHB loss of expression, often
due to germline and/or somatic loss of function mutations in any of the four SDH subunits. Frequently, SDH deficiency in tumor cells is due to a combination of a loss of function germline mutations in one of the SDH subunit genes and somatic loss of function mutations in the tumor cells, promoting inactivation of both alleles 36. Recently, several papers have reported that SDH inactivation may involve also epigenetic mechanisms as methylation of SDHC promotor 37. The
SDH-complex takes part in the Krebs cycle and is responsible for conversion of succinate to fumarate. Therefore, SDH-deficient cells accumulate succinate, which promotes HIF1α overexpression and HIF translocation into nucleus. Overexpressed HIF proteins leads to aberrant transcription factors and to expression of hypoxia-associated tumorigenic responses and angiogenesis (Figure 8) 36. SDH-deficient GISTs are characterized by a peculiar gene expression signature that differs from the one observed in KIT/PDGFRA mutant GISTs; among the group of genes differentially expressed, one of the most important is the insulin-like growth factor 1 receptor (IGF1R), which is overexpressed in SDH-deficient GISTs but lost in KIT/PDGFRA mutant ones 38,39. SDH-deficient GISTs show a number of clinically unique features such as young age, female gender predilection, gastric localization, mixed epithelioid and spindle cell morphology, diffuse KIT and DOG1 IHC positivity, frequent lymphnode metastatic involvement, and an indolent behavior 35,40.
1.5.2. BRAF/RAS mutant GISTs
Besides SDH-deficient, other subsets of KIT/PDGFRA WT GISTs have been characterized. Indeed, it has been reported that 5-13% of KIT/PDGFRA WT GISTs harbor a BRAF V600E mutation; BRAF is a pivotal intracellular protein kinase, involved in the RAS/RAF/MEK/ ERK signaling pathway. More than 90% of BRAF mutations occur in exon 15, resulting in the substitution of valine at codon 600 with a glutamic acid (V600E) 41. The V600E mutation increases BRAF activity due to creation of a salt bridge with K507. This interaction V600E - K507 mimics the conformational changes that happen during dimerization, and for this reason, BRAF V600E does not depend on dimerization for increased kinase activity 42. Usually, these BRAF mutant GISTs arise in the small intestine, in middle-aged females, and have a high mitotic rate and early metastasis 6,35,43.
KRAS mutations in GISTs have a low frequency, spanning from ~1% to 11% of KIT/PDGFRA WT
GISTs 41. These alterations may be present with KIT or PDGFRA mutations or as genetic event in KIT/PDGFRA WT GISTs 44,45. In a recent study from Hechtman et al. in 267 GISTs, one single
KIT/PDGFRA WT GIST carried a KRAS mutation (p.G12V), which showed an aggressive behavior
and resistance to multiple TKIs 46.
1.5.3. NF1 mutant GISTs
A hereditary condition leading to an increased incidence of GIST is an autosomal-dominant inherited disease referred to as NF1. NF1 is characterized by specific nerve, dermal and ocular manifestations, including café-au-lait spots, dermal neurofibromas and ocular manifestations, Lisch nodules, and optic glioma.
Figure 9. The signaling pathway displays the oncogenic Ras signaling pathway as well as tumor suppressor NF1.
NF1 gene has more than 60 exons and represent one of the largest human genes; it encodes neurofibromin, a tumor suppressor that downregulates the RAS/RAF/MEK/ERK via (Figure 9). ~7% of NF1 patients develop a GIST during their lifetime. GISTs arising in the setting of NF1 are SDHB positive and immunohistochemically positive for IGF1R expression 35,40. The majority of NF1-associated GISTs arise in the small intestine, with infrequent gastric exceptions. Morphologically, NF1-associated GISTs present spindle cells, are correlated with Cajal cell hyperplasia and associated with GI motility disorders 6
.
GISTs with mutations in BRAF/RAS or NF1 might be referred to as RAS-pathway (RAS-P) mutant GIST.1.5.4. Quadruple WT GISTs
Recently, Pantaleo and coworkers, through massively parallel sequencing and gene expression analyses, reported for the first time the existence of an additional subset of KIT/PDGFRA WT GISTs 47. This subgroup has been named as quadruple WT (q-WT) because no genetic alterations
in KIT/PDGFRA/SDH/RAS have been found. Transcriptome profile of this small group is deeply different from other GISTs, and q-WT GISTs could represent another unique group within the family of GISTs 35,47. To date, even if additional research groups have extensively worked on this new group of tumors, it has not been identified a common genetic driver event. On the contrary, a great molecular heterogeneity, with various and probably mutually exclusive mutational events, has been described 35. Figure 10 summarizes the majority of mutations retrieved in q-WT GISTs.
Figure 10. q-WT GISTs are a heterogeneous family of tumors with different genetic events. Figure edited from Nannini et al, 2017
However, given this pronounced molecular heterogeneity and besides the unquestionable GIST morphology, q-WT GISTs could represent a different disease than GISTs, deriving from a distinct population of ICCs.
1.6. Treatment of GISTs
The standard chemotherapy is not effective in GISTs. However, until the introduction of TKIs at the beginning of 2000, doxorubicin and ifosfamide were used with low activity in GISTs compared to other soft tissue sarcomas, with a response rate < 5% 48. The median survival was approximately 9 months 49. Today, GIST management for immunohistologically confirmed GISTs plans: i) surgical resection for resectable GISTs without metastasis; ii) administration of TKIs such as imatinib for unresectable, metastatic, or recurrent GISTs 9,50,51. The standard treatment for localized and resectable GISTs is the complete surgical resection of the lesion, with no tumor rupture. Indeed, tumor rupture is associated with a high risk of relapse and, for this reason, the laparascopic approach is discouraged for patients with large tumors. Ideally, the excision should have margins clear of tumor cells. GISTs sized up to 5 cm are managed through laparoscopic surgery which show terrific survival rates (92–96%) 1. Larger GISTs need open surgery and broad resections. Total gastrectomy may be needed for very large or multiple and recurrent GISTs including SDH-deficient GISTs in young patients. After surgical resection, the risk of relapse may be considerable, as defined by available risk classifications 52. 3 years of adjuvant treatment with imatinib (see below) is considered the standard approach for patients with a high risk of relapse. On the contrary, adjuvant therapy should not be considered when the risk is low, whereas decision-making should be discussed when the risk is intermediate 53.
1.6.1. Imatinib mesylate
In locally advanced inoperable and metastatic patients, imatinib is the standard treatment. Imatinib has been introduced in management of GIST at the beginning of 2000, led to a terrific improvement of prognosis of patients 5,54.
Imatinib mesylate (formerly STI571, Gleevec® (United States) or Glivec® (Europe), Novartis) represents one of the most successful example of target therapy. In the late ‘80s, scientists at Ciba
Geigy (now Novartis), started a project on the identification of compounds with inhibitory activity against protein kinases. The most promising molecule was STI571, which in vitro showed potent activity against all of the ABL tyrosine kinases, including ABL, viral ABL (v-ABL), and BCR-ABL. In contrast, STI571 was inactive against serine/threonine kinases, did not inhibit the epidermal growth factor (EGF) receptor intracellular domain, and showed weak or no inhibition of the activity of the receptors for vascular endothelial growth factor (VEGFR-1 and VEGFR-2), fibroblast growth factor receptor 1 (FGFR-1), c-MET, and nonreceptor tyrosine kinases of the SRC family (FGR, LYN, and LCK). In 1998, a phase 1 trial with imatinib started in patients with chronic myeloid leukemia (CML), revolutionizing the treatment of this kind of blood tumor 55. Imatinib is a selective inhibitor, which binds competitively the ATP binding site of the target kinases including ABL, BCR-ABL, KIT, PDGFRA, PDGFRB, and receptor of macrophage-colony stimulating factor (CSF1R). This binding is due to the fact that imatinib mimics adenosine triphosphate (ATP) and can compete with ATP (Figure 11) 56.
Figure 11. Mechanism of action of imatinib. A) Physiological conditions: ATP binds KIT or PDGFRA, promoting proliferation and survival. B) Imatinib binds the ATP structure and binds ATP binding pocket, preventing
In GIST cells, ATP binds to the active site of KIT or PDGFRA where it donates a phosphate to either KIT or PDGFRA, resulting in autoactivation, or to substrate molecules, resulting in activation of signal transduction. Imatinib, binding to the same site as ATP, prevents phosphorylation of downstream substrates and leads to inhibition of KIT or PDGFRA signaling 56.
The first patient treated with imatinib in 2000 had a rapidly progressive metastatic GIST that was resistant to chemotherapy; after 4 weeks of imatinib treatment, the patient had a complete metabolic response and many of the liver metastases became hypodense (Figure 12) 57. The success in treating this patient quickly led to a multicenter trial which involved the Dana-Farber Cancer Institute, Fox-Chase Cancer Center, Oregon Health & Science University Cancer Institute, and the University of
Figure 12. PET Studies with [18F]Fluorodeoxyglucose. A) Before STI571 therapy there were multiple metastases in the liver and upper abdomen. B) After four weeks of treatment, there was no abnormal uptake of tracer in the liver or right kidney
Helsinki 5. In the trial, 147 adult patients, with a histologically confirmed, unresectable or metastatic GIST which expressed CD117, were enrolled. Patients were randomly treated either with 400 mg or 600 mg of imatinib; the tumor response was evaluated after one month, three months, and six months, and every six months. No patient had a complete response, but ~54% of the patients had a partial response; in addition, ~28% of patients had stable disease, and disease progression was noted in 14% of patients within three months after study entry. In general, imatinib was well tolerated, with adverse effects from mild to moderate and similar to those reported in patients with CML 5. Similar results were observed in another phase I trial from the European Organization for Research and Treatment (EORTC). Based on the results from these two trials, imatinib was approved by the US Food and Drug Administration (FDA) for the treatment of unresectable and metastatic GIST on February 1st, 2002. Overall, imatinib achieved disease control in 70–85% of patients with
KIT-positive GIST, with a median progression free survival (PFS) of 20–24 months, and an estimated overall survival (OS) over 36 months 49.
1.6.1.1 Correlation of kinase genotype and imatinib clinical outcome
The first study investigating the correlation between the tumor genotype and imatinib clinical response dates back to 2003 58. In particular, Heinrich et al analyzed the tumor genotype and the clinical outcome of 127 patients enrolled onto a phase II trial of imatinib for metastatic GISTs 5, but a larger study involving 428 GIST cases was conducted later, in 2008, by the same authors 59. The results reported by the studies were concord, and showed that KIT exon 11 genotype had favorable impact on the imatinib response compared with GISTs with a KIT exon 9 mutation or WT genotypes. No significant difference in OS between patients whose tumors had a KIT exon 9 mutant or a WT genotype were observed 59. In addition, it was reported that patients with KIT exon 9 mutant GISTs, who were treated with imatinib 800 mg, had a higher objective response rate compared with patients who were treated with imatinib 400 mg 59. With regard to PDGFRA mutations, GISTs with PDGFRA point mutations D842V showed a primary resistance to imatinib therapy, consistent with in vitro data 58.In general, according to the Clinical practice guidelines for GISTs released in 2018 by the European Society of Medical Oncology (ESMO), the standard dose of imatinib is 400 mg daily 9. However, data have shown that patients with tumors harboring the KIT exon 9 mutation have significantly better PFS on an 800 mg daily dose, which is considered the standard treatment in this subgroup. In metastatic GISTs, treatment with imatinib should be continued indefinitely, considering that stopping treatment is generally followed by relatively rapid tumor progression.
1.6.1.2 Resistance to imatinib treatment
As described below, ~80% of GISTs patients get benefits from imatinib treatment, however, after a median time of 24 months, a remarkable number of them become resistant 60. It has to be considered that KIT receptor may either be configured in an “open/on” conformation which allows ATP to bind or a “closed/off “ conformation which facilitates phosphorylation of substrates.
Imatinib can bind KIT receptor only when it is in the open conformation and maintains the receptor in this state. The majority of KIT and PDGFRA mutations lead to the open conformation, thereby reducing the efficacy of imatinib 60. The term primary resistance is used to indicate patients showing progression within 3–6 months of initiating imatinib; approximately 15–20% of patients are primary resistant and most of the WT GISTs and PDGFRA D842V mutant patients display primary resistance 61. On the contrary, progression after more than 6 months of clinical response is defined as secondary or acquired resistance. Secondary mutations have only been found in patients with primary KIT mutations and rarely in those with primary PDGFRA mutations. Resistant mutations are most often found in the ATP-binding pocket of the kinase domain (exons 13 and 14) or in the kinase activation loop (exons 17 and 18) 61. Despite the acquisition of secondary mutations, mechanisms of delayed resistance may include: i) overexpression of KIT due to genomic amplification, (ii) loss of KIT expression with activation of an alternative tyrosine kinase, and (iii) ABC transporters overexpression, which may also represent a method for tumor cells to become resistant to TKIs.
Therapeutic options for GIST patients progressed on imatinib consider dose escalation from 400 to 800 mg /daily or switch to the second and third line TKIs.
1.6.2. Sunitinib malate
For those patients who progress under imatinib treatment or are intolerant to imatinib, sunitinib is the standard second line therapy, a second generation TKI 62.
Sunitinib malate (formerly SU11248, Sutent®, Pfizer) is an oral oxindole multitarget kinase inhibitor, that inhibits specific tyrosine kinases including VEGFRs (types 1 and 2), PDGFRs (PDGFRA and PDGFRB), KIT, FMS-like tyrosine kinase-3 (FLT3), glial cell line derived neurotrophic factor receptor (RET) and CSF1R 63 (Figure 13). Similar to imatinib, sunitinib interacts with the adenosine triphosphate (ATP) binding pocket of these kinases and acts as a competitive inhibitor of ATP.
Figure 13. Specific RTKs are blocked by sunitinib; sunitinib inhibition of signaling pathways PI3K/AKT/mTOR, MAPK, and PKC triggers different antitumor effects 64
The inhibition of these RTKs blocks signal transduction, thereby affecting various cellular processes, including tumor growth and progression, angiogenesis, and metastasis 64.
Besides the similarity with imatinib, sunitinib is effective in imatinib resistant GISTs, through unique binding characteristics and a broader spectrum of kinase inhibition. Primary and secondary mutations in the kinase powerfully influence sunitinib activity 65. For example, it has been reported that sunitinib showed higher clinical benefits and the objective response rates in patients with primary KIT exon 9 mutations with respect to GISTs with exon 11 mutations (clinical benefit rates: 58% vs 34%; objective response rates: 37% vs 5%); moreover PFS and OS were significantly longer in KIT exon 9 mutant or KIT/PDGFRA WT patients compared to KIT exon 11 mutant ones 65. With regard to KIT secondary mutations, in vitro and in vivo studies have shown that sunitinib is more effective against acquired mutations harbored in the ATP binding pocket, encoded by exon 13 and 14, than those in the activation loop (KIT exon 17 or 18) 65.
1.6.3. Regorafenib
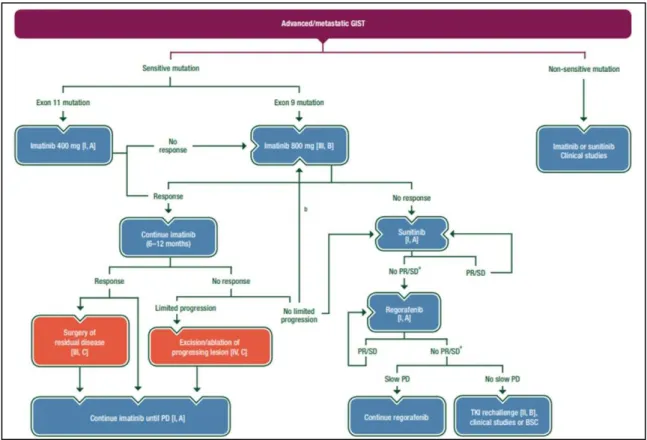
After confirmed progression under sunitinib, a prospective placebo-controlled randomized trial showed that regorafenib can significantly prolong PFS. This treatment was approved as standard third line therapy for patients progressing on or failing to respond to imatinib and sunitinib, on February 25th, 2013 by FDA 66. Regorafenib (formerly BAY73-4506, Stivarga®, BAYER) is an orally available multikinase inhibitor with activity against multiple targets, including KIT, PDGFR, VEGFR-1 -2 -3, TIE2, RET, FGFR-1, RAF, and p38 mitogen-activated protein kinase (MAPK) 66. Many patients, after the development of resistance to imatinib and sunitinib, progress even under regorafenib. Currently, unfortunately there are no other therapeutic options and the rechallenge of imatinib or sunitinib may represent a reasonable option in advanced GIST patients after failure of previous treatments 67. Figure 14 summarizes the management of advanced/metastatic GISTs, according the guideline by ESMO released in 2018.
Figure 14. Management of advanced/metastatic GISTs. aSurgery of limited progression may be considered. bIf previously treated with 400 mg imatinib. BSC: best supportive care; PD: progressive disease; PR: partial response; SD: stable disease
2. Pharmacogenetics and Epigenetics
________________________________________________________________________________
2. Pharmacogenetics and Epigenetics
According to ACCR Cancer Progress report 2017 68, the number of global cancer-related deaths is arising, moving from 8.8 million in 2015 to 14.6 in 2035. This means that the impact of cancer will grow significantly in the next years if new and powerful tools for cancer prevention, detection and treatment will not be established or improved 68. Therefore, a better knowledge of cancer landscape and the identification of novel potential biomarkers is urgently needed. The development of new techniques, as high-throughput screening, has led to a better characterization of many diseases, including cancer; on the other side, it is became clear that genetic code by itself is not the only player in disease development, as well as in clinical response. Indeed, DNA sequence and genetic factors alone cannot fully explain all the processes implicated in diseases initiation and development; on the contrary, it is now well understood that additional factors are involved in the resulting phenotype. Epigenetic modifications are heritable changes and key actors at the basis of physiological growth and differentiation. The term ‘epigenetics’ was introduced in 1941 by Conrad Waddington to define a ‘branch of biology which studies the causal interactions between genes and their products, which bring the phenotype into being’. Epigenetic mechanisms are divided in three main groups:
• DNA methylation, • histone modifications
• non-coding RNAs (ncRNAs).
DNA methylation promotes gene silencing, compacting chromatin or through modification of histones; indeed the CH3 group at CpG dinucleotides protrudes into the major groove of the double-stranded DNA, recruiting then proteins that favor those events.
Histones may be altered by different modifications, including methylation, acetylation, phosphorylation, ubiquitination. These types of changes affect 15–30 aminoacid N-terminal histone tails impacting chromatin condensation.
2. Pharmacogenetics and Epigenetics
________________________________________________________________________________ ncRNAs are also considerably involved in post-transcriptional modifications. ncRNAs can affect the expression of specific target genes and therefor may interfere with the biological processes in which those genes have a role. This “RNA interference” can be mediated by exogenous RNA molecules, known as small interfering RNAs (siRNAs) or by endogenous RNA-microRNAs (miRNAs).
3. miRNAs
________________________________________________________________________________
3. microRNA
MicroRNAs (miRNAs) are a family of small non-coding RNAs (19–25 nucleotides -nts) that can regulate a plethora of biological processes via modulating expression of target genes at the post- transcriptional level 69.
The first miRNA discovered, Lin-4, dates back to 1993 70. Lin-4 is involved in development of C. elegans, through regulation of expression of the protein lin-14 70. Subsequently, many evidences reported existence of a huge number of miRNAs in both invertebrates and vertebrates, and some of them are highly conserved; this suggested that modulation of gene expression via miRNAs is a general and important regulatory mechanism 69. Currently, according to Mirbase database, which is an archive of microRNA sequences and annotations, 48,885 mature miRNAs in 271 species are known, but, for most of them, function is unclear or unknown (updated to March 2018) 71. Calin and colleagues published the first data, showing an involvement of miRNAs in cancer, in 2002. They observed a deletion in B-cell chronic lymphocytic leukemia cells, which contains two miRNA genes, miR-15a and miR-16-1, and reported that the majority of clinical chronic lymphocytic leukemia cases have low expression level or deletion 72. miR-15a and miR-16-1 act as tumor suppressors and induce apoptosis through inhibiting Bcl-2, an anti-apoptotic protein overexpressed in malignant nondividing B-cells and in many solid malignancies 69. In the last two decades, the research has focused on miRNAs, characterizing their function and mechanism of action to finely regulate expression of target genes. Today, it is well known that miRNAs play a pivotal role in many processes, such as cell growth development, cell cycle, apoptosis and many others. Compelling evidences have established that miRNA expression is dysregulated in human diseases including cancer; miRNAs deregulation may take place via different mechanisms such as deletion or amplification of miRNA genes, abnormal transcriptional control of miRNAs, epigenetic modifications in the miRNA biogenesis machinery (Figure 15) 73.
3. miRNAs
________________________________________________________________________________
Figure 15. MiRNAs as cancer players: examples of mechanisms, which can lead to deregulation of miRNAs. Figure from Calin AD et al, PNAS 2004
MiRNAs may act as oncogenes or tumor suppressors and, depending on cellular context, a single miRNA may be both of them. Therefore, deregulation of miRNAs can affect the hallmarks of cancer, including sustaining proliferation, evading apoptosis and resisting cell death, promoting invasion and metastasis, and inducing angiogenesis.
3.1. Biogenesis of miRNAs
About 70% of miRNAs are located in introns and/or exons, and ~30% are located in intergenic regions 74. The biogenesis of miRNAs begins with their transcription by RNA polymerase II, or by RNA polymerase III,resulting in a primary transcript, referred to as pri-miRNA, which contains a 33 bp hairpin stem, a terminal loop and a flanking single stranded sequence that can be 1-2 Kb in length 75,76. Pri-miRNA is then cleaved by Drosha bound by its regulatory subunit DGCR8, to liberate a hairpin structured precursor, or pre-miRNA, of ∼60–70 nts in the nucleus 77.
The pre-miRNA from nucleus is then exported to the cytoplasm by Exportin5 (Exp5) associated with its Ran cofactor coupled to GTP. Once in the cytoplasm, Exp5 releases its pre-miRNA cargo; subsequently, the pre-miRNA is cleaved by Dicer to produce a miRNA duplex intermediate of ∼22-24 nts. Argonaute (Ago) binds the duplex and incorporates the mature miRNA (single-stranded)
3. miRNAs
________________________________________________________________________________ into the Ago-RNA complex, whereas the second strand - the passenger strand or miRNA* - is discarded 78,79.
3.2. Mechanism of action
A single miRNA can modulate the expression of hundreds of mRNA targets and a miRNA target may be regulated by multiple miRNAs. A miRNA binds its target through 6-8 nts, which constitute the so-called seed sequence, and usually the 5′ region of miRNA contributes more to the specificity and activity in binding targets. miRNAs regulate the target expression by base pairing to sequence motifs in the 3’UTR of mRNAs with perfect or imperfect complementarity 80. This imperfect base pairing makes miRNAs able to regulate the expression of multiple target genes, transcribed in the same cellular context as the miRNA. Besides this, it has been reported that miRNAs can bind even the 5’UTRs, but the evidence are less 81,82. Considering the binding between miRNAs and 3’UTRs, miRNAs control their target expression acting through two mechanisms. If the miRNA-mRNA base-pairing is perfect, the mRNA can be endonucleolytically cleaved and degraded; if the miRNA-mRNA base-pairing is not perfect, there will be a block of translation. In both cases, the final result is a down-regulation of expression at the protein level 83.
3.3. miRNAs and cancer
The first indication that miRNAs are key player in human disease dates back to 2002, when Calin and colleagues showed that miR-15a/16-1 cluster is frequently deleted in chronic lymphocytic leukemia, implicating these miRNAs as tumor suppressors 72. After that finding, a huge number of reports were published.
All the tumors analyzed have reported a specific miRNA signature, “miRNome”, which is peculiar for tumor tissue and is often associated with clinico-pathological features of the tumors. In general, it has been observed that most miRNAs are down-regulated in cancers with respect to the normal
3. miRNAs
________________________________________________________________________________ tissue counterparts, as indication of the general loss of differentiation of tumor cells. This is in agreement with studies in vivo, which showed that a global depletion of miRNAs by genetic deletion of the miRNA-processing machinery favorites cell transformation and tumorigenesis 84 85. This suggests that miRNAs deregulation is not a consequence of tumorigenesis but, rather, it has a causative role in cancer development. Beside a general down-regulation of miRNAs in cancers, diverse miRNAs are up-regulated, and have an oncogenic roles 86. In general, as previous mentioned, a single miRNA, depending on the cellular context, may have a dual role and be a tumor suppressor or an onco-miR. For example, miR-221 and miR-222 are important in GIST because target the driver oncogene, KIT, and, as a consequence, they function as tumor suppressors 87. However, in other solid tumors, including glioblastoma, prostate, and breast cancer, they also target important tumor suppressors - as PTEN, p27, p57 and TIMP3 - and function as oncogenic miRNAs by suppressing these tumor suppressors
4. Aim
________________________________________________________________________________
4. Aim
GISTs are rare soft tissue sarcomas, which, however, represents the most common mesenchymal tumor of gastro intestinal tract. GISTs are considered a worldwide paradigm of molecular biology in solid tumors 89. With the application of high throughput technologies into basic and translational research, molecular biology of GISTs has been progressively deepened and the GIST paradigm has been proven to be more complex than expected, due to an extensive molecular heterogeneity within all GIST tumors, and the identification of different subsets often characterized by peculiar genotype and phenotype 90. Besides the importance of genomic alterations, epigenetics, including miRNA and methylation deregulation, could be a key player in driving tumorigenesis, as well as in clinical response and drug resistance. To date, it is well established that KIT/PDGFRA mutant and KIT/PDGFRA WT GIST patients are deeply different at both pathogenesis and molecular level.
However, reports regarding miRNAs expression in GISTs are still a small number and often do not take into account tumor genotype and GIST molecular heterogeneity. For the above mentioned reasons, to identify novel potential biomarkers of GIST pathogenesis, I) the first aim of the PhD project was to investigate and characterize the differences in miRNAs expression levels, comparing KIT/PDGFRA mutant and KIT/PDGFRA WT GISTs.
II) Secondly, we aimed to characterize novel mechanisms of pharmacological resistance to a PI3KCA inhibitor in trial at Sant’Orsola Malpighi Hospital for GIST patients who previously failed imatinib and sunitinib. Indeed, all the treatment lines so far approved in GISTs are TKIs showing a similar mechanism of action, but the majority of patients experience disease progression. Therefore, it is extremely important to identify alternative therapeutic options with different mechanisms.
5. Aim I
________________________________________________________________________________
5. Fist aim: identification of potential novel biomarkers correlated
with GIST pathogenesis
As already previously mentioned, little is known about differences in miRNA expression between KIT/PDGFRA mutant and KIT/PDGFRA WT GIST. In view of these considerations, we integrated
multiple expression profiles of miRNA and mRNA to construct a miRNA-mRNA regulatory network in KIT/PDGFRA WT GIST patients. Subsequently we performed a series of functional in vitro studies to deepen the potential epigenetic network.
Part of the data reported below are reproduced from Epigenomics. 2016 Oct;8(10):1347-1366, with permission of Future Medicine Ltd.
5.1. Materials and Methods
Patients - To identify a miRNAs signature in GISTs, we profiled the expression of a cohort of GIST
patients - discovery set - which included 9 KIT/PDGFRA mutant and 4 KIT/PDGFRA WT cases. A second cohort of patients, designed as validation set, was recruited to validate the capacity of specific miRNA to discriminate between KIT/PDGFRA mutants and KIT/PDGFRA WT disease. In the KIT/PDGFRA WT group, the SDH-deficient status was assessed by both IHC negativity for SDHB protein and genome sequencing of all four SDH subunits. The validation set consisted of 27 GISTs, of which 16 were not overlapping with the discovery cohort and included 7 KIT/PDGFRA WT and 20 KIT/PDGFRA mutant GIST cases (13 KIT/PDGFRA mutant and 3 KIT/PDGFRA WT cases not overlapping with the discovery set) (reproduced from Epigenomics, 2016 Oct;8(10):1347-1366). Subsequently, we were able to expand the validation set from 27 to 37 GIST cases (referred to as validation set II). The miRNAs, which maintained the statistical significance in the validation set, were finally tested in the validation set II.
5. Aim I
________________________________________________________________________________ RNA extraction - Total RNA (including miRNAs) was extracted from liquid nitrogen snap-frozen
tumor samples using Qiagen miRNeasy Mini Kit (Qiagen, Hilden, Germany) according to manufacturer’s instructions.
Genome-wide miRNA expression profiling - miRNAs expression was investigated using the Agilent
Human miRNA microarray v.2 (#G4470B, Agilent Technologies, CA, USA). This microarray consists of 60-mer DNA probes synthesized in situ and contains 15,000 features, which represent 723 human miRNAs, sourced from the Sanger miRBase database (Release 10.1). Microarray results were analyzed by using the GeneSpring GX v.12 software (Agilent Technologies). Data transformation was applied to set all the negative raw values at 1.0, followed by a quantile normalization and a log2 transformation. Filters on gene expression were used to keep only the miRNAs expressed in at least one sample. Then, samples were grouped according to the presence or not KIT/PDGFRA mutations. Differentially expressed miRNAs were identified by a 2 fold-change filter followed by a moderated t-test, with p<0.05 by means of a moderated t-test with Benjamini-Hochberg correction. A principal component analysis (PCA) was applied to compress the multidimensional miRNAs expression data to three dimensions while maintaining the variance. The data have been submitted to Gene Expression Omnibus - GEO - (Entry series number: Submitted E-MTAB-4490) following the requirements of minimum information about a microarray experiment (MIAME).
Gene expression - Quality-controlled RNA was labeled according to Affimetrix expression
technical manual before hybridization to HGU133 Plus 2.0 array following manufacturer’s instruction. Gene expression data were quantified by the robust multi-array analysis (rma) algorithm. Unsupervised analyses were applied to a subset of genes whose standard deviation varied at least of 0.5. For hierarchical agglomerative clustering, Pearson’s correlation coefficient and average linkage were respectively used as distance and linkage methods in DNA-Chip Analyzer (dChip) software. Differentially expressed genes were selected through supervised techniques using
5. Aim I
________________________________________________________________________________ SAM (Significance Analysis of Microarrays) package in R, with a two class unpaired (KIT/PDGFRA WT and mutated samples) T-statistic and permutated 1,000 times. Only genes with 0% q-value cut-off level were considered to be differentially expressed and selected for subsequent analysis. The data have been submitted to GEO (Entry series number: GSE20708), following the requirements of minimum information about a microarray experiment (MIAME).
Identification of validated mRNA/miRNA targets - The validated targets were obtained from the
miRTarBase database (http://microrna.sanger.ac.uk/) that contains miRNA–target interactions (MTIs) with experimental support (2DGE, immunoprecipitation, Luciferase reporter assay, Mass spectrometry, Microarray, qRT-PCR, Western blot, Next Generation Sequencing (NGS), ELISA, IHC. Using these information, miRNA and mRNA arrays were analyzed to highlight pairs of mRNA/miRNA that were discordant (UP vs DOWN and viceversa). Potential miRNA-mRNA interactions and miRNA/mRNA expression profiles were used to construct functional interaction networks using Ingenuity Pathway Analysis (IPA, Ingenuity Systems, CA, USA).
Functional annotation, GO and pathway analysis - IPA was performed to identify the molecular
pathways and functional groupings. Gene interaction networks, bio-functions and pathway analysis were generated using differentially expressed genes (DEGs) into known functions, pathways, and networks primarily based on human and rodent studies. The DEGs were organized in Gene Ontology Bio-Functions and Regulatory Effect Networks available from the Ingenuity database. The significance was set at a p-value of 0.05. IPA pathway explorer and miRNA/mRNA interactions were used to find a link between deregulated genes and deregulated miRNAs in array experiments.
Validation of miRNA array - miRNA array expression profiles of selected miRNAs were evaluated
by TaqMan miRNAs assays (Applied Biosystems, CA, USA), and RNU48 and RNU44 were used as internal normalizer reference. The analysis was conducted according to standard TaqMan miRNAs assay protocol and run on a 7900 HT Fast Real-Time PCR System (Applied Biosystems).
5. Aim I
________________________________________________________________________________
Each sample was analysed in triplicate. Quantitative analysis was performed by the ΔΔCt method. The miRNAs chosen for validation included the top up- and down- regulated miRNA; furthermore, we selected miRNAs whose expression differed significantly and target genes known to be interesting for GISTs and novel genes for GISTs as well.
Western blotting - IGF1R, CD44 and CDK6 expressions were analyzed in 7 KIT/PDGFRA
WT-SDH-deficient and 11 KIT/PDGFRA mutant cases. Frozen tumor samples were diced in ice-cold lysis buffer (1% NP40, 50 mM Tris-HCl, pH 8.0, 100 mM sodium fluoride, 30 mM sodium pyrophosphate, 2 mM sodium molybdate, 5 mM EDTA, 2 mM sodium orthovanadate) on dry ice and homogenized; the cell lysate was then rocked overnight at 4°C. Lysates were cleared by centrifugation at 14,000 rpm for 30 min at 4°C, and lysate protein concentrations were determined using a Bradford method (Bio-Rad, CA, USA). Lysates were separated by gel electrophoresis using NuPAGE® 4–12% Bis-Tris gels (Invitrogen–Thermo Fisher Scientific, MA, USA) and blotted to nitrocellulose membranes. The hybridization signals were detected by chemiluminescence (ECL, Invitrogen, Thermo Fisher Scientific) and captured using ChemiDOC (Bio-Rad). Primary antibodies were IGF1R (Cell Signaling Technology,Inc., MA, USA; #3027), CDK6 (clone 8H4, Sigma-Aldrich, MO, USA), CD44 (Sigma-Aldrich) and β-actin (clone AC15, Sigma-Aldrich).
Cell cultures - GIST48 and GIST882 cell lines were kindly provided by Dr Fletcher (Brigham and
Women's Hospital, Harvard Medical School, Boston, MA, USA). GIST48 was established from a patient that had progressed - after an initial clinical response - during imatinib therapy; this cell line is characterized by a primary, homozygous KIT exon 11 mutation (p.V560D) and a secondary, heterozygous KIT exon 17 mutation (p.D820A). Cells were cultured in IMDM (Gibco, Thermo Fisher Scientific), supplemented with 15% fetal bovine serum (FBS) and 1 mM L-Glutamine (Invitrogen). GIST882 was established from an untreated, human primary tumor harboring a homozygous imatinib sensitive mutation in KIT exon 13 (p.K642E). Cells were maintained in RPMI-1640 (Gibco), supplemented with 15% FBS and 1 mM L-Glu (Invitrogen). All experiments
5. Aim I
________________________________________________________________________________
were performed in newly thawed cell lines. GIST lines were routinely monitored by Sanger sequencing to confirm their KIT mutational status and to exclude additional secondary mutations in
KIT.
Luciferase assay - The pMirNanoGlo dual-Luciferase vector, containing both the Renilla luciferase
gene and the Firefly luciferase gene, was purchased from Promega (Promega, Madison,
WI, USA) (Figure 16). pMirNanoGlo,
containing a 2,051 bp IGF1R 3’UTR region, was generated as follow. The IGF1R 3’UTR region, containing all the miR-139-5p (positions 2,486-2,493 and 3,742-3,748) and
miR-455-5p (position 3782-3788 and 4198-4204) binding sites, was amplified from human genomic DNA, introducing the NheI and XhoI restriction sites (Figure 17). First, this amplicon was cloned into a pGEM® vector using the pGEM-T Easy Vector Systems (Promega) according to the
manufacturer’s instructions. The amplified DNA fragments was then subcloned into the pMirNanoGlo vector, downstream of the Renilla luciferase stop coding region. All constructs were sequence-verified prior to be used. Primers are reported in table 1.
Table 1: List of primers
Primer Sequence Tmelting Aim
IGF1R 2051 fwd AGGCTAGCAGGAGTAAGAACAAAGCTGGGA 58°C PCR
IGF1R 2051 rev ATCTCGAGTGGGGTGGTCTGGGTCTT 58°C PCR
IGF1R 2051 fwd CGGCTTTTTTGCTGGTCA 43°C Sanger
IGF1R 2051 rev GCGTGGATGAGGTTACCAG 48°C Sanger
IGF1R 2051 fwd GGCAATTCCAGCCTAAGTGA 47°C Sanger
IGF1R 2051 rev CAGTACACACCAGCTCCTGCT 51°C Sanger
5. Aim I
________________________________________________________________________________
Figure 17. IGF1R 3’UTR cloned in pGEM and pMiRNanoGlo. In red are highlighted primers used to amplify, whereas in blue are highlighted primers used to sequence the amplicon
GIST882 and GIST48 cells were transfected using Amaxa Nucleofector II device (Lonza AG, Switzerland). In brief, 1×10⁶ cells were resuspended in 100 μl Ingenio Electroporation solution (Mirus Bio, LLC; WI, USA) and mixed with 100 pmol of miRNA mimic (Mirvana miRNA mimic, Ambion, Thermo Fisher Scientific). Cells were then electroporated using the program T-20, and seeded in triplicate in a 96 wells plate. After 24h, Firefly and Renilla luciferase activities were quantified using the Dual luciferase system (Promega) through an EnSpire Multimode Plate Reader
5. Aim I
________________________________________________________________________________
(Perkin Elmer, Inc, MA USA). Renilla luciferase expression was normalized on the Firefly luciferase expression. Independent triplicate experiments were performed for each plasmid construct.
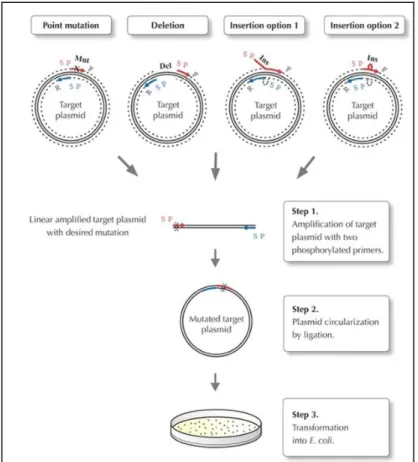
Site-Directed Mutagenesis - To evaluate the contribution of each of the two binding sites, we
generated different constructs in which we individually deleted the seed sequences. To do that, we used the Phusion Site-Directed Mutagenesis Kit (Thermo Fisher Scientific); deletions were created by designing primers that border the deleted area on both sides (see figure 18 for a schematic presentation).
Figure 18. The Phusion Site-Directed Mutagenesis protocol
Transient transfection - Anti-miR-139-5p and anti-miR-455-5p were purchased from Ambion.
Anti-miR-139-5p: UCUACAGUGCACGUGUCUCCAGU (#AM11749), anti-miR-455-5p: UAUGUGCCUUUGGACUACAUCG (#AM10529).
Anti-miR-139-5p and anti-miR-455-5p were transfected in GIST48 and GIST882 using RNAiMAX Lipofectamine (Invitrogen). A random miRNAs inhibitor pool was used as negative control. The
5. Aim I
________________________________________________________________________________ miRVANA microRNA inhibitors are single-stranded, chemically enhanced oligonucleotides designed to inhibit the endogenous miRNAs. Cells were transfected with 100 nM of the indicated oligonucleotide and we evaluated cell migration, apoptosis, cell cycle and proteins’ expression.
Analysis of apoptosis - Apoptosis was assayed using the Guava Nexin kit (4500-0450, Merck Millipore, MA, USA) and the Guava PCA system (Guava Technologies, CA; USA). Cells were harvested 24 and 48 h after transfection treatment. Cells were then plated into a round bottom 96 well plate in triplicate, treated with 100 µl of Guava Nexin reagent according to the manufacturer’s protocol, and incubated at room temperature for 20 min in dark. Samples were then analyzed using the Guava PCA system.
Cell migration assay - Migration of GIST cells treated with 100 nM miR inhibitor was investigated
using Radius™ 24-Wells Cell Migration Assay (Cell Biolabs, CA, USA). In particular, 3x10⁵ cells were plated 24h before treatment. Then, cells were treated with 100 nM of anti-miR-139-5p/455-5p and were left to grow out until up to 96h and pictures were taken every 24 hours to monitor the cells migration.
Invasion assay - Invasion of GIST cells treated with miR inhibitor at 100 nM was investigated
using CytoSelect™ 24-Wells Cell Migration and Invasion Assay (8 µm, Colorimetric Format) (Cell Biolabs). Cell suspensions containing 1x10⁶ cells/ml in serum free media were prepared (treated or not); 500 µL of media containing 10% FBS was added in the lower well of the migration plate. Then, 300 µL of the cell suspension solution was added to the inside of each insert and incubated 24 hours at 37°C. After that, the small chamber were collected and fixed by Cell Stain Solution. Each insert was then washed with 200 µL of Extraction Solution per well, then incubated 10 mins on an orbital shaker. Finally, 100 µL were transferred from each sample to a 96-wells plate and OD 560 nm measured.
5. Aim I
________________________________________________________________________________
5.2. Results
Differential miRNAs expression between KIT/PDGFRA mutant GISTs vs KIT/PDGFRA WT GISTs–
miRNA profiling - The 3D PCA plot, distributing the samples into three dimensional space based on
variance in miRNAs expression, clearly indicates that KIT/PDGFRA WT SDH-deficient GISTs (denoted thereafter as KIT/PDGFRA WT GISTs) clustered together in a distinctive pattern compared to mutant GISTs (Figure 19A). The array highlighted a total of 56 deregulated miRNAs out of the 723 analyzed (Figure 19B).
Figure 19. A) PCA of the miRNA profile in KIT/PDGFRA mutant GISTs (M) compared to KIT/PDGFRA WT GISTs (WT). Red dot represent WT GISTs, while black ones represent KIT mutant (small) and PDGFRA mutant GIST (big). B) miRNAs modulated in KIT/PDGFRA mutant GISTs compared to KIT/PDGFRA WT GISTs. Volcano plot depicting the 56 statistically significant (fold change ≥ 2 and a P < 0.05) deregulated miRNAs (red plot) in KIT/PDGFRA mutant GISTs compared to WT GISTs. The gray plot represent miRNAs with no significant expression changes
In particular, the expression of 16 miRNAs was up-regulated and 40 miRNAs were down-regulated in KIT/PDGFRA mutant GISTs compared to KIT/PDGFRA WT GISTs. All the differentially expressed miRNAs are reported in Table 2.
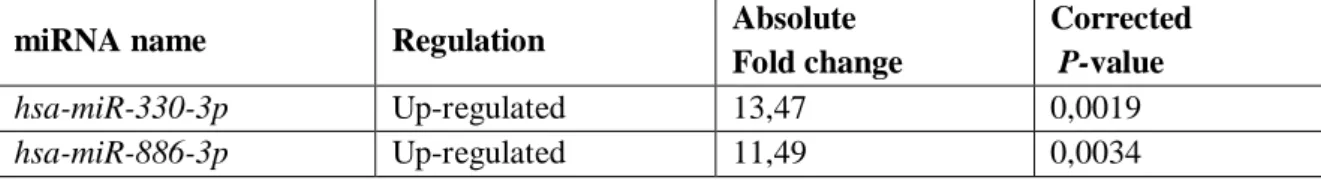
Table 2. miRNAs found to be significantly deregulated in KIT/PDGFRA mutant GISTs compared to KIT/PDGFRA WT GISTs.
miRNA name Regulation Absolute
Fold change
Corrected P-value
hsa-miR-330-3p Up-regulated 13,47 0,0019
5. Aim I ________________________________________________________________________________ hsa-miR-455-5p Up-regulated 8,88 0,0061 hsa-miR-455-3p Up-regulated 9,15 0,0077 has-let-7b Up-regulated 2,37 0,0099 hsa-miR-335* Up-regulated 9,26 0,018 hsa-miR-139-5p Up-regulated 6,28 0,019 hsa-miR-148° Up-regulated 5,80 0,019 hsa-miR-193b* Up-regulated 4,54 0,019 hsa-miR-193b Up-regulated 2,82 0,019 has-let-7c Up-regulated 2,03 0,020 hsa-miR-497* Up-regulated 3,29 0,033 hsa-miR-152 Up-regulated 3,02 0,033 hsa-miR-195* Up-regulated 5,38 0,034 hsa-miR-199b-5p Up-regulated 8,32 0,038 hsa-miR-487b Up-regulated 11,76 0,045 hsa-miR-129-1-3p # Down-regulated 11,13 5,12 x 10⁻⁸ has-miR-491-5p Down-regulated 4,16 0,0011 has-miR-129-5p Down-regulated 67,11 0,0018 has-miR-450a Down-regulated 18,54 0,0041 hsa-miR-424 Down-regulated 7,16 0,0082 hsa-miR-214* Down-regulated 2,96 0,0086 hsa-miR-151-3p Down-regulated 2,24 0,0086 has-miR-876-5p Down-regulated 8,24 0,0099 hsa-miR-542-3p Down-regulated 19,97 0,013 hsa-miR-584 Down-regulated 5,66 0,013 hsa-miR-328 Down-regulated 2,90 0,013 hsa-miR-769-5p Down-regulated 2,57 0,013 hsa-miR-129-2-3p § Down-regulated 87,08 0,015 hsa-miR-542-5p Down-regulated 20,57 0,016 hsa-miR-590-5p Down-regulated 2,27 0,017 hsa-miR-876-3p Down-regulated 5,63 0,019 hsa-miR-34b* Down-regulated 3,57 0,019 hsa-miR-326 Down-regulated 3,22 0,019 hsa-miR-1237 Down-regulated 2,57 0,019 hsa-miR-214 Down-regulated 2,55 0,019 hsa-miR-374b Down-regulated 2,39 0,019 hsa-miR-30e* Down-regulated 2,05 0,019 hsa-miR-199a-5p Down-regulated 2,03 0,019 hsa-miR-338-3p Down-regulated 7,18 0,020 hsa-miR-933 Down-regulated 2,81 0,021 hsa-miR-186 Down-regulated 3,53 0,026 hsa-miR-28-5p Down-regulated 2,11 0,027 hsa-miR-873 Down-regulated 24,66 0,033 hsa-miR-361-3p Down-regulated 2,36 0,033 hsa-miR-1225-3p Down-regulated 2,05 0,033 hsa-miR-191* Down-regulated 2,08 0,034 hsa-miR-34a Down-regulated 2,37 0,036
5. Aim I ________________________________________________________________________________ hsa-miR-551b Down-regulated 28,58 0,041 hsa-miR-490-5p Down-regulated 2,56 0,041 hsa-miR-197 Down-regulated 2,27 0,041 hsa-miR-425* Down-regulated 2,06 0,041 hsa-miR-101* Down-regulated 3,11 0,044 hsa-miR-490-3p Down-regulated 4,62 0,045 hsa-miR-30c-1* Down-regulated 2,41 0,050 hsa-miR-15a Down-regulated 2,18 0,050
Previously: # hsa-miR-129*; § has-miR-129-3p
In Italic are highlighted miRNA selected for validation.
Hierarchical clustering of all samples separated KIT/PDGFRA mutant GIST and KIT/PDGFRA WT GISTs into two distinct clusters (Figure 20), confirming the prior PCA results.
Figure 20. miRNA hierarchical clustering. The miRNAs identified as differentially expressed between KIT/PDGFRA mutant GISTs and KIT/PDGFRA WT GISTs were selected as markers for unsupervised hierarchical clustering.
Different mRNA expression between KIT/PDGFRA mutant GISTs vs KIT/PDGFRA WT GISTs –
mRNA profiling - A comparative analysis between KIT/PDGFRA mutant GISTs vs KIT/PDGFRA
5. Aim I
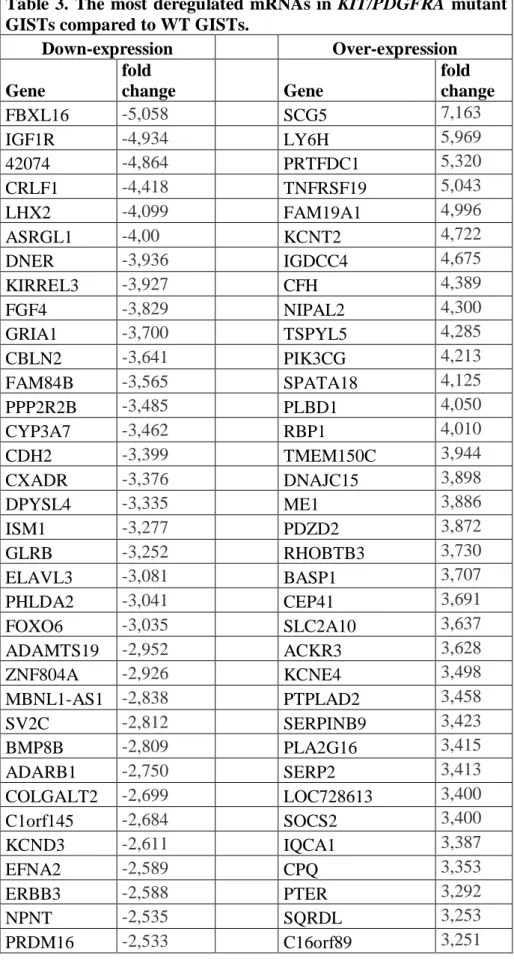
________________________________________________________________________________ 123 genes were down-regulated (fold range: -0.7 to -5.5; Table 3) while 112 genes were up-regulated (fold range: 0.98 to 7.10; Table 3) (Figure 21A).
Table 3. The most deregulated mRNAs in KIT/PDGFRA mutant GISTs compared to WT GISTs.
Down-expression Over-expression Gene fold change Gene fold change FBXL16 -5,058 SCG5 7,163 IGF1R -4,934 LY6H 5,969 42074 -4,864 PRTFDC1 5,320 CRLF1 -4,418 TNFRSF19 5,043 LHX2 -4,099 FAM19A1 4,996 ASRGL1 -4,00 KCNT2 4,722 DNER -3,936 IGDCC4 4,675 KIRREL3 -3,927 CFH 4,389 FGF4 -3,829 NIPAL2 4,300 GRIA1 -3,700 TSPYL5 4,285 CBLN2 -3,641 PIK3CG 4,213 FAM84B -3,565 SPATA18 4,125 PPP2R2B -3,485 PLBD1 4,050 CYP3A7 -3,462 RBP1 4,010 CDH2 -3,399 TMEM150C 3,944 CXADR -3,376 DNAJC15 3,898 DPYSL4 -3,335 ME1 3,886 ISM1 -3,277 PDZD2 3,872 GLRB -3,252 RHOBTB3 3,730 ELAVL3 -3,081 BASP1 3,707 PHLDA2 -3,041 CEP41 3,691 FOXO6 -3,035 SLC2A10 3,637 ADAMTS19 -2,952 ACKR3 3,628 ZNF804A -2,926 KCNE4 3,498 MBNL1-AS1 -2,838 PTPLAD2 3,458 SV2C -2,812 SERPINB9 3,423 BMP8B -2,809 PLA2G16 3,415 ADARB1 -2,750 SERP2 3,413 COLGALT2 -2,699 LOC728613 3,400 C1orf145 -2,684 SOCS2 3,400 KCND3 -2,611 IQCA1 3,387 EFNA2 -2,589 CPQ 3,353 ERBB3 -2,588 PTER 3,292 NPNT -2,535 SQRDL 3,253 PRDM16 -2,533 C16orf89 3,251
5. Aim I ________________________________________________________________________________ DAPK1 -2,435 IL1R1 3,240 EVA1A -2,433 CLIC2 3,211 TBX21 -2,429 EPHX2 3,152 CD44 -2,401 CAPS2 3,105 NRCAM -2,390 ALDH7A1 3,048 PDE4DIP -2,383 FBXO4 3,046 P4HA3 -2,382 MINA 3,045 ARSB -2,343 C9orf64 3,042 GPD2 -2,309 SERPINB1 3,023 SLC1A1 -2,276 TMEM173 3,020 FAM46C -2,249 CPNE8 3,006 TAPBPL -2,236 CYSLTR1 3,004 TMEFF1 -2,227 ZNF423 2,977 FAM43A -2,226 RANGRF 2,932 KIF21B -2,224 COX7A1 2,926 DAAM1 -2,217 GPX7 2,895 EFR3B -2,213 C8orf88 2,861 USP53 -2,206 PARVA 2,854 TMEM59L -2,179 WWTR1 2,846 ARX -2,111 CREB3L1 2,773 MAGI2-AS3 -2,103 PLIN2 2,715 SLC4A7 -2,081 MCTP2 2,714 TARBP1 -2,070 SLC9A9 2,683 RIMBP2 -2,050 PDLIM4 2,681 TESK2 -2,012 S100A13 2,665 PHKA1 -2,009 CHCHD10 2,661 LSR -2,005 TP73-AS1 2,622 FGFBP3 -1,994 PHLDA1 2,568 LRCH2 -1,869 HTATIP2 2,544 42066 -1,866 ZNF22 2,509 NRG3 -1,843 FMOD 2,484 42068 -1,841 FAM213A 2,464 FAM3C -1,788 SELENBP1 2,417 CDH23 -1,787 LOC728819 2,416 TMEM30A -1,783 CDIP1 2,365 PPM1B -1,762 FAM50B 2,357 ARHGAP5 -1,740 MXRA7 2,333 DNAH12 -1,720 RNF135 2,332 DDAH1 -1,711 IMPACT 2,269 ENAM -1,640 GYPC 2,199 DNAJB4 -1,627 CD40 2,106 TTLL7 -1,614 PBX3 2,067 EGFL7 -1,606 GLRX 2,066
5. Aim I ________________________________________________________________________________ NPC2 -1,597 DENND1B 2,020 MPP5 -1,580 CYB561 2,005 USP33 -1,530 NPEPL1 2,002 HEXA -1,520 SETD9 2,000 SPPL2A -1,506 TMEM220 1,997 ARRB1 -1,478 ZNF239 1,984 GPR63 -1,448 MAPK10 1,983 TMEM74B -1,414 OCIAD2 1,975 SLC25A48 -1,411 PHF19 1,970 GALT -1,405 GSE1 1,968 C1orf21 -1,384 ZNF621 1,964 ST7 -1,339 N6AMT2 1,963 EPN2 -1,338 CYP27A1 1,894 TMEM14C -1,323 RHOD 1,889 PATZ1 -1,267 TTC12 1,888 GRN -1,250 ACAA2 1,881 NDUFAF4 -1,241 LOC730102 1,855 NT5E -1,236 C8orf48 1,854 NENF -1,221 CLMP 1,786 SPEF2 -1,210 LOC100049716 1,757 ERP29 -1,206 EPHX1 1,750 DENND2C -1,188 RFESD 1,710 CPEB3 -1,179 MYD88 1,707 ATP6V1D -1,162 LOC101927027 1,691 RECK -1,160 ENKD1 1,677 SIRT2 -1,159 DDB2 1,665 MBNL1 -1,126 MAP1LC3A 1,611 AKT3 -1,095 CTSF 1,5717 EFNA3 -1,075 HAUS7 1,530 ECI2 -1,060 PRR5 1,424 TMEM14B -1,060 PPM1M 1,370 PTP4A1 -1,033 VILL 1,316 NCSTN -1,025 TPST1 1,094 HAGHL -1,023 ATG12 0,981 SIPA1L1 -1,004 LUZP1 -0,999 ABL2 -0,991 ZFYVE1 -0,991 KIAA1522 -0,950 SMARCD3 -0,846 ELFN1 -0,824 CPNE9 -0,760 APC2 -0,758