2016
Publication Year
2020-05-26T15:45:11Z
Acceptance in OA@INAF
The 7-beam S-band cryogenic receiver for the SRT primary focus: project status
Title
VALENTE, Giuseppe; MARONGIU, Pasqualino; NAVARRINI, Alessandro; SABA,
Andrea; Montisci, G.; et al.
Authors
10.1117/12.2232625
DOI
http://hdl.handle.net/20.500.12386/25199
Handle
PROCEEDINGS OF SPIE
Series
9914
Number
The 7-Beam S-Band Cryogenic Receiver
for the SRT Primary Focus: Project Status
G. Valente1*, P. Marongiu1, A. Navarrini1, A. Saba1, G. Montisci2, A. Ladu1, T. Pisanu1, M. Pili1, S. Dessi2,
A. Uccheddu2, N. Iacolina1, D. Perrodin1, M. Buttu1, E. Egron1, A. Melis1, C. Tiburzi1, V. Vacca1 1INAF–Osservatorio Astronomico di Cagliari, 09047 Selargius, Italy
2Univeristà degli Studi di Cagliari, Via Marengo 3, Cagliari, Italy
*Contact: [email protected], phone +39 - 070 711 80 210
Abstract
Existing radio receivers have a very low noise temperature. To further increase the observation speed, the new generation of radio receivers use a multi-beam focal plane array (FPA) together with wide bandwidth. In this article, we present the front-end and cryogenic design of the 7-beam FPA double linear polarization receiver for the 64-m primary focus of the Sardinia Radio Telescope .At the end of this article, we show the simulated performances of the front-end receiver and the measurements of the down-conversion section.
1. INTRODUCTION
The Sardinia Radio Telescope [1-5] (SRT, Lat. 39°29’34’’N Long. 9°14’42’’ E) is a major radio astronomical facility which is ready to perform outstanding scientific observations. It is a flexible instrument for Radio Astronomy studies and Space Science, both in single dish and VLBI (Very Long Baseline Interferometry) mode. SRT is a fully-steerable, 64m-diameterparaboloidal radio telescope, which in full operation mode, will be capable of operating with high efficiency in a wide frequency range: from 300MHz to 116GHz. The SRT optical configuration is a quasi-Gregorian system with a shaped parabola primary mirror M1, a shape elliptical mirror M2, and three other mirrors M3, M4 and M5. The active surface of the M1 consists of 1008 aluminium panels and of 1116 electromechanical actuators. The actuators compensate the systematic effects of the backup structure like gravitational effects or non-systematic effects like thermal and wind deformations. At the present time, at SRT three receivers are mounted, one for each focus [6]. In the primary focus (F1) there is a coaxial-feed LP-band receiver, which simultaneously covers the P- (0.305-0.410 GHz) and L- (1.3-1.8 GHz) bands [7-14]. In the BWG-I focus (F3), and in the Gregorian focus (F2) we installed a mono-feed high C-band receiver (5.7-7.7 GHz) [15-17] and a multi-feed K-band receiver (18-26.5 GHz) respectively [18].
The design of the multi-feed S-Band receiver, which commended in May 2013 [19-20], targets the development of new cryogenic radio receiver generation at the Observatory of Cagliari (www.oa-cagliari.inaf.it). The project was subject numerous changes. Building on previous studies, we design the entire passive feed system to work at cryogenic temperatures (below 20K), we add two feeds on the focal plane array and we shift the RF band from 2.3-4.3 GHz to 3.0-4.5 GHz due to strong RFI signals.
In this paper, we describe the new architecture of the 7-Beam S-band receiver, which covers the frequency range 3-4.5 GHz. We describe the final electromagnetic simulation of the overall passive feed system, the thermal design and the final measurements of the down-conversion section.
2. ARCHITECTURE OF THE RECEIVER
The Multi-feed S-band receiver will be placed at F1. The design of the receiver architecture strongly depends on the primary Focus Positioner (PFP) load and room limits, as shown in Figure 2. These limits lead to a maximum receiver weight and dimensions of 500 Kg and 1x1x1 m3 respectively. This new instrument will offer large science capabilities
like pulsar observations and mapping of radio sources. The main specifications of the receiver are summarized in Table 1. The RF signal path is cooled at 20 K with the exclusion of the vacuum window, which works at room temperature (300K). The RF signal crosses the vacuum window and the feed. Subsequently, the RF signal is split by the double
ridged orthomode transducer (OMT). Finally, the signal is amplified by a commercial cryogenic low noise amplifier (LNA). The new FPA has an hexagonal shape and it composed of seven feeds arranged on the vertex of the hexagonal shape as well as a central feed. The design of the waveguide passive components, (feed, OMT and directional coupler) were constrained by the available space along the direction of the optical axis (1 m) inside the focal cabin of the telescope, as shown in Figure 2.
Figure 1. Sketch of the Sardinia Radio Telescope (www.srt.inaf.it). The picture shows all fundamental mechanical parts
of the antenna and the optical configuration. The SRT optical configuration is a quasi-Gregorian system with a shaped parabola primary mirror M1, a shape elliptical mirror M2, and three other mirrors M3, M4 and M5, which compose the
beam waveguide Layout 1 (BWG-I) and Layout II (BWG-II).
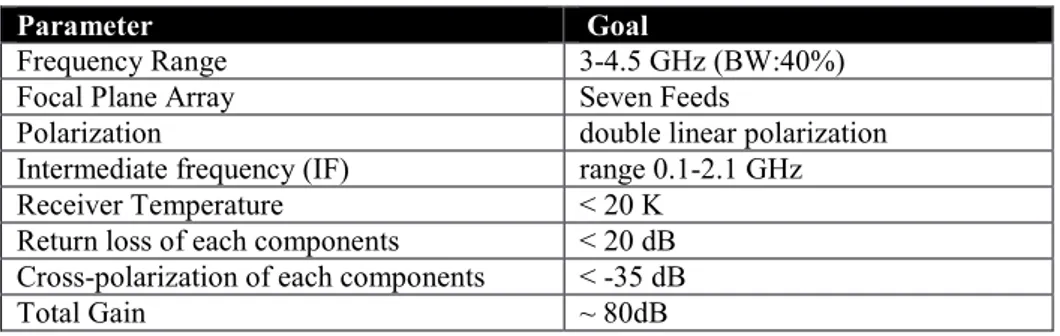
Parameter Goal
Frequency Range 3-4.5 GHz (BW:40%)
Focal Plane Array Seven Feeds
Polarization double linear polarization
Intermediate frequency (IF) range 0.1-2.1 GHz
Receiver Temperature < 20 K
Return loss of each components < 20 dB
Cross-polarization of each components < -35 dB
Total Gain ~ 80dB
Table 1. Summary of the electromagnetic performances of the multi-feed S-band receiver.
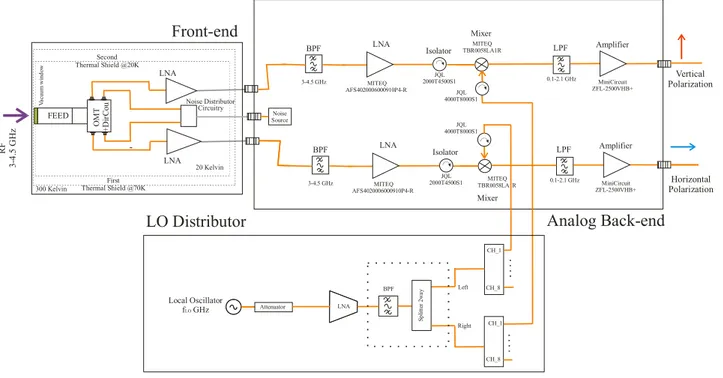
All component dimensions have been chosen in order to meet these load and dimensional requirements. The schematic in Figure 3can be divided into three main blocks. The first block is the front-end, which includes the feeds, OMTs directional couplers and LNAs. There are designed to collect, amplify and split the signal incoming from each feed into two orthogonal polarizations. The second block is the analog back-end. It is mainly composed of amplifiers, filters and mixers in order to perform the conditioning and frequency down-conversion of the two polarizations. The last block is the local oscillator distribution, which is composed of a commercial signal generator, power amplifier, filters, and the splitter circuitries.
BWG-I (F3) and -II Foci (F4) F/D=1.38 & 2.81 1.4 GHz <f<35 GHz Gregorian Focus (F2) F/D=2.34 7.5 GHz <f<115 GHz PrimaryFocus (F1) F/D=0.33 300 MHz <f<20 GHz Secondary Mirror (M2) (rms single pannel= 50 µ )m Primary Mirror (M1) (rms single pannel= 72µ )m BWG Mirrors (M3,M4 and M5) (rms single mirror =49 µ )m Primary Focus Positioner
(PFP)
Gregorian RotatingTurret
Figure 2.Detail of the sub-reflector and PFP of the Sardinia Radio Telescope. Two cubes depict the coaxial-feed LP band
receiver that is already installed on the PFP and the available room for the S-band receiver.
Figure 3.Generic schematic diagram of the S-Band heterodyne receiver.
2.1 Front-end chain simulation results
The passive front-end chain is constantly maintained at cryogenic temperatures (below 20K) in order to minimize the thermal noise before the low noise amplifier. The bandwidth of the receiver is 40% of the central frequency of 3.75 GHz. We designed a simple circular waveguide feed, illuminating the primary mirror with an edge taper of -13 dB @74 degrees [19]. Actually, a new best-fit paraboloid surface can be obtain with the active optics to improve the antenna efficiency. At the circular waveguide feed, the circular to quad-ridged waveguide transition is directly connected. The OMT is located downstream of the transition, as shown in Figure 4.
300 Kelvin O M T + D ir C o u FEED V a cu u m w in d o w LNA 20 Kelvin Noise Source R F 3 -4 .5 G H z LNA LNA Amplifier Isolator BPF Mixer LPF 3-4.5 GHz MITEQ AFS4020006000910P4-R MITEQ TBR0058LA1R 0.1-2.1 GHz MiniCircuit ZFL-2500VHB+ Amplifier Mixer LPF MITEQ TBR0058LA1R 0.1-2.1 GHz MiniCircuit ZFL-2500VHB+ LNA Isolator BPF JQL 2000T4500S1 3-4.5 GHz MITEQ AFS4020006000910P4-R Local Oscillator f GHzLO LNA S p li tt er 2 w a y Attenuator BPF Left Right CH_1 CH_8 CH_1 CH_8
Analog Back-end
First Thermal Shield @70K Second Thermal Shield @20K JQL 2000T4500S1 Noise Distributor CircuitryLO Distributor
Horizontal Polarization Vertical Polarization JQL 4000T8000S1 JQL 4000T8000S1Front-end
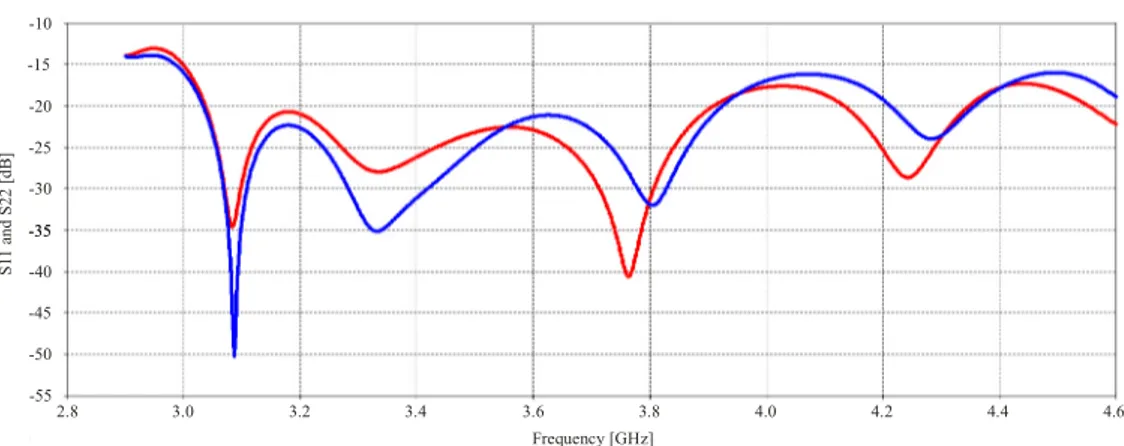
Figure 5. Output Return Loss at the output coaxial connectors. S11 red curve (horizontal polarization) S22 blue curve
(vertical polarization).
Figure 6. Cross Polarization at the coaxial connectors. S21 red curve and S12 blue curve.
Figure 7Left) shows the a picture of the commercial low noise amplifier [25]. Right) reports the measured performance
of the gain and the noise at a cryogenic temperature of 14.7 K. The gain is about 27 dB, whereas the noise is below 5 K at our S-band frequencies (3-4.5 GHz).
The OMT [11-21-22] is a passive component employed to separate the RF signal incoming from the feed in two (horizontal and vertical) linear polarizations. The passive feed system is realized using aluminium anticorodal 6082. The orthomode transducer has a singular quad-ridged waveguide input and four outputs. Each output has a 90-degree SMA connector [23]. The 90 degrees SMA connector allows us to connect the OMT directly with the input of the commercial cryogenic LNA. We adopted this solution to minimize the dimension along the z-direction and to avoid the coaxial cable in order to minimize the losses and consequently the thermal noise. Figure 5 shows the simulated output return loss of the entire passive feed system. The output return loss at the coaxial connector is below 15 dB over the interested RF band, (3-4.5 GHz) for each polarization. The simulation of the cross polarization of the passive feed system is below -35 dB in the range 3.2-4.6 GHz, whereas, between 3.0-3.2 GHz the maximum value of the cross polarization is below -31 dB. We use the commercial electromagnetic 3D software, CST Microwave [24] Studio, to simulate all parts of the passive feed system.
Output Return Loss at the coaxial output
Frequency [GHz] 2.8 3.0 3.2 3.4 3.6 3.8 4.0 4.2 4.4 4.6 -55 -50 -45 -35 -40 -35 -25 -30 -20 -10 -15 S 1 1 a n d S 2 2 [ d B ]
Cross Polarization at the coaxial output
Frequency [GHz] 2.8 3.0 3.2 3.4 3.6 3.8 4.0 4.2 4.4 4.6 -55 -50 -45 -35 -40 -35 -25 -30 -20 -10 -15 S 2 1 a n d S 1 2 [ d B ]
Figure 4. 3D sketch one front-end chain designed for the multi-feed S-band receiver, 3-4.5 GHz. The passive system is
composed of: a circular waveguide feed; a circular to quad-ridged waveguide transition; and an orthomode transducer.
2.2 Cryogenic design
The cryogenic system is a fundamental part of any modern radio astronomical receiver [26-27]. This system employed in a radio receiver is composed of two big parts: the vacuum system and the cooling system. The vacuum system is composed of two vacuum pumps, one vacuum sensor, and one vacuum chamber. The vacuum sensor allows us to measure and monitor the level of vacuum inside the vacuum chamber. Inside the vacuum chamber, the front-end chains are installed .The cooling system is composed of a cryogenic compressor and a cryocooler. These two equipment are linked by two pipelines, which are filled with liquid helium. The aim of the aforementioned system is to cool the devices placed inside the cryostat in order to decrease the noise temperature of the front-end chain. In order to optimize the operation of the cooling, we must minimize the heat transfer from the stage at room temperature to the stage at cryogenic temperature. The thermal load is generated by three physical phenomena: Convection, Radiation and Conduction [27].The total heat transfer can be estimated by the following formula:
= + +
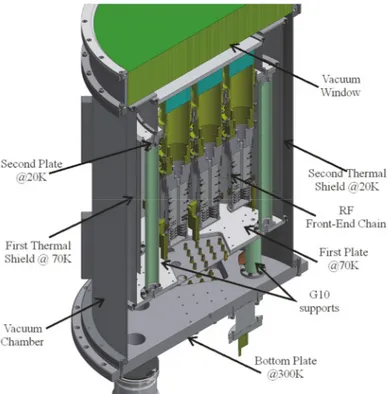
For our receiver, we take careful attention to optimize the cryogenic design of the cryostat. In figure 8 is sketched the cryostat, showing the total seven front-end chain.
Thermal Load Contribution
First Stage [W] Second Stage [W]
Convection 0 0
Radiation 5.7 35E-3
Conductivity 9.8 1.4
Active devices 0 0.15
15.5 1.585
Table 2. Different thermal load contributions analysed in the previous sections. Each commercial LNA has a consumed
power of about 10mW.
Input RF Signal
Circular to Quadr-ridged
Waveguide Transition
Circular
Waveguide
Feed
Output Coaxial
Connectors
Port 2
Aluminium 6082
Orthomode
Transducer
Port 1
Figure 7.Left) Picture of a commercial cryogenic LNA selected for the front-end chain. Right) Gain and Noise
performances of the purchased LNA at 14.7 K.
The Diameter and height of the cryostat are respectively 524mm and 762mm. Figure 8 shows the two developed thermal shields. They are necessary for minimizing the thermal load due to radiation effects. The thermal shields are composed of cylindrical metallic structures and ten sheets of super-insulation. These sheets are fixed on the external side of the radiation shield. To minimize the conduction thermal load, we used different materials in order to transport the signals. We used stainless steel coaxial cables to connect the output LNAs with the external side of the cryostat to transport the RF signals. We adopted bronze DC wires to supply the low noise amplifier placed into the cryostat. The cryostat requires strong supports to put together the plates at different temperatures in order to sustain all receiver chains, as shown in Figure 8. For these reasons, we designed and optimized the cylindrical column supports using G10 material.
Taking into account previous experiences about the development of thermal design [28], we calculated and simulated the S-band front-end thermal load contribution, as shown in Table 2.
In the last row of Table 2, we shown the results of the total expected thermal load. For the first and second stages the total thermal load is equal to about 15.5 W and 1.6 W respectively. These results allow us to take into account a commercial cryocooler solution like CTI350CS [29].
2.1 LO Distribution circuitry
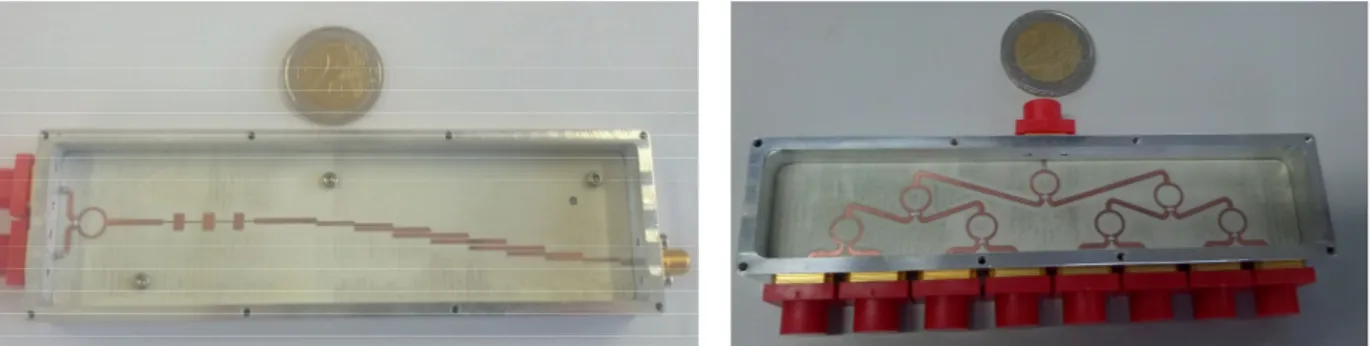
To optimize the power level and to minimize the spurious signal level, we developed an ad-hoc local oscillator signal distributor. Figure 3 shows the schematic diagram. The circuitry is composed of three distinct blocks. The first block goals are to filter the LO harmonic spurious of the LO signal and split the LO signal coming from the signal generator. The other two blocks split the LO signals into eight distinct outputs signals. The LO reference signal is thus split into sixteen distinct signals, which pump fourteen mixers, as shown in Figure 3.These blocks were developed, designed, assembled and measured in our structures, as shown in Figure 9.
Figure 9.Left)Realized first block. It has three ports. The right ports are the output ports, whereas the left port is the input
port. The input port is connect directly to an amplifier and an isolator, as shown in Figure 3. Right) The realized 8-way divider (second block). In top of the picture there is the input port, on the other side there are the eight output ports. The
input port is connected directly to the first block, as shown in Figure 10-left.
The measured performances of the entire passive system are reported in Figure 10-right. The measurements are made with our vector network analyser, R&S ZVA67. The transmission coefficient is about 15.5 dB, but the ohmic losses are about 3 dB. The return loss of the whole system is below 11 dB.
2.1 Down Conversion circuitry
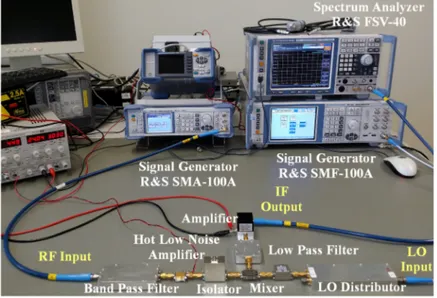
The designed conversion system is composed of commercial and homemade devices [30-31-32]. We tested the system with a variable local oscillator LO= 4.8-5.1 GHz to allow us to place the RF band of 1.5 GHz into the IF bandwidth of SRT. The receiver delivers a total IF bandwidth of 21 GHz (7 feeds x 2 pols x 1.5GHz). The schematic block is sketched in Figure 3.Figure 11 shows the SUT (System Under Test) and instruments used to perform the measurements. The instruments used during the measurements are: a spectrum analyser (R&S FSV-40) and two signal generators(R&S SMF100A and R&S SMB100A). The SA was used to measure the amplitude of the SUT output. The first signal generator was used to simulate the RF signal, whereas the second signal generator was used to pump the mixer. To optimize the measurements we have developed a software tool to control instrument remotely. The software is written in Python 2.7 [32] and uses the Python GUI Toolkit wxPython 3.0.2 [33], a wrapper of wxWidget toolkit. It depends on the PyVisa 1.8 [34] library for communication with measurement instruments. This library implements Virtual Instrument Software Architecture (VISA) [35], which used to communicate over many different interfaces and bus systems (GPIB, VXI, PXI, Serial, Ethernet, and/or USB interfaces). The software allowed the processing of data after the measurements. Moreover, it made it possible to create customized embeddable graphs for each measurement. The graph plotting functionality is based on matplotlib 1.4.3 [36].
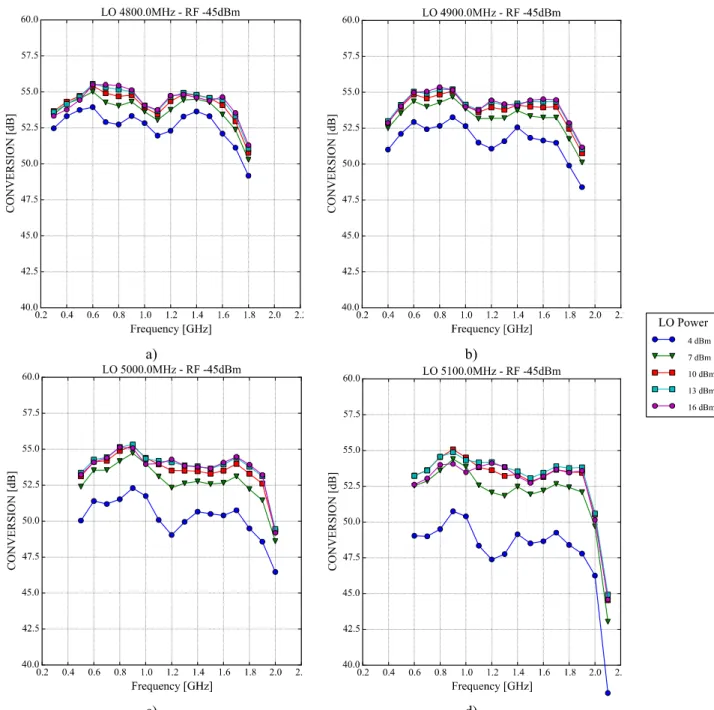
For the measurements, we have estimated a maximum power signal at the input of the conversion system equal to - 45 dBm. The goal of these measurements are to define the exact frequency and power of the local oscillator to maximize the conversion gain and to minimize the spurious signal inside the IF band. The first parameter that we have optimized is the
conversion gain. The results of the analysis are reported in Figure 12. For these measurements, we have swept the frequency and the power of the local oscillator signal.
Figure 10.Left)Picture of the two blocks connected together. Right) In the top figure, we shown the Return loss
measured for the whole passive distributor circuitry. In the bottom figure, we shown the scattering coefficients S12 for the whole distributor circuitry.
During the measurements, the power of the LO signal was corrected to take into account the cable losses between the instrument and the LO distributor as well as the losses of the LO distributor. This correction was made possible by a specific calibration routine of our developed software tool. The value of the LO signal is reported in Figure 12 caption. After the analysis of the conversion gain measurements, we obtained the best frequency values of the local oscillator. These values are 4.8 and 4.9 GHz. In fact, the conversion gain is almost flat (see Figure 12) for these values of the LO signal. Each graph shows the conversion gain at different LO power levels. In all graphs is evident that the optimal trade-off between the conversion gain and the minimum LO power is 10 dBm. For a LO signal frequency equal to 5.0 or 5.1 GHz, the conversion gain for high frequency IF decreases very quickly, so we reject these last values.
a) b)
c) d)
Figure 12. Conversion Gain of the whole down conversion system. In each graph the power of the LO is swept between
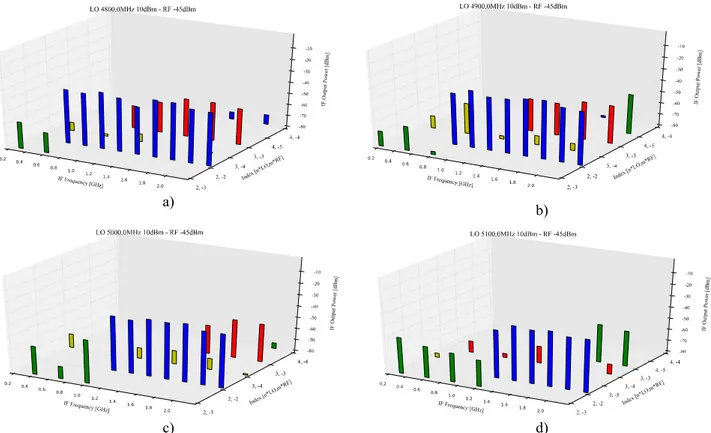
4dBm to 16dBm. a) LO is set at 4.8 GHz; b) LO is set at 4.9 GHz; c) LO is set at 5.0 GHz; d) LO is set at 5.1 GHz; Figure 13 shows the spurious signal distribution. For this measurement we set an input RF power equal to -45 dBm and set minimum a threshold level equal to -80 dBm for the spurious signals. The 3D graph shows the spurious distribution in
the corresponding IF bandwidth, with the level power and the index (n;m) used in the following formula to calculate the spurious frequencies:
= n ∙ + ∙
After Studying the graphs in Figure 13, it is clear that the minimum presence of the spurious signals occur when the LO frequency is set at 5.1 GHz, as shown in Figure 13-d. The overview of the spurious signal level measurements are reported in Table 3. In the first column, we shown the frequency LO setup. For each value we measured the power level of the down converting signal (second column). In the third column we insert the maximum measured level of the spurious frequency. Our goal was to find the best value of the LO frequency to minimize the spurious signals inside the IF band, and maximize the level of the down converted signal and the maximum level of the spurious signals. This value is reported in the last column.
In conclusion, after our measurements we decided that the best value for the local oscillator signal LO was4.8 GHz. The power level of the LO signal is set to 10 dBm. Finally, the IF band range is 0.3-1.8 GHz.
LO frequency [GHz] Level of fundamental signal [dBm]
Maximum spurious signals level [dBm]
Difference between fundamental and maximum spurious signals
[dBc]
4.8 9 -29 -38
4.9 7 -29 -36
5.0 8.5 -27 -35.5
5.1 8.5 -32.5 -41
Table 3. The overview of the spurious level measurements.
Device TPHY [K] Gain @ 3.75 GHz [dB] Te @ 3.75 GHz [K] Te @ 3.75 GHz [K]
Vacuum Window Feed 300 -0.05 3.5 3.5
Passive Feed System 20 -0.25 1.2 4.7
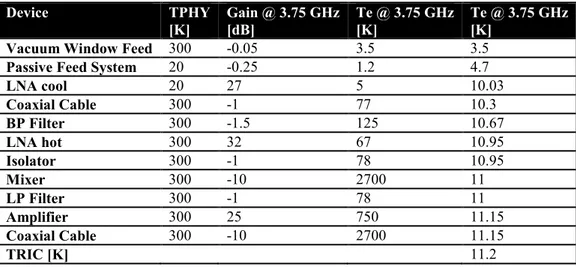
LNA cool 20 27 5 10.03 Coaxial Cable 300 -1 77 10.3 BP Filter 300 -1.5 125 10.67 LNA hot 300 32 67 10.95 Isolator 300 -1 78 10.95 Mixer 300 -10 2700 11 LP Filter 300 -1 78 11 Amplifier 300 25 750 11.15 Coaxial Cable 300 -10 2700 11.15 TRIC [K] 11.2
Table 4. Estimation of the receiver TRIC at central frequency(3.75 GHz)
3. SUMMARY
AND
CONCLUSIONS
In the previous sections we describe a new architecture for an7-beamS-Band cryogenic receiver for the primary focus of the Sardinia Radio Telescope. We reported the simulation results of the passive feed system. We obtained a return loss value below 15 dB and a cross polarization value better than -30 dB over the entire S-band for both values. We developed a software tool to control the measuring instruments remotely and to perform off-line data analysis. With this software, we selected the best value of the LO signal in order to maximize the conversion gain, and to minimize the number and level the spurious signal inside the IF band. The receiver temperature was estimatedbelow12 K, thanks to a thermal load and noise temperature analysis of the cryogenic front-end, see Table 4. We expect to start to test the cryogenic front-end by July 2016.
a)
b)
c) d)
Figure 13. Spurious Distribution for the local oscillator at :a) 4.8 GHz and a power LO equal to 10 dBm. b) 4.9 GHz and
a power LO equal to 10 dBm. c) 5.0 GHz and a power LO equal to 10 dBm. d) 5.1 GHz and a power LO equal to 10 dBm.
4. REFERENCES
[1] G. Grueff,Et. Al., “Sardinia Radio Telescope: The New Italian project”, SPIE 5489, Ground-Basedtelescopes, (28 September 2004); Doi: 10.1117/12.550332;
[2] G.Tofani, Et.Al.,“Status of the Sardinia Radio Telescope Project”, SPIE 7012, Ground-Based And Airborne telescopes, 70120f (10 July 2008); Doi: 10.1117/12.790503
[3] Ambrosini, R.,Bocchinu, A.;Bolli, P. ; Buffa, F. ; Buttu, M. ; Cattani, A. ; D'amico, N. ; Deiana, G.L. ; Fara, A. ;Fiocchi, F. ; Gaudiomonte, F. ; Maccaferri, A. ; Mariotti, S. ; Marongiu, P. ; Melis, A. ; Melis, G. ;Migoni, C. ; Morsiani, M. ; Nanni, M. ; Nasyr, F. ; Nesti, R. ; Orfei, A. ; Orlati, A. ; Perini, F. ;Pernechele, C. ; Pilloni, S. ; Pisanu, T. ; Poloni, M. ; Poppi, S. ; Porceddu, I. ; Righini, S. ; Roda, J. ;Scalambra, A. ; Schirru, M.R. ; Serra, G. ; Stringhetti, L. ; Trois, A. ; Tuveri, A. ; Valente, G. ; Vargiu, G. ; Zacchiroli, G., “The Sardinia Radio Telescope: Overview end Status“,," IEEE International Conference On Electromagnetics In Advanced Applications (Iceaa 2013), (Torino, Italy), September 9-13, 2013.;
[4] P. Bolli, A. Orlati, L. Stringhetti, A. Orfei, S. Righini, R. Ambrosini, M. Bartolini, C. Bortolotti, F. Buffa, M. Buttu, A. Cattani, N. D’amico, G. Deiana, A. Fara, F. Fiocchi, F. Gaudiomonte, A. Maccaferri, S. Mariotti, P. Marongiu, A. Melis, C. Migoni, M. Morsiani, M. Nanni, F. Nasyr, A. Pellizzoni, T. Pisanu, M. Poloni, S. Poppi, I. Porceddu, I. Prandoni, J. Roda, M. Roma, A. Scalambra, G. Serra, A. Trois, G. Valente, G.P. Vargiu, G. Zacchiroli, “ Sardinia Radio Telescope: General Description, Technical Commissioning and First Light”, Journal Of Astronomical instrumentation, Vol. 4, Nos. 3 & 4 (2015) 1550008 #.C World Scientific Publishing Company Doi: 10.1142/S2251171715500087;
[5] Vertex, “64-Meter Sardinia Radio Telescope Final Design Report Optics And Design” Systems Division, Santa Clara Facility; [6] G. Valente, A. Orfei, R. Nesti, A. Navarrini, S. Mariotti, P. Bolli, T. Pisanu, J. Roda, L. Cresci, P. Marongiu, A. Scalambra, D.
Panella, A. Ladu, A. Cattani, L. Carbonaro, E. Urru, A. Cremonini, F. Fiocchi, A. Maccaferri, M. Morsiani, M. Poloni, “Status of the Radio Receiver System of the Sardinia Radio Telescope”,to be published inProc. SPIE Millimeter, Submillimeter, And Far-Infrared Detectors And Instrumentation For Astronomy 2016, .
[7] G. Valente, T. Pisanu, P. Bolli, S. Mariotti, P. Marongiu, A. Navarrini, R. Nesti, A. Orfei, “The Dual-Band LP Feed System for the Sardinia Radio Telescope Prime Focus”, In Proc. SPIEMillimeter, Submillimeter, And Far-Infrared Detectors And Instrumentation For Astronomy V, Vol. 7741, 774126, 2010.
[8] G. Valente, A. Navarrini, T. Pisanu, “A Novel 180°Hybridpower Divider”, In Proc. SPIEMillimeter, Submillimeter, And Far-Infrared Detectors And Instrumentation For Astronomy V, Vol. 7741, 774126, 2010.
[9] G. Valente, A. Navarrini, and T. Pisanu, “Double Ridged 180 Hybrid Power Divider with Integrated Band Pass Filter,” IEEE Microw. Wireless Compon. Lett., Vol. 21, No. 1, Pp. 13–15, Jan. 2011.
[10] T. Pisanu, P. Marongiu, A. Navarrini, And G. Valente, A Compact L-Band Orthomode Junction, Proc. SPIE, Vol. 7741, Millimeter, Submillimeter, And Far-Infrared Detectors And Instrumentation For Astronomy V, Jul. 2010.
[11] G. Valente, G. Montisci, T. Pisanu, A. Navarrini, P. Marongiu, A. Casula, “A Compact L-Band Orthomode Transducer for Radio Astronomical Receivers at Cryogenic Temperature”, IEEE Trans. Micr. TheoryAnd Tech., Vol. 63, Issue 10, pp. 3218, Oct. 2015. [12] G. Valente, G. Montisci, S. Mariotti, “High-Performance Microstrip Directional Coupler for Radio-Astronomical Receivers at
Cryogenic Temperature”, Electronics Letters 50, 449 – 451, (2014).
[13] P. Bolli, F. Huang, “Superconducting Filter for Radio Astronomy Using Interdigitated, Capacitively Loaded Spirals, Experimental Astronomy”, March 2012, Volume 33, Issue 1, Pp 225-236.
[14] S. Mariotti, G. Valente, Calibrazione della Marca di Rumore del Ricevitore Coassiale LP, OACInternal Report N. 26, June 12, 2013.
[15] L. Cresci, P. Curioni, V. Natale, R. Nesti, A. Orfei, D. Panella, J. Roda, C-Band Circular Corrugated Horn for the SRT Beam Waveguide Focus, Technical Memo Gai04-TM-13.0, May 7th, 2011.
[16] O. Peverini, A. Virone, G. Addamo, R. Tascone, Development of Passive Microwave Antenna-Feed Systems for Wide-Band Dual-Polarisation Receivers, IET Microwaves, Antennas &Propag. Vol. 5, Issue 8, Pp. 1008–1015, June 2011.
[17] A. Orfei, A. Cattani, M. Poloni, J. Roda, S. Mariotti, A. Maccaferri, A. Orlati, A. Scalambra, Caratterizzazione Del Rivcevitore Nella Banda 5.7-7.7 Ghz, Srt Memo Series Gai04-Fr-5.0 May 5th, 2011.
[18] A. Orfei, L. Carbonaro, A. Cattani, A. Cremonini, L. Cresci, F. Fiocchi, A. Maccaferri, G. Maccaferri, S. Mariotti, J. Monari, M. Morsiani, V. Natale, R. Nesti, D. Panella, M. Poloni, J. Roda, A. Scalambra, G. Tofani, A Multi-FeedReceiver in the 18 to 26.5 GHz Band for Radio Astronomy, IEEE AntennasPropag. Mag. 52(4), 62, 2010.
[19] G. Valente , G. Serra , F. Gaudiomonte , A. Ladu , T. Pisanu , P. Marongiu , A. Corongiu , A. Melis , M. Buttu , D. Perrodin , G. Montisci , G. Mazzarella , E. Egron , N. Iacolina , C. Tiburzi and V. Vacca, " A Multi-feed S-Band CryogenicReceiverfor the Sardinia Radio TelescopePrimary Focus ", Proc. SPIE 9153, Millimeter, Submillimeter, And Far-Infrared Detectors AndInstrumentation For Astronomy Vii, 91530q (July 23, 2014);
[20] A. Ladu, G. Valente, G. Montisci, G. Mazzarella, “A Wideband Quadruple-Ridged Horn Antenna for the Multifeed S-Band Receiver of the Sardinia Radio Telescope”, Journal Of Electromagnetic Waves And Applications, 2016;
[21] Navarrini, A. And Plambeck, R. L.” A Turnstile Junction Waveguide Orthomode Transducer”, IEEE Transactions On Microwave Theory And Techniques, Vol. 54, No. 1, January 2006.
[22] Valente, G., Navarrini, A., “Design of Planar Orthomode Transducer For 84-116 GHz “, 24rd International Symposium On Space Terahertz Technology, Groningen, The Netherland Proceedings, April 2013.
[23] Radiall, “Right Angle Square Flange Jack Recept: R125654450”, https://www.radiall.com/sma-right-angle-square-flange-jack-recept-with-cylindrical-contact-28636.html
[24] CST Microwave Studio, Darmstadt, Germany; http://www.cst.com/
[25] TTI , “TTI-CLNA-2248cryogenicAmplifier”, http://www.ttinorte.es/en/?page_id=1632;
[26] George Behrens, William Campbell, Dave Williams, Steven White, “Guidelines For The Design Of Cryogenic Systems “, Electronics Division Internal Report No. 306 March 1997;
[27] J.G. Weinsed Ii, “Handbook Of Cryogenic Engineering” Taylor &Francis, 1998;
[28] G. Valente, P. Marongiu, J. Roda, “Studio dell'architettura Criogenica del Ricevitore Coassiale LP”, Internal Report N. 43, 9 Dicembre 2014;
[29] Helix Technology, “Multiple Uses of Model 22C/350C Cryodyne Refrigerators” Helix Technology Corporation,www.helixtechnology.com.
[30] Simone Dessì, Giuseppe Valente, “Design, Fabrication and Characterization of aLow-Pass Filter for the IF section of the Sardinia Radio Telescope”, OAC Internal Report 38 Agosto 2014.
[31] S. Dessi, A. Fanti, G.Valente, G. Mazzarella, G. Montisci, T. Pisanu “Low Cost Elliptic Filter for Wireless Application”, 22nd Telecommunication forum TELFOR 2014, Serbia; belgrade, Nov. 25-27, 2014.
[32] Andrea Uccheddu, “Progettazione e caratterizzazione di un filtro passa banda a linee accoppiate e del relativo powersplitter per applicazioni radio-astronomiche su SRT”, Facoltà Di Ingegneria e Architettura Corso Di Laurea Magistrale In Ingegneria Delle Telecomunicazioni, Relatore Dr. A. Casula.
[33] G. Van Rossum, Python Tutorial, Technical Report Cs-R9526, Centrum Voorwiskundeeninformatica (Cwi), Amsterdam, May 1995.
[34] Rappin, Noel; Dunn, Robin (March 1, 2006). WxpythonIn Action. Greenwich: Manning Publications. P. 552. Isbn 978-1-932394-62-7
[35] Pyvisa Authors, Http://Pyvisa.Sourceforge.Net/