Impact of morphological and functional features
on hospitals’ energy consumption:
A comparative analysis of six case studies
M. COCCAGNA
1, S. CESARI
2, P. VALDISERRI
3, P. ROMIO
4, S. MAZZACANE
11
CIAS Research Center for pollution control in high sterility rooms, Department of Architecture
University of Ferrara
via Saragat 13, 44122 Ferrara, ITALY
[email protected], [email protected]
2
Department of Architecture
University of Ferrara
via della Ghiara 36, 44121 Ferrara, ITALY
[email protected]
3
Department of Industrial Engineering
University of Bologna
Viale Risorgimento 2, 40136 Bologna, ITALY
[email protected]
4
AUSL Bologna
Via Castiglione 29, 40124 Bologna, ITALY
[email protected]
Abstract: -
Due to their 24/7 operation and having to meet strict mandatory requirements for indoor air quality and sterility [1-3], hospitals are among the most energy-intensive facilities [4], thus significantly contributing to greenhouse gas emissions [5]. Even more alarming, however, is that while the steady evolution in healthcare delivery requires the continuous remodelling of the spaces in operative structures, involving both architectural-distributive aspects and building plant systems – and therefore underlining the need of forecasting the changing hospital energy needs - energy analyses are still rarely based on departmental level, thus hospital energy consumption by space type remains largely unexplained. The objective of the work is the development and experimental validation of a numerical model for the annual energy consumption assessment of six hospitals located in the province of Bologna (Italy), in relation to the morphological features of the buildings and the characteristics of the envelope, the different medical functions, the typology, operating conditions and hours of the plant systems, the comfort needs of patient and healthcare staff, etc. Aimed at addressing the weaknesses of the studies available in literature, the methodological framework represents the main aspect of the work. The model was based on the identification of the energy needs and consumptions from micro (single spaces) to macro scale (macro-area) and was then tested for each healthcare facility through the exclusive use of measurement data. The numerical model enables to forecast the energy consumption variations and, what is the most important, the saving potential related to the renovation or layout modification of existing healthcare facilities, this analysing the impact of architectural and functional features, together with energy goals.Besides functional and morphological evaluations about the six case studies examined, this paper outlines the preliminary results of the work and reports in a parametric form the findings regarding the distribution of the conditioned floor area and of the external surface in relation to the type of spaces.
Key-Words: - hospitals, energy consumption, morphological aspects, functional features, measurement data,
benchmarking, prediction
1 Introduction
Buildings are the largest energy consuming sector in the world [6], accounting for 20% of the total delivered energy consumed [7]. At EU level, the building sector is responsible for 40% of final energy consumption and 36% of green-house gas
emissions [4, 8-10], one third of this is due to non-residential buildings [11]. Whilst accounting for 7,5% of the total built area within the non-residential sector [12], hospitals present the highest energy consumption per unit of floor area [13]. They contribute 10% of the total energy use [4] and
are estimated to account for roughly 5% of the EU carbon dioxide emissions [5] (in 2013 the U.S. healthcare sector produced 9.8% of the national total [14]). Therefore, while they should be designed to improve public health and respect the environment, hospitals are actually contributing to the very problem they are trying to solve, and their negative effects are proportional to their age.
Taking into consideration the EU healthcare building stock, an average of 60% of the structures date back to before 1980 (a percentage ranging from 76% in Hungary to 74% in Sweden, 66% in Germany, 53% in Poland, and 30% in Spain), while only about 15% were built after 2000 [15]. As regards the Italian context, the majority of the healthcare building stock (66%) is characterised by structures opened between 1950 and 2000, outdated both from the architectural and operational point of view, while only the 30% of the complexes were built in the last twenty years [16].
High hospitals’ energy consumptions are mostly due to extremely high demands for space heating and cooling throughout the year, caused by the need of high ventilation rates and the strict requirements for microclimatic control [1-3]. Also the demand of district hot water (DHW) is substantial [17], as well as the need of electricity [18-20, 21, 22].
Moreover, hospitals’ energy profile is constantly affected and transformed by the steady evolution in healthcare delivery. The fast-moving progresses in medical technologies and equipment, along with the rapid advances in the diagnostic techniques and treatment procedures, require the continuous remodelling of the spaces in operative healthcare structures and highly modify hospital energy needs. This process, involving both architectural-distributive aspects and the progressive adaption of the building plant systems, underlines the need of forecasting these new dynamics also in terms of costs.
Indeed, the economic sustainability of a healthcare facility results to be a fundamental aspect. At European level, the global health expenditure has risen of about 20% in the last twenty years, reaching 30% for the Italian context and bringing healthcare management to an unsustainable condition [23]. Albeit energy costs are often seen as fixed costs, in the financial performance of the hospital every dollar saved in energy and operating costs is equal to generating $20 growth in new top line revenues [24]. Therefore, energy savings can be viewed as an ongoing, high yield, low risk investment or revenue stream that enable to reduce costs without impacting medical services.
Against this background, and in view of the increasingly stringent energy efficiency targets and environmental issues, the need of a more robust and reliable focus on hospital energy assessment is becoming more and more important, also considering that a growing number of studies have uncovered a mismatch between the predicted energy performance of buildings and their actual measured energy use and resulting utility bills, an issue addressed as ‘the performance gap’ [25-28].
Nevertheless, the assessment of energy performance and retrofit potentials for hospital buildings is very arduous because of the substantial size, energy-intensity and heterogeneity [29], together with the lack of energy data from a sufficiently large number of buildings for benchmarking [21]. In the following section, a state of the art review of the existing studies about the evaluation and prediction of hospital energy behaviour is reported.
2 State of the art
The current scientific literature about energy performance assessment and forecasting models for healthcare facilities includes a huge variety of approaches which largely differ in the method of analysis, the energy issues investigated, the type of building – existing or prototype – or hospital spaces to which the method is applied, as well as the scale at which the research work is conducted.
The main methods are briefly reviewed in [28]. Here are presented the first-principle models, which span from stationary calculations, via semi-dynamic methods, to dynamic simulation; the machine learning approach, which requires training data provided by either measurements or first-principle models, and covers techniques such as regression analysis, artificial neural networks, support vector machines; measurements, which include metering the energy delivered at building or sub-systems level on the basis of different temporal resolution (from annual intervals to only a few minutes or even seconds) and allow to capture energy-related data, such as indoor and outdoor conditions, occupancy, and control systems.
An analysis of the studies available in literature shows that the majority of the works are based only on dynamic thermal simulation models [24, 29-37], albeit some recent approaches also employ measurement data in order to calibrate the model [16, 38-43]. Indeed, since the late ’70s, building simulation is a well-recognized method for the building energy performance assessment [44]. Furthermore, as this approach requires the use of
energy simulation programs, nowadays its application is increasing wider and wider due to mature and diffuse ICT technologies. The method is used both to predict the indoor air temperature and humidity in time-dependent external weather conditions and to assess the influence of different buildings features on the building thermohygrometric behaviour and comfort [45]. Nevertheless, simulation-based methods are characterised by several difficulties in properly modelling the building-HVAC system for large structures, like hospitals, and by time consuming simulations. Large models can also limit the number of possible simulations, since even modest retrofit proposals could imply changes to many parameters [16].
Conversely, simplified steady-state models, often purposely developed, are based on empirical and/or experimental mathematical models. In particular, the adoption of simplified methodologies related to several control techniques able to assess the possibilities for increasing energy efficiency in hospitals were presented in Refs. [15, 46]. Here, the tool, which was tested and calibrated at the new emergency hospital located in Novi Sad, Serbia, enables fast analyses by avoiding complex dynamic modelling. Finally, some approaches are based only on on-site measurements [19, 21, 22].
Taking into consideration the energy aspects investigated, it arises that, although a comprehensive analysis of the energy behaviour of hospital buildings should consider all levers affecting energy performance, current scientific literature does not provide worthy studies that explored all the energy related aspects. Čongradac et al. [15] focused on hospital heating and cooling energy consumption, while other works investigated only electricity [19-22, 47, 48], heat consumption for DHW [17], or comfort in healthcare environments [32, 38, 39, 49, 50]. Differently, a wide variety of studies deeply explored the benefits and cost-effectiveness of energy retrofit measures (ERMs) and energy saving measures (ESMs), making a comparative analysis between different strategies [16, 29, 40, 46] or focusing on only one of them and exploring some variations of it [9, 30, 31, 41-43, 51, 52].
A more critical review of the hospital building type and spaces examined in literature shows that these methods were rarely applied to existing and operative hospital structures [15, 40, 42, 43, 46]. Most of the studies were developed considering a reference building representative of the hospital building category. Nevertheless, each reference building was defined on the base of different
criteria, like the standards reported by regulations [24, 33-37], statistical data coming from a large number of hospitals [29], hospital templates or reports and datasets providing typical hospital characteristics [24, 33-36], or the parameters dictated by the method employed [32]. Again, several studies took into consideration only single hospital spaces (like a department) [19, 21, 22, 30, 38, 39, 41], or only some buildings representative of the healthcare complex [16-31], due to the difficulties in modelling, calibrating, predicting and interpreting results for all the hospital spaces [16].
In addition, the majority of the aforementioned approaches analysed the hospital (either existing or prototype) at building level or focused just on some healthcare spaces or departments. Only few works investigated the whole hospital at departmental level [15, 24, 29, 33-37, 46]. Nevertheless, these studies did not refer all the energy related aspects to this space distinction.
Against this background, the Advanced Energy Design Guides (AEDGs) for Large Hospitals [33] and for Small Hospitals and Healthcare Facilities [24] – a product of a collaboration between ASHRAE, AIA, IES, USGBC, and DOE – together with the related Technical Support Documents (TSDs) [34, 36] and a study developed by the University of Washington's Integrated Design Lab (IDL) [37], represent more comprehensive works. These studies thoroughly investigated the energy behaviour of hospital buildings by considering all the energy related aspects at departmental level. The works employed the dynamic thermal simulation approach applied to baseline and low-energy reference buildings in different climate zones.
More in detail, the two AEDGs [24, 33] analysed baseline and energy saving parameters regarding the building envelope, vertical fenestration, lighting (natural and electric), HVAC, service water heating (SWH) and plug and process loads (PPLs), then developing specific ESMs, and finally calculating the attained savings. The guides use the macro-level classification of hospital spaces – the same used in scientific literature and regulation [53-57] – distinguishing between Inpatient Units (IPUs), Diagnostic and Treatment Facilities (D&T), and nonclinical spaces, and provide prescriptions regarding daylighting, space layout and lighting power densities (LPDs) in relation to these three macro-areas.
Conversely, the three TSDs [34-36], which integrate the AEDGs, include a more comprehensive analysis of the surface distribution of hospital prototype distinguishing by all the space types. To the space categories identified were
referred baseline and energy saving values for ventilation, total airflow requirements, LPDs, PPLs and SWH loads. Moreover, the documents include parameters regarding the building envelope, vertical fenestration, infiltration, exterior lighting, elevators and plant systems, along with the ESMs and calculated savings.
Similarly to the TSDs, the work of the University of Washington's IDL [37], focused on achieving a 60% reduction in hospital energy use, is based on an accurate distinction of the spaces according to their use. However, to this distinction are not referred any of the specifications provided by the work and regarding the building envelope, vertical fenestration, external surface, natural ventilation, lighting, building and plant systems, electricity and natural gas consumption by end use, building peak load components, and the related energy and cost savings.
The lack of worthy studies on hospital energy behaviour at departmental level represents a critical knowledge gap in the literature. Indeed, hospitals are known to show a very large variety of area specific energy consumption [58]. Different departments and space types have different morphological characteristics, plant systems, conditioning requirements, occupancy, area, equipment, etc. Therefore, it is different their energy consumption and, what is the most important, the possibility of savings [15, 21, 33]. For this reason, the academic literature has pointed out that hospital energy benchmarks need to be resolved for as specific an area as possible [59-60].
Summarising, the review of the existing studies presented above underlines a series of critical issues regarding hospital energy behaviour assessment and prediction. Firstly, the shortage of works primarily based on measurement data causes a lack of data measured and estimated energy consumptions for hospital buildings. Secondly, a lack of studies exploring hospital energy performance by carefully considering the huge domain of the affecting factors means that the outcomes available in literature are strictly dependent on the investigated loads pattern and cannot be extended to different buildings functions and to different locations [15, 61]. This aspect, together with the absence of studies examining large samples of whole existing operative structures, also hinders the construction of more robust and reliable energy benchmarking. Again, despite increasing research activity in the past decade, it arises that energy analyses are still rarely based on departmental level, thus hospital energy consumption by space type remains largely unexplained [20].
3 Structure of the method of analysis
The aim of the work consists in the development of a numerical model for the annual hospital energy consumption assessment of six hospitals located in the province of Bologna, Italy, in relation to the different departments, medical functions, type of HVAC system, morphological features of the buildings and levels of insulation, ventilation and humidification rates, operating hours, contribution of active and passive energy recovery systems, etc. Although the research has been considering different hospitals within the national context, six hospitals located in the same province have been chosen in order to avoid the climate variables between different regions.The numerical model was then tested for each healthcare facility through the use of equipment, instruments for the continuous monitoring of technical and physical parameters, and heat meters, which made it possible to monitor the real hospital energy consumption according to the type of management and the climate trends.
The model allows to forecast the energy consumptions related to the refurbishment or modification of existing hospitals, analysing the impact of architectural and functional features, as well as of energy goals.
The main aspect of the work is represented by the methodological framework, which has been based on the identification of the energy needs and consumptions from micro (single space) to macro scale (macro-area). Indeed, the main purpose is to go beyond the existing studies reviewed in section 2, which look at the healthcare structure as a single and unique element of consumption, without a separation between different space types.
Actually, the setup of the whole method of analysis is aimed at addressing the weaknesses of the studies available in literature. Indeed, the exclusive use of measurement data collected from existing and operative hospitals provides a robust and reliable dataset and avoids the inaccuracies that can come from thermal building simulation methods. Furthermore, the model developed takes into consideration all the factors affecting building energy behaviour, providing a comprehensive tool.
The objective of the work, omitting complex dynamic modeling, is also to develop a method as simple as possible, which enables fast obtaining of fairly reliable results, being primarily intended for ordinary engineers, architects, technical staff responsible for the maintenance of healthcare facilities and energy managers.
The design of the new assessment model has been developed into five steps.
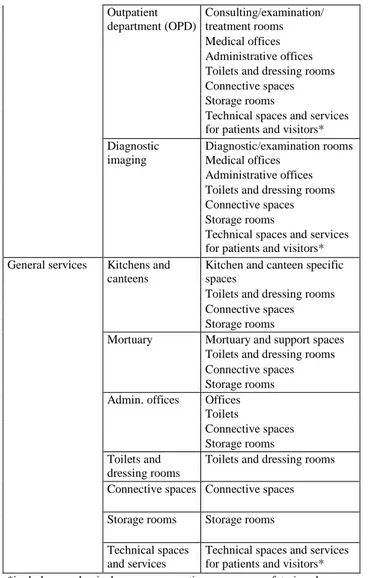
The first phase concerned the definition of the main parameters connected to the hospital comfort and energy consumption (taking into account both compulsory/suggested goals and experimental data). The second phase consisted in the collection of information about the six hospitals. The data have been gathered through the use of sensors, the analysis of primary sources and of building plants, in order to arrange a simplified model to calculate the energy requirements of each building. The third phase was aimed to conduct an in depth analysis of the interface between the research parameters, highlighting the relation between them and the different use of spaces. This part contains the analysis of each case study from micro to macro scale cited above. Specifically, each healthcare facility was considered floor by floor and the spaces were distinguished in relation to the single space (micro scale), the functional area (FA) (medium scale), and the macro-area (macro scale) (see Table 1), according to the taxonomy of hospital spaces used in scientific literature and regulation [24, 33, 53-57].
Macro-Area Functional area Single space
Inpatient Units (IPUs)
Inpatient units Patient rooms Examination rooms Medical offices Administrative offices Toilets and dressing rooms Connective spaces Storage rooms
Technical spaces and services for patients and visitors* Diagnostic and
Treatment (D&T)
Accident and Emergency (A&E)
A&E specific spaces (observation unit, triages, etc.) Diagnostic/examination rooms Medical offices
Administrative offices Toilets and dressing rooms Connective spaces Storage rooms Medical offices Medical offices
Toilets and dressing rooms Connective spaces Storage rooms
Technical spaces and services for patients and visitors* Laboratories Laboratories
Medical offices Administrative offices Toilets and dressing rooms Connective spaces Storage rooms
Technical spaces and services for patients and visitors* Operating theatres Operating rooms (ORs) and
support spaces
Toilets and dressing rooms Connective spaces Storage rooms
Technical spaces and services for patients and visitors*
Outpatient department (OPD) Consulting/examination/ treatment rooms Medical offices Administrative offices Toilets and dressing rooms Connective spaces Storage rooms
Technical spaces and services for patients and visitors* Diagnostic
imaging
Diagnostic/examination rooms Medical offices
Administrative offices Toilets and dressing rooms Connective spaces Storage rooms
Technical spaces and services for patients and visitors* General services Kitchens and
canteens
Kitchen and canteen specific spaces
Toilets and dressing rooms Connective spaces Storage rooms
Mortuary Mortuary and support spaces Toilets and dressing rooms Connective spaces Storage rooms Admin. offices Offices
Toilets
Connective spaces Storage rooms Toilets and
dressing rooms
Toilets and dressing rooms Connective spaces Connective spaces Storage rooms Storage rooms Technical spaces
and services
Technical spaces and services for patients and visitors* *include mechanical spaces, meeting rooms, cafeteria, lounges, pharmacy, rehabilitation gym and ancillary spaces, chapel, etc.
Table 1. Subdivision of hospital spaces
The research results for each energy related aspect analysed have always been reported both at single space level and at functional area level, like in the following examples (Table 2-3):
Single space A B C D E F
Patient rooms* A&E specific spaces* Medical offices* Administrative offices* Laboratories*
ORs and support spaces* Consulting/Examination rooms* Diagnostic/Examination rooms* Kitchen and canteen specific spaces* Mortuary and support spaces* Toilets and dressing rooms Connective spaces Storage rooms
Technical spaces and services
Macro-Areas
Inpatient units
Diagnostic and Treatment General services
*as outlined in Table 1, these are single spaces and do not include toilets, connective spaces, storage rooms, technical spaces and services, as well as other support spaces.
Table 2. Example of the presentation of the results obtained by the single space level analysis, including specifications about some of the spaces
Functional area A B C D E F
Inpatient units*
Accident and Emergency (A&E)* Medical offices* Administrative offices* Laboratories* Operating theatres* Outpatient department* Diagnostic imaging* Kitchens and canteens* Mortuary*
Toilets and dressing rooms Connective spaces Storage rooms
Technical spaces and services
Macro-Areas
Inpatient units
Diagnostic and Treatment General services
*as outlined in Table 1, these are FAs and include toilets, connective spaces, storage rooms, technical spaces and services, as well as the support spaces specific of each FA.
Table 3. Example of the presentation of the results obtained by the functional area level analysis, including specifications about some of the functional areas
This distinction by space type was essential also to make a comparative analysis of the research results between the hospital case studies.
The fourth phase of the work was committed to the tuning of the calculation system and of qualitative and quantitative filters to relate thermal properties and energy consumption to the architectural features as morphology, layout, functions of the interior spaces and the comfort needs of patients and medical staff.
Finally, during the fifth phase it was carried out a comparative analysis of the hospital case studies, including examples of inner variations if changing some architectural or functional features, taking into account their characteristics and the main variables affecting energy analysis.
In this paper are reported in a parametric form the preliminary results of the work, regarding the morphological aspects of the six hospitals analysed and the distribution of the conditioned floor area and of the external surface in relation to the type of spaces.
3.1 Case studies
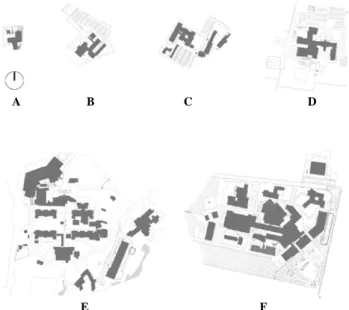
The research analysed six hospitals taken as case studies (Fig. 1, Table 4-5) and identified as Hospital A, B, C, D, E and F, which are located in the Emilia
Romagna region (Italy), nationally recognized as a best practice in healthcare delivery. All the healthcare structures belong to the Local Health Unit of Bologna, the main province of the region.
Data A B C D E F orig. add. Year of Constr. 1900-1940 ✓ ✓ ✓ 1940-1980 ✓ ✓ ✓ 1980-2000 after 2000 ✓ Conditioned floor area (m²) 3.385 6.033 8.185 13.165 50.786 88.901 S/V* 0,43 0,54 0,43 0,56 0,43 0,34 S/Conditioned floor area 1,36 1,47 1,54 1,51 1,45 1,11
*S = external surface and V = conditioned volume
Table 4. Main characteristics of the hospitals analysed
A B C D
E F
Fig.1 Planimetric diagrams of the hospitals analysed
Departments A B C D E F
Anaesthetics ✓ ✓ ✓ ✓
Breast care ✓ ✓ ✓
Cardiology ✓ ✓ ✓
Care of the elderly ✓ ✓
Dialysis ✓ ✓
Ear nose and throat (ENT) ✓ ✓
Endocrinology ✓ ✓ ✓
Extensive Rehabilitation ✓ ✓
Accident and Emergency ✓ ✓ ✓ ✓ ✓ Functional Rehabilitation ✓ Gastroenterology ✓ ✓ ✓ ✓ ✓ General surgery ✓ ✓ ✓ ✓ ✓ ✓ Gynaecology ✓ ✓ ✓ Internal Medicine ✓ ✓ ✓ ✓ ✓ ✓ Long-term care ✓ ✓ ✓
Maternity and Gynaecology ✓ ✓ ✓ ✓
Medical laboratory ✓ ✓ ✓ ✓ ✓
Neurology ✓ ✓
Oncology ✓ ✓ ✓
Ophthalmology ✓ ✓ ✓
Pediatrics ✓ ✓
Radiology ✓ ✓ ✓ ✓ ✓
Rehabilitation Medicine ✓ ✓ ✓
Specialized Surgery ✓ ✓ ✓
Urology ✓
Number of hospital beds 34 92 114 211 372 654
Table 5. Hospitals’ departments and number of hospital beds
4 Analysis of the healthcare functions
Similarly to the investigation methodology used by Čongradac et al. [15], the entire hospital buildings were created in Excel and defined room by room, to which were referred the measurement data collected.
After providing a series of input data (general building data, building envelope data, internal heat loads, microclimatic requirements, room location, orientation and usage), a number of intermediate results are calculated, always referred to the type of spaces, like the conditioned floor area, the external surface, etc.
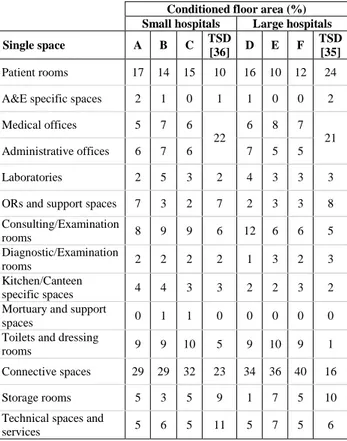
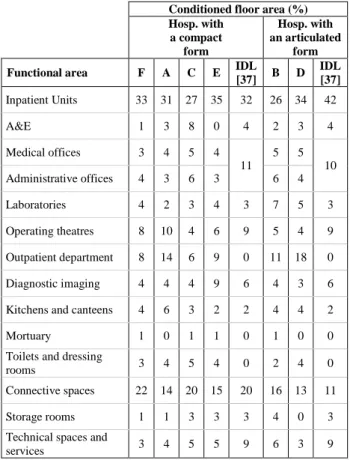
As reported in Table 6-7 and in Figs. 2-3, the research findings regarding the percentage distribution of the conditioned floor area for the six hospitals were compared to the values reported in Refs. [34-37]. Although the studies exposed in the Refs. used building simulation methods and were based on prototype buildings and not real case studies, they were selected for the comparison since they are the only ones which analysed the hospital building by making a clear and comprehensive distinction of the spaces in relation to their use.
In order to aid a proper interpretation of the first results, it is necessary to underline that the TSD for Small Hospitals and Healthcare Facilities [36] refers to structures with a surface up to about 8.000 m2, such as hospitals A, B and C, while the TSD for Large Hospital [34-35] regards structures with a surface ranging from about 9.000 to 46.000 m2, a category to which hospitals D, E and F belongs. The study developed by the University of Washington's IDL [37] analyses two types of hospital building form: a traditional and compact form, like hospitals A, C, E and F whose S/V ratio ranges from 0,34 to 0,43, and a more articulated one, like hospitals B and D, having a S/V ratio between 0,54 and 0,56 (see Table 2 and Fig. 1). In addition, both the TSDs analysed the hospital spaces at single space level, while the work of the IDL distinguished the spaces at department level. For this reason, the analysis of the six hospitals at single space level is compared to the results of the TSDs, while the analysis of the
hospitals at functional area level is compared to the values reported by the IDL.
Conditioned floor area (%) Small hospitals Large hospitals
Single space A B C TSD
[36] D E F
TSD [35]
Patient rooms 17 14 15 10 16 10 12 24 A&E specific spaces 2 1 0 1 1 0 0 2 Medical offices 5 7 6 22 6 8 7 21 Administrative offices 6 7 6 7 5 5 Laboratories 2 5 3 2 4 3 3 3
ORs and support spaces 7 3 2 7 2 3 3 8 Consulting/Examination rooms 8 9 9 6 12 6 6 5 Diagnostic/Examination rooms 2 2 2 2 1 3 2 3 Kitchen/Canteen specific spaces 4 4 3 3 2 2 3 2
Mortuary and support
spaces 0 1 1 0 0 0 0 0
Toilets and dressing
rooms 9 9 10 5 9 10 9 1
Connective spaces 29 29 32 23 34 36 40 16
Storage rooms 5 3 5 9 1 7 5 10
Technical spaces and
services 5 6 5 11 5 7 5 6
Table 6. Distribution of the conditioned floor area in relation to the use of the spaces in small and large hospitals
Fig.2 Distribution of the conditioned floor area in relation to the three macro-areas in small and large hospitals
Conditioned floor area (%) Hosp. with a compact form Hosp. with an articulated form
Functional area F A C E IDL
[37] B D IDL [37] Inpatient Units 33 31 27 35 32 26 34 42 A&E 1 3 8 0 4 2 3 4 Medical offices 3 4 5 4 11 5 5 10 Administrative offices 4 3 6 3 6 4 Laboratories 4 2 3 4 3 7 5 3 Operating theatres 8 10 4 6 9 5 4 9 Outpatient department 8 14 6 9 0 11 18 0 Diagnostic imaging 4 4 4 9 6 4 3 6 Kitchens and canteens 4 6 3 2 2 4 4 2
Mortuary 1 0 1 1 0 1 0 0
Toilets and dressing
rooms 3 4 5 4 0 2 4 0
Connective spaces 22 14 20 15 20 16 13 11
Storage rooms 1 1 3 3 3 4 0 3
Technical spaces and
services 3 4 5 5 9 6 3 9
Table 7. Distribution of the conditioned floor area in relation to the use of the spaces in hospitals with a compact form and in those with an articulated one
Fig.3 Distribution of the conditioned floor area in relation to the three macro-areas in hospitals with a compact form and in those with an articulated one
The values regarding the distribution of the external surface in the hospitals analysed were compared to the work of the IDL, as outlined in Table 8, since this is the only one that distinguishes between transparent and opaque building envelope components.
Albeit none of the works reviewed above explored the external surface distribution by space
type, for the sake of completeness in Table 9-10 and in Figs. 4-5 are reported the data obtained for the six hospitals analysed. External surface (%) Hosp. with a compact form Hosp. with an articulated form
Functional area F A C E IDL
[37] B D IDL [37] N windows 24 25 17 26 31 0 25 19 NE windows 8 0 0 3 0 26 0 0 NW windows 10 0 6 7 0 33 0 0 E windows 7 18 31 14 22 0 29 28 S windows 27 30 15 27 29 0 25 25 SE windows 10 0 3 6 0 28 0 0 SW windows 7 0 1 3 9 11 0 0 W windows 7 28 26 14 9 0 21 29 Skylights 0 0 0 0 0 2 0 0 Overall Windows 11 10 10 10 12 8 8 15 Opaque building envelope components 89 90 90 90 88 92 92 85
Table 8. Distribution of the external surface in relation to the building envelope components in hospitals with a compact form and in hospitals with an articulated one
External surface (%)
Single space A B C D E F
Patient rooms 13 8 15 12 10 8
A&E specific spaces 4 2 0 1 0 0
Medical offices 5 6 8 6 9 7
Administrative offices 6 8 9 7 6 8
Laboratories 2 6 3 4 2 3
ORs and support spaces 8 3 2 1 3 2
Consulting/Examination rooms 7 10 8 12 6 6 Diagnostic/Examination rooms 3 2 2 2 3 1 Kitchen/Canteen specific spaces 5 6 4 3 2 5
Mortuary and support
spaces 0 1 1 0 0 0
Toilets and dressing
rooms 11 12 12 10 10 11
Connective spaces 25 25 25 38 32 36
Storage rooms 6 4 6 1 8 6
Technical spaces and
services 4 8 5 4 7 5
Table 9. Distribution of the external surface at single space level
Fig.4 Distribution of the external surface in relation to the three macro-areas at single space level
External surface (%) Functional area A B C D E F Inpatient Units 22 15 22 26 32 22 A&E 4 2 4 3 0 1 Medical offices 3 5 7 5 5 3 Administrative offices 3 8 8 5 4 7 Laboratories 2 8 3 5 3 6 Operating theatres 13 6 4 3 5 7 Outpatient department 11 15 6 19 8 8 Diagnostic imaging 6 3 5 4 9 3
Kitchens and canteens 10 6 4 5 3 7
Mortuary 0 2 1 0 0 0
Toilets and dressing
rooms 6 3 6 5 5 6
Connective spaces 14 16 20 19 16 23
Storage rooms 2 4 5 0 4 2
Technical spaces and
services 4 8 5 3 6 4
Table 10. Distribution of the external surface at functional area level
Fig.5 Distribution of the external surface in relation to the three macro-areas at functional area level
Despite healthcare is characterised by the steady shift from inpatient toward outpatient care, the data exposed above show that patient rooms at single space level and Inpatient Units at functional area level are the second and the first space type, respectively, to have an extremely high impact on the distribution of the conditioned floor area, preceded and followed by connective spaces (Table 6-7).
However, for a proper interpretation of the data is necessary to underline that half of the hospitals analysed date back to before 1940, while the others were built before 1980 (Table 4). Therefore, considered the difficulties in space flexibility and layout reorganisation typical of outdated structures, the decrease of patient rooms is less visible in the case studies examined. This process is more evident in the analysis of the conditioned floor area at macro-area level, which underlines that general services are the most impacting space category (Figs. 2-3).
Besides patient rooms and Inpatient Units, consulting and examination rooms, at single space level, and operating theatres and outpatient department, at functional area level, have a quite important role in the distribution of the hospital conditioned floor area, due to the advances in medical procedures and the trend from inpatient toward ambulatory care (Table 6-7).
The analysis of the data regarding the distribution of the external surface in relation to the building envelope components outlines the same values for hospitals with a compact form and for those with an articulated form, regardless of their year of construction (Table 8). In the first ones the glazing area is responsible for 10% of the total external surface, while in the second ones windows contribute only 8% of the external surface, showing that the more articulated distribution was not used to increase the window-to-wall ratio, but only resulted in a greater opaque external surface. Furthermore, the values reported are lower than those outlined in the study of the IDL. This discrepancy could be due to the difference between the period to which the case studies date back and the period in which the
American work was developed (2010), but also to the fact that the American work is based on prototype buildings, thus underlining the importance of the exclusive use of measurement data collected from existing and operative hospitals to avoid the inaccuracies that can come from building simulation methods.
The distribution of the external surface by considering the space type follows a very similar trend to the conditioned floor area. Patient rooms at single space level and Inpatient Units at functional area level are the second and the first space type, respectively, to contribute to the hospital external surface, again preceded and followed by connective spaces (Table 9-10). In order to aid interpretation of these results is important to underline that Inpatient Units and specifically patient rooms, requiring access to daylight more than other hospital spaces, are traditionally located along the building perimeter, around the core zones destined for technical and storage spaces.
In addition to these type of spaces, and similarly to the analysis of the conditioned floor area, consulting and examination rooms at single space level have a rather significant impact on the external surface distribution, but, in this case, an important role is played also by medical and administrative offices, both at single space level and at functional area level. Indeed, despite requiring a lower amount of daylight than patient rooms, these spaces need to have daylight access anyway and therefore are located along the building perimeter.
For the same reason, at functional area level, also operating theatres and outpatient department, which quite contribute to the conditioned floor area, have a considerable impact on the external surface distribution.
5 Conclusions and future developments
The results of the analysis of the six hospitals examined show that the ongoing evolution in clinical and surgical therapy is bringing consistent changings in the organisational and layout features of the interior spaces. Parts of the hospital structure are reorganized to reflect new patterns of treatment.
Spaces previously destined for patient rooms, and Inpatient Units in general, are decreasing in favour of non-clinical spaces and general services, like public connective spaces, patients and visitors specific facilities, administrative and storage areas, etc.
This is the result of three main factors driving evolution in healthcare delivery: the changing population, the advances in healthcare research,
medicine, biotechnology and information technology, affecting also medical staff, and lastly economic and political issues.
The rising patients’ expectations for timely and quicker treatment, the progress of medical techniques and technology and the use of new pain medications and antibiotics are allowing to significantly reduce the patient length of stay. These process, together with the financial and economic crisis and the political pressure to reduce healthcare expenditures, brought to a reduction in hospital beds by about 16% between 2010 and 2015 [62-64]. However, these are only some of the reasons for the increase of the amount of space destined for general services.
The growth of dependent older people needing long-term care has led to the creation of more appropriate healthcare environments, such as geriatric medicine facilities and assisted living structures, which have contributed to the drastic reduction in hospital capacity.
Increased collaboration between healthcare professionals and the new opportunities for interdisciplinary research have brought to the creation of flexible workspaces and shared offices which enable and foster multidisciplinary care and the communication among the staff members.
The transition from printed to electronic medical records, together with progress in nanotechnology, have been significantly reducing the amount of space required to store paper medical records and the size of computers and server rooms at the same time. Therefore, the vacated spaces are converted to house new services for more urgent needs.
Against this background, connective spaces are reorganised and increased to ensure the appropriate circulation of patients, staff and new medical equipment, both for infection control, noise and space-related reasons. Long tunnels and corridors are often used in hospital expansion to connect the original parts of the complex with newly-built huge areas, thus highly contributing both to the hospital conditioned floor area and external surface.
Furthermore, healthcare environments are being redesigned to make them more accessible and familiar, with the introduction of new services and facilities supporting the patients and visitors’ experience.
These changings in the architectural features and layout of the healthcare interior spaces are evidence of the increasing complexity of hospital logistics.
However, despite the ongoing shift from inpatient toward outpatient care and the related decrease of hospital patient rooms, the research findings show that in most of the operative hospitals
this process is happening slowly. Patient rooms still represent a considerable amount of the conditioned floor area and, above all, of the external surface. Taking into consideration hospitals’ outdated building envelope, this last observation underlines the need to further analyse this extremely critical issue.
For this reason, one of the future development of the work, which is going to be widen to other national and international healthcare facilities, is to analyse a number of intermediate results, always referred to the type of spaces, like heat losses due to transmission and ventilation, the heating and cooling energy needs, etc., and investigate examples of inner variations if changing some architectural or functional features.
The aim is to define composite benchmarks for hospitals by taking into account differing energy intensities at a departmental level. Furthermore, being based on larger sample sizes, the work will increase the reliability of the established consumption figures. Such an approach will enable to accommodate the fast-moving changes in healthcare delivery – and their impacts on layout features of hospital interior spaces – as well as the large heterogeneity between hospital buildings. Albeit focussed on hospital buildings, the methodology has a much wider utility as it could be applied to other non-residential building types in temperate climates, even thanks to its ease of use.
References:
[1] B.C. Singer, W.F. Tschudi, High performance
healthcare buildings: a roadmap to improved energy efficiency, Lawrence Berkeley National
Laboratory, 2009.
[2] V. Čongradac, B. Prebiračević, N. Jorgovanović, D. Stanišić, Assessing the energy consumption for heating and cooling in hospitals, Energy and Buildings, Vo. 48, 2012, pp.146-154.
[3] A. Buonomano, F. Calise, G. Ferruzzi, A. Palombo, Dynamic energy performance analysis: Case study for energy efficiency retrofits of hospital buildings, Energy, Vol.78, 2014, pp.555-572.
[4] M. Economidou et al., Europe’s buildings
under the microscope - A country-by-country review of the energy performance of buildings,
BPIE, Brussels, BE, 2011.
[5] LCB-HEALTHCARE European Public Procurement Network, Low Carbon Buildings
in the Healthcare Sector, State of the Art Report, 2011.
[6] International Energy Agency (IEA), Transition
to sustainable buildings: Strategies and opportunities to 2050, OECD/IEA, 2013.
[7] US Energy Information Administration (EIA),
International Energy Outlook 2016, Report
Number: DOE/EIA-0484, 2016.
[8] European Commission, Energy efficiency, Buildings.
https://ec.europa.eu/energy/en/topics/energy-efficiency/buildings (accessed 10.02.18).
[9] J. Grözinger, T. Boermans, A. John, F. Wehringer, J. Seehusen, Overview of Member
States information on NZEBs: Background paper – final report, Ecofys, 2014.
[10] O.B. Kazanci, M. Skrupskelis, P. Sevela, G.K. Pavlov, B.W. Olesen, Sustainable heating, cooling and ventilation of a plus-energy house via photovoltaic/thermal panels, Energy and
Buildings, Vol. 83, 2014, pp.122-129.
[11] Energy Efficiency Trends and Policies in the
Household and Tertiary Sectors: An Analysis Based on the ODYSSEE and MURE Databases,
2015.
http://www.odyssee- mure.eu/publications/br/energy-efficiency-trends-policies-buildings.pdf (accessed 10.02.18).
[12] European Commission, EU Buildings Datamapper, Share of non-residential in total
building floor area.
https://ec.europa.eu/energy/en/eu-buildings-datamapper (accessed 10.02.18).
[13] G.K. Alexis, P. Liakos, A case study of a cogeneration system for a hospital in Greece. Economic and environmental impacts, Applied
Thermal Engineering, Vol. 54, No.2, 2013,
pp.488-496.
[14] M.J. Eckelman, J. Sherman, Environmental impacts of the U.S. health care system and effects on public health, PLoS One, Vol. 11, No.6, 2016.
[15] S. Schimschar, J. Grözinger, H. Korte, T. Boermans, V. Lilova, R. Bhar, Panorama of the European non-residential construction sector, Ecofys, 2011. http://www.leonardo-
energy.com/sites/leonardo-energy/files/documents-and-links/European non-residential building stock - Final Report_v7.pdf (accessed 10.02.18).
[16] Ministero della Salute, Direzione generale della digitalizzazione, del sistema informativo sanitario e della statistica, Elenco delle strutture di ricovero attive al 30 dicembre 2016. http://www.salute.gov.it/portale/documentazion
e/p6_2_8_1_1.jsp?id=13, 2017 (accessed 10.02.18).
[17] J. Bujak, Heat consumption for preparing domestic hot water in hospitals, Energy and
Buildings, Vol.42, No.7, 2010, pp.1047-1055.
[18] F. Salata, I. Golasi, M. di Salvatore, A. de Lieto Vollaro, Energy and reliability optimization of a system that combines daylighting and artificial sources. A case study carried out in academic buildings, Applied Energy, Vol.169, 2016, pp.250-266.
[19] T. Rohde, R. Martinez, Equipment and energy usage in a large teaching hospital in Norway,
Journal of Healthcare Engineering, Vol.6,
No.3, 2015, pp.419-33.
[20] N. Christiansen, M. Kaltschmitt, F. Dzukowski, Electrical energy consumption and utilization time analysis of hospital departments and large scale medical equipment, Energy and
Buildings, Vol.131, 2016, pp.172-183.
[21] P. Morgenstern, M. Li, R. Raslan, P. Ruyssevelt, A. Wright, Benchmarking acute hospitals: Composite electricity targets based on departmental consumption intensities?, Energy
and Buildings, Vol.118, 2016, pp.277-290.
[22] N. Christiansen, M. Kaltschmitt, F. Dzukowski, F. Isensee, Electricity consumption of medical plug loads in hospital laboratories: Identification, evaluation, prediction and verification, Energy and Buildings, Vol.107, 2015, pp.392-406.
[23] World Health Organization, Current Health Expenditure (CHE) as % Gross Domestic Product (GDP). http://apps.who.int/nha/database/Select/Indicat ors/en, 2015 (accessed 10.02.18).
[24] ASHRAE, Advanced Energy Design Guide for
Small Hospitals and Healthcare Facilities: 30% Energy Savings, ASHRAE, 2009.
[25] CIBSE TM54, Evaluating operational energy performance of buildings at the design stage, Chartered Institution of Building Services
Engineers, CIBSE, 2013. http://www.cibse.org/Knowledge/knowledge-items/detail?id=a0q20000008I7f7AAC (accessed 10.02.18). [26] CarbonBuzz. http://www.carbonbuzz.org/sectorbreakdown.js p?id=4 (accessed 10.02.18).
[27] A.C. Menezes, A. Cripps, D. Bouchlaghem, R. Buswell, Predicted vs. actual energy performance of non-domestic buildings: Using post-occupancy evaluation data to reduce the performance gap, Applied Energy, Vol.97, 2012, pp.355-364.
[28] P. de Wilde, The gap between predicted and measured energy performance of buildings: A framework for investigation, Automation in
Construction, Vol.41, 2014, pp.40-49.
[29] F. Ascione, N. Bianco, C. De Stasio, G.M. Mauro, G.P. Vanoli, Multi-stage and multi-objective optimization for energy retrofitting a developed hospital reference building: A new approach to assess cost-optimality, Applied
Energy, Vol.174, 2016, pp.37-68.
[30] Z.A. Adamu, A.D.F. Price, M.J. Cook, Performance evaluation of natural ventilation strategies for hospital wards – A case study of Great Ormond Street Hospital, Building and
Environment, Vol.56, 2012, pp.211-222.
[31] T. Tsoutsos, E. Aloumpi, Z. Gkouskos, M. Karagiorgas, Design of a solar absorption cooling system in a Greek hospital, Energy and
Buildings, Vol.42, No.2, 2010, pp.265-272.
[32] A. Buonomano, U. Montanaro, A. Palombo, S. Santini, Dynamic building energy performance analysis: A new adaptive control strategy for stringent thermohygrometric indoor air requirements, Applied Energy, Vol.163, 2016, pp.361-386.
[33] ASHRAE, Advanced Energy Design Guide for
Large Hospitals. Achieving 50% Energy Savings Toward a Net Zero Energy Building,
ASHRAE, 2012.
[34] E. Bonnema, M. Leach, S. Pless, Technical
Support Document: Development of the Advanced Energy Design Guide for Large Hospitals – 50% Energy Savings, NREL, 2013.
[35] E. Bonnema, D. Studer, A. Parker, S. Pless, P. Torcellini, Large Hospital 50% Energy Savings:
Technical Support Document, NREL, 2010.
[36] E. Bonnema, S. Pless, I. Doebber, P. Torcellini,
Technical Support Document: Development of the Advanced Energy Design Guide for Small Hospitals and Healthcare Facilities - 30% Guide, NREL, 2010.
[37] H. Burpee, J. Loveland, Targeting 100!
Envisioning the high performance hospital: implications for a new, low energy, high performance prototype, University of Washington, 2010.
[38] C.A. Short, K.J. Lomas, R. Giridharan, A.J. Fair, Building resilience to overheating into 1960’s UK hospital buildings within the constraint of the national carbon reduction target: Adaptive strategies, Building and
Environment, Vol.55, 2012, pp.73-95.
[39] K.J. Lomas, R. Giridharan, Thermal comfort standards, measured internal temperatures and thermal resilience to climate change of
free-running buildings: A case-study of hospital wards, Building and Environment, Vol.55, 2012, pp.57-72.
[40] F. Ascione, N. Bianco, R.F. De Masi, G.P. Vanoli, Rehabilitation of the building envelope of hospitals: Achievable energy savings and micro-climatic control on varying the HVAC systems in Mediterranean climates, Energy and
Buildings, Vol.60, 2013, pp.125-138.
[41] M. Ahmadzadehtalatapeh, Y.H. Yau, The application of heat pipe heat exchangers to improve the air quality and reduce the energy consumption of the air conditioning system in a hospital ward - A full year model simulation,
Energy and Buildings, Vol.43, 2011,
pp.2344-2355.
[42] G. Pagliarini, C. Corradi, S. Rainieri, Hospital CHCP system optimization assisted by TRNSYS building energy simulation tool,
Applied Thermal Engineering, Vol.44, 2012,
pp.150-158.
[43] D.B. do E. Santo, An energy and exergy analysis of a high-efficiency engine trigeneration system for a hospital: A case study methodology based on annual energy demand profiles, Energy and Buildings, Vol.76, 2014, pp.185-198.
[44] A. Malkawi, G. Augenbroe, Advanced building
simulation, Spon Press, 2003.
[45] D. Kolokotsa, D. Rovas, E. Kosmatopoulos, K. Kalaitzakis, A roadmap towards intelligent net zero- and positive-energy buildings, Solar
Energy, Vol. 85, No.12, 2011, pp.3067-3084.
[46] V. Čongradac, B. Prebiračević, N. Petrovački, Methods for assessing energy savings in hospitals using various control techniques,
Energy and Buildings, Vol.69, 2014, pp.85-92.
[47] A. Bagnasco, F. Fresi, M. Saviozzi, F. Silvestro, A. Vinci, Electrical consumption forecasting in hospital facilities: An application case, Energy and Buildings, Vol.103, 2015, pp.261-270.
[48] A.L. Zorita, M.A. Fernández-Temprano, L.-A. García-Escudero, O. Duque-Perez, A statistical modeling approach to detect anomalies in energetic efficiency of buildings, Energy and
Buildings, Vol.110, 2016, pp.377-386.
[49] C.R. Iddon, T.C. Mills, R. Giridharan, K.J. Lomas, The influence of hospital ward design on resilience to heat waves: An exploration using distributed lag models, Energy and
Buildings, Vol.86, 2015, pp.573-588.
[50] C.A. Balaras, E. Dascalaki, A. Gaglia, HVAC and indoor thermal conditions in hospital
operating rooms, Energy and Buildings, Vol.39, 2007, pp.454-470.
[51] A. Gimelli, M. Muccillo, Optimization criteria for cogeneration systems: Multi-objective approach and application in an hospital facility,
Applied Energy, Vol.104, 2013, pp.910-923.
[52] H. Cho, A.D. Smith, P. Mago, Combined cooling, heating and power: A review of performance improvement and optimization,
Applied Energy, Vol.136, 2014, pp.168-185.
[53] Agenzia Nazionale per i Servizi Sanitari Regionali, Principi guida tecnici, organizzativi e gestionali per la realizzazione e gestione di ospedali ad alta tecnologia e assistenza. Rapporto conclusivo del Progetto di ricerca finalizzata (ex art. 12, Dlgs 502/92), I
Supplementi di Monitor, No.6, 2003.
[54] N. Setola, Percorsi, flussi e persone nella
progettazione ospedaliera: l’analisi configurazionale, teoria e applicazione,
Firenze University Press, 2013.
[55] R. Palumbo, Metaprogettazione per l’edilizia
ospedaliera, BE-MA, 1993.
[56] F. Rossi Prodi, A. Stocchetti, L’architettura
dell’ospedale, Alinea, 1990.
[57] Enciclopedia medica italiana, Vol.10, USES, 1983.
[58] R. Choudhary, Energy analysis of the non-domestic building stock of Greater London,
Building and Environment, Vol.51, 2012,
No.243-254.
[59] K.J. Lomas, Y. Ji, Resilience of naturally ventilated buildings to climate change: Advanced natural ventilation and hospital wards, Energy and Buildings, Vol.41, 2009, pp.629-653.
[60] B.C. Singer, P. Mathew, S. Greenberg, W. Tschudi, D. Sartor, S. Strom, W. Vernon, M. Nash, L. Burch, Hospital Energy
Benchmarking Guidance -Version 1.0 LBNL Report, Berkeley, Lawrence Berkeley National
Laboratory, 2009.
[61] A. Teke, O. Timur, Assessing the energy efficiency improvement potentials of HVAC systems considering economic and environmental aspects at the hospitals,
Renewable and Sustainable Energy Reviews,
Vol. 33, 2014, pp.224-235.
[62] Organisation for Economic Co-operation and Development (OECD), OECD Health Statistics 2017, 2017, http://dx.doi.org/10.1787/health-data-en (accessed 10.02.18).
[63] OECD, Health care activities. In Health at a
[64] Eurostat, Hospital beds, 2017.
http://ec.europa.eu/eurostat/statistics-explained/index.php/Healthcare_resource_statis tics_-_beds (accessed 10.02.18).