ScienceDirect
Available online at www.sciencedirect.com
Transportation Research Procedia 47 (2020) 688–695
2352-1465 © 2020 The Authors. Published by Elsevier B.V.
This is an open access article under the CC BY-NC-ND license (http://creativecommons.org/licenses/by-nc-nd/4.0/) Peer-review under responsibility of the scientific committee of the 22nd Euro Working Group on Transportation Meeting. 10.1016/j.trpro.2020.03.148
10.1016/j.trpro.2020.03.148 2352-1465
© 2020 The Authors. Published by Elsevier B.V.
This is an open access article under the CC BY-NC-ND license (http://creativecommons.org/licenses/by-nc-nd/4.0/) Peer-review under responsibility of the scientific committee of the 22nd Euro Working Group on Transportation Meeting
Available online at www.sciencedirect.com
ScienceDirect
Transportation Research Procedia 00 (2020) 000–000
www.elsevier.com/locate/procedia
2352-1465 © 2020 The Authors. Published by Elsevier B.V.
Peer-review under responsibility of the scientific committee of the 22nd EURO Working Group on Transportation Meeting.
22nd EURO Working Group on Transportation Meeting, EWGT 2019, 18-20 September 2019,
Barcelona, Spain
Keys to effective transit strategies for commuting
Francesco Bruzzone, Federico Cavallaro, Silvio Nocera
1 1Università IUAV di Venezia, Dorsoduro 2206, 30123 Venice, ItalyAbstract
Commuting poses relevant challenges to cities’ transport systems. Various studies have identified transit as a tool to enhance sustainability, efficiency and quality of the commute. The scope of this paper is to present strategies that increase public transport attractiveness and positively impact its modal share, looking at some case studies and underlining key success factors and possible elements of replica to be ultimately planned in some of the contexts of the Interreg project SMART-COMMUTING. The strategies analyzed in this paper concern prices and fares, service expansion, service improvements, usage of vehicle locators and other technology, changes to the built environment. Relevant gains in transit modal share are more easily achievable when considering integrations between various strategies, thus adapting and tailoring the planning process to the specific context.
© 2020 The Authors. Published by Elsevier B.V.
Peer-review under responsibility of the scientific committee of the 22ndEURO Working Group on Transportation Meeting. Keywords:Transit planning; Commuting; Transit modal shift.
1. Introduction
Most urban transport models aim at minimizing car use and its negative impacts on the environment, while promoting more pedestrian and transit-friendly features (Crane and Crepeau, 1998). These models generally focus on reducing the distance between locations, minimizing travel times and improving the performances of modes of transport alternative to private vehicles, or to design/promote efficient forms of low-impact transportation.
The commuting modes -i.e., the modes selected by commuters to travel- normally include private vehicles, public transport (PT) or active transport modes (Dargay and Hanly, 2007). The general implications deriving from their choice has been widely discussed in the recent years, according to the huge economic, social, health and environmental effects produced (Lorenz, 2018). The effect of the distance from household to destination is well known: several studies have shown that shorter distances are associated with higher rates of active travel (Rodríguez-López et al., 2017). Also, the relationship between commuting duration and the feelings registered (e.g., happiness, sadness, stress, fatigue and pain) has been analyzed in commuting episodes: more time spent on the daily commute is related to higher levels of fatigue and stress during commuting, while also being associated with higher levels of sadness and fatigue during activities of child care (Gimenez-Nadal and Molina, 2019). However, distance and travel time do not completely fill the scopes of transport planning. Commuters’ modal choice depends on a variety of factors. PT remains
2 F. Bruzzone et al. / Transportation Research Procedia 00 (2019) 000–000
one of the most relevant and interesting choices, given its social value and considering its contribution to cities’ sustainability and livability (Wefering et al., 2013). This paper analyzes strategies that have been explored with the goal to increase transit ridership and demand and, in the long term, to favor a modal shift towards PT. The scope of this analysis is to identify successful policies and highlight keys to a more effective transit system, which will be then adopted within the EU project SMART-COMMUTING, which aims at planning a more energy-efficient transportation in urban areas. Strategies to reach this goal have been widely studied and evaluated. Authors generally concentrated on the reduction of emissions, on user’s perception, or on the economic efficiency of the transport system, by monetizing the externalities (Hickman et al., 2010, 2011; Nocera and Cavallaro, 2012; Strompten et al., 2012; Nocera and Tonin, 2014; Liu et al., 2015; Al-Rijleh et al., 2018). The common line between such studies is that improvements in the transport system are best achievable through integrated strategies, which put emphasis on the role of both active transport and PT. This last is described as a fundamental tile of integrated strategies aiming at making sure that cities’ transport systems and commuting flows develop accordingly to global, national and local environmental and socioeconomic goals and priorities. The next sections provide an overview of decision-making tools for selecting effective improvements and an analysis of strategies related to the improvement of PT, specifically conceived for commuters.
2. Mobility decision-making tools
Transit planning and transit projects require the recognition and prediction of multiple variables. This can be obtained using simulation models, which reproduce possible impacts and consequences of any variations of the current state (Chilà et al, 2016; Nocera et al., 2018). Several models and mobility decision-making tools have been made available for authorities to evaluate relevant indicators that assess the performance of the mobility systems and identify the most adequate policies (Cavallaro et al., 2019). KonSULT (2019a) supports “policy makers, professionals and
interest groups to understand the challenges of achieving sustainability in urban transport, and to identify appropriate policy measures and packages”. The tool allows to select the type of environment in which it is applied, objectives
and indicators. It then transforms abstract objectives into measurable and analyzable elements. Five macro-categories encompass all measures (KonSULT, 2019b), namely: land use intervention, infrastructure projects, management and service measures, attitudinal and behavioral measures, pricing interventions. Another tool is the MOMOS – Model for Sustainable Mobility, which evaluates through selected transport, environmental and economic indicators the consequences of specific measures (de Stasio et al., 2016), distinguished in: infrastructural, regulatory, supply, charging, management, urban planning, and vehicle fleet measures.
The next section analyzes possible strategies and measure to improve transit as to increase its attractiveness and modal share for commuting trips, so to provide a comprehensive frame of possibilities that authorities can and should consider and evaluate to improve sustainability and quality of mobility and commuting in their areas.
3. Effective strategies for transit attractiveness
As recalled in the introduction, a wide body of literature dealt with transit having a significant role in making commuting more efficient. This section defines specific strategies that can be adopted to increase the attractiveness of PT in terms of number of ridership and, in the long term, to encourage the modal shift towards transit.
3.1. Price lever
A first set of transit-related strategies is related to fares. The debate is wide and can take many directions, as fares are often approached as a matter of equity. Here, the scope is to understand how lowering or increasing PT fares affects ridership and the system’s attractiveness. Results depend on the context, as alternatives such as private cars are not always available for PT users. This is the case of Asian megalopolis (Wang et al., 2018), where fares can activate modal shift towards transit or other modes (e.g., to relieve pressure from an overcrowded subway line by moving short-distance commuters to bus services). During peak hours, though, effects on flows observed after fare variations have been lower –about 1/3- compared to the daily average. This could be due to the fact that commuters’ demand is strongly inelastic as preference is given to keeping travel times within a limit rather than saving money by shifting from private transport modes to transit or from specific transit modes to other cheaper ones (Libardo and Nocera, 2008).
Francesco Bruzzone et al. / Transportation Research Procedia 47 (2020) 688–695 689 Available online at www.sciencedirect.com
ScienceDirect
Transportation Research Procedia 00 (2020) 000–000
www.elsevier.com/locate/procedia
2352-1465 © 2020 The Authors. Published by Elsevier B.V.
Peer-review under responsibility of the scientific committee of the 22nd EURO Working Group on Transportation Meeting.
22nd EURO Working Group on Transportation Meeting, EWGT 2019, 18-20 September 2019,
Barcelona, Spain
Keys to effective transit strategies for commuting
Francesco Bruzzone, Federico Cavallaro, Silvio Nocera
1 1Università IUAV di Venezia, Dorsoduro 2206, 30123 Venice, ItalyAbstract
Commuting poses relevant challenges to cities’ transport systems. Various studies have identified transit as a tool to enhance sustainability, efficiency and quality of the commute. The scope of this paper is to present strategies that increase public transport attractiveness and positively impact its modal share, looking at some case studies and underlining key success factors and possible elements of replica to be ultimately planned in some of the contexts of the Interreg project SMART-COMMUTING. The strategies analyzed in this paper concern prices and fares, service expansion, service improvements, usage of vehicle locators and other technology, changes to the built environment. Relevant gains in transit modal share are more easily achievable when considering integrations between various strategies, thus adapting and tailoring the planning process to the specific context.
© 2020 The Authors. Published by Elsevier B.V.
Peer-review under responsibility of the scientific committee of the 22ndEURO Working Group on Transportation Meeting. Keywords:Transit planning; Commuting; Transit modal shift.
1. Introduction
Most urban transport models aim at minimizing car use and its negative impacts on the environment, while promoting more pedestrian and transit-friendly features (Crane and Crepeau, 1998). These models generally focus on reducing the distance between locations, minimizing travel times and improving the performances of modes of transport alternative to private vehicles, or to design/promote efficient forms of low-impact transportation.
The commuting modes -i.e., the modes selected by commuters to travel- normally include private vehicles, public transport (PT) or active transport modes (Dargay and Hanly, 2007). The general implications deriving from their choice has been widely discussed in the recent years, according to the huge economic, social, health and environmental effects produced (Lorenz, 2018). The effect of the distance from household to destination is well known: several studies have shown that shorter distances are associated with higher rates of active travel (Rodríguez-López et al., 2017). Also, the relationship between commuting duration and the feelings registered (e.g., happiness, sadness, stress, fatigue and pain) has been analyzed in commuting episodes: more time spent on the daily commute is related to higher levels of fatigue and stress during commuting, while also being associated with higher levels of sadness and fatigue during activities of child care (Gimenez-Nadal and Molina, 2019). However, distance and travel time do not completely fill the scopes of transport planning. Commuters’ modal choice depends on a variety of factors. PT remains
2 F. Bruzzone et al. / Transportation Research Procedia 00 (2019) 000–000
one of the most relevant and interesting choices, given its social value and considering its contribution to cities’ sustainability and livability (Wefering et al., 2013). This paper analyzes strategies that have been explored with the goal to increase transit ridership and demand and, in the long term, to favor a modal shift towards PT. The scope of this analysis is to identify successful policies and highlight keys to a more effective transit system, which will be then adopted within the EU project SMART-COMMUTING, which aims at planning a more energy-efficient transportation in urban areas. Strategies to reach this goal have been widely studied and evaluated. Authors generally concentrated on the reduction of emissions, on user’s perception, or on the economic efficiency of the transport system, by monetizing the externalities (Hickman et al., 2010, 2011; Nocera and Cavallaro, 2012; Strompten et al., 2012; Nocera and Tonin, 2014; Liu et al., 2015; Al-Rijleh et al., 2018). The common line between such studies is that improvements in the transport system are best achievable through integrated strategies, which put emphasis on the role of both active transport and PT. This last is described as a fundamental tile of integrated strategies aiming at making sure that cities’ transport systems and commuting flows develop accordingly to global, national and local environmental and socioeconomic goals and priorities. The next sections provide an overview of decision-making tools for selecting effective improvements and an analysis of strategies related to the improvement of PT, specifically conceived for commuters.
2. Mobility decision-making tools
Transit planning and transit projects require the recognition and prediction of multiple variables. This can be obtained using simulation models, which reproduce possible impacts and consequences of any variations of the current state (Chilà et al, 2016; Nocera et al., 2018). Several models and mobility decision-making tools have been made available for authorities to evaluate relevant indicators that assess the performance of the mobility systems and identify the most adequate policies (Cavallaro et al., 2019). KonSULT (2019a) supports “policy makers, professionals and
interest groups to understand the challenges of achieving sustainability in urban transport, and to identify appropriate policy measures and packages”. The tool allows to select the type of environment in which it is applied, objectives
and indicators. It then transforms abstract objectives into measurable and analyzable elements. Five macro-categories encompass all measures (KonSULT, 2019b), namely: land use intervention, infrastructure projects, management and service measures, attitudinal and behavioral measures, pricing interventions. Another tool is the MOMOS – Model for Sustainable Mobility, which evaluates through selected transport, environmental and economic indicators the consequences of specific measures (de Stasio et al., 2016), distinguished in: infrastructural, regulatory, supply, charging, management, urban planning, and vehicle fleet measures.
The next section analyzes possible strategies and measure to improve transit as to increase its attractiveness and modal share for commuting trips, so to provide a comprehensive frame of possibilities that authorities can and should consider and evaluate to improve sustainability and quality of mobility and commuting in their areas.
3. Effective strategies for transit attractiveness
As recalled in the introduction, a wide body of literature dealt with transit having a significant role in making commuting more efficient. This section defines specific strategies that can be adopted to increase the attractiveness of PT in terms of number of ridership and, in the long term, to encourage the modal shift towards transit.
3.1. Price lever
A first set of transit-related strategies is related to fares. The debate is wide and can take many directions, as fares are often approached as a matter of equity. Here, the scope is to understand how lowering or increasing PT fares affects ridership and the system’s attractiveness. Results depend on the context, as alternatives such as private cars are not always available for PT users. This is the case of Asian megalopolis (Wang et al., 2018), where fares can activate modal shift towards transit or other modes (e.g., to relieve pressure from an overcrowded subway line by moving short-distance commuters to bus services). During peak hours, though, effects on flows observed after fare variations have been lower –about 1/3- compared to the daily average. This could be due to the fact that commuters’ demand is strongly inelastic as preference is given to keeping travel times within a limit rather than saving money by shifting from private transport modes to transit or from specific transit modes to other cheaper ones (Libardo and Nocera, 2008).
690 Francesco Bruzzone et al. / Transportation Research Procedia 47 (2020) 688–695F. Bruzzone et al. / Transportation Research Procedia 00 (2019) 000–000 3 The relation between travel time and PT fares is highlighted by other authors. A case study in Montreal (Zahabi et al., 2012) proves that for every 10% increase of the delta between travel time by car and travel time by transit, the probability of PT being selected as transport mode decreases by 3%: transit fares increases, affect transit’s modal share even more drastically, as a 10% decrease in probability of choosing PT was estimated for every 10% fare rise. Another interesting result is that every dollar of increase in parking fees for auto-vehicles implies a 5% higher probability of transit being chosen as transport mode. Such results suggest that increasing parking costs or reducing transit fares would encourage commuting by PT. More competitive travel times of transit services would also reduce car use for commuting purposes. Such findings are consistent with previous work, indicating the sensitivity of commuters to transit fees and parking pricing. The authors synthesize that the combination of incentives and pricing strategies can help increasing the share of PT. Vale (2013), without denying users’ sensitivity to fees and pricing, finds that in case of job relocation further away compared to an initial situation, commuters choose to stick using PT options only if the total travel time stays within a certain acceptable threshold, whereas the opposite is not necessarily true. This supports Wang et al.’s (2018) findings in underlying the role of travel time and highlights the necessity to stimulate commuters’ willingness to select transit as transport mode with appropriate incentives.
Liu et al. (2019) find that in Queensland (Australia) an average fare reduction of 6.7% has generated a 12% increase in the total number of made journeys and a 4.8% revenue increase from the system operations. Such data is higher than other European case studies, where fare integration between different modes and operators has brought benefits in terms of ridership increments between 4% (Manchester) and 33% (Vienna).
3.2. Service and operations improvements
The scope of this section is to estimate the effectiveness of a variety of level of service improvements, including frequency increases and service expansion, introduction of new options (such as bus rapid transit or light rail), and operational improvements. The last ones are often related with technological aspects, such as traffic light priority systems, automated vehicle locators (AVLs), passenger counting systems, and others. For this reason, they will be examined in a separate and dedicated section (section 2.2.3).
3.2.1. Service expansion
The provision of new, innovative transit options, such as light rail, affects a city’s commuting pattern. Long et al. (2018) study a scenario in which a 5-LRT line plus a feeder network are implemented. Their results indicate that PT modal share would increase, rising by over 13% by 2046, cutting CO2 emissions by more than 15%. They also
highlight that these results might not seem shining, but stress how the existing bus system is unsuitable for future mobility and policy needs, since it provides a fragmented, unpunctual, unreliable service. Recently, Europe has seen new openings of light rail lines, which started in France in the early 1990s. According to field studies and to academic literature (Buehler and Pucher, 2011; Regione Toscana, 2012; IRPET, 2016) investments in light rail are desirable from an economic perspective (it fosters development along the route), an environmental perspective (it has proven to be effective in reducing polluting emissions), and an operational perspective (it increases transit modal share thanks to the higher level of service). In Florence, only two years after opening, tram T1 reduced private traffic along the served corridor by over 25% (Regione Toscana, 2012), while increasing the number of carried passengers to approximately 20 million a year, compared to approximately 12.5 million in 2012 (City of Florence Statistics Service, 2018). Although 50% of passengers carried by the trams already used buses beforehand, 25% used to rely on private transport modes and another 25% did not take that journey before the tramway started revenue service. The tram, therefore, was highly successful in promoting transit as a winning modal choice. Between 1983 and 2008, the German city of Freiburg has almost tripled the supply of light rail service (from 1.1 to 3.2 million vehicles km), at the same time improving suburban rail and bus services (from 2.7 to 3.4 billion seats km annually). The city was suffering relevant congestion and pollution issues and had the highest motorization rate in Germany. In 2006, 65% of the city’s residents and 70% of all jobs were located within 300 meters of a light rail stop: one of the highest transit availability rates worldwide (Buehler and Pucher, 2011). A unified integrated ticketing offer and de-incentives to private motorization complemented the strategy. Transit and active transport covered approximately 68% of the modal share, one of the highest rates among European cities of comparable size.
The Mayor of London’s Transport 2025 plan poses challenging goals to sustainably meet the city’s projected growth, with a forecasted increase in trips demand to 31.2 million journeys per day by 2025 (compared to
4 F. Bruzzone et al. / Transportation Research Procedia 00 (2019) 000–000
approximately 27 million journeys in 2006). The plan envisions a general transit system capacity expansion by 40%, with the provision of new infrastructures and services (Crossrail, Crossrail 2, Thameslink), the upgrade of existing ones (London Underground and DLR: capacity expansion of 40% and reliability increase by 30%), the expansion and greening of buses (40% vehicle km increase), the extension of the tram network. The ultimate goal is to accommodate demographic and economic growth while at the same time diminishing car’s modal shift from 41% to 32% in favor of the transit network (from 37% to 41%) and of walking and cycling (from 22% to 27%).
3.2.2. Priority lanes, stop consolidation, limited-stop service
A few studies discuss about improvements in the urban bus service, such as the provision of priority lanes (permanent or in peak hours only), consolidation of stops, or the promotion of express services. These operational aspects directly affect reliability, regularity and rapidity of PT, which are important indicators, when discussing overall attractiveness of the system. A decrease in travel time is expected to lead to an increase in ridership (Vuchic, 2005). Further, operations indirectly have an impact on users’ satisfaction (e.g. thanks to reduced crowding, reduced real and perceived waiting and travel times, increased regularity). The substitution of traditional buses with low-floor and/or with articulated ones has been assessed by various authors (Dueker et al., 2004; El-Geneidy and Vijayakumar, 2011; Diab and El-Geneidy, 2012, 2013; Diab et al., 2015). Their models show that both low-floor and articulated buses are effective at speeding up dwell times (1%-5% for each stop), but the use of articulated buses increases total trip time since they are slower in acceleration, deceleration and at merging into traffic. Articulated buses are appreciated by the public, which tends to overestimate positive effects from increased capacity and underestimate delays. Some authors stress the importance of drivers experience and training, finding that trip times decrease with the increase of operators’ experience, while regularity rises. El-Geneidy et al. (2011) state that a 1% increase in drivers experience results in a 5% decrease in run time’s coefficient of variation. Reserved bus lanes can shorten trip time, depending on the context (congestion levels, number of signalized intersections, number of stops, and other factors). Priority lanes have demonstrated to be effective at increasing service regularity and attractiveness. Even when time savings are found limited (Suprenant-Legault and El-Geneidy (2011) calculated it at between 1.2% and 2.3% of total trip time), the decrease in the odds of being late is significant, scoring 66%. The authors highlight how the implementation of signaling priority and/or of a parallel limited-stop service, accompanying the introduction of reserved bus lanes, increases their role reducing trip times. Stop consolidation is an effective strategy in a variety of different contexts. Generally speaking, the expected consequences of increasing the distance between bus stops on a hypothetical route are (El-Geneidy et al., 2006): bus running times will decline, reducing operating costs that can, in turn, be translated into additional vehicle miles of service for a given operating budget; the variation in bus running time will decline, saving the transit provider non- revenue service time in the form of excess recovery and layover time as well as saving passengers’ excess waiting time; passengers’ access and egress times required to travel to and from stops increase, while their in-vehicle travel times decrease. The authors report the case of the Massachusetts Bay, where the stop consolidation (which passed from 37 to 19 stops, with the mean distance increased from 200 to 400 meters) led to travel savings equal to 4.3 minutes per trip, with passengers spending an extra 0.6 minutes to reach their closest stop but still saving 1.8 minutes per trip. Overall financial savings for customers and the agency have been estimated in US$132 per hour. They then evaluate a stop consolidation project which has been conducted in Portland, Oregon, and find that travel time savings in segments where consolidation has been put in practice are close to 10%, with neither negative effects on service reliability nor on the number of carried passengers. These positive results could be enhanced by coordinated promotion of priority lanes, accurate stop consolidation and priority signaling at intersections. The introduction of a limited-stop parallel service on busy bus routes can lead to significant time savings for the express route as well as for the slow one (El-Geneidy and Surprenant-Legault, 2010; Diab and El-Geneidy, 2012, 2013) for a corridor in Montreal, Quebec. Their analysis shows that 10% trip time decreases have been achieved by the express service (calling at about 40% of stops) in the initial phase, and a further 3% was gained with the introduction of priority lanes. 1% to approx. 3% savings have been meanwhile achieved by the local service. This despite the introduction of a new smart card-based fare collection system that is responsible for slower operations in crowded situations (Milkovitz, 2008). Overall ridership has risen considerably (+30% compared to before the launch of the express service), while the total number of operating buses has not varied. An interesting outcome of the cited works is that customers have a highly overestimating perception of time savings, declaring they saved between 6.9 and 11.5 minutes per trip even when the average real reduction was of only 1.5 minutes. This leads to the hint that the
The relation between travel time and PT fares is highlighted by other authors. A case study in Montreal (Zahabi et al., 2012) proves that for every 10% increase of the delta between travel time by car and travel time by transit, the probability of PT being selected as transport mode decreases by 3%: transit fares increases, affect transit’s modal share even more drastically, as a 10% decrease in probability of choosing PT was estimated for every 10% fare rise. Another interesting result is that every dollar of increase in parking fees for auto-vehicles implies a 5% higher probability of transit being chosen as transport mode. Such results suggest that increasing parking costs or reducing transit fares would encourage commuting by PT. More competitive travel times of transit services would also reduce car use for commuting purposes. Such findings are consistent with previous work, indicating the sensitivity of commuters to transit fees and parking pricing. The authors synthesize that the combination of incentives and pricing strategies can help increasing the share of PT. Vale (2013), without denying users’ sensitivity to fees and pricing, finds that in case of job relocation further away compared to an initial situation, commuters choose to stick using PT options only if the total travel time stays within a certain acceptable threshold, whereas the opposite is not necessarily true. This supports Wang et al.’s (2018) findings in underlying the role of travel time and highlights the necessity to stimulate commuters’ willingness to select transit as transport mode with appropriate incentives.
Liu et al. (2019) find that in Queensland (Australia) an average fare reduction of 6.7% has generated a 12% increase in the total number of made journeys and a 4.8% revenue increase from the system operations. Such data is higher than other European case studies, where fare integration between different modes and operators has brought benefits in terms of ridership increments between 4% (Manchester) and 33% (Vienna).
3.2. Service and operations improvements
The scope of this section is to estimate the effectiveness of a variety of level of service improvements, including frequency increases and service expansion, introduction of new options (such as bus rapid transit or light rail), and operational improvements. The last ones are often related with technological aspects, such as traffic light priority systems, automated vehicle locators (AVLs), passenger counting systems, and others. For this reason, they will be examined in a separate and dedicated section (section 2.2.3).
3.2.1. Service expansion
The provision of new, innovative transit options, such as light rail, affects a city’s commuting pattern. Long et al. (2018) study a scenario in which a 5-LRT line plus a feeder network are implemented. Their results indicate that PT modal share would increase, rising by over 13% by 2046, cutting CO2 emissions by more than 15%. They also
highlight that these results might not seem shining, but stress how the existing bus system is unsuitable for future mobility and policy needs, since it provides a fragmented, unpunctual, unreliable service. Recently, Europe has seen new openings of light rail lines, which started in France in the early 1990s. According to field studies and to academic literature (Buehler and Pucher, 2011; Regione Toscana, 2012; IRPET, 2016) investments in light rail are desirable from an economic perspective (it fosters development along the route), an environmental perspective (it has proven to be effective in reducing polluting emissions), and an operational perspective (it increases transit modal share thanks to the higher level of service). In Florence, only two years after opening, tram T1 reduced private traffic along the served corridor by over 25% (Regione Toscana, 2012), while increasing the number of carried passengers to approximately 20 million a year, compared to approximately 12.5 million in 2012 (City of Florence Statistics Service, 2018). Although 50% of passengers carried by the trams already used buses beforehand, 25% used to rely on private transport modes and another 25% did not take that journey before the tramway started revenue service. The tram, therefore, was highly successful in promoting transit as a winning modal choice. Between 1983 and 2008, the German city of Freiburg has almost tripled the supply of light rail service (from 1.1 to 3.2 million vehicles km), at the same time improving suburban rail and bus services (from 2.7 to 3.4 billion seats km annually). The city was suffering relevant congestion and pollution issues and had the highest motorization rate in Germany. In 2006, 65% of the city’s residents and 70% of all jobs were located within 300 meters of a light rail stop: one of the highest transit availability rates worldwide (Buehler and Pucher, 2011). A unified integrated ticketing offer and de-incentives to private motorization complemented the strategy. Transit and active transport covered approximately 68% of the modal share, one of the highest rates among European cities of comparable size.
The Mayor of London’s Transport 2025 plan poses challenging goals to sustainably meet the city’s projected growth, with a forecasted increase in trips demand to 31.2 million journeys per day by 2025 (compared to
approximately 27 million journeys in 2006). The plan envisions a general transit system capacity expansion by 40%, with the provision of new infrastructures and services (Crossrail, Crossrail 2, Thameslink), the upgrade of existing ones (London Underground and DLR: capacity expansion of 40% and reliability increase by 30%), the expansion and greening of buses (40% vehicle km increase), the extension of the tram network. The ultimate goal is to accommodate demographic and economic growth while at the same time diminishing car’s modal shift from 41% to 32% in favor of the transit network (from 37% to 41%) and of walking and cycling (from 22% to 27%).
3.2.2. Priority lanes, stop consolidation, limited-stop service
A few studies discuss about improvements in the urban bus service, such as the provision of priority lanes (permanent or in peak hours only), consolidation of stops, or the promotion of express services. These operational aspects directly affect reliability, regularity and rapidity of PT, which are important indicators, when discussing overall attractiveness of the system. A decrease in travel time is expected to lead to an increase in ridership (Vuchic, 2005). Further, operations indirectly have an impact on users’ satisfaction (e.g. thanks to reduced crowding, reduced real and perceived waiting and travel times, increased regularity). The substitution of traditional buses with low-floor and/or with articulated ones has been assessed by various authors (Dueker et al., 2004; El-Geneidy and Vijayakumar, 2011; Diab and El-Geneidy, 2012, 2013; Diab et al., 2015). Their models show that both low-floor and articulated buses are effective at speeding up dwell times (1%-5% for each stop), but the use of articulated buses increases total trip time since they are slower in acceleration, deceleration and at merging into traffic. Articulated buses are appreciated by the public, which tends to overestimate positive effects from increased capacity and underestimate delays. Some authors stress the importance of drivers experience and training, finding that trip times decrease with the increase of operators’ experience, while regularity rises. El-Geneidy et al. (2011) state that a 1% increase in drivers experience results in a 5% decrease in run time’s coefficient of variation. Reserved bus lanes can shorten trip time, depending on the context (congestion levels, number of signalized intersections, number of stops, and other factors). Priority lanes have demonstrated to be effective at increasing service regularity and attractiveness. Even when time savings are found limited (Suprenant-Legault and El-Geneidy (2011) calculated it at between 1.2% and 2.3% of total trip time), the decrease in the odds of being late is significant, scoring 66%. The authors highlight how the implementation of signaling priority and/or of a parallel limited-stop service, accompanying the introduction of reserved bus lanes, increases their role reducing trip times. Stop consolidation is an effective strategy in a variety of different contexts. Generally speaking, the expected consequences of increasing the distance between bus stops on a hypothetical route are (El-Geneidy et al., 2006): bus running times will decline, reducing operating costs that can, in turn, be translated into additional vehicle miles of service for a given operating budget; the variation in bus running time will decline, saving the transit provider non- revenue service time in the form of excess recovery and layover time as well as saving passengers’ excess waiting time; passengers’ access and egress times required to travel to and from stops increase, while their in-vehicle travel times decrease. The authors report the case of the Massachusetts Bay, where the stop consolidation (which passed from 37 to 19 stops, with the mean distance increased from 200 to 400 meters) led to travel savings equal to 4.3 minutes per trip, with passengers spending an extra 0.6 minutes to reach their closest stop but still saving 1.8 minutes per trip. Overall financial savings for customers and the agency have been estimated in US$132 per hour. They then evaluate a stop consolidation project which has been conducted in Portland, Oregon, and find that travel time savings in segments where consolidation has been put in practice are close to 10%, with neither negative effects on service reliability nor on the number of carried passengers. These positive results could be enhanced by coordinated promotion of priority lanes, accurate stop consolidation and priority signaling at intersections. The introduction of a limited-stop parallel service on busy bus routes can lead to significant time savings for the express route as well as for the slow one (El-Geneidy and Surprenant-Legault, 2010; Diab and El-Geneidy, 2012, 2013) for a corridor in Montreal, Quebec. Their analysis shows that 10% trip time decreases have been achieved by the express service (calling at about 40% of stops) in the initial phase, and a further 3% was gained with the introduction of priority lanes. 1% to approx. 3% savings have been meanwhile achieved by the local service. This despite the introduction of a new smart card-based fare collection system that is responsible for slower operations in crowded situations (Milkovitz, 2008). Overall ridership has risen considerably (+30% compared to before the launch of the express service), while the total number of operating buses has not varied. An interesting outcome of the cited works is that customers have a highly overestimating perception of time savings, declaring they saved between 6.9 and 11.5 minutes per trip even when the average real reduction was of only 1.5 minutes. This leads to the hint that the
692 Francesco Bruzzone et al. / Transportation Research Procedia 47 (2020) 688–695F. Bruzzone et al. / Transportation Research Procedia 00 (2019) 000–000 5 promotion of a limited-stop service could be a positive strategy even if it did not actually produce trip time savings, since the perception of users would be enough to increase transit’s attractiveness along the corridor.
3.2.3. ITS-related strategies
ITS-related transit improvement strategies generally rely on AVL systems. Major effects concern information to customers, service planning, safety and security enhancements, operations improvements. Regarding this last point, Hickman (2004) reports evidence from a number of transit agencies, which demonstrate that equipping the fleet with AVLs has improved on-time performance significantly (up to 10%), boosting trip time and improving schedule adherence and thus regularity and reliability. Such gains reflect in increases in ridership on the order of one to five percent and provide agencies with the possibility of saving on budget or increasing the offered service with no additional financial effort. Moreover, AVLs open up the possibility of prioritizing transit vehicles at signalized intersections, a practice which enhances regularity while cutting trip times (Diab and El-Geneidy, 2013; Moghimidarzi et al.; 2016). For a case study in Tempe, Arizona, they found that the Transit Priority Signaling in a corridor with 45 signalized intersection reduced bus delays by 75%, while increasing delays for general traffic by 3% only. The effects of TPS on transit operations and on other traffic depend very much on the context of study, but its potential in terms of regularity, reliability and rapidity increases seems noticeable.
Passenger information systems, such as onboard displays showing trip information and overall at-stop display showing waiting times, are another relevant application. Waiting times displays have a variety of positive effects, among which: reduced waiting times, positive psychological factors, such as reduced uncertainty, increased ease-of-use and a greater feeling of security, increased willingness-to-pay, adjusted travel behavior such as better ease-of-use of wait time or more efficient travelling, mode choice effects, higher customer satisfaction and finally better image (Dziekan and Kottenhoff, 2007). Dziekan and Vermeulen (2006) found that for a tram line in The Hague, displays have reduced perceived waiting times by over 20%. To obtain the same result by improving the offer, a 1.1 million € expense was estimated, compared to only 200,000 € spent to install the displays. The Countdown project, conducted in London and cited by the same authors, measured a perceived wait drop of 26%. The perception of a better service results in higher willingness to pay, more efficient use of time, and ultimately in an increase in revenues and in modal split, which in various contexts has risen between 5% and 10%. Coherently, Hickman (2004) noted a 5.8% ridership increase on transit lines equipped with information displays in Brussels.
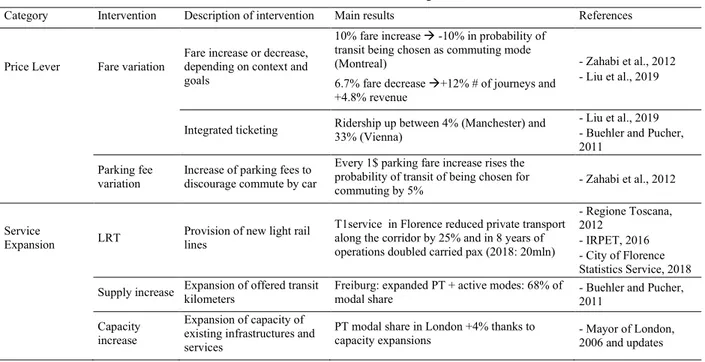
Table 1. Overview of the most relevant results from discussed strategies to increase transit modal share
Category Intervention Description of intervention Main results References
Price Lever Fare variation Fare increase or decrease, depending on context and goals
10% fare increase -10% in probability of transit being chosen as commuting mode (Montreal)
6.7% fare decrease +12% # of journeys and +4.8% revenue
- Zahabi et al., 2012 - Liu et al., 2019
Integrated ticketing Ridership up between 4% (Manchester) and 33% (Vienna) - Liu et al., 2019- Buehler and Pucher, 2011
Parking fee
variation Increase of parking fees to discourage commute by car
Every 1$ parking fare increase rises the probability of transit of being chosen for
commuting by 5% - Zahabi et al., 2012
Service
Expansion LRT Provision of new light rail lines
T1service in Florence reduced private transport along the corridor by 25% and in 8 years of operations doubled carried pax (2018: 20mln)
- Regione Toscana, 2012
- IRPET, 2016 - City of Florence Statistics Service, 2018 Supply increase Expansion of offered transitkilometers Freiburg: expanded PT + active modes: 68% of modal share - Buehler and Pucher,
2011 Capacity
increase
Expansion of capacity of existing infrastructures and services
PT modal share in London +4% thanks to
capacity expansions - Mayor of London, 2006 and updates
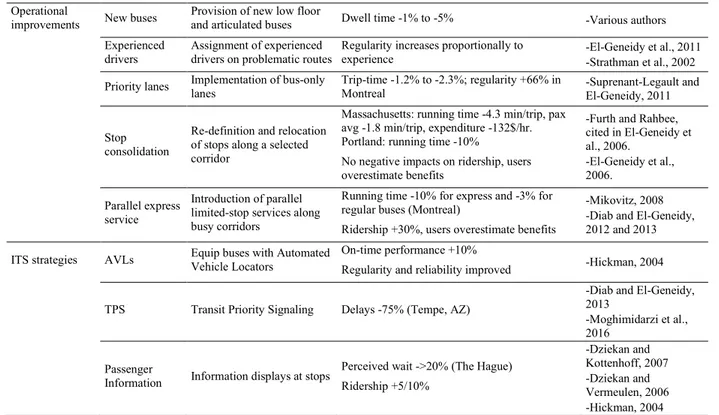
6 F. Bruzzone et al. / Transportation Research Procedia 00 (2019) 000–000 Operational
improvements New buses Provision of new low floor and articulated buses Dwell time -1% to -5% -Various authors Experienced
drivers Assignment of experienced drivers on problematic routes Regularity increases proportionally to experience -El-Geneidy et al., 2011-Strathman et al., 2002 Priority lanes Implementation of bus-onlylanes Trip-time -1.2% to -2.3%; regularity +66% in Montreal -Suprenant-Legault and
El-Geneidy, 2011 Stop
consolidation
Re-definition and relocation of stops along a selected corridor
Massachusetts: running time -4.3 min/trip, pax avg -1.8 min/trip, expenditure -132$/hr. Portland: running time -10%
No negative impacts on ridership, users overestimate benefits
-Furth and Rahbee, cited in El-Geneidy et al., 2006. -El-Geneidy et al., 2006. Parallel express service Introduction of parallel limited-stop services along busy corridors
Running time -10% for express and -3% for regular buses (Montreal)
Ridership +30%, users overestimate benefits
-Mikovitz, 2008 -Diab and El-Geneidy, 2012 and 2013 ITS strategies AVLs Equip buses with Automated Vehicle Locators On-time performance +10%
Regularity and reliability improved -Hickman, 2004 TPS Transit Priority Signaling Delays -75% (Tempe, AZ)
-Diab and El-Geneidy, 2013
-Moghimidarzi et al., 2016
Passenger
Information Information displays at stops
Perceived wait ->20% (The Hague) Ridership +5/10% -Dziekan and Kottenhoff, 2007 -Dziekan and Vermeulen, 2006 -Hickman, 2004
3.3. Transit accessibility improvements and stakeholders’ involvement
This section is dedicated to improvements not directly connected to the transit system. The renewal of the transit-related built environment (including stops, sidewalks, road sections), significantly impacts transit performances and users’ perceptions. The potential of such strategies on transit operations is hardly quantifiable, but the importance of a comfortable, easy to use and easily recognizable transit service and environment is discussed by various sources, including SMART-COMMUTING Project’s documents on the proposed transnational strategy. Future work should integrate these elements as complement to above described practices as to fully identify their potential, especially in the context of SMART-COMMUTING Project’s partner cities. A few words must be dedicated to stress the importance of stakeholders’ engagement to ensure success and uptake of transit and mobility projects and plans (Lemmerer et al., 2018, Esztergar-Kiss and Tettamanti, 2019). Stakeholders involvement should include all phases of project/strategy planning, implementation and evaluation in an effort to identify, include and improve critical issues and aspects of the mobility system. Stakeholders and public involvement, moreover, is fundamental in TDM strategies, as the involvement process, accompanied by measures addressing subsidization and pricing of PT and discouraging car travel while easing off the use of soft modes, can be a strong factor of success of such strategies (Sprumont et al., 2014).
4. Conclusions
Transit has been identified as a fundamental tile of integrated strategies aiming at making transport systems sustainable, desirable and fit for future priorities and environmental and socioeconomic challenges. This paper has highlighted how PT may effectively play a relevant role in commuters’ modal choice, both from a user perspective and from a policy perspective. Some of the most relevant decision-making tools and a number of possible strategies have been discussed (as summarized in Table 1; for results in terms of commuting refer to section 3) that can be implemented by planners, governments and agencies to increase transit’s attractiveness and thus its modal split, providing an efficient and qualitative commute. Previous experiences call for effective ridership increases, which may be obtained by offering additional reliable high-quality services, by improving regularity and performances of existing services, or by using technology to provide better information and management. This study hints that combining such strategies and including changes to the built environment in which transit operates could increase attractiveness - and
promotion of a limited-stop service could be a positive strategy even if it did not actually produce trip time savings, since the perception of users would be enough to increase transit’s attractiveness along the corridor.
3.2.3. ITS-related strategies
ITS-related transit improvement strategies generally rely on AVL systems. Major effects concern information to customers, service planning, safety and security enhancements, operations improvements. Regarding this last point, Hickman (2004) reports evidence from a number of transit agencies, which demonstrate that equipping the fleet with AVLs has improved on-time performance significantly (up to 10%), boosting trip time and improving schedule adherence and thus regularity and reliability. Such gains reflect in increases in ridership on the order of one to five percent and provide agencies with the possibility of saving on budget or increasing the offered service with no additional financial effort. Moreover, AVLs open up the possibility of prioritizing transit vehicles at signalized intersections, a practice which enhances regularity while cutting trip times (Diab and El-Geneidy, 2013; Moghimidarzi et al.; 2016). For a case study in Tempe, Arizona, they found that the Transit Priority Signaling in a corridor with 45 signalized intersection reduced bus delays by 75%, while increasing delays for general traffic by 3% only. The effects of TPS on transit operations and on other traffic depend very much on the context of study, but its potential in terms of regularity, reliability and rapidity increases seems noticeable.
Passenger information systems, such as onboard displays showing trip information and overall at-stop display showing waiting times, are another relevant application. Waiting times displays have a variety of positive effects, among which: reduced waiting times, positive psychological factors, such as reduced uncertainty, increased ease-of-use and a greater feeling of security, increased willingness-to-pay, adjusted travel behavior such as better ease-of-use of wait time or more efficient travelling, mode choice effects, higher customer satisfaction and finally better image (Dziekan and Kottenhoff, 2007). Dziekan and Vermeulen (2006) found that for a tram line in The Hague, displays have reduced perceived waiting times by over 20%. To obtain the same result by improving the offer, a 1.1 million € expense was estimated, compared to only 200,000 € spent to install the displays. The Countdown project, conducted in London and cited by the same authors, measured a perceived wait drop of 26%. The perception of a better service results in higher willingness to pay, more efficient use of time, and ultimately in an increase in revenues and in modal split, which in various contexts has risen between 5% and 10%. Coherently, Hickman (2004) noted a 5.8% ridership increase on transit lines equipped with information displays in Brussels.
Table 1. Overview of the most relevant results from discussed strategies to increase transit modal share
Category Intervention Description of intervention Main results References
Price Lever Fare variation Fare increase or decrease, depending on context and goals
10% fare increase -10% in probability of transit being chosen as commuting mode (Montreal)
6.7% fare decrease +12% # of journeys and +4.8% revenue
- Zahabi et al., 2012 - Liu et al., 2019
Integrated ticketing Ridership up between 4% (Manchester) and 33% (Vienna) - Liu et al., 2019- Buehler and Pucher, 2011
Parking fee
variation Increase of parking fees to discourage commute by car
Every 1$ parking fare increase rises the probability of transit of being chosen for
commuting by 5% - Zahabi et al., 2012
Service
Expansion LRT Provision of new light rail lines
T1service in Florence reduced private transport along the corridor by 25% and in 8 years of operations doubled carried pax (2018: 20mln)
- Regione Toscana, 2012
- IRPET, 2016 - City of Florence Statistics Service, 2018 Supply increase Expansion of offered transitkilometers Freiburg: expanded PT + active modes: 68% of modal share - Buehler and Pucher,
2011 Capacity
increase
Expansion of capacity of existing infrastructures and services
PT modal share in London +4% thanks to
capacity expansions - Mayor of London, 2006 and updates
Operational
improvements New buses Provision of new low floor and articulated buses Dwell time -1% to -5% -Various authors Experienced
drivers Assignment of experienced drivers on problematic routes Regularity increases proportionally to experience -El-Geneidy et al., 2011-Strathman et al., 2002 Priority lanes Implementation of bus-onlylanes Trip-time -1.2% to -2.3%; regularity +66% in Montreal -Suprenant-Legault and
El-Geneidy, 2011 Stop
consolidation
Re-definition and relocation of stops along a selected corridor
Massachusetts: running time -4.3 min/trip, pax avg -1.8 min/trip, expenditure -132$/hr. Portland: running time -10%
No negative impacts on ridership, users overestimate benefits
-Furth and Rahbee, cited in El-Geneidy et al., 2006. -El-Geneidy et al., 2006. Parallel express service Introduction of parallel limited-stop services along busy corridors
Running time -10% for express and -3% for regular buses (Montreal)
Ridership +30%, users overestimate benefits
-Mikovitz, 2008 -Diab and El-Geneidy, 2012 and 2013 ITS strategies AVLs Equip buses with Automated Vehicle Locators On-time performance +10%
Regularity and reliability improved -Hickman, 2004 TPS Transit Priority Signaling Delays -75% (Tempe, AZ)
-Diab and El-Geneidy, 2013
-Moghimidarzi et al., 2016
Passenger
Information Information displays at stops
Perceived wait ->20% (The Hague) Ridership +5/10% -Dziekan and Kottenhoff, 2007 -Dziekan and Vermeulen, 2006 -Hickman, 2004
3.3. Transit accessibility improvements and stakeholders’ involvement
This section is dedicated to improvements not directly connected to the transit system. The renewal of the transit-related built environment (including stops, sidewalks, road sections), significantly impacts transit performances and users’ perceptions. The potential of such strategies on transit operations is hardly quantifiable, but the importance of a comfortable, easy to use and easily recognizable transit service and environment is discussed by various sources, including SMART-COMMUTING Project’s documents on the proposed transnational strategy. Future work should integrate these elements as complement to above described practices as to fully identify their potential, especially in the context of SMART-COMMUTING Project’s partner cities. A few words must be dedicated to stress the importance of stakeholders’ engagement to ensure success and uptake of transit and mobility projects and plans (Lemmerer et al., 2018, Esztergar-Kiss and Tettamanti, 2019). Stakeholders involvement should include all phases of project/strategy planning, implementation and evaluation in an effort to identify, include and improve critical issues and aspects of the mobility system. Stakeholders and public involvement, moreover, is fundamental in TDM strategies, as the involvement process, accompanied by measures addressing subsidization and pricing of PT and discouraging car travel while easing off the use of soft modes, can be a strong factor of success of such strategies (Sprumont et al., 2014).
4. Conclusions
Transit has been identified as a fundamental tile of integrated strategies aiming at making transport systems sustainable, desirable and fit for future priorities and environmental and socioeconomic challenges. This paper has highlighted how PT may effectively play a relevant role in commuters’ modal choice, both from a user perspective and from a policy perspective. Some of the most relevant decision-making tools and a number of possible strategies have been discussed (as summarized in Table 1; for results in terms of commuting refer to section 3) that can be implemented by planners, governments and agencies to increase transit’s attractiveness and thus its modal split, providing an efficient and qualitative commute. Previous experiences call for effective ridership increases, which may be obtained by offering additional reliable high-quality services, by improving regularity and performances of existing services, or by using technology to provide better information and management. This study hints that combining such strategies and including changes to the built environment in which transit operates could increase attractiveness - and
694 Francesco Bruzzone et al. / Transportation Research Procedia 47 (2020) 688–695F. Bruzzone et al. / Transportation Research Procedia 00 (2019) 000–000 7 thus ridership - even more significantly. Indeed, relevant gains in transit’s modal share are more easily achievable when considering the integration between various measures and strategies. This implies the adaptation of the planning process to the specific context, so to implement effective strategies related to the environment under evaluation and to obtain valuable results. With this article, a prospect of different available strategies has been provided, able to increase the possibilities of transit being chosen as commuting mode. This is only a preliminary effort, which can be useful in order to apply those strategies that fit best to the cities involved in the SMART-COMMUTING project. Indeed, its ultimate aim is to help such cities in developing their transport system, linking project’s objectives related to commuting with global, national and local development and sustainability goals. The knowledge of the results achieved in other contexts is the first, unavoidable step towards this aim, and this paper may constitute a reference in this sense.
Acknowledgment
This research has been funded through the Interreg Central Europe Programme (2014-2020) under Project SMART-COMMUTING.
References
Al-Rijleh M.K., Alam A., Foti R., Gurian P.L., Spatari S., Hatzopoulou M., 2018. Strategies to achieve deep reductions in metropolitan transportation GHG emissions: the case of Philadelphia. Transportation Planning and Technology.
Bartolozzi M., 2012. I fiorentini e la tranvia: indagine conoscitiva sull’utilizzo della linea 1 della tranvia. Regione Toscana, Settore Pianificazione del sistema integrato della mobilità e della logistica.
Buehler R. and Pucher J., 2011. Sustainable Transport in Freiburg: Lessons from Germany's Environmental Capital, International Journal of Sustainable Transportation, 5:1, 43-70.
Cavallaro F., Irranca Galati O., Nocera S., 2019. A tool to support transport decision making in tourist coastal areas. Case Studies on Transport Policy, forthcoming
Chilà G. et al. 2016. Transport models and intelligent transportation system to support urban evacuation planning process. IET Intelligent Transport Systems, Vol. 10, pp. 279-286.
City of Florence, Statistics service, 2018. Online at: http://mobilita.comune.fi.it/tramvia/informazioni_generali/statistiche.html, data downloaded April 5, 2019.
Crane, R., Crepeau, R., 1998. Does neighborhood design influence travel?: a behavioral analysis of travel diary and GIS data. Transp. Res. Part D: Transp. Environ. 3, 225–238.
Dargay J. and Hanly M., 2007. Volatility of car ownership, commuting mode and time in the UK. Transportation Research part A: Policy and Practice. Vol. 41, 10:934-948.
De Stasio C., Fiorello D., Fermi F., Martino A., Hitchcock G., Kollamthodi S. (2016). On-line Tool for the Assessment of Sustainable Urban Transport Policies. Transportation Research Procedia, 14,3189-3198.
Diab E.I. and El-Geneidy A.M., 2012. Understanding the impacts of a combination of service improvement strategies on bus running time and passenger’s perception. Transportation Research Part A 46:614–625.
Diab E.I. and El-Geneidy A.M., 2013. Variation in bus transit service: understanding the impacts of various improvement strategies on transit service reliability. Public Transportation 4:209-231.
Diab E.I., Badami M.G., El-Geneidy A.M., 2015. Bus Transit Service Reliability and Improvement Strategies: Integrating the Perspectives of Passengers and Transit Agencies in North America. Transport Reviews 35:3, 292-328.
Dueker K.J., Kimpel T.J., Strathman J.G., 2004. Determinants of Bus Dwell Time. Journal of Public Transportation, Vol. 7, No. 1.
Dziekan K. and Kottenhoff K., 2007. Dynamic at-stop real-time information displays for public transport: effects on customers. Transportation Research Part A 41:489-501.
Dziekan K. and Vermeulen A., 2006. Psychological Effects and Design Preferences for Real-Time Information Displays. Journal of Public Transportation, Vol. 9, No. 1.
El-Geneidy A.M. and Surprenant-Legault J., 2010. Limited-stop bus service: an evaluation of an implementation strategy. Public Transport 2:291-306.
El-Geneidy A.M. and Vijayakumar N., 2011. The Effects of Articulated Buses on Dwell and Running Times. Journal of Public Transportation, Vol. 14, No. 3.
El-Geneidy A.M., Horning J. and Krizek K.J., 2011. Analyzing transit service reliability using data from automated vehicular locator systems. Journal of Advanced Transportation 45:66-79.
El-Geneidy A.M., Strathman J.G., Kimpel T.J., Crout D.T., 2006. Effects of Bus Stop Consolidation on Passenger Activity and Transit Operations. Transportation Research Record: Journal of the Transportation Research Board,No. 1971, pp. 32-41.
Esztergar-Kiss D. and Tettamanti T., 2019. Stakeholder Engagement In Mobility Planning, In: Autonomous Vehicles and Future Mobility, Elsevier. Gimenez-Nadal J.-I., Molina J.A., 2019. Daily feelings of US workers and commuting time. Journal of Transport & Health 12, 21-33.
Hickman M., 2004. Bus Automatic Vehicle Location (AVL) Systems. In: Gillen D., Levinson D. (eds) Assessing the Benefits and Costs of ITS. Transportation Research, Economics and Policy, vol 10, pp.59-88.
Hickman R., Ashiru O., Banister D., 2010. Transport and climate change: Simulating the option for carbon reducing in London. Transport Policy Paper.
Hickman R., Ashiru O., Banister D., 2011. Transitions to low carbon transport futures: strategic conversations from London and Delhi. Journal of Transport Geography 19, 1553-1562.
8 F. Bruzzone et al. / Transportation Research Procedia 00 (2019) 000–000
Isherwood N., Pinzon L., Colburn J., 2008. Strasbourg: regaining public real. The Prince’s Foundation for the Built Environment.
KonSULT (2019a). Knowledgebase on Sustainable Urban Land use and Transport. Web page. Online at: http://www.konsult.leeds.ac.uk/ [Accessed 22 03 2019].
KonSULT (2019b). Knowledgebase on Sustainable Urban Land use and Transport. Web page. Policy Guidebook Online at: http://www.konsult.leeds.ac.uk/pg [Accessed 22 05 2019].
Lemmerer H. et al., 2018. Transnational strategy to change commuting models in the FUAs, Deliverable D.T1.2.1 of SMART-COMMUTING. Libardo A. and Nocera S. (2008): Transportation Elasticity for the Analysis of Italian Transportation Demand on a Regional Scale. Traffic
Engineering and Control 49-5: 187-192
Liu X., Ma S., Tian J., Jia N., Li G., 2015. A system dynamics approach to scenario analysis for urban passenger transport energy consumption and CO2 emissions: A case study of Beijing. Energy Policy 85, 253-270.
Liu, Y., Wang, S., Xie, B., 2019. Evaluating the effects of public transport fare policy change and built and non-built environment features on ridership: The case in South East Queensland, Australia, Transport Policy.
Long S., Klungboonkrong P., Chindaprasirt P., 2018. Impacts of urban transit system development on modal shift and greenhouse gas emission reduction: A KhonKaen, Thailand case study. Engineering and Applied Science Research 45(1):8-16.
Lorenz O., 2018. Does commuting matter to subjective well-being? Journal of Transport Geography 66, 180- 199.
Mandic, S., de la Barra, S.L., Bengoechea, E.G., Stevens, E., Flaherty, C., Moore, A., Middlemiss, M., Williams, J., Skidmore, P., 2015. Personal, social and environmental correlates of active transport to school among adolescents in Otago, New Zealand. J. Sci. Med. Sport 18, 432–437. Milkovitz M.N., 2008. Modeling the Factors Affecting Bus Stop Dwell Time: Use of Automatic Passenger Counting, Automatic Fare Counting,
and Automatic Vehicle Location Data. Transportation Research Record: Journal of the Transportation Research Board, No. 2072, pp. 125-130. Moghimidarzi S., Furth P.G. and Cesme B., 2016. Predictive-Tentative Transit Signal Priority with Self-Organizing Traffic Signal Control.
Transportation Research Record: Journal of the Transportation Research Board, No. 2557, pp. 77-85.
Nocera S., Cavallaro F., 2012. Economic Evaluation of Future Carbon Impacts on the Italian Highways. Procedia - Social and Behavioral Science 54: 1360 – 1369
Nocera S., Ruiz-Alarcón Quintero C., and Cavallaro F. (2018): Assessing carbon emissions from road transport through traffic flow estimators. Transportation Research Part C: Emerging Technologies 95: 125-148
Nocera S., Tonin S., 2014. A Joint Probability Density Function for reducing the Uncertainty of Marginal Social Cost of Carbon Evaluation in Transport Planning. Advances in Intelligent Systems and Computing 262, pp. 113-126, DOI: 10.1007/978-3-319-04630-3_9
Piccini L., Agnoletti C., Burgalassi D., Lattaruolo P., 2016. L’impatto economico della prima linea tramviaria. Istituto Regionale per la Programmazione Economica della Toscana.
Rodríguez-López, C., Salas-Fariña, Z.M., Villa-González, E., Borges-Cosic, M., Herrador-Colmenero, M., Medina-Casaubón, J., Ortega, F.B., Chillón, P., 2017. The threshold distance associated with walking from home to school. Health Educ. Behav. 44 (6), 857–866.
Sprumont F. et al., 2014. Workplace relocation and mobility changes in a transnational metropolitan area: The case study of University of Luxembourg.Transportation Research Procedia, Vol. 4, pp. 286-299.
Strathman, J., Kimpel, T., Dueker, K., Gerhart, R., & Callas, S., 2002. Evaluation of transit operations: Data applications of Tri-Met’s automated bus dispatching system. Transportation, 29(3), 321–345.
Strompen F., Litman T., Bongardt D., 2012. Reducing Carbon Emissions through Transport Demand Management Strategies. A review of international examples. Deutsche Gesellschaft für Internationale Zusammenarbeit (GIZ) GmbH.
Surprenant-Legault J. and El-Geneidy A.M., 2011. Introduction of Reserved Bus Lane: Impact on Bus Running Time and On-Time Performance. Transportation Research Record: Journal of the Transportation Research Board, No. 2218, pp. 10-18.
Transport For London, 2006 and following updates. Transport2025: Transport vision for a growing world city. Mayor of London.
Vale D.S., 2013. Does commuting time tolerance impede sustainable urban mobility? Analysing the impacts on commuting behaviour as a result of workplace relocation to a mixed-use centre in Lisbon. Journal of Transport Geography 32, 38–48.
Wang Z., Chen F., Wang B., Huang J., 2018. Passengers’ response to transit fare change: an ex post appraisal using smart card data. Transportation vol. 45(5), pages 1559-1578.
Wefering F., Rupprecht S., Buhrmann S. and Bohler-Baedeker S. (2013). Guidelines. Developing and Implementing a Sustainable Urban Mobility Plan. Rupprecht Consult.
Zahabi S.A.H., Miranda-Moreno L., Patterson Z., Barla P., Harding C., 2012. Transport Greenhouse Gas Emissions and its Relationship with Urban Form, Transit Accessibility and Emerging Green Technologies: a Montreal case study. Social and Behavioral Sciences 54, 966-978.