LYMPHOID NEOPLASIA
Dendritic cells accumulate in the bone marrow of myeloma patients
where they protect tumor plasma cells from CD8
1
T-cell killing
Patrizia Leone,1Simona Berardi,1Maria Antonia Frassanito,1Roberto Ria,1Valli De Re,2Sebastiano Cicco,1 Stefano Battaglia,1Paolo Ditonno,3Franco Dammacco,1Angelo Vacca,1and Vito Racanelli1
1Department of Internal Medicine and Clinical Oncology, University of Bari Medical School, Bari, Italy;2Bio-Proteomics Facility, Department of Translational Research, Centro di Riferimento Oncologico, National Cancer Institute, Aviano, Italy; and3Hematology Unit, Di Venere Hospital, Bari, Italy
Key Points
• Dendritic cells accumulate in the bone marrow of multiple myeloma patients.
• Bone marrow dendritic cells play a dual, but opposing, role in multiple myeloma.
Many researchers have speculated that the clinical progression from monoclonal gammop-athy of undetermined significance (MGUS) to multiple myeloma (MM) is driven by defects in dendritic cell (DC) function. However, evidence supporting this assumption is controversial, and no mechanism for the putative DC dysfunction has been demonstrated thus far. We studied DC subsets from the bone marrow of MM patients compared with those of MGUS patients and control subjects. We found that myeloid DCs (mDCs) and plasmacytoid DCs (pDCs) accumulate in the bone marrow during the MGUS-to-MM progression. After engulfment of apoptotic tumor plasma cells via CD91, bone marrow mDCs and pDCs mature and are able to activate tumor-specific CD81T cells. However, by interacting directly with CD28 on live (nonapoptotic) tumor plasma cells, bone marrow mDCs downregulate the expression of proteasome subunits in these cells, thus enabling their evasion from human leukocyte antigen (HLA) class I–restricted CD81T-cell killing. These results suggest that DCs play a dual, but opposing, role in MM: for one, DCs activate CD81T cells against tumor plasma cells and, for the other, DCs protect tumor plasma cells from CD81T-cell killing. This information should be taken into account in designing immunotherapy approaches to enhance immune surveillance in MGUS and to break down immune tolerance in MM. (Blood. 2015;126(12):1443-1451)
Introduction
Multiple myeloma (MM) is a lethal plasma cell malignancy that is often anticipated by a preneoplastic phase termed monoclonal gammopathy of undetermined significance (MGUS).1How MGUS progresses to MM is not exactly known, but it is thought to involve the generation of effective cytotoxic CD81T-cell responses against tumor plasma cells. This generation relies on dendritic cells (DCs), highly differentiated antigen-presenting cells with the unique capacity to internalize tumor antigens from the environment and present them as human leukocyte antigen (HLA) class I–bound peptides (a process known as cross-presentation).2-4
In humans, DCs circulating in the blood characteristically express high levels of HLA class II molecules and are proficientinantigenuptake and processing. However, they express low levels of HLA class I and costimulatory molecules (eg, CD80, CD86) and lack common lineage markers such as CD3, CD14, CD16, CD19, CD20, and CD56. These lineage-negative (Lin–) cells are subdivided into CD11c1myeloid DCs (mDCs) and CD11c–CD1231plasmacytoid DCs (pDCs). Alternatively, BDCA-1, BDCA-2, and BDCA-3 may be used to distinguish between mDC (BDCA-11and BDCA-31) and pDC (BDCA-21).5
DCs detect and take up dead or dying tumor cells through the recognition of a variety of proteins, categorized as damage-associated molecular pattern molecules (DAMPs), expressed on the surface of such cells.6One of these molecules is the endoplasmic reticulum protein calreticulin, which has been shown to be translocated to the plasma membrane of apoptotic cells, where it acts as an“eat-me
signal” for DCs by binding with CD91.7-9
Once DCs engulf dead or dying tumor cells, they undergo a series of maturation events that reduce the antigen-capturing capacity, increase the expression of HLA class I and II and co-stimulatory molecules, develop an excep-tional efficiency in processing tumor proteins and presenting tumor peptides to T cells, and augment the secretion of cytokines modu-lating T-cell activation. In particular, mDCs are major producers of interleukin (IL)-12, whereas pDCs are specialized in producing type I interferon (IFN).10
The process of degrading tumor proteins into peptides that will be presented by HLA class I molecules to CD81T cells occurs in the proteasome.11In this cylindrical 26S proteolytic complex, some of the catalytic subunits can be exchanged in response to changing cel-lular environments. In particular, the b subunits D, z, and MB1 can be replaced by the bi subunits LMP2, LMP7, and LMP10, respec-tively. In DCs, a mixed population of proteasomes, some incorpo-rating b subunits and others bi subunits, can be found.
There is no agreement in the literature about the role of DCs in MM pathogenesis. Different studies have shown that DCs may promote myeloma-specific T-cell responses,12,13
although they may also support plasma cell proliferation and survival via engagement of their CD80/86 receptors by the ligand CD28 on plasma cells.14-17Moreover, little in-formation is available on DCs in the bone marrow (BM), which is the privileged site of clonal plasma cell proliferation, and therefore the main site of tumor-antigen expression.
Submitted January 26, 2015; accepted July 8, 2015. Prepublished online as Blood First Edition paper, July 16, 2015; DOI 10.1182/blood-2015-01-623975.
There is an Inside Blood Commentary on this article in this issue.
The publication costs of this article were defrayed in part by page charge payment. Therefore, and solely to indicate this fact, this article is hereby marked “advertisement” in accordance with 18 USC section 1734. © 2015 by The American Society of Hematology
In this study, we analyzed the ex vivo distribution as well as the phenotypic and functional features of the mDCs and pDCs of MM patients compared with those of MGUS patients and control subjects, and explored the immunologic effects of interactions among DCs, T cells, and plasma cells within the BM milieu.
Materials and methods
Study subjects and biological samples
Paired peripheral blood (PB) and BM samples were obtained from 40 patients with newly diagnosed monoclonal gammopathies. Patients were classified as having MGUS (n5 20) or symptomatic MM (n 5 20) according to the International Myeloma Working Group criteria.18PB and BM samples were
also obtained from 10 healthy controls who were BM donors for patients un-dergoing allogeneic transplantation. The study protocol was approved by the University of Bari Medical School Ethics Committee and conformed to the good clinical practice guidelines of the Italian Ministry of Health. Written informed consent was obtained from each subject in accordance with the Declaration of Helsinki.
Cell preparations
PB and BM samples from patients and controls were used to isolate peripheral and bone marrow mononuclear cells (PBMCs and BMMCs, respectively) by Ficoll-Paque Plus (GE Healthcare Life Sciences) density gradient centrifu-gation. From the PBMC and BMMC preparations, CD81T cells, mDCs, and pDCs were purified by automated magnetic sorting using, respectively, anti-CD8 microbeads and BDCA-1 and BDCA-4 Isolation Kits (Miltenyi Biotec). For certain experiments, mDCs were alternatively purified by negative se-lection using the Myeloid Dendritic Cell Isolation Kit (Miltenyi Biotec). BM from patients was also used to directly isolate tumor plasma cells by auto-mated magnetic cell sorting with anti-CD138 microbeads (Miltenyi Biotec). All sorted cell populations exhibited.95% purity, as revealed by flow cytometry on immunostained cells.
Tumor plasma cells were made apoptotic by g-irradiation (50 Gy) and then used immediately in phagocytosis assays. Tumor plasma cell lysates were prepared as described previously.13K562 cells were purchased from ATCC.
Immunofluorescence staining and fluorescent labeling of cells A set of commercial and in-house monoclonal antibodies (mAb) was used. Fluorescein isothiocyanate (FITC)-conjugated Lineage mAb mix, phycoerythrin (PE)-cyanine 5 (Cy5)-conjugated anti-CD123 mAb, and PE-Cy5-conjugated anti-CD11c mAb were purchased from BD Biosciences; PE-Texas red (ECD)-conjugated anti-HLA-DR mAb, PE-(ECD)-conjugated anti-CD80 mAb, PE-(ECD)-conjugated anti-CD86 mAb, PE-conjugated anti-CD138 mAb, allophycocyanin (APC)-conjugated anti-CD28, and FITC-(APC)-conjugated anti-CD8 mAb were purchased from Beckman Coulter; APC-conjugated anti-BDCA-1 (CD1c), APC-conjugated anti-BDCA-3 (CD141) and APC-conjugated anti-BDCA-2 (CD303), PE-conjugated anti-IL-12 mAb, and PE-PE-conjugated anti-IFN-a mAb were purchased from Miltenyi Biotec. The d mAb SY-5, MB1 mAb SJJ-3, z mAb NB1, LMP2 mAb SY-1, LMP7 mAb HB2, and LMP10 mAb TO-7, calreticulin mAb TO-11 were produced and characterized as described previously13and labeled with
FITC by the use of the Lightning-Link FITC Conjugation Kit (Innova Bio-sciences). The PE-conjugated NY-ESO-1157-165–specificHLA-A*0201pentamer
was purchased from Proimmune.
Cells were incubated with mAb to surface antigens for 30 minutes at 4°C and then washed twice in cold phosphate-buffered saline containing 0.1% bovine serum antigen beforeflow cytometry. In some cases, surface-stained cells were fixed and permeabilized with BD Cytofix/Cytoperm solution (BD Biosciences), washed in Perm/Wash solution (BD Biosciences), and stained with mAb to intracellular proteins at 4°C for 30 minutes. For mDC and pDC enumeration, whole PB and BM samples were incubated with the appropriate mAb, treated with FACS Lysing solution (BD Biosciences), washed in phosphate-buffered saline, and mixed with Flow-Countfluorospheres (Beckman Coulter) at known
concentrations. Staining with pentamers was performed according to the man-ufacturer’s instructions. For phagocytosis assays, DC and tumor plasma cells were labeled with PKH67 (green) and PKH26 (red) lipophilic dyes (Sigma-Aldrich), respectively, according to the manufacturer’s instructions. For prepa-ration of targets for cytotoxicity assays, tumor plasma cells were labeled with 0.5 mM 5(6)-carboxyfluorescein diacetate succinimidyl ester (CFSE; Life Technologies), as previously described,19and K562 cells were labeled with 5 mM Far-Red dimethyldodecylamine oxide-succinimidyl ester (Life Tech-nologies), according to the manufacturer’s instructions. For fluorescence micros-copy, cells were incubated with 0.1 mg/mL 4,6 diamidino-2-phenylindole (Sigma-Aldrich).
Dendritic cell culture, loading, and stimulation
BMMCs (63 105/well), mDCs (163 104/well), and pDCs (63 104/well) were cultured in 96-well round-bottom plates (BD Biosciences) in 200 mL of RPMI 1640 supplemented with 5% heat-inactivated human AB serum, 2 mM
L-glutamine, 100 U/mL penicillin, and 100 mg/mL streptomycin (all from
Sigma-Aldrich; culture medium). Cells were cultured alone or, when antigen loading was required, in the presence of apoptotic tumor plasma cells (from 0.603 104to 63 104/well). Cells were incubated at 37°C in a humidified
atmosphere containing 5% CO2for different times after their isolation,
de-pending on the assay. Before immunostaining of surface proteins, BMMCs were cultured for 20 hours. Before intracellular cytokine staining, BMMCs were incubated for a total of 6 hours, including 1 hour without followed by 5 hours with the secretion inhibitor Golgi Plug (1 mL/mL; BD Biosciences). For enzyme-linked immunosorbent assay (ELISA), mDCs and pDCs were cultured for 20 hours, after which aliquots of supernatant were removed and frozen at280°C until batch analysis. Before antigen presentation assays, DCs were incubated for 20 hours. To assess phagocytic activity, PKH67-labeled mDCs and pDCs from the same patient were pooled (to reach a suitable number of cells required for the experiments) and incubated for 20 hours with apoptotic PKH26-labeled plasma cells in the absence or presence of 10 mg/mL of a mouse IgG1 anti-human CD91 blocking mAb (GTX79843; Genetex) or the isotype control antibody (BD Biosciences).
Generation of epitope-specific and plasma cell–specific CD81 T-cell lines
PBMCs (43 105/well) were stimulated with 10 mg/mL NY-ESO-1157-165
peptide (Proimmune), 10 mg/mL influenza matrix58-66peptide (Proimmune), or
100 mg/mL autologous plasma cell lysates in 200 mL culture medium in 96-well round-bottom plates. Cells were incubated at 37°C in a humidified atmosphere containing 5% CO2. The medium was replaced with fresh culture medium
containing 10 U/mL rIL-2 (PeproTech) on days 4, 7, 11, 14, and 18; on day 7, the fresh culture medium also contained 10 ng/mL rIL-7 (PeproTech). Cultures were restimulated with 43 105irradiated autologous PBMCs plus peptide or cell lysate on days 7 and 14. On day 21, cells from several wells were harvested, pooled, and subjected to automated magnetic CD81T-cell sorting.
CD81T-cell epitope presentation assay
NY-ESO-1157-165or influenza matrix58-66epitope-specific CD81T cells were
cultured with autologous, pooled mDCs and pDCs, either unloaded or antigen-loaded, in 96-well round-bottom plates. Each well contained 23 105T cells and
23 104DCs (T cell:DC ratio of 10:1). Cells were grown in 200 mL culture
medium at 37°C in a humidified atmosphere containing 5% CO2. Cells were
harvested after 7 days and stained with epitope-specific pentamers. Proteasome subunit expression analysis
Tumor plasma cells were incubated with or without autologous BM mDCs (plasma cell:DC ratio of 2:1) in 96-well plates containing culture medium; some wells contained 50 mg/mL of a mouse anti-human CD28-blocking mAb (clone CD28.6, eBioscience). In other wells, tumor plasma cells were separated from mDCs by a 1-mm-pore size membrane (HTS Transwell-96 system; Corning). After 20 hours, cells were harvested, stained for CD138 and proteasome subunits, and analyzed byflow cytometry.
Cytotoxicity assay
To prepare target cells for cytotoxicity assays, CFSE-labeled tumor plasma cells were incubated alone or with BM mDCs, as described previously, and then either repurified by immunomagnetic selection or recovered from the Transwell insert. A second target cell population consisted of Far Red-labeled K562 cells (HLA-negative control) pulsed overnight with 10 mg/mL lysate from tumor plasma cells. Effector cells were tumor plasma cell–specific CD81T cells purified by magnetic cell sorting as described earlier.
Effector cells were incubated with both target cell populations together in round-bottom 96-well plates in culture medium at 37°C in a humidified atmosphere containing 5% CO2. Each well contained 53 104CFSE-labeled
plasma cells, 53 104Far Red-labeled K562 cells, and a serial dilution of
effectors (from 50 to 53 104cells). Wells containing target cells only served
as a control. In some wells, the HLA-ABC–specific mAb TP25.99.8.425 was added at 10 mg/mL. The assay was performed in triplicate. After 6 hours, all cells were harvested and immediately analyzed byflow cytometry. ELISA
Quantikine HS Human IL-12 kit (R&D Systems) and Verikine Human IFN-a kit (PBL Biomedical Laboratories) were used. The assays were read using a Bio-Rad 3550 plate reader.
Fluorescence microscopy and flow cytometry
Stained cells were examined under a Nikon TE2000 inverted microscope. Protein expression in these cells was expressed as the percentage of cells staining positively. Stained cells were also analyzed without delay on a FC500 (Beckman Coulter)flow cytometer using CXP software (Beckman Coulter) and FlowJo software (Tree Star). Levels of protein expression here were quantified in units of molecular equivalents of solublefluorochrome (MESF).13
For cells stained with pentamers, the level of nonspecific binding was cal-culated from the background signal observed in cells from 4 HLA-A*0201– negative patients. In particular, the cutoff for pentamer-positive signals was set as the average background signal plus 3 SD.
For the assessment of cytotoxicity, the entire target cell population was defined by a live gate in a forward scatter/side scatter dot plot. Specific target cells were denoted by regions in Fl-1 (CFSE)/Fl-4 (Far Red) dot plots and detected and enumerated as specific target cells as CFSE1(R2) and control target cells as Far Red1(R3). Percent specific lysis was calculated from the ratio (R2/R3) in cultures containing defined numbers (n) of effector T cells (R2/R3)n
com-pared with control (co) wells without T cells (R2/R3)cousing the formula:
100%2 [(R2/R3)n/(R2/R3)co]3 100%.
Statistical analysis
Statistical analyses were performed using Prism (GraphPad Software). Non-parametric statistics were used because much of the data were not distributed normally. Tests included the Kruskal-Wallis analysis of variance, the Mann-WhitneyU test for comparisons of groups, the Wilcoxon signed-rank test for comparison of matched samples, and Spearman’s rank test for correlations.
Results
To understand the role that BM DCs play in the MGUS-to-MM progression, we explored a variety of features and functions of these cells from 20 patients with MGUS and 20 patients with newly diag-nosed, symptomatic MM. For comparisons, we used BM DCs from 10 healthy controls as well as DCs from PB of all 3 groups. First, we determined the frequencies of mDCs and pDCs in the PB and BM of the 3 groups. To this aim, freshly drawn whole blood and marrow samples were stained with 2 different antibody cocktails (1 and 2) and analyzed byflow cytometry (Figure 1). Frequencies were determined as the proportion of live cells that were Lin–, HLA-DR1, and either CD11c1 (mDCs) or CD1231(pDCs) after staining with cocktail 1. In addition,
they were determined as the proportion of live cells that were Lin–, HLA-DR1, and either BDCA-11BDCA-31(mDCs) or BDCA-21 (pDCs) after staining with cocktail 2.
When cell frequencies were determined according to CD11c or CD123 immunoreactivity (cocktail 1, Figure 2A), the mean percent-ages of mDCs and pDCs in PB were significantly greater in control samples than in MM samples, with intermediate values in MGUS samples. In contrast, in BM the mean frequencies of mDCs and pDCs in the MM group were significantly elevated to approximately twice that in MM PB, reaching levels comparable with those of the BM in the other groups. Similar patterns emerged when the analysis was based on BDCA immunoreactivity (cocktail 2, Figure 2B). Absolute numbers of mDCs and pDCs showed similar trends, with PB values that progres-sively decrease moving from control to MM patients and BM values that progressively decrease moving from MM to controls, with inter-group differences not reaching statistical significance in the latter case (Figure 2C-D). The absolute numbers of BM mDCs and pDCs were found to correlate positively with the numbers of BM plasma cells (CD1381) in both MGUS and MM patients (Figure 2E). Altogether, these results suggest that mDCs and pDCs accumulate in the BM during the MGUS-to-MM progression and that this accumulation is pro-portional to the extent of tumor burden. These results also document that the 2 different antibody cocktails are able to identify the same cell populations; thus, for the remainder of our study, we used the cocktail 1 to label mDCs and pDCs.
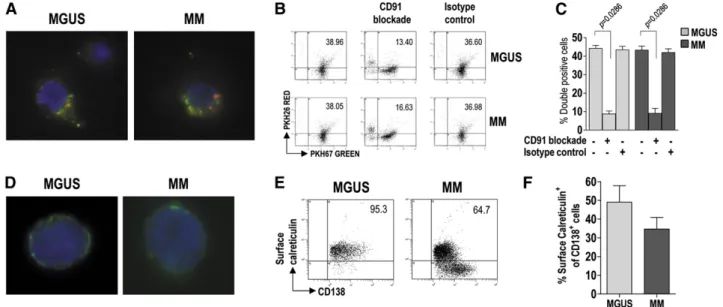
We next examined the ability of BM mDC and pDC to phagocytize apoptotic tumor plasma cells. For this purpose, both DC subsets from BM were pooled (to have enough cells for the experiment) and labeled with the green membrane dye PKH67, whereas BM CD1381cells were labeled with the red dye PKH26 and g-irradiated. The cell preparations were incubated together for 20 hours, after which the uptake of apoptotic cells by DCs was visualized byfluorescence microscopy (Figure 3A) and measured byflow cytometry as the percentage of doubly stained cells (Figure 3B-C). DC from both MGUS and MM patients showed strong and comparable phagocytic activity. This activity was negligible in control samples incubated on ice (data not shown) and was drastically reduced when incubation was performed in the presence of a CD91-blocking mAb but not in the presence of an unrelated isotype control antibody (Figure 3B-C). These results indicate that CD91 is crucial for the recognition and uptake of apoptotic tumor plasma cells by DC.
We therefore checked whether the natural CD91 ligand (ie, calreticulin) was exposed on the surface of tumor plasma cells. To this aim, BM CD1381cells were surface-stained for calreticulin and analyzed byfluorescence microscopy (Figure 3D) and by flow cytometry (Figure 3E-F). Calreticulin was found on the surface of tumor plasma cells from both MGUS and MM patients, and the percentages of stained cells were similar between the groups. These results indicate that preapoptotic tumor plasma cells, susceptible of being recognized and engulfed (via CD91) by DCs, are present in the BM of these patients.
We then assessed the costimulatory molecule expression and cytokine production by mDCs and pDCs in response to stimulation by apoptotic tumor plasma cells. To this aim, mDCs and pDCs were cultured in the absence or presence of g-irradiated CD1381cells before staining and analysis. Flow cytometry revealed that the stim-ulation by plasma cells significantly upregulated CD80 and CD86 expression in mDCs (Figure 4A-B) and in pDCs (Figure 4C-D) for both MGUS and MM patients, without significant differences between the 2 groups. It also revealed that plasma cell stimulation significantly increased the intracellular expression levels (reported as MESF units) of IL-12 in mDCs and IFN-a in pDCs (Figure 4E-F) in both groups. A similar increase was found when cytokine concentration was measured
in cell culture supernatants by ELISA (Figure 4G-H). Overall, these results demonstrate that the ability of mDCs and pDCs from MM patients to mature in response to apoptotic plasma cells is equivalent to that of MGUS patients.
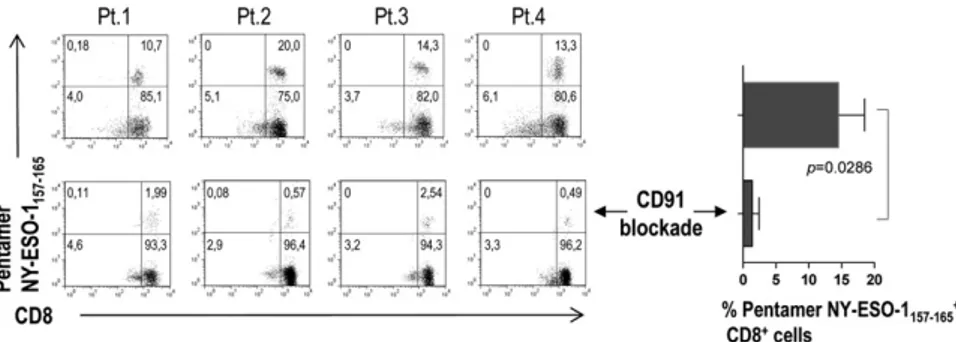
We then analyzed the ability of BM DCs (that have engulfed apoptotic tumor plasma cells) to present tumor plasma cell antigens to CD81T cells. To this aim, we selected from the study population 4 HLA-A*0201–positive MM patients. CD81T cells from their BM were expanded in vitro in the presence of autologous mDCs and pDCs pooled and loaded with allogeneic apoptotic plasma cells from HLA-A*0201–negative MM patients. DC loading had been per-formed in the absence or presence of a CD91-blocking mAb. The percentage of CD81T cells specific for the HLA-A*0201–restricted NY-ESO-1157-165epitope was detected by pentamer staining and flow cytometry after 21 days (two restimulations). A sizeable popu-lation of NY-ESO-1157-165–specific CD81T cells was found in all 4 patients and became significantly smaller when CD91 blockade was performed (Figure 5). No NY-ESO-1157-165pentamer-binding cells were observed when the same experiment was performed with a control influenza matrix58-66epitope-specific CD81T-cell line (data not shown). These results suggest that BM DCs are able to efficiently activate antitumor CD81T cells via crosspresentation and that this process is dependent on CD91.
We then examined the expression of CD28, a receptor for CD80/ CD86, on live tumor plasma cells. To this end, BMMCs were stained for CD28 and CD138 and analyzed byflow cytometry. CD28 expression in plasma cells (CD1381) was significantly higher in MM patients than in MGUS patients (Figure 6A-C), indicating that CD28 associates with disease status (progression). Based on this result, we investigated the effect of the CD28-mediated interaction between plasma cells and BM mDCs on the expression of proteasome subunits in live tumor cells. To this aim, we incubated mDCs with CD1381 cells before intracellular staining with a set of in-house mAb specific for proteasome subunits. Flow cytometric analysis of protein levels, expressed in MESF units, revealed a significant down-regulation of proteasome subunits in tumor plasma cells after culture with mDCs (Figure 6D-E). This downregulation was not observed in
tumor plasma cells cultured with mDCs in the presence of a CD28-blocking mAb (Figure 6E) or in cultures where plasma cells were separated from mDCs by a Transwell membrane (Figure 6D). Of note, when the experiment was repeated using tumor plasma cells also stained for CD28, no downregulation of proteasome subunits was observed in the CD28–fraction of CD1381cells (Figure 6F-G). These results indicate that BM mDCs modulate the expression of proteasome subunits in tumor plasma cells in a contact-dependent manner involving CD28.
Finally, we assessed the effects that lower levels of proteasome subunits might have on the recognition of tumor plasma cells by cytotoxic T lymphocytes. To this aim, we performedflow cytometry– based cytotoxicity assays (Figure 7). In the assays, effectors were CD81 T cells that had been expanded in vitro in the presence of autologous DCs loaded with autologous apoptotic plasma cells; targets were autologous CFSE-labeled CD1381cells that had been preincubated alone or in the presence of autologous BM mDCs, in either normal or Transwell culture plates, with or without a CD28-blocking mAb. The tumor plasma cell–specific CD81T cells were cytotoxic to CD1381 (plasma) cells not exposed to DC, with the percent specific lysis increasing with the effector:target ratio (Figure 7,first row). Minimal specific lysis was instead observed when the plasma cells had been preincubated with BM mDCs in normal culture plates (second row). However, the cytotoxic effect was retained when the preincubation had been done across a Transwell insert (third row) or in normal culture plates containing a CD28-blocking mAb (fourth row). These results suggest that DCs protect tumor plasma cells from CD81 T-cell killing.
Discussion
There is no agreement in the literature about the role of DCs in MM pathogenesis. Frequency, phenotype, and function of these cells have been described to be altered by some authors and normal by others. Moreover, different protocols of DC purification and maturation and Figure 1. Strategy of flow cytometry analysis of immunostained whole blood and marrow samples (from MGUS and MM patients). Gating was done sequentially on live cells, on lineage-negative cells, and then on CD11c1HLA-DRhicells or BDCA-1/BDCA-31HLA-DRhicells to identify mDCs and on CD1231HLA-DR1cells or BDCA-21
different ways of measuring DC activity have produced data20-26that cannot be compared and that do not often include MGUS patients.
Our paper provides a sharper picture of the distribution and func-tioning of DCs during the MGUS-to-MM progression. It shows that a considerable pool of mDCs and pDCs is“stockpiled” in BM in MGUS patients and even more so in MM patients. Marrow-resident mDCs and pDCs are fully capable of maturing and activating tumor-specific CD81 T cells upon engulfment of apoptotic tumor plasma cells that present calreticulin on their surface. mDCs are also able to interact directly with live tumor plasma cells, downregulate the expression of proteasome subunits in these cells, and make them resistant to CD81T-cell killing. Beyond the general interest in knowing the exact number of differentiated DCs within the BM, thefinding that DCs are abundant where tumor plasma cells are located is extremely important for 2 reasons: BM is an autonomous priming site for T-cell responses27-29 and DCs at the site of antigen expression are the cells most directly involved in determining T-cell immunity against the tumor. It can be supposed that DCs in BM are derived from PB and that BM recruit-ment is chemokine-mediated, tumor antigen–dependent, or both. The finding that recognition and uptake of apoptotic tumor plasma cells by DCs depend on the binding of surface calreticulin by its receptor CD91 extends the growing evidence that calreticulin acts as a crucial “eat me signal” for DCs6,8,9,30
that are equipped to perform antigen
crosspresentation. Importantly, we show that this mechanism is in-hibited when CD91 is blocked, thus demonstrating for thefirst time that the calreticulin–CD91 pathway is critical for the establishment of antitumor T-cell immunity in MM.
The capacity of BM-resident DCs to mature and successfully activate tumor-specific CD81T cells adds to our and others’ previous observations that tumor plasma cell–specific CD81T cells can be readily isolated from the blood and BM of patients with MGUS and MM.12,13,31Moreover, it strengthens the idea that T-cell priming by DCs is not abolished or impaired, indicating that there is no tolerance to plasma cell tumors. These considerations call into question the other novel aspect of our study that pertains to the consequences of the interaction between DCs and live tumor plasma cells. If there is no failure of priming or activation of T cells, we must suppose that progression of MGUS to MM is promoted by the ability of tumor plasma cells to evade T-cell recognition and killing. We previously demonstrated that tumor plasma cells downregulate the expression of proteasome subunits, whose levels correlate with the extent of the tumor plasma cells’ specific lysis by CD81T cells and predict the clinical progression of MGUS to MM.13Now we provide evi-dence for a mechanism responsible for this downregulation that surprisingly involves the binding of CD28 expressed on tumor plasma cells with its ligands CD80/CD86 expressed on BM mDCs. Figure 2. Frequency of DCs in whole blood and marrow samples (from 10 control subjects, 20 MGUS, and 20 MM patients). (A-D) Bar graphs show mean and standard deviation of percentages (A-B) and absolute numbers (C-D) of mDCs and pDCs identified with CD11c and CD123 mAb (A,C) or with BDCA-1/BDCA-3 and BDCA-2 mAb (B,D) in differently gated cells (see Figure 1). Kruskal-Wallis analysis of variance and Mann-Whitney U test for comparisons of groups. (E) Correlation between absolute numbers of BM plasma cells and absolute numbers of both mDCs and pDCs in MGUS and MM patients. Spearman’s rank test for correlations. P values are shown only for statistically significant comparisons.
The mechanism intensifies during the transition from MGUS to MM, with the progressive upregulation of CD28 on tumor plasma cells and the progressive accumulation of DCs in the BM. Thisfinding also adds a new piece of information to the role that CD28, best characterized as the prototypic costimulatory receptor in T cells, plays in plasma cell biology. CD28 expression in MM has been found to be associated with poor prognosis, disease progression, and resistance to chemotherapy.15-17Thus, its upregulation during the MGUS-to-MM transition may indeed reflect an escalation in the
intrinsic plasma cell malignancy, meaning that oncogenic events accumulate in a clone that gains proliferative advantages.
The molecular link between CD28 activation and proteasome subunit downregulation remains to be determined, but it is likely to involve the PI3K/AKT pathway for several reasons: (1) binding of CD28 on MM cells triggers PI3K/AKT signaling15; (2) PI3K/AKT signaling induces epigenetic silencing in tumors32,33; and (3) treatment of tumor plasma cells with decitabine, a potent DNA methyltransferase inhibitor, restores proteasome subunit expression, as we have already Figure 3. Uptake of apoptotic tumor plasma cells by BM DCs and role of calreticulin in this process. (A) Representative micrographs of green fluorescent, immunomagnetically purified DCs (from MGUS and MM patients) that have engulfed, in vitro, g-irradiated red fluorescent fragments of apoptotic plasma cells. (B-C) Changes in phagocytic activity of DCs in vitro, upon treatment with a CD91-blocking mAb, determined by flow cytometry. Representative plots (B) and percentages (C) of green DCs (from 9 MGUS and 9 MM patients) containing red apoptotic plasma cell fragments. Mann-Whitney U test. (D) Representative micrographs of immunomagnetically purified plasma cells (from MGUS and MM patients) showing membrane-associated fluorescence after surface staining with FITC-conjugated mAb to calreticulin. (E-F) Representative plots (E) and percentages (F) of tumor plasma cells (from 20 MGUS and 20 MM patients) that stained positively for surface calreticulin. Mann-Whitney U test. P values are shown only for statistically significant comparisons.
Figure 4. Costimulatory molecule expression and cytokine production by BM DCs (from 20 MGUS and 20 MM patients). (A-D) Changes in percentages of mDCs (A-B) and pDCs (C-D) expressing CD80 (A,C) and CD86 (B,D) upon stimulation with apoptotic tumor plasma cells. Wilcoxon signed-rank test. (E-H) IL-12 (E,G) and IFN-a (F,H) production by mDCs and pDCs, respectively, upon stimulation with apoptotic tumor plasma cells, assessed by flow cytometry (E-F) and ELISA (G-H). Mann-Whitney U test. IL-12 and IFN-a protein levels in positive cells analyzed with flow cytome-try are reported in MESF units. The MESF rate was calculated as the MESF of the stimulated sample divided by that of the unstimulated sample for the same subject. P values are shown only for statistically significant comparisons.
reported.13Additional studies are also required to understand whether the reduced killing, by CD81T cells, of tumor plasma cells with lower levels of proteasome subunits is caused by their decreased efficiency of epitope generation or their altered antigen repertoire.
In conclusion, we propose that DC double-cross T cells: for one, DCs activate CD81T cells against tumor plasma cells, but they also nullify this activation by protecting tumor plasma cells. This knowledge
has implications for the design of immunotherapy approaches that can enhance immune surveillance in MGUS and break down immune tol-erance in MM. In particular, blocking CD28 interactions in vivo would prevent immune escape of tumor plasma cells and resensitize them to lysis by cytotoxic T cells. In this respect, abatacept (CTLA4-Ig), a synthetic antagonist of CD28 used for the treatment of rheumatoid arthritis,34could readily be moved to MM treatment. CD28 blockade Figure 5. BM HLA-A2 tumor epitope–specific CD81
T cells activated in vitro by BM DCs through cross-presentation. Representative plots and percentages (from 4 MM patients) of pentamer-binding populations upon stimulation with DCs loaded with tumor antigen in the absence (top) and presence of a CD91-blocking mAb (bottom).
Figure 6. CD28 expression and CD28-mediated in-teraction of tumor plasma cells with BM DCs (effect on proteasome subunit expression by tumor plasma cells). Representative plots (A) and percentages (B-C) of tumor plasma cells expressing CD28 (from 20 MGUS and 20 MM patients). Mann-Whitney U test. (D) Representative histograms for the expression of selected proteasome subunits by tumor plasma cells after incubation with BM mDCs in different conditions. (E) Effect of CD28 blockade on proteasome subunit expression in tumor plasma cells. Expression levels in positive cells are reported in MESF units. Wilcoxon signed-rank test. (F-G) Representative histograms (F) and levels (MESF units) (G) of expression of proteasome subunits by CD28–tumor plasma cells
after incubation with BM mDCs in different conditions. P values are shown only for statistically significant comparisons.
would also improve the limited efficacy thus far of DC-based vaccines.35Our in vitrofindings encourage the development of these new immunotherapies.
Acknowledgments
The authors are grateful to Dr Soldano Ferrone (Department of Surgery, Massachusetts General Hospital, Harvard Medical School, Boston, MA) for generously providing monoclonal antibodies against proteasome subunits.
This work was supported by the Italian Association for Cancer Research (AIRC) through an Investigator Grant (14095) and a Molecular Clinical Oncology Program grant (9965), by the European Seventh Framework Programme (EU FPT7, OVER-MyR, 278706), and by the Italian Ministry of Education, University and Research (MIUR, PRIN 2010 NECHBX). The sponsors of this study are public
or nonprofit organizations that support science in general; they had no role in gathering, analyzing, or interpreting the data.
Authorship
Contribution: P.L. and V.R. designed the research, analyzed data, and wrote the paper; P.L., S.B., M.A.F., and R.R. performed re-search; V.D.R., S.C., S.B., and P.D. provided reagents, materials, and analysis tools; and F.D. and A.V. read and made comments on manuscript.
Conflict-of-interest disclosure: The authors declare no competing financial interests.
Correspondence: Vito Racanelli, Department of Internal Medi-cine and Clinical Oncology, University of Bari Medical School, Policlinico - 11, Piazza G. Cesare, 70124 Bari, Italy; e-mail: vito. [email protected].
References
1. Kyle RA, Rajkumar SV. Multiple myeloma. Blood. 2008;111(6):2962-2972.
2. Dhodapkar MV, Dhodapkar KM, Palucka AK. Interactions of tumor cells with dendritic cells: balancing immunity and tolerance. Cell Death Differ. 2008;15(1):39-50.
3. Joffre OP, Segura E, Savina A, Amigorena S. Cross-presentation by dendritic cells. Nat Rev Immunol. 2012;12(8):557-569.
4. Palucka K, Ueno H, Fay J, Banchereau J. Dendritic cells and immunity against cancer. J Intern Med. 2011;269(1):64-73.
5. Ziegler-Heitbrock L, Ancuta P, Crowe S, et al. Nomenclature of monocytes and dendritic cells in blood. Blood. 2010;116(16):e74-e80.
6. Garg AD, Nowis D, Golab J, Vandenabeele P, Krysko DV, Agostinis P. Immunogenic cell death, DAMPs and anticancer therapeutics: an emerging amalgamation. Biochim Biophys Acta. 2010; 1805(1):53-71.
7. Basu S, Binder RJ, Ramalingam T, Srivastava PK. CD91 is a common receptor for heat shock proteins gp96, hsp90, hsp70, and calreticulin. Immunity. 2001;14(3):303-313.
8. Gardai SJ, McPhillips KA, Frasch SC, et al. Cell-surface calreticulin initiates clearance of viable or apoptotic cells through trans-activation of LRP on the phagocyte. Cell. 2005;123(2):321-334. 9. Obeid M, Tesniere A, Ghiringhelli F, et al.
Calreticulin exposure dictates the immunogenicity of cancer cell death. Nat Med. 2007;13(1):54-61. 10. Guermonprez P, Valladeau J, Zitvogel L, Th ´ery C,
Amigorena S. Antigen presentation and T cell stimulation by dendritic cells. Annu Rev Immunol. 2002;20:621-667.
11. Leone P, Shin EC, Perosa F, Vacca A, Dammacco F, Racanelli V. MHC class I antigen processing and presenting machinery: organization, function, and defects in tumor cells. J Natl Cancer Inst. 2013;105(16):1172-1187. 12. Dhodapkar MV, Krasovsky J, Olson K. T cells
from the tumor microenvironment of patients with progressive myeloma can generate strong, specific cytolytic responses to autologous, tumor-loaded dendritic cells. Proc Natl Acad Sci USA. 2002;99(20):13009-13013.
13. Racanelli V, Leone P, Frassanito MA, et al. Alterations in the antigen processing-presenting machinery of transformed plasma cells are
associated with reduced recognition by CD81 T cells and characterize the progression of MGUS to multiple myeloma. Blood. 2010;115(6): 1185-1193.
14. Kukreja A, Hutchinson A, Dhodapkar K, et al. Enhancement of clonogenicity of human multiple myeloma by dendritic cells. J Exp Med. 2006; 203(8):1859-1865.
15. Bahlis NJ, King AM, Kolonias D, et al. CD28-mediated regulation of multiple myeloma cell proliferation and survival. Blood. 2007;109(11): 5002-5010.
16. Murray ME, Gavile CM, Nair JR, et al. CD28-mediated pro-survival signaling induces chemotherapeutic resistance in multiple myeloma. Blood. 2014;123(24):3770-3779. 17. Nair JR, Carlson LM, Koorella C, et al.
CD28 expressed on malignant plasma cells induces a prosurvival and immunosuppressive microenvironment. J Immunol. 2011;187(3): 1243-1253.
18. International Myeloma Working Group. Criteria for the classification of monoclonal gammopathies, multiple myeloma and related disorders: a report Figure 7. Effect of BM DCs on tumor plasma cell susceptibility to CD81T cell–mediated killing in vitro. Representative plots and percentages (mean and stan-dard deviation) of lysis of CFSE-labeled tumor plasma cells by BM CD81T cells from 15 MM patients. Immuno-magnetically purified CFSE-labeled plasma cells were cultured with autologous BM mDCs in different conditions. After a preincubation period, Far Red–labeled K562 cells and autologous BM CD81T cells were added to each well at the indicated ratios. Far Red–labeled K562 cells were used as negative control targets.
of the International Myeloma Working Group. Br J Haematol. 2003;121(5):749-757.
19. Racanelli V, Frassanito MA, Leone P, Brunetti C, Ruggieri S, Dammacco F. Bone marrow of persistently hepatitis C virus-infected individuals accumulates memory CD81 T cells specific for current and historical viral antigens: a study in patients with benign hematological disorders. J Immunol. 2007;179(8):5387-5398. 20. Brimnes MK, Svane IM, Johnsen HE. Impaired
functionality and phenotypic profile of dendritic cells from patients with multiple myeloma. Clin Exp Immunol. 2006;144(1):76-84.
21. Brown RD, Pope B, Murray A, et al. Dendritic cells from patients with myeloma are numerically normal but functionally defective as they fail to up-regulate CD80 (B7-1) expression after huCD40LT stimulation because of inhibition by transforming growth factor-beta1 and interleukin-10. Blood. 2001;98(10):2992-2998.
22. Do TH, Johnsen HE, Kjaersgaard E, Taaning E, Svane IM. Impaired circulating myeloid DCs from myeloma patients. Cytotherapy. 2004;6(3): 196-203.
23. Mart´ın-Ayuso M, Almeida J, P ´erez-Andr ´es M, et al. Peripheral blood dendritic cell subsets from patients with monoclonal gammopathies show an abnormal distribution and are functionally impaired. Oncologist. 2008;13(1):82-92.
24. Pfeiffer S, Gooding RP, Apperley JF, Goldschmidt H, Samson D. Dendritic cells generated from the blood of patients with multiple myeloma are phenotypically and functionally identical to those similarly produced from healthy donors. Br J Haematol. 1997;98(4):973-982.
25. Raje N, Gong J, Chauhan D, et al. Bone marrow and peripheral blood dendritic cells from patients with multiple myeloma are phenotypically and functionally normal despite the detection of Kaposi’s sarcoma herpesvirus gene sequences. Blood. 1999;93(5):1487-1495.
26. Ratta M, Fagnoni F, Curti A, et al. Dendritic cells are functionally defective in multiple myeloma: the role of interleukin-6. Blood. 2002;100(1):230-237. 27. Feuerer M, Beckhove P, Garbi N, et al. Bone
marrow as a priming site for T-cell responses to blood-borne antigen. Nat Med. 2003;9(9): 1151-1157.
28. Schirrmacher V, Feuerer M, Fournier P, Ahlert T, Umansky V, Beckhove P. T-cell priming in bone marrow: the potential for long-lasting protective anti-tumor immunity. Trends Mol Med. 2003; 9(12):526-534.
29. Tripp RA, Topham DJ, Watson SR, Doherty PC. Bone marrow can function as a lymphoid organ during a primary immune response under conditions of disrupted lymphocyte trafficking. J Immunol. 1997;158(8):3716-3720.
30. Chao MP, Jaiswal S, Weissman-Tsukamoto R, et al. Calreticulin is the dominant pro-phagocytic signal on multiple human cancers and is counterbalanced by CD47. Sci Transl Med. 2010; 2(63):63ra94.
31. Dhodapkar MV, Krasovsky J, Osman K, Geller MD. Vigorous premalignancy-specific effector T cell response in the bone marrow of patients with monoclonal gammopathy. J Exp Med. 2003; 198(11):1753-1757.
32. Sun L, Zhao H, Xu Z, et al. Phosphatidylinositol 3-kinase/protein kinase B pathway stabilizes DNA methyltransferase I protein and maintains DNA methylation. Cell Signal. 2007;19(11): 2255-2263.
33. Zuo T, Liu TM, Lan X, et al. Epigenetic silencing mediated through activated PI3K/AKT signaling in breast cancer. Cancer Res. 2011;71(5): 1752-1762.
34. Ruderman EM, Pope RM. The evolving clinical profile of abatacept (CTLA4-Ig): a novel co-stimulatory modulator for the treatment of rheumatoid arthritis. Arthritis Res Ther. 2005; 7(Suppl 2):S21-S25.
35. Nguyen-Pham TN, Lee YK, Kim HJ, Lee JJ. Immunotherapy using dendritic cells against multiple myeloma: how to improve? Clin Dev Immunol. 2012;2012:397648.