Looking at the employment dimension, the 2008 crisis has deeply affected European jobs. In the fi rst quarter of 2014, 16.3 million people had been out of work for 12 months or more, almost twice the number from 2007.3 However, such job losses have been highly uneven. As shown in Figure 1, employment in the German-cen-tred core has modestly expanded beyond its pre-cri-sis levels, with average annual employment growth of around 0.6 per cent. Conversely, the Southern periph-ery has experienced massive job losses, reversing the strong growth observed during the previous upswing (2003-2008). Dramatic reductions in employment oc-curred throughout the entire Southern periphery, but Greece and Portugal were hit the hardest, experienc-ing annual job losses of 4.6 per cent and 1.2 per cent respectively. Thanks to job growth in the Netherlands, Sweden and the United Kingdom, a third country group-ing, consisting of northern European countries, has avoided job losses.
The division between the German-centred core and the Southern periphery is also remarkable in terms of youth unemployment fi gures, which refl ect job opportunities for new entrants (15-29 years of age) in the labour mar-ket. While youth unemployment between 2008 and 2013 increased moderately in the core (with the positive ex-ception of Germany, where a reduction of 2.3 percent-age points was observed in this period), it dramatically increased by 14 to 32 percentage points in the periphery, with youth unemployment in Greece reaching 48.7 per cent in 2013 – seven times the value for Germany.4 The divergence between a German-centred core and a Southern periphery exists not only in terms of economic
3 OECD: OECD Employment Outlook 2014, OECD Publishing, Paris 2014.
4 OECD: Employment and Labour Markets: Key Tables from OECD.
The model of growth and integration followed in Europe in recent decades was founded on a high degree of liber-alisation of the capital and goods markets. The economic convergence of EU member states has been one of the fundamental objectives of this “supply side” policy ap-proach. However, the expected convergence has been limited, and the impact of the current crisis has led to a growing divergence among European countries in terms of employment, competitiveness and industrial speciali-sation. A growing body of evidence, including Simonazzi et al., Stoellinger et al., and Landesmann,1 has identifi ed the emergence of a “German-centred core” – which has maintained high levels of employment and production – while the “Southern periphery” has suffered major loss-es.2 Such a geographical dichotomy is also refl ected in a divergence of jobs and skills.
1 A. S i m o n a z z i , A. G i n z b u r g , G. N o c e l l a : Economic relations be-tween Germany and southern Europe, in: Cambridge Journal of Eco-nomics, Vol. 37, No. 3, 2013, pp. 653-675; and R. S t o e l l i n g e r, N. F o s t e r- M c G r e g o r, M. H o l z n e r, M. L a n d e s m a n n , J. P o s c h l , R. S t e h r e r : A Manufacturing Imperative in the EU – Europe’s posi-tion in global manufacturing and the role for industrial policy, wiiw Re-search reports, No. 391, October 2013; and M. L a n d e s m a n n : The new North-South Divide in Europe – can the European convergence model be resuscitated?, wiiw, mimeo 2013.
2 The “German-centred core” is composed of Germany, Austria, the Czech Republic, Poland, Slovakia and Hungary, while Italy, Spain, France, Greece and Portugal are part of the “Southern periphery” group. We adapted the classifi cation proposed by R. S t o e l l i n g e r et al., op. cit. and M. L a n d e s m a n n , op. cit. A third group of north-ern EU countries – including the United Kingdom, Ireland, Sweden, Finland, Denmark and Belgium – has followed different trajectories, including a rise in fi nance and services. Bulgaria, Romania, Slovenia, Croatia, Malta, Cyprus, Luxembourg and the Baltic countries are ex-cluded from this analysis.
Valeria Cirillo and Dario Guarascio
Jobs and Competitiveness in a Polarised Europe
In the aftermath of the crisis, Europe is becoming more polarised in terms of employment,
competitiveness and industrial specialisation. A “German-centred core” – which maintained
employment and production – has emerged, contrasted by a “Southern periphery”, where
major economic losses have occurred. Such geographical divergence is associated with a
further polarisation in terms of skills. A new European industrial policy is needed to reverse
this polarisation process and its dangerous implications for trade balances and cohesion.
Valeria Cirillo, Scuola Superiore Sant’Anna, Pisa, Italy.
Industrial Production
In Europe the overall evolution of the skill structure has led to a polarisation of skill sets instead of the upskilling suggested by the skill-biased technical change view. Em-ployment polarisation occurred more quickly during the previous upswing (2003-2008), while the crisis has led to major job losses among low-skilled workers in manufac-turing and mid-skilled workers in services.7 Construction and manufacturing lost ten per cent of their pre-crisis em-ployment levels. Conversely, the services sector employs over 70 per cent of the EU workforce, and its share con-tinues to grow. Public services like health and education were more resilient in terms of post-crisis employment. The divergence in sectoral performances contributes to a reshaping of Europe’s employment through a combined process of structural and technical change.8 In order to identify how employment has been transformed by these dynamics, we decomposed the total change in employ-ment at the industry level during the period 2008-2014 into two main components. First, we accounted for the num-ber of employees moving from manufacturing to services during this period (the between-industries component). Second, keeping the employment dimension of manu-facturing and services constant over time, we accounted for changes in the skills structure within each sector (the
7 Eurofound: The social impact of the crisis, Eurofound, Dublin 2011; Eurofound: Employment polarisation and job quality … , op. cit. 8 V. C i r i l l o et al., op. cit.
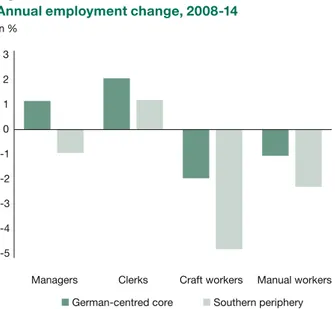
performance but also for skills.5 Using the International Standard Classifi cation of Occupations (ISCO), we inves-tigated the evolution of four professional groups that ac-count for a wide variety of skills: managers, clerks, craft workers and manual workers. ISCO classifi cation syn-thetises the multidimensional aspects of jobs in terms of tasks, level of autonomy in the workplace, education and wages.6
Figure 2 shows that the German-centred core and the Southern periphery have had dramatically different tra-jectories. The core has continued to create employment in higher-skilled positions – managers and clerks – with modest losses in lower-skilled jobs. The periphery has suffered job losses at both the top (managers) and bot-tom (craft and manual workers) of the jobs distribution, suggesting a downgrading of the whole occupational structure, which has led to the emergence of a hierarchi-cal divide between the two areas.
5 Skill polarisation is refl ected in the relative growth of the highest and lowest skill categories compared to middle-skilled jobs. See found: Employment polarisation and job quality in the crisis: Euro-pean Jobs Monitor 2013, Dublin 2013.
6 Following Cirillo, Pianta and Nascia, we aggregate ISCO categories as follows: managers, professionals and technicians in the “managers” group; clerk workers and service workers in the “clerks” group; craft workers and skilled agricultural workers in the “craft workers” group; and manual workers and elementary occupations in the “manual” group. The aggregation into these four groups refl ects educational and wage ranks of ISCO88. See V. C i r i l l o , M. P i a n t a , L. N a s c i a : The Shaping of Skills: Wages, Education, Innovation, University of Urbino, Working paper, No. 1406, 2014.
Figure 1
Annual employment change by group of countries
in %
S o u r c e : Own elaboration on Eurostat LFS data.
Figure 2
Annual employment change, 2008-14
in %
N o t e : German-centred core: DE, AT, CZ, SK, PL, HU; Southern periph-ery: IT, ES, PT, EL, FR.
S o u r c e : Own elaboration on Eurostat LFS data. -5 -4 -3 -2 -1 0 1 2 3
Managers Clerks Craft workers Manual workers German-centred core Southern periphery -2
-1 0 1 2
German-centred core Southern pheriphery Northern countries (DE, AT, CZ, (IT, ES, PT, EL, FR) (UK, IE, SE, FI,
DK, BE, NL) SK, PL, HU)
has characterised all advanced countries.11 Moreover, production systems have become more complex and in-ternationalised, with the fragmentation and international integration of production leading to offshoring and out-sourcing, particularly to emerging economies.12
These developments have been uneven across European economies, refl ecting in terms of industrial production the same asymmetries between core and periphery that were described above for employment. Germany has managed to build and lead a strong production network in the coun-tries of the German-centred manufacturing core. This heterogeneous evolution of industries, and the divergent specialisation dynamics among countries, have acceler-ated since the 1990s.
The countries belonging to the German-centred core have recovered from the crisis faster in terms of em-ployment, GDP and export market share. Conversely, a substantial loss of production in the Southern periphery between 2008 and 2013 has accelerated the polarisation process.13 The contraction observed in the periphery rep-resents an erosion of the European Union’s manufactur-ing base and has been identifi ed as a threat to European
11 A strong contraction of the manufacturing share on GDP has been observed in the EU15, US and Japan over the period 1990-2010. Con-versely, countries like China, South Korea and some of the new EU member states have increased their manufacturing shares over the same period.
12 D. H u m m e l s , J. I s h i i , K.M. Y i : The Nature and Growth of Vertical Specialization in World Trade, in: Journal of International Economics, Vol. 54, No. 1, 2001, pp. 959-972; M. T i m m e r, B. L o s , R. S t e h r e r, G. d e V r i e s : Fragmentation, incomes and jobs: An analysis of Eu-ropean competitiveness, in: Economic Policy, Vol. 28, No. 76, 2013, pp. 613-661.
13 The reduction of the periphery’s productive capacity during the pe-riod 2008-2013 has been striking: in Italy the contraction has been 21 per cent, in Spain 24 per cent, in Portugal 22 per cent and in Greece 27 per cent. See M. P i a n t a : An Industrial Policy for Europe, in: Seoul Journal of Economics, Vol. 27, No. 3, 2014, pp. 277-305.
within-industry component).9 As shown in Table 1, the growth in managers during the crisis has been driven by the expansion of services and by the upskilling within ser-vices; all of the other skill groups have experienced losses in manufacturing and modest rises in services, as well as reductions of their share within each industry.
A pattern of job destruction in a context of increasing ge-ographical polarisation is affecting the European Union. Low-skilled workers have sufffered the most since the onset of the crisis, above all in the manufacturing sector and in the Southern periphery, where a downgrading of the occupational structure has emerged. As the ranking of professional groups is associated with the hierarchy of wages, such patterns are fuelling the growing income in-equality within Europe.
The evolution of the European industrial structure
The trends discussed above are strongly linked with change in the industrial structure.10 Figure 3 shows that the German-centred core has combined a larger increase in industrial production with the best performance in total employment; meanwhile, the Southern periphery has lost in terms of both production and jobs.
Such changes have been affected by the long-term pro-cess of deindustrialisation and the rise of services that
9 The decomposition was performed applying the Berman, Bound and Machin algorithm, which is a reformulation of the shift-share analysis. See E. B e r m a n , J. B o u n d , S. M a c h i n : Implications of Skill-Biased Technological Change: International Evidence, in: The Quarterly Jour-nal of Economics, Vol. 113, No. 4, 1998, pp. 1245-1279.
10 The evidence provided in this paragraph is based on a previous work analysing the relationships among the R&D efforts, innovative performance and competitiveness of European industries. See D. G u a r a s -c i o , M. P i a n t a , F. B o g l i a -c i n o : Export, R&D and New Produ-cts: A Model and a Test on European Industries, University of Urbino, Work-ing Paper No. 1407, 2014.
Table 1
Decomposition of employment change by skill and macro sector, 2008-14
in %
N o t e s : Manufacturing: Nace Rev.2 (C); Services: Nace Rev.2 (G, I, H, J, K, L, M, N, O, P, Q); Countries: DE, AT, CZ, SK, NL, PL, HU, UK, IE, SE, FI, DK, BE, IT, ES, PT, EL, FR.
S o u r c e : Own elaboration on Eurostat LFS data.
Managers Clerks Craft workers Manual workers Sectors Between industries Within industry Between industries Within industry Between industries Within industry Between industries Within industry Manufacturing -1.26 0.79 -0.46 0.24 -1.28 -0.05 -1.16 -0.98 Services 1.90 4.32 1.46 -1.83 0.20 -0.73 0.61 -1.76 Total change 0.64 5.11 1.00 -1.59 -1.09 -0.78 -0.55 -2.74
Industrial Production
German-centred core. Conversely, the Southern periph-ery is shrinking in terms of R&D efforts, innovation perfor-mance and manufacturing base. Such divergent trajecto-ries are deepening the polarisation across the EU.17 Due to their proximity and alignment with the core, the Central and Eastern European countries have increased their in-novation efforts, while the Southern periphery continues to decline.18
These divergent patterns are linked to a deeper process of structural change across European economies.19 As shown by Landesmann, the German-centred core has ex-perienced a shift towards technologically advanced sec-tors, while the contraction of these sectors in the periph-ery has been remarkable.20 Conversely, the share of con-struction and market services – traditionally non-tradable sectors that play little role in the diffusion of innovation – increased signifi cantly in the periphery. Thus, the rising
17 V. C i r i l l o et al., op. cit.
18 Within the core, the Czech Republic, Hungary and Slovakia increased their total business R&D expenditures by around 9.5 per cent, 13 per cent and 14 per cent respectively over the period 2006-2013, while in the Southern periphery, Spain, Italy and France increased such ex-penditures by only around four per cent. See Eurostat Business enter-prise R&D expenditure dataset.
19 A process of structural change is a long-lasting change in the set of goods and services produced and in the composition of capabilities – the physical and human capital base as a part of the factors of pro-duction.
20 See M. L a n d e s m a n n , op. cit. According to the OCSE defi nition, such sectors include aircraft, pharmaceuticals, computer machiner-ies, medical, precision and optical instruments, etc.
industry’s growth and competitiveness in the medium to long run.14
Figure 4 highlights the dynamics of polarisation among member states in terms of manufacturing share over the period 2008-2013. A clear divergence in specialisation between the two country groups emerges.
The importance of manufacturing is by now widely rec-ognised.15 Manufacturing matters for a variety of reasons. First, the manufacturing sector produces the capital goods used by the service sector and is the main driver of innovation in the economy. Second, the tradability of manufactured goods creates benefi ts from knowledge diffusion. Third, a strong and technologically advanced manufacturing base fosters the diffusion of innovation in the service sector. These arguments are at the base of the so-called manufacturing imperative.16
The positive relationship between the size of the manu-facturing sector and innovation intensity characterises the
14 European Commission: European Competitiveness Report: Towards Knowledge-driven Reindustrialisation, SWD(2013)347 fi nal, Brussels 2013.
15 D. R o d r i k : The Manufacturing Imperative, Project Syndicate, 10 Au-gust 2012; R. S t o e l l i n g e r et al., op. cit.; European Commission: Eu-ropean Competitiveness Report: Towards Knowledge-driven … op. cit.; European Commission: European Competitiveness Report 2014: Helping Firms Grow, Brussels 2014.
16 The concept of the “manufacturing imperative” was put forth by D. R o d r i k , op. cit. and applied to Europe by R. S t o e l l i n g e r et al., op. cit.
Figure 3
The relationship between employment and industrial production, 2008-14
Figure 4
Manufacturing’s share of GDP, selected countries, 2008 and 2013
N o t e : Industrial Production, UNECE (Industrial Production Index 100 = 2005).
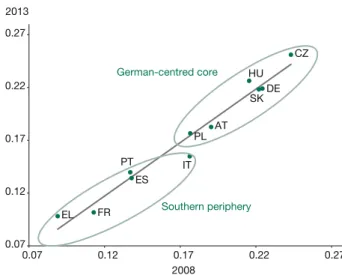
S o u r c e : Employment data from Eurostat LFS. S o u r c e : Authors elaboration on EU-KLEMS data. DE CZ SK PL HU IT ES PT EL FR AT 0.07 0.12 0.17 0.22 0.27 0.07 0.12 0.17 0.22 0.27 2013 2008 German-centred core Southern periphery AT BE CZ DK FI FR DE EL HU IE IT NL PL PT SE SK ES UK -5 -4 -3 -2 -1 0 1 2 -30 -20 -10 0 10 20 30 40
Average change in employment (%)
German-centred core Southern periphery Chang e in indus trial pr oduction
have a comparative advantage, the products are charac-terised by a high degree of complexity.
The production of complex and technologically advanced products has allowed European industries to be well posi-tioned in global competition, in particular vis-à-vis emerg-ing economies. Between 1995 and 2009, as Chinese ex-ports increased dramatically, EU value added in Chinese manufacturing exports increased more than that of indus-tries from other parts of the world.23
This good position of the European Union as a whole in terms of industrial competitiveness is endangered by the polarisation dynamics described above. Such dynamics could be harmful for the competitiveness of European industries in the medium run. A decrease in importance of the high-tech sector and an overall contraction of the manufacturing base in Europe’s periphery would in-crease the EU’s vulnerability to Asian exports and reduce the potential for knowledge and innovation diffusion in Europe.
In recent years, the so-called core and periphery coun-tries of the EU have undergone an economic divergence in terms of employment, industrial structure and competi-tiveness. In order to counterbalance such a polarisation and strengthen the competitiveness of European indus-tries, a new industrial policy is needed.
23 European Commission: European Competitiveness Report: Towards Knowledge-driven … op. cit., p. 26.
polarisation across the EU27 has also emerged in terms of structural change.
The dynamics of structural change is closely connected with the competitiveness of industries. In particular, com-petitiveness strategies based on technological enhance-ments, innovation and product complexity could help to enable growth-enhancing structural change. The latter element is particularly relevant in terms of the acquisition and maintenance of high-value market shares in glob-al competition. On the contrary, cost competitiveness strategies aiming to compete by reducing labour costs weaken the foundation for a technological upgrade of the economy.21
The increase in the size of the core’s tradable sector pushed it towards a technological competitiveness strat-egy. Such a strategy allowed it to gain relevant shares in international markets. Meanwhile, the Southern pe-riphery’s cost competitiveness strategy hampered its transition towards a technologically enhancing struc-tural change. Figure 5 shows the divergence in terms of competitiveness strategies through the dynamics of unit labour costs. Since 2010, the periphery has been char-acterised by a signifi cant reduction of unit labour costs compared to the core and the EU27 average.
Considering the European Union as a whole, it is impor-tant to stress that the continent is still characterised by a relatively strong industrial structure and enjoys inter-national comparative advantages in most manufacturing sectors – including pharmaceuticals, chemicals, vehicles, machinery and other transport equipment (which includes aerospace) – as well as in low- and medium-tech sectors such as food, beverages, tobacco, paper and plastic. The same picture appears when we look at the degree of complexity of products as an indicator of competitive-ness.22 In most of the sectors where European industries
21 Comprehensive analyses of the concepts of technological and cost competitiveness are provided by G. D o s i : Technological paradigms and technological trajectories: a suggested interpretations of the de-terminants and directions of technical change, in: Research Policy, Vol. 11, No. 3, 1982, pp. 147-162; and M. P i a n t a : Innovation, Demand and Employment, in: P. P e t i t , L. S o e t e (eds.): Technology and the future of European Employment, Cheltenham 2001, Edward Elgar, pp. 142-165.
22 A relatively high level of product complexity allows fi rms to better de-fend themselves from imitation, ensuring at the same time techno-logical leadership. Many authors have shown that a higher share of complex and sophisticated products belongs to the high-tech manu-facturing sector. See A. R e i n s t a l l e r, W. H ö l z l , J. K u t s a m , C. S c h m i d : The development of productive structures of EU Member States and their international competitiveness, WIFO research study, 2012; R. S t o e l l i n g e r et al., op. cit.; European Commission: Euro-pean Competitiveness Report: Towards Knowledge-driven … op. cit.; European Commission: European Competitiveness Report 2014: Helping Firms … op. cit.; and D. G u a r a s c i o et al., op. cit.
Figure 5
Changes in unit labour costs, 2005-14
in %
S o u r c e : Authors’ elaboration on Eurostat data. -2 0 2 4 6 8 10 2005 2006 2007 2008 2009 2010 2011 2012 2013 2014 Germany Periphery Other core countries