DISI ‐ Via Sommarive 14 ‐ 38123 Povo ‐ Trento (Italy)
http://www.disi.unitn.it
MINING SUBJECTIVE DATA
ON THE WEB
Mikalai Tsytsarau and Themis Palpanas
July 2010
(will be inserted by the editor)
Mining Subjective Data on the Web
Mikalai Tsytsarau · Themis Palpanas
the date of receipt and acceptance should be inserted later
Abstract In the past years we have witnessed Sentiment Analysis and Opinion
Min-ing becomMin-ing increasMin-ingly popular topics in Information Retrieval and Web data anal-ysis. With the rapid growth of the user-generated content represented in blogs, wikis and Web forums, such an analysis became a useful tool for mining the Web, since it allowed us to capture sentiments and opinions at a large scale.
Opinion retrieval has established itself as an important part of search engines. Ratings, opinion trends and representative opinions enrich the search experience of users when combined with traditional document retrieval, by showing more insights about a subject. Opinion aggregation over product reviews can be very useful for product marketing and positioning, revealing the customers’ attitude to a product and its features along different dimensions, such as time, geographical location, and ex-perience. Tracking how opinions or discussions evolve over time can help us identify interesting trends and patterns and better understand the ways that information is propagated in the Internet.
In this study, we review the development of Sentiment Analysis and Opinion Mining during the last years, and also discuss the evolution of a relatively new re-search direction, namely, Contradiction Analysis. We give an overview of the pro-posed methods and recent advances in these areas, and we try to layout the future research directions in the field.
Keywords Sentiment Analysis· Opinion Mining · Contradiction Analysis M. Tsytsarau
University of Trento, Trento, TN 38100, Italy Tel.: +39-3204-87-3450
E-mail: [email protected] T. Palpanas
University of Trento, Trento, TN 38100, Italy Tel.: +39-0461-28-3908
Fax: +39-0461-28-2093 E-mail: [email protected]
1 Introduction
Since the World Wide Web first appeared two decades ago, it has changed the way we manage and interact with information. It has now become possible to gather the information of our preference from multiple specialized sources and read it straight from our computer screen. But even more importantly, it has changed the way we share information. The audience, that is, the receivers of the information, do not only consume the available content, but in turn, they actively annotate this content, and generate new pieces of information. In this way, the entire community becomes a writer as well as a reader. Today people not only comment on the existing informa-tion, bookmark pages, and provide ratings, but they also share their ideas, news and knowledge with others.
There exist many mediums, where people can express themselves on the Web. Blogs, wikis, forums and social networks are examples of such mediums, where users can post information, give opinions and get feedback from other users. In their own right, they collectively represent a rich source of information on different aspects of life, but more importantly so on a myriad of different topics, ranging from politics and health to product reviews and traveling. The increasing popularity of personal pub-lishing services of different kinds suggests that opinionative information will become an important aspect of the textual data on the web.
Due to the ever growing size of the information on the Web, we are now barely able to access the information without the help of search engines. This problem gets harder, when we want to aggregate the information from different sources. Multiple solutions have been proposed to solve this problem, and they are mainly specialized in factual information retrieval. To achieve this, subjectivity filtering is applied (Riloff et al, 2005), in order to remove texts that may provide a biased point of view. These texts can be distinguished by analyzing sentiments expressed by the authors, or by discovering explicit marks of contradiction with other texts (Ennals et al, 2010b). This dimension of Web search adds importance to the problem of analyzing subjective data.
In the light of the above discussion rises another interesting question: whether the subjective data that exist on the web carry useful information. We believe that they do (albeit, not always). Information can be thought of as data that reduce our uncertainty about some subject. According to this definition, the diversity and pluralism of infor-mation on different topics can have a rather negative role. It is well understood, that true knowledge is being described by facts, rather than subjective opinions. However, this diversity in opinions, when analyzed, may deliver new information and contribute to the overall knowledge of a subject matter. This is especially true if the object of our study is the attitudes of people. In this case, opinionative data can be useful in order to uncover the distribution of sentiments across different groups of people or time.
It is now becoming evident that the views expressed on the web can be influen-tial to readers in forming their opinions on some topic (Horrigan, 2008). Similarly, the opinions expressed by users are the important factor taken into consideration by product vendors (Hoffman, 2008) and policy makers (Mullen and Malouf, 2006). There is also evidence that this process has significant economic effects (Antweiler
and Frank, 2004; Archak et al, 2007; Chevalier and Mayzlin, 2006). These arguments are illustrated in the following examples.
– Today we can see a growing number of blogs focused on various aspects of
pol-itics. They cover the entire spectrum of interested parties: from simple citizens expressing their opinions on everyday issues, to politicians using this medium in order to communicate their ideas (as was best exemplified during the last USA elections), and from journalists criticizing the government to the government it-self. It is to the benefit of all the parties mentioned above to follow the opinions that are expressed on a variety of topics, and to be able to identify how these opinions or public sentiment change and evolve across time.
– As another example, imagine a potential buyer of a digital camera, who is not
familiar with the details of this technology. In this case, reading the camera spec-ifications can be an arduous task. In contrast, the opinion of the community that shares the same interests with the buyer, can be very informative. Therefore, a sys-tem that accumulates feedback and opinions originating from multiple sources, effectively aggregates this information, and presents the result to the user, can be both helpful and influential.
In this study, we introduce readers to the problems of Opinion Mining and
Opin-ion AggregatOpin-ion, which have been rapidly developing over the last decade, as well
as with a rather new trend related to these areas, namely, Contradiction Analysis. In the rest of this document, we will use the term Subjectivity Analysis to refer to all the above problems.
The rest of this document is organized as follows. In the Section 2 we provide a general view of subjectivity analysis and outline major problems of this domain. Development, problems, definitions and main trends of this area are described in sections 3 through 5. After that, we analyze and discuss the state of the art in the Section 6. Finally, we conclude in Section 7.
2 Subjectivity Analysis: A General View
Subjectivity Analysis involves various methods and techniques that originate from Information Retrieval (IR), Artificial Intelligence and Natural Language Processing (NLP). This occurs primarily due to the nature of the data being processed (free-form texts) and application requirements (scalability, online operation). Therefore, it shares much of its terminology and problem definitions with these other domains.
The Subjectivity Analysis domain is still in the process of being shaped, and its problems statements touch upon different domains. Being originally mentioned and formulated in different communities, the problems of Opinion Mining and Sentiment
Analysis have slightly different notions. Opinion Mining originates from the Infor-mation Retrieval community, and aims at extracting and further processing users’
opinions about products, movies or other entities. Sentiment Analysis, on the other hand, was initially formulated as the NLP task of retrieval of sentiments expressed
in texts. Nevertheless, these two problems are similar in their essence, and fall under
the scope of Subjectivity Analysis1(Pang and Lee, 2008).
At a first level of approximation, the various Subjectivity Analysis techniques can be described as being composed of the following three steps:
1. identify; 2. classify; 3. aggregate.
These steps also implicitly list the most important problems in Subjectivity Analy-sis. For example, a typical opinion mining process involves the first two steps, and results in producing sentiment values for texts. In opinion aggregation, the third step is involved as well, in order to aggregate these sentiments. Note that even though this aggregation can be considered as a post-processing step, it is no less important than the previous steps. Indeed, the analyst is often times more interested in determining the common features and interesting patterns that emerge through sentiments from many different data sources, rather than in the opinions of particular authors.
In the following paragraphs, we discuss in more detail the literature on the prob-lems of Opinion Mining and Opinion Aggregation. We review the recent develop-ments in these areas, and then present the field of Contradiction Analysis, which has recently started to attract interest.
3 Opinion Mining
Opinion Mining is the problem of identifying the expressed opinion on a particular
subject and evaluating the polarity of this opinion (e.g., whether the expressed opinion is positive or negative). Opinion Mining forms the basis upon which other tasks under the Subjectivity Analysis can be built. It provides an in-depth view of the emotions expressed in text, and enables the further processing of the data, in order to aggregate the opinions, or identify contradicting opinions. Evidently, the quality of the results of Opinion Mining is crucial for the success of all subsequent tasks, making it an important and challenging problem.
3.1 Definitions of Opinion Mining
Usually, a particular information source covers some general topic (e.g., health, poli-tics, etc.) and tends to publish more material about this general topic than others. Yet, within a document, the author may discuss several more specific topics. Being able to identify the topics discussed in a piece of text is vital for the successful analysis of sentiments, because sentiments are attached to specific topics and become their traits.
Definition 1 (Document) Document D is a piece of text in natural language (that can
be of varying sizes; e.g., a web page, a blog post, a comment, or a product review).
1 For the rest of this document, we will use the terms opinion mining and sentiment analysis
Definition 2 (Topic) Topic T is a named entity, event or abstract concept that is
described in a document D.
Examples of topics are product features, famous persons, news events, happenings, or any other concept that may attract our interest. We assume that each document discusses at least one topic, and not all topics discussed in the same document have to be related to each other. What we are interested in is analyzing these topics in connection to any subjective claims that accompany them. Therefore, for each of the topics discussed in a document, we wish to identify the author’s opinion towards it.
Definition 3 (Sentiment) Sentiment S is the author’s attitude, opinion, or emotion
expressed on topic T .
Sentiments are expressed in natural language, but as we will see below, they can in some cases be translated to a numerical or other scale, which facilitates further processing and analysis.
There are a number of differences in meaning between emotions, sentiments and opinions. The most notable one is that opinion is a transitional concept, which always reflects our attitude towards something. On the other hand, sentiments are different from opinions in the way that sentiment reflects our feeling or emotion, not always directed towards something. Yet our emotions may still reflect our attitudes.
Generally speaking, the palette of human emotions is so vast, that it is even hard to select the basic ones. Most of the authors in the NLP domain agree on the clas-sification proposed by Paul Ekman and his colleagues (1982), which mentions six basic emotions: anger, disgust, fear, joy, sadness, surprise. Although this classifica-tion is consistent in itself, it needs to be further extended by antonyms in order to allow capturing positive and negative shifts in opinion. Accordingly, Jianwei Zhang
et. al. (2009) propose to group the basic emotions along four dimensions: Joy⇔
Sad-ness, Acceptance⇔ Disgust, Anticipation ⇔ Surprise, and Fear ⇔ Anger. However,
such a division requires a rather complex processing and analysis of the input data, which is not always feasible. Therefore, the majority of the authors accept a simpler representation of sentiments according to their polarity:
Definition 4 (Sentiment Polarity) The polarity of a sentiment is the point on the
evaluation scale that corresponds to our positive or negative evaluation of the meaning of this sentiment.
Sentiment polarity allows us to use a single dimension (rather than the four dimen-sions mentioned above), thus, simplifying the representation and management of the sentiment information.
3.2 Problems in Opinion Mining
In the problem of Opinion Mining, studies usually follow a workflow consisting of two steps:
1. Identify (topics, opinionative sentences). 2. Classify (sentences, documents).
In the first step, we need to identify the topics mentioned in the input data, and also associate with each topic the corresponding opinionative sentences. During this step, we may also try to distinguish between opinionative and non-opinionative phrases (i.e., perform subjectivity identification). This additional task is useful, because not all phrases that contain sentiment words are, in fact, opinionative. The reverse claim is also true: some of the opinionative phrases do not contain positively- or negatively-charged words. Therefore performing the identification can be an effective addition to the classification step in order to improve precision (Wiebe et al, 2001; Dave et al, 2003; Riloff et al, 2005; Wiebe and Riloff, 2005). Furthermore, retrieval of opinion-ated documents evolved to a separate task with many specific algorithms, like in (Yu and Hatzivassiloglou, 2003; Ku et al, 2006; Zhang et al, 2007; He et al, 2008).
During the second step, the problem of opinion classification is most often a bi-nary classification problem, distinguishing between positive and negative texts. Nev-ertheless, additional classes can also be introduced, in order to make the analysis more robust and increase the quality of results. For example, some of the works include the neutral or irrelevant sentiment category, which means that there is no sentiment. By doing this, we can avoid the subjectivity identification task mentioned above, and have the classifier distinguish between opinionative and non-opinionative phrases. There is evidence that this approach positively affects the precision of the final results (Koppel and Schler, 2006).
In summary, we could argue that Opinion Mining can be viewed as a classification problem, distinguishing between several classes of sentiments (most often, positive,
negative and neutral). This division is applicable to some extent even to the methods
that produce sentiments on a numerical scale, in which case the division becomes just a matter of setting a threshold.
3.3 Development of Opinion Mining
Opinion Mining has been studied for a long time. Yet, the research in this area accel-erated with the introduction of machine learning methods and the use of annotated datasets (Morinaga et al, 2002; Pang et al, 2002; Yi et al, 2003; Dave et al, 2003). Other types of approaches have also been used, like Dictionary, Statistical, and
Se-mantic. Yet, since the early days of opinion mining, Machine Learning has been the
most frequently exploited tool for tackling the relevant problems.
The Machine Learning Approach is a sophisticated solution to the classification problem that can be generally described as a two-step process: 1) learn the model from the corpus of a training data (supervised, unsupervised), and 2) classify the unseen data based on the trained model.
Today’s popularity of the machine learning approach for opinion mining origi-nates from the work ”Thumbs up?” by Pang and Lee (2002). The authors proposed and evaluated three supervised classification methods: Naive Bayes (NB), Maximum Entropy (ME) and Support Vector Machines (SVM). According to their evaluation, SVM showed the best performance, while NB was the least precise out of the three (although the differences were small). Nevertheless, all the algorithms clearly
sur-passed the random choice baseline, exhibiting an average precision around 80%. Dave et al. (2003) further extended the work of Pang and Lee, emphasizing feature selection. They also used Laplacian smoothing for NB, which increased its accuracy to 87% (for a particular dataset). However, the SVM classifier has achieved similar results, performing below NB only when using unigram features.
The sentiment analysis task is very similar to the rating inference task, in which the class labels are scalar ratings, such as 1 to 5 ”stars”, representing the polarity of an opinion. The need to provide a finer resolution of sentiments required multi-class cat-egorization methods, which can be constructed on the basis of binary classification. Although the SVM method has proved its efficiency for binary classification, the new problem demanded more sophisticated solutions. To address this challenge, Pang and Lee (2005) in their study ”Seeing Stars” proposed to use SVM in multi-class
one-versus-all (OVA) and regression (SVR) modes, combining them with metric labeling
so that similar classes are positioned closer on a rating scale. Metric labeling is a special case of a-posteriori optimization of class assignment with respect to the prior one. This class assignment minimizes the sum of distances between labels of adja-cent points, penalized by point similarities. Their results clearly demonstrated that a combination of SVM with other unsupervised classification methods results in bet-ter precision. A subsequent work on support or opposition in the context of political texts (2006) studied further extensions to the SVM capabilities, through modeling relationships and agreement between authors.
The performance of machine learning methods is highly dependent on the quality and quantity of training data, which is scarce compared to the amount of unlabeled data. In the paper titled ”Seeing Stars When There Are Not Many Stars”, Goldberg and Zhu (2006) proposed a semi-supervised learning technique operating on a graph of both labeled and unlabeled data. The authors represent documents with a graph, where vertices correspond to documents, and edges are drawn between similar doc-uments using a distance measure computed directly from document features. These assumptions are similar to metric labeling, except that they are used a-priori, thus, allowing to use even unlabeled data for training. Although their approach had better performance than SVR, the authors mention that it is sensitive to the choice of the similarity measure, and it is not able to benefit from using additional labeled data.
In the studies discussed above, rating inference tasks have been considered at a document level, thus showing an ’average’ precision on heterogenous reviews, which mention multiple aspects of the product with different sentiments expressed on each one. Extending on (Pang and Lee, 2005), Shimada and Endo (2008) proposed to analyze ratings on a product feature-level, naming their work ”Seeing Several Stars”. They have found that SVR, although being less precise than SVM, produces output labels that are closer to the actual ones. This evidence also supports the claim in (Pang and Lee, 2005), which mentions that with the use of a ”gradual” function in SVR ”similar items necessarily receive similar labels”.
Apart from the choice of algorithms and data selection, the performance of ma-chine learning approaches is heavily dependent on feature selection. The most straight-forward (yet, in some cases very effective) way is to encode each feature in the set by its presence or absence in the document. In the case of word features, this would produce a simple binary vector representation of a document. Extending this
rep-resentation, we can use relative frequencies of words’ occurrence instead of binary values. Though, not all words are equally representative and, therefore, useful for subjectivity analysis. Osherenko et al. (2007) demonstrate that it is possible to use just a small set of the most affective words as features, almost without any degrada-tion in the classifier’s performance. Nevertheless, the direct use of sentiment values from such dictionaries has shown little to no increase of precision. Therefore, stud-ies usually use frequencstud-ies of words instead. For example, Devitt and Ahmad (2007) identify sentiment-bearing words in a document by using SentiWordNet, but then use just their frequencies of occurrence for the classification task. This approach is also popular with dictionary methods, which we describe below.
Finally, we should mention that machine learning is used for other problems of opinion mining, like subjectivity identification. Zhang et al. (2007) describe an ap-proach that uses an SVM trained on a set of topic-specific articles obtained from Wikipedia (objective documents) and review sites (subjective documents).
The Dictionary Approach relies on a pre-built dictionary that contains opinion
polarities of words, such as the General Inquirer2, the Dictionary of Affect of
Lan-guage3, the WordNet-Affect4, or the SentiWordNet (Esuli and Sebastiani, 2006) that
is the most popular dictionary today.
Existing works exploit this resource mainly for identification of opinionated words, although some recent studies showed that it is possible to use polarity scores directly, providing a sentiment value on a continuous scale (Fahrni and Klenner, 2008; Tsyt-sarau et al, 2009; Missen and Boughanem, 2009). Polarity of a sentence or document in this case is usually determined by averaging the polarities of individual words. For instance, most of the dictionary methods aggregate the polarity values for a sentence or document, and compute the resulting sentiment using simple rule-based algorithms (Zhu et al, 2009). More sophisticated tools, like the Sentiment Analyzer introduced by Yi et al. (2003), or the Linguistic Approach by Thet et al (2009), extract sentiments precisely for some target topics using advanced methods that exploit domain-specific features, as well as opinion sentence patterns and Part-Of-Speech parsing. The above two approaches lead to better performance, at the expense of complexity.
Nevertheless, the use of dictionaries can also be combined with machine learn-ing methods, as we mention in the previous paragraphs. We note that relylearn-ing on the polarity values assigned by a dictionary is not always feasible, as the dictionary may not be suited for use on particular datasets (e.g., may not include some specific lexi-cons). Furthermore, dictionary methods are usually not able to adapt polarity values to particular contexts. It turns out that words can change their polarity when used in different contexts (Fahrni and Klenner, 2008). Consider the adjectives ”cold” (gener-ally regarded as negative), and ”warm” (regarded as positive). When these adjectives are used in the phrases ”cold wine” and ”warm beer”, their polarities change to posi-tive and negaposi-tive, respecposi-tively.
In contrast, machine learning methods naturally adapt to the corpus they are trained on.
2 http://www.wjh.harvard.edu/siminquirer/ 3 http://www.hdcus.com/
The Statistical Approach aims to overcome the problems mentioned above. For example, Farni and Klenner (2008) propose to derive posterior polarities using the co-occurrence of adjectives in a corpus. In this case, adaptability is achieved through the construction of a corpus-specific dictionary. Regarding the problem of unavailability of some words, the corpus statistics method proposes to overcome it by using a corpus that is large enough. For this purpose, it is possible to use the entire set of indexed documents on the Web as the corpus for the dictionary construction (Turney, 2002).
We can identify the polarity of a word by studying the frequencies with which this word occurs in a large annotated corpus of texts (Leung et al, 2006; Miao et al, 2009). If the word occurs more frequently among positive (negative) texts, then it has a positive (negative) polarity. Equal frequencies indicate neutral words. It is also interesting to mention, that applications working with the chinese language are able to recognize polarity even for unseen words, due to the fact that phonetic characters determine the word’s sense (Ku et al, 2006, 2007). In this case, we need to analyze frequencies of single characters instead of word frequencies. Although being compu-tationally efficient, the basic method requires a large annotated corpus, what becomes a limiting factor.
The more advanced method is based on the observation that similar opinion words frequently appear together in a corpus. Correspondingly, if two words frequently ap-pear together within the same context, they are likely to share the same polarity. Therefore the polarity of an unknown word can be determined by co-occurrence with another word, which invariantly preserves its polarity (an example of such a word is ”good”). Thus, by calculating the relative frequency of co-occurrence, we can esti-mate the polarity for an unknown word. To achieve this, Peter Turney (2002; 2003) proposed to use the Point-wise Mutual Information (PMI) criteria for statistical de-pendence (Church and Hanks, 1989), replacing probability values with frequencies:
PMI(x,y) = log2F(x near y)
F(x)F(y) (1) PMI-IR=p∈pWords
∑
PMI(x,p) −n∈nWords∑
PMI(x,n) (2)Sentiment polarity (expressed by PMI-IR) for word x is then calculated as the dif-ference between PMI values computed against two opposing lists of words: positive words, pWords, such as ”excellent”, and negative words, nWords, such as ”poor”. Along with the formulas above, Turney et al. proposed to obtain the co-occurrence frequencies F by relying on the statistics of the AltaVista web search engine. Extend-ing on his work, Chaovalit et al. (2005) used Google’s search engine to determine the co-occurrence of words, increasing the precision. Read et al. (2009) further extended this approach, employing Semantic Spaces and Distributional Similarity as alterna-tive weakly-supervised methods. A detailed study on constructing dictionaries of this kind was made by Taboada et al. (2006), mentioning some problems that occur due to the unavailability of the ”near” modifier or non-persistence of the search engine’s output. On the other hand, search engines allow to retrieve the co-occurrence scores (thus, polarities) not only for words, but also for phrases, what is a good asset.
The use of statistical methods in computing opinion polarity have found an inter-esting development in the work of Ben He et al. (2008), where they propose to use an opinion dictionary along with IR methods in order to retrieve opinionated blog
posts. Their approach first builds a dictionary by extracting frequent terms from the entire collection, which are then ranked according to their frequency among opinion-annotated texts. The sentiment polarity of each document is computed as a relevance score to a query composed of the top terms from this dictionary. Finally, the opinion relevance score is combined with the topic relevance score, providing a ranking of opinionated documents on that topic.
The Semantic Approach provides sentiment values directly (like the Statistical Approach), except that it relies on different principles for computing the similarity
between words. For example, WordNet5provides different kinds of semantic
rela-tionships between words, which can be exploited when calculating sentiment polari-ties.
Kamps et. al. (2004) proposed to use the relative shortest path distance of the ”synonym” relation, demonstrating a good degree of agreement (70%) with an an-notated dictionary. Another popular way of using WordNet is to obtain a list of sen-timent words by iteratively expanding the initial set with synonyms and antonyms (Kim and Hovy, 2004; Hu and Liu, 2004a). The sentiment polarity for an unknown word is determined by the relative count of positive and negative synonyms of this word (Kim and Hovy, 2004). Otherwise, unknown words may also be discarded (Hu and Liu, 2004a). However, it is important to know that since the synonym’s relevance decreases with the length of the path, so should the polarity value, too. Additionally, the polarity of a word is often averaged over all possible paths to it. Though, as was pointed out by Godbole et al. (2007), we should only consider paths that reach the synonym without alternating the polarity at any step.
4 Opinion Aggregation
The analysis of opinions at a large scale is impractical without automatic aggregation and summarization. In this case, we are interested in identifying opinions at a higher levels than that of an individual; we would like to know the general or average opinion of a group of people, or the evolution over time of the prevalent opinion about some topic.
What distinguishes Opinion Aggregation from other tasks, is the necessity to provide summaries along several features, aggregated over one or more dimensions. Therefore feature extraction and aggregation appear as the key problems there, and we are going to concentrate our attention on these tasks.
For example, the problem of mining product reviews has attracted particular at-tention in the research community (Morinaga et al, 2002; Dave et al, 2003; Liu et al, 2005; Carenini et al, 2005). This problem imposes certain challenges related to the extraction of representative features and the calculation of the average sentiment or rating. The final goal though, is to determine the overall opinion of the community on some specific product, rather than the individual user opinions on the same product.
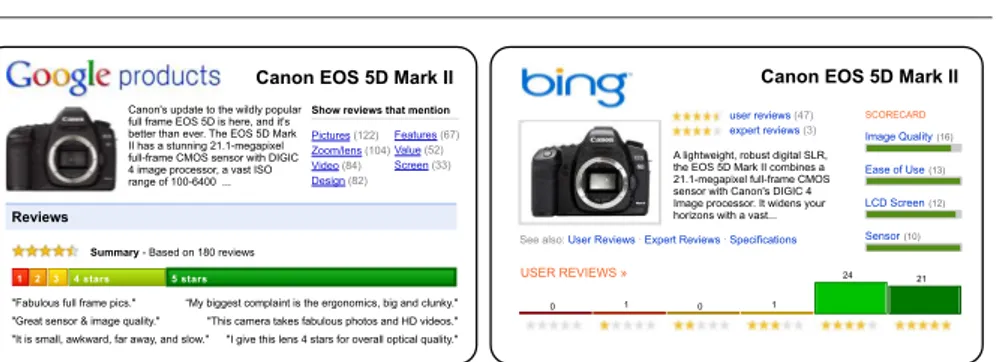
Today we can already see working examples of opinion aggregation almost at ev-ery web site that visualizes collaborative ratings assigned by a community of users.
Fig. 1: An example of Google and Bing review aggregations (actual images and text were arranged for better representation).
In Figure 1, we depict two examples of opinion aggregation, from Google and Bing. Both of them feature images, short descriptions, and aggregate ratings. Additionally, they include statistics for each rating category (number of ”stars”). Overall, these two approaches show very similar details on the featured product, except that Google offers a representative summary (sentences at the bottom), while Bing displays ag-gregated ratings for each product feature (on the right).
4.1 Problems in Opinion Aggregation
Review mining is the main application domain for opinion aggregation. So the prob-lems that have been studied in relation to opinion aggregation are mainly formulated around the aggregation of product reviews. Multiple architectures have been proposed to tackle this problem. Though, the most popular ones follow the steps outlined be-low:
1. Identify (features/topics and opinions). 2. Classify (relevant features, opinions). 3. Aggregate (opinions per feature).
We depict a more detailed representation of the review mining process in Fig-ure 2. The process starts with the identification of opinionative phrases, which may additionally involve a collection of phrase patterns. Identified phrases are then passed on to the feature extraction step, which may exploit a product taxonomy database (Carenini et al, 2005) in order to improve its results. Features and opinionative phrases are used in the sentiment classification step, which outputs sentiment polarities to ag-gregate over frequent features at the opinion aggregation step. This process can be iterative, when the identified features are used to improve the extraction of phrases.
Although opinion aggregation is a separate task having its own problems, practi-cal applications also involve information retrieval and sentiment analysis techniques during the data pre-processing. Thus, the opinion aggregation techniques have been developing in close connection to other methods, and were subsequently revisited when improved sentiment analysis and feature extraction methods were introduced.
Fig. 2: An example architecture of product review aggregation.
4.2 Development of Opinion Aggregation
A typical method for opinion aggregation was proposed by Hu et al. (2004a). They describe a system that aims at discovering words, phrases, and sentiments that best characterize some product. At a high level, their solution follows the steps we listed in the previous section. Though, this pattern is not unique. For example, Morinaga et al. (2002) reversed the ordering of steps 1 and 2, and the experiments revealed that their system achieves a similar performance. By running opinion classification prior to identification of features, we effectively apply some kind of filtering on features: we remove those that were not mentioned in an opinionative phrase (these are features that are irrelevant for the analysis).
Different approaches to feature extraction have been proposed. Hu et al. (2004b) identify features by building a list of noun-noun phrases using an NLP parser, and then determining the most frequent ones. However, their approach outputs many irrel-evant words and should be used in conjunction with other methods, as was suggested by Carenini et al. (2005). Accordingly, they introduce a domain taxonomy in the form of user-defined features, which are used to annotate data for training a feature clas-sifier. Opinions are then collected and aggregated based on the full set of features, which consists of features extracted automatically (unsupervised learning) and also through the classifier (supervised learning). Alternatively, Ku et. al. (2006) proposed a system that identifies features by using information retrieval methods. They use TF-IDF scores per paragraph and per document, and a dictionary to determine polarity. The intuition here is that relevant features appear frequently in few of the paragraphs of many documents, or in many of the paragraphs of few documents. This technique is also efficient for eliminating the irrelevant features described above.
Aggregation of opinions has been traditionally performed over all the documents in some collection. Miao et. al. (2009) used a time-decaying aggregation, retrieving only the most recent reviews that were marked by users as helpful. Jianwei Zhang et. al. (2009) introduced a novel approach, that interactively aggregates and displays sentiments based on different granularities of time and space (geographical location). Moreover, the sentiments are represented by several dimensions, making it the most
Fig. 3: An example of geographical sentiment aggregation (Zhang et al, 2009).
robust Web-scale application we observed so far. An example of such an aggregation is shown in Figure 3. In this figure, we can see a map that depicts the time evolution of detailed sentiments of news articles, aggregated over different geographical regions. This system automatically retrieves and displays sentiments around some particular time period for ad-hoc queries, aggregating them over different locations as the user navigates the map, or zooms in and out.
For an extensive survey of the area of opinion aggregation, the interested reader should refer to the work by Tang et al. (2009).
5 Contradiction Analysis
By analyzing a community’s varying opinions on some topic, we understand how people in general regard it. However, people do not always share the same opinions on different topics. Therefore, opinion aggregation may produce a lossy summarization of the available opinion data, by ignoring and masking the diversity that inherently exists in data. In order to find the answer to this interesting problem, we have to employ more advanced techniques, as we discuss in the following section.
In several cases, performing simple aggregations on opinions is not enough for satisfying the requirements of modern applications. We may be interested in focusing on the topics for which conflicting opinions have been expressed, in understanding these conflicting opinions, and in analyzing their evolution over time and space. Ev-idently, we need to be able to effectively combine diverse opinions in ad hoc sum-maries, and also to further operate on these summaries in order to support more com-plex queries on the dynamics of the conflicting, or contradicting opinions. An exam-ple of a problem requiring this kind of comexam-plex analytics is Contradiction Analysis, an emerging research area.
5.1 Definitions of Contradiction Analysis
The contradiction analysis area is a relatively new direction of research. As such, there is no established common framework for describing and modeling the rele-vant problems. Though, some recent studies have made the first steps towards this direction. The definitions we include below are inspired by the ones presented by Tsytsarau et al. (2009).
Definition 5 (Contradiction) There is a contradiction on a topic, T , between two
groups of documents, D1,D2⊂ D in a document collection D, where D1
TD
2= /0,
when the information conveyed about T is considerably more different between D1
and D2than within each one of them.
In the above definition, we purposely not specify what it means to have some information on a topic to be very different from another piece of information (on the same topic). This definition captures the essence of contradictions, without trying to impose any of the different interpretations of what might cause a contradiction to arise. For example, if we assume that opinion polarity is the relevant information, then a contradiction would mean that two groups of documents express contrasting opinions on some topic.
When identifying contradictions in a document collection, it is important to also
take into account the time in which these documents were published. Let D1be a
group of documents containing some information on topic T , and all documents in
D1were published within some time interval t1. Assume that t1is followed by time
interval t2, and the documents published in t2, D2, contain a conflicting piece of
information on T . In this case, we have a special type of contradiction, which we
call Asynchronous Contradiction, since D1and D2correspond to two different time
intervals. Following the same line of thought, we say that we have a Synchronous
Contradiction when both D1and D2correspond to a single time interval, t.
An interesting application of contradiction analysis is in supplementing informa-tion retrieval systems, which in most of the cases are fact-centric. Diverse opinions introduce extra noise to such systems, which are intended to provide a solid and unbiased representation of information about different topics (Riloff et al, 2005). Un-derstanding contradicting opinions allows information retrieval systems to deal with opinionative data using special methods, for example by extracting the ground truth from different discussions or representing user support against different conflicting topics.
5.2 Problems in Contradiction Analysis
A typical contradiction analysis application is composed of the three steps listed be-low, that resemble the workflow of opinion aggregation:
1. Topic identification. 2. Opinion classification. 3. Contradiction detection.
The first step can be accomplished using either IR (TF/IDF topic identification), Prob-abilistic Inference (latent Dirichlet allocation), or NLP (linguistic parsing) methods. As both these approaches have weaknesses, we believe there is a need for their com-position. The opinion classification step may rely on NLP, statistical, or machine learning methods. Again, to obtain high performance on various types of data we need to study algorithms that combine ideas and techniques from all three approaches. In the contradiction detection step, the goal is to efficiently combine the information extracted in the previous steps, in order to determine the topics and time intervals in which contradiction occur. In this step, statistical methods can be used, as well as clustering or other unsupervised methods. The contradiction detection step requires efficient data mining methods, that will enable the online identification of contradic-tions, and will have the ability to work on different time resolutions.
5.3 Development of Contradiction Analysis
As with all other subjectivity analysis problems, research on contradiction analysis is under way in different domains. It is interesting to mention that the identification of contradicting claims first appeared in the speech recognition domain. The works by Hillard et al. (2003) and Galley et al. (2004) established it as a problem of recogniz-ing agreement (positive) and disagreement (negative) texts, by lookrecogniz-ing at sentiments and negation. These authors exploited machine learning techniques for classification purposes, combining audio and text features.
Another approach to contradiction detection is to handle it as a textual entail-ment problem. There are two main approaches where contradictions are defined as a form of textual inference (e.g., entailment identification) and analyzed using lin-guistic technologies. Harabagui et al. (2006) present a framework for contradiction analysis that exploits linguistic information (e.g., types of verbs), as well as semantic information, such as negation or antonymy. Further improving the work in this direc-tion, de Marneffe et al. (2008) introduce a classification of contradictions consisting of seven types that are distinguished by the features that contribute to a contradic-tion (e.g., antonymy, negacontradic-tion, numeric mismatches). They define contradiccontradic-tions as a situation where ’two sentences are extremely unlikely to be true when considered to-gether’ . Exploiting the contradiction features developed in this study, supplemented by the sentence alignment tool, they introduced contradiction detection approach to their textual entailment application (Pado et al, 2009).
The works discussed above rely on human-perceivable definitions of contradic-tion that summarize our expectacontradic-tions about which features contribute to a contra-diction. We can identify different types of contradictions. Antonymy are words that have opposite meanings, i.e., ”hot - cold” or ”light - dark”. Antonymy can give rise to a contradiction when people use these words to describe some topic. Negation im-poses a strict and explicit contradiction, e.g., ”I love you - I love you not”. Numeric mismatches form another type of contradictions, which may be caused by erroneous data: ”the solar system has 8 planets - there are 9 planets orbiting the sun”. Opposite sentiments are also a very common source of contradictions: ”I like this book - this reading makes me sick”.
Although the detection of contradictions using linguistic analysis and textual entailment promises more accurate results overall, the current methods do not yet achieve high precision and recall values (Voorhees, 2008; Giampiccolo et al, 2008). For example, Pado et al. report their precision and recall values of contradiction detec-tion at the RTE-4 task 2009) as being 28% and 8%, respectively. Therefore, scientists concentrate their efforts in finding contradictions of only a specific type when deal-ing with large scale web analysis. In particular, they analyze negation and opposite sentiments.
Ennals et al. (2010a; 2010b) describe an approach that detects contradicting claims by checking whether some particular claim entails (i.e., has the same sense as) one of those that are known to be disputed. For this purpose, they have aggregated disputed claims from Snopes.com and Politifact.com into a database. Additionally, they have included disputed claims from the web, by looking for an explicit statement of con-tradiction or negation in text. Although this approach would not reveal all types of contradictions, it can help to identify some obvious cases, which can be further used as seed examples to a bootstrapping algorithm.
The problem of identifying and analyzing contradictions has also been studied in the context of social networks and blogs. Relying on the exploited data mining algorithms, scientists proposed different measures for contradiction. Choudhury et al. (2008) examine how communities in the blogosphere transit between high- and low-entropy states across time, incorporating sentiment extraction. According to their study, entropy grows when diversity in opinions grows. A recent work by Liu et al. (2009) introduces a system that allows to compare contrasting opinions of experi-enced blog users on some topic. Then they aggregate opinions over different aspects of the topic, which improves the quality and informativeness of the search results. Kim and Zhai (2009) also propose a solution to the contrastive opinion summariza-tion problem, that we will describe in more detail in Secsummariza-tion 5.4. However, such systems are intended for the extraction of contradicting opinions for further evalua-tion by the user and, therefore, do not visualize the evoluevalua-tion of the phenomenon over time.
In some cases it is also interesting to examine how the blog entries of a single user change over time. The study in (McArthur, 2008) focuses on the analysis of the sentiments of individual users, and how these change as a function of time. Similar to the approaches we discussed in the previous paragraph, the conflicting opinions are simply identified, but not aggregated. It is up to the user to visually inspect the results and draw some conclusions.
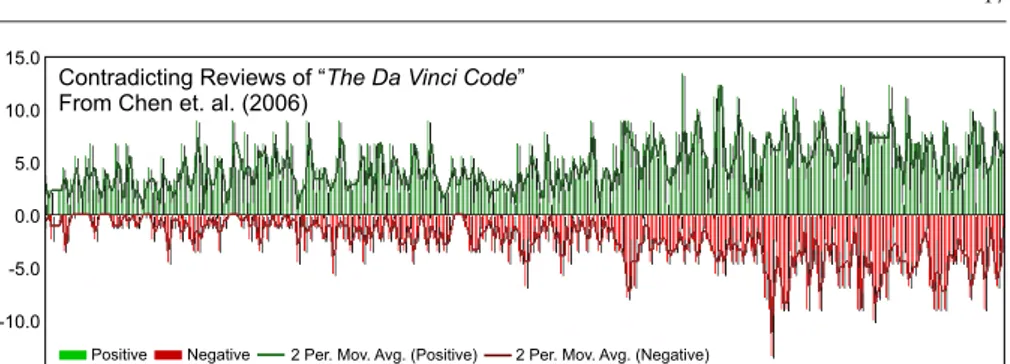
Chen et al. (2006) study the problem of conflicting opinions in a corpus of book reviews, which they classify as positive and negative. The main goal of their work is to identify the most predictive terms for the above classification task, but the results are also used to visualize the conflicting opinions. An example of such visualization taken from their paper can be seen in Figure 4. Such a visualization is composed by the two trends of opposite (positive, negative) opinions, along with their moving averages. The user can determine contradicting regions by visually comparing these trends. However, such an analysis, which is based on manual inspection, becomes inefficient at a large scale.
04-2003 05-2003 06-2003 07-2003 08-2003 09-2003 10-2003 11-2003 12-2003 01-2004 02-2004 03-2004 15.0 10.0 0.0 -10.0 -15.0 -5.0 5.0 Contradicting Reviews of “ ”
From Chen et. al. (2006)
The Da Vinci Code
Positive Negative 2 Per. Mov. Avg. (Positive) 2 Per. Mov. Avg. (Negative)
Fig. 4: Opinion timeline visualization (Chen et al, 2006).
0.0 0.5
1-2006 2-2006 3-2006 4-2006 5-2006 6-2006 7-2006 8-2006 1.0
Contradiction Level Among Blog Posts for the Topic “ ”
From Tsytsarau et. al. (2010)
Internet Government Control
Fig. 5: Contradiction timeline visualization (Tsytsarau et al, 2010).
Tsytsarau et al. (2009; 2010) propose an automatic and scalable solution for the contradiction detection problem. In their work, they study the contradiction problem by focusing on the analysis of sentiments. An example result of such an analysis is represented in Figure 5, where we can see the evolution of the contradiction level for the topic ”internet government control”, covering a time period of about one year. The graph shows the peaks in contradiction for this topic, enabling the analyst to focus on the interesting time points along the time interval under examination.
Contradictions may occur not only on the opinion level, but also on the topic level. For example, Varlamis et al. (2008) propose clustering accuracy as an indicator of the blogosphere topic convergence. Clustering accuracy (when represented by the utility function) measures the relative separation of the cluster centers with respect to cluster sizes and a number of unclustered blogs (noise). When the clustering is very good, this function reaches its maximum value. It is easy to demonstrate, that divergence in topics leads to greater separation of individual blogs in the feature space and, therefore, less reliable clustering. By analyzing how accurate the clustering is in different time intervals, one can estimate how correlated or diverse the blog entries are. We note that this approach is relevant to the contradiction definition we gave earlier, and the type of contradictions it discovers depends on the selection of features.
5.4 Contradiction Analysis Methods
Since the emergence of contradiction analysis, its problems were analyzed under dif-ferent perspectives and on difdif-ferent data. The two methods that more systematically study this problem were proposed by Kim and Zhai (2009) and Tsytsarau et al. (2009; 2010), both trying to provide general definitions and solutions. We further discuss these two studies in the following paragraphs, in order to shed some more light in this new line of research.
The system proposed by Kim and Zhai (2009) allows retrieval and comparison of contradicting opinions based on the measures of representativeness r and
contrastive-ness c, which linear combination is used as a criteria for optimization problem.
r= 1
|X|x
∑
∈Ximax∈[1,k]φ(x,ui) +1
|Y |y
∑
∈Yimax∈[1,k]φ(y,vi), c=1 k k
∑
i=1 ψ(ui,v1) (3)The first measure is based on the weighted sums of maximal content similarities,φ,
among positive, X , and negative, Y , sets of sentences and their corresponding sum-maries, u and v. Representativeness reflects how well the summaries approximate the original text. Contrastiveness captures the similarity between positive and nega-tive sentences in the summaries, but is computed based on the contrasnega-tive similarity
ψ (that is the same as content similarity, except that it is computed without taking
into account sentimental words). The elimination of sentimental words results to im-proved precision.
The above system operates on a set of sentences that is already divided between positive and negative texts. This may reduce the space of finding the optimal solution, since the interesting differences among sentences may not only occur at the sentiment level. It also extracts the same number of positive and negative sentences k, which negatively affects representativeness, because of the different sizes of initial sets of positive and negative texts. Finally, the contrastiveness function is calculated only on
k pairs (first to first, second to second, etc.), instead of the k2possible combinations, which makes the system output dependent on ordering.
Tsytsarau et al. (2009; 2010) demonstrate that with the restriction on the number of possibly contradicting groups to two (positive and negative), contradictions can be detected and analyzed efficiently with simple methods. They propose a novel mea-sure for contradictions, which is based on statistical metrics. This meamea-sure is com-posed of the first- and second-order central moments of sentiments. Furthermore, it is incrementally updatable, which allows the development of algorithms that are com-putationally efficient at answering ad hoc queries on contradiction identification at a large scale.
The intuition behind this contradiction measure is that when the aggregated value for sentiments (on a specific topic and time interval) is close to zero, while the sen-timent diversity is high, then the contradiction should be high. The authors define
the Aggregated SentimentµS as the mean value over all individual sentiments, and
the authors propose the following measure for contradictions: C= ϑ·σ 2 S ϑ+ (µS)2W, µS= 1 n n
∑
i=1 Si, σ 2 S= 1 n n∑
i=1 (Si−µS)2 (4)where n is the cardinality of P, and W is a weight function that takes into account the (varying) number of posts that may be involved in the calculation. Also, there
is a small value added the denominator,ϑ 6= 0, which allows to limit the level of
contradiction C when(µS)2is close to zero. The nominator is multiplied by ϑ to
ensure that contradiction values fall within the interval[0; 1].
The work outlined above aimed at large-scale unsupervised detection of contra-dicting opinions. Another dimension of contradiction analysis is the extraction of contradicting summaries, that can complement to the detection step, providing in-depth overview of the interesting regions, highlighted by the detection.
Finally, we note that the problems and drawbacks we mentioned above only re-flect that the domain is in the process of formulating its problems and shaping its methods, which further advocates the need for a more detailed theoretical study of the contradiction analysis problem.
6 Discussion
6.1 Analysis of Trends
We now discuss some trends that emerge when analyzing the recent publications on opinion mining. We analyze them along different dimensions, on the basis of the employed algorithms, datasets used for testing, and target domains.
In Figure 6, we depict the distribution of papers (using stacked bars) along the most popular types of algorithms and sentiment representations. We observe that the majority of the publications use machine learning methods as the classification tool of choice. Next to them are the dictionary-based methods. Under this category, we also include corpus statistics and semantic approaches. Hybrid methods that combine the above approaches (usually a combination of dictionary methods with NLP tools), are not that popular yet, primarily due to their complexity.
Regarding the representation of sentiments, the alternative approaches are to use a binary representation (i.e., two classes, positive and negative), discrete (i.e., more than two classes; the algorithms we examined used up to six), or continuous (i.e., sentiments represented using scalar values). Most of the approaches in the literature use the binary representation. Though, the other two representations have recently gained in popularity, since they offer finer resolution and level of control. The rela-tively low amount of studies featuring the discrete sentiment representation for hybrid and dictionary methods can be explained by the availability of the continuous senti-ment representation, which offers better precision. These studies use either the binary or the continuous representations, depending on their purpose. On the other hand, the continuous representation is not favored by the classification algorithms, making it a rare choice for the machine learning approaches.
Fig. 6: The number of algorithms (stacked bars) according to sentiment representa-tion, algorithmic approach, and scalability of the method.
The colors in each bar in the graph correspond to the number of algorithms capa-ble of working with large, medium and small scale datasets (green, yellow, and red color, respectively). This is directly related to the complexity of the proposed algo-rithms (e.g., there exist algoalgo-rithms that operate only in a supervised mode, and evi-dently cannot scale with the dataset size). The graph shows that there are mainly two approaches that favor large-scale operation, namely, dictionary methods on contin-uous scale, and machine learning methods with binary and discrete representations. However, their popularity comes from different sources. Dictionary methods have the ability of unsupervised rule-based classification, which is simple and computationally efficient. On the other hand, machine learning methods achieve superior results and domain adaptability by paying the cost of the training phase. Nevertheless, they re-main competitive in terms of computational complexity for the inference task (after the classifier has been constructed).
Figures 7 and 8 show the evolution of the scalability of the approaches proposed in the literature over the last years, as well as the application domains on which these approaches focused. We observe that at the beginning the majority of the studies analyzed review data, mostly at a large scale. As we mentioned above, the machine learning tools were the main contributors to this trend. The use of NLP methods since 2006 opened a new trend of complex review analysis, yet only on the small scale due to the computational complexity involved. At approximately the same time, another interesting pattern emerged, namely, the analysis of news and social media. The current trend shows that social networks and online sources of information are attracting more and more interest in the research community.
In Table 1 we list several of the properties of the papers we used for the above analysis, providing a more detailed view of these papers.
Fig. 7: Evolution of the number of al-gorithms with different scalability levels over the last years.
Fig. 8: Evolution of the number of algo-rithms targeting a particular applications domain over the last years.
6.2 Comparison of Methods
As can be seen in Figure 6, dictionary and machine learning approaches attract most of the attention in the research community. They have been evolving in parallel since the beginning of this decade, and it comes as no surprise that studies have started to compare their performance on different datasets. Below we present the most interest-ing comparisons and briefly discuss their results.
Chaovalit et al. (2005) performed an evaluation between the N-gram classifier and statistical approach methods on a dataset of movie reviews. In particular, their study showed the machine learning precision ranging from 66% (on the unseen data) to 85% (with 3-fold cross-validation), making it comparable to the 77% precision achieved with the unsupervised dictionary method.
Gindl et al. (2008) compared the precision among various dictionary and machine learning methods on web datasets (Amazon, IMDb, and TripAdvisor). The results demonstrated the superiority of the machine learning methods over the dictionary methods on all three datasets. The best results were achieved by the ME method, whose precision was in almost every case greater than 80%.
Another comparison between the most popular types of algorithms for senti-ment extraction was made by Annett and Kondrak (2008), demonstrating that some semantics-based algorithms are able to keep up with machine learning methods in terms of precision, even though they do not require a computationally-demanding learning phase. In particular, a lexical algorithm utilizing WordNet polarity scores achieved a precision close to that of decision trees (60.4% versus 67.4%). Neverthe-less, these algorithms do not substitute, but rather complement each other.
As was demonstrated by Rudy Prabowo and Mike Thelwall (2009), only a combi-nation of different kinds of classifiers is able to achieve a solid performance. In order to build their hybrid approach, they combined several rule-based classifiers with a statistical approach method and an SVM classifier. Doing so, they achieved a perfor-mance, ranging from 83% to 91%, depending on the dataset.
We also point the interested reader to other studies that compare the performance of various Sentiment Analysis algorithms on different datasets (Prabowo and Thel-wall, 2009; Chaovalit and Zhou, 2005; Annett and Kondrak, 2008), and to the book on opinion mining and sentiment analysis written by Bo Pang and Lillian Lee (2008).
Year Authors Type Topic Algorithms Range Scope Datasets Scale
2002 Morinaga et al A Y Dictionary + RB C Reviews (Product) N/A Large
2002 Turney C N Statistics C Reviews Epinions Large
2002 Pang et al C N NB, ME, SVM 2 Reviews (Movie) IMDB Large
2003 Liu et al C N NLP + Dictionary C Texts N/A Small
2003 Turney and Littman C N LSA, Statistics (PMI) C Words GI, HM Small
2003 Dave et al A N NB 2 Reviews (Product) Amazon, Cnet Large
2003 Yi et al C Y Dictionary 3 Reviews (Movie, Product) N/A Large
2003 Yu and Hatzivassiloglou C N Statistics (Other) 3 News TREC Large
2004 Kim and Hovy C Y Semantic 2 Texts DUC 2001 News Small
2004 Galley et al C N ME, CMM 2 Transcripts N/A Small
2004 Hu and Liu A Y Semantic + RB 2 Reviews (Product) Amazon, Cnet Large
2004 Gamon C N SVM 4 Reviews (Feedback) N/A Large
2004 Kamps et al C N Semantic C Texts GI Small
2005 Alm et al C N Linear Classifier 2 Fairytales N/A Small
2005 Ku et al A Y Dictionary 2 News TREC Large
2005 Chaovalit and Zhou C N N-Gram, Statistics (PMI) 2, C Reviews (Movie) IMDB Large
2005 Liu et al A Y Semantic + RB 2 Reviews (Product) N/A Medium
2005 Pang and Lee C N SVM OVA, SVR + ML 3, 4 Reviews (Movie) IMDB Small
2006 Thomas et al C N SVM + Agreement Modelling 2 Political Transcripts GovTrack Small
2006 Leung et al C N Statistics (Other) 3 Reviews (Movie) N/A Small
2006 Taboada et al C N Statistics (PMI) 2 Reviews Epinions Large
2006 Carenini et al A Y Semantic 2 Reviews (Product) N/A Medium
2006 Ku et al A Y Statistics (Other) C News, Blogs TREC, NTCIR Large
2006 Goldberg and Zhu C N Graph, SVR 4 Reviews (Movie) IMDB Large
2006 Taboada et al C N Dictionary C Reviews (Books) N/A Small
2007 Godbole et al C Y Semantic C News, Blogs N/A Large
2007 Osherenko and Andr´e C N SVM + Dictionary 4 Texts SAL Large
2007 Zhang et al C Y SVM 2 Blogs Epinions, Rateitall Small
2007 Devitt and Ahmad C N Semantic 2 News News Low
2007 Mei et al C Y HMM 2 Blogs N/A Large
2007 Ku et al C N Statistics (Other) C News NTCIR Large
2007 Chen et al A N Decision Trees, SVM 2 Reviews (Books) N/A Small
2008 Annett and Kondrak C N SVM, NB, ADTree 2 Reviews (Movie) IMDB Medium
2008 He et al C N Statistics (IR) C Blogs TREC Medium
2008 Bestgen C N Statistics (SO-LSA) 2 Words N/A Large
2008 Fahrni and Klenner C Y Statistics (Other) C Reviews (Restaraunt) N/A Large
2008 Shimada and Endo C Y SVM OVA, ME, SVR 3, 6 Reviews (Product) N/A Large
2009 Zhang et al A Y Corpus C News N/A Large
2009 Miao et al A Y Dictionary 2 Reviews (Product) N/A Medium
2009 Zhu et al A Y Dictionary 3 Reviews (Restaraunt) N/A Medium
2009 Nadeau et al C N LR, NB + Dictionary 4 Dreams N/A Small
2009 Bodendorf C N SVM OVA 3 Social Media N/A Medium
2009 Choi et al C Y Clustering + Dictionary 3 News NTCIR Small
2009 Lin and He C Y LDA + Dictionary Priors 2 Texts IMDB Small
2009 Nowson C Y SVM 2 Reviews (Product) N/A Small
2009 Melville C N NB + Dictionary 2 Blogs N/A Large
2009 Thet et al C Y Dictionary C Reviews (Movie) IMDB Large
2009 Prabowo and Thelwall C N RB, Dictionary, Statistical, SVM 2 Reviews N/A Large
2009 Feng et al A Y Dictionary (SWN) 2 Blogs N/A Large
2009 Lerman et al A N Semantic C Reviews N/A Large
2009 Hare C Y MNB, SVM 2, 3 Blogs Blogs Large
2009 Dasgupta and Ng C N SVM + Spectral Clustering 2 Texts IMDB, Amazon Small
2009 Missen and Boughanem C Y Semantic C Blogs TREC Medium
2009 Read and Carroll C N Statistics (PMI, Semantic Space, Distributional Similarity)
2 Reviews GI, IMDB,
Se-mEval
Large, Small
Table 1: An overview of the most popular sentiment extraction algorithms, used in Subjectivity Analysis. Opinion classification and opinion aggregation types are de-noted by C and A correspondingly. Column ”Topic” lists whether algorithm uses topic-specific features, linguistic parsing, domain knowledge or other techniques that allow topic-dependent analysis. Column ”Range” lists number of the resulting senti-ment categories, or ”C” in the case of continuous range. Column ”Scope” represents target domains for each algorithm, that either explicitly mentioned by the authors, or inferred from training and testing data. Finally, column ”Scale” represents authors’ or our visionary positioning of the algorithm on a basis of its performance, complexity and adaptability.
6.3 Specifics of Web Mining
The evaluations found in Yi et al (2003); Ku et al (2007); Dave et al (2003); An-nett and Kondrak (2008) demonstrate that opinion data obtained from the web, will be represented primarily in discrete or categorical form. This will happen not only because of the use of machine learning tools, but also because ratings and opinion la-bels are represented by a limited number of categories on the Web. Such availability of categorical training data favors the use of machine learning for such tasks as rating inference or review mining, and made machine learning tools the default choice for solving the opinion mining problem. A side effect of the domination of these tools is that the sentiment classification task is mostly considered as a binary- or three-class three-classification problem, distinguishing among positive, negative, or neutral texts. However, it’s not clear that this approach is the winner. On the contrary, recent studies demonstrate the benefits of employing more complex (detailed) sentiment classifica-tions (Tsytsarau et al, 2009; Thet et al, 2009). Moreover, it is not always possible to use supervised machine learning methods. For example, when there is no anno-tated training data (like in blog opinion retrieval), dictionary approaches, that provide sentiment values on a continuous scale, become an interesting alternative.
Most of the works in Subjectivity Analysis assume a set of predefined topics when determining sentiments. These topics are specified either by keywords, or by restrict-ing the collection of documents to only those that mention the chosen topics. In other words, the algorithms imply a single document - single topic assumption. This situa-tion changes, when it is necessary to analyze sentiments expressed in free-form texts (e.g., weblogs), which may involve several topics. To solve this new problem, single
document - several topics, these methods should be extended with topic
identifica-tion algorithms. Stoyanov and Cardie (2008) present an approach for opinion topic extraction that relies on the identification of topic-coreferent opinions. Alternatively, Mei et al. (2007) and Lin et. al. (2009) propose to include sentiment variables into a probabilistic topic inference model.
6.4 Open Problems
The mining and analysis of opinions is a challenging and interdisciplinary task, which requires researchers from different domains to consolidate their efforts. A typical application here requires fast and scalable information retrieval, text preprocessing and topic assignment, in order to run machine learning algorithms supported by the possible use of NLP tools.
We observe that both the performance and resolution of the subjectivity analysis algorithms have increased over time. The first algorithms that were proposed in the literature were effective at discriminating between two or among three classes of sentiments. As we mention in Section 3, switching to several opinion classes required a redesign of the employed machine learning methods (Pang and Lee, 2005), while
continuous sentiment values are only obtainable by using dictionary-based methods. Based on this, we foresee that the increasing demand for the quality of sentiments will require the development of new methods that will inherit strong features from both the machine learning and the dictionary-based methods.
As we are interested in integrating recent developments of opinion mining, we need to develop a universal scale to represent opinions. For the sentiment analysis problem, the choice of the continuous scale in the range [-1;1] seems to be a natural one, as it easily accommodates the discrete opinion categories (-1,0,1), and at the same time provides flexible opportunities for various mappings from the rating scale (e.g., rating stars). However, for conflicting opinions there is no such obvious choice. We need to represent differences in opinions that can not be directly mapped to real values. For example, the pair ”the cat is black - it is a white cat” that features an obvious contradiction, can not be represented using +/-1 as the set containing two colors ”black, white” is not complete - there might also be ”gray” or different other shade colors.
Our review also reveals the need to address the problems of aggregating, manag-ing, and analyzing sentiments in a large scale, and in an ad hoc fashion, much like the analysis opportunities offered by On-Line Analytical Processing (OLAP) in tra-ditional data management. Such methods would only be possible if we will manage to solve sentiment aggregation problems with high efficiency. The latter would also depend on the successful introduction of a common rating scale. In order to make significant advances along the above directions, we need to introduce an appropri-ate framework, and formally define the corresponding problems. Moreover, there is a need for novel techniques that will summarize and analyze the relevant information in a principled and systematic way. We anticipate the introduction of a collaborative framework that will further advance the state of the art and establish brave new tar-gets for the next decade. Contradiction Analysis can possibly be the most demanding field for such a framework, as it utilizes most of the opinion mining methods, and at the same time defines its problems on data of various types, ranging from opposite sentiments to conflicting facts. We believe that it encompasses most of the challenges relevant to Subjectivity Analysis, and can be used as a reference target for the devel-opment of the framework mentioned above.
Finally, we note the lack of benchmarks in this area, which would greatly help its further development. Even though some datasets annotated with sentiments are available (see Table 2), they do not have the required precision and resolution. The problem is even more exacerbated when dealing with the most recent algorithms and applications, such as those relevant to Contradiction Analysis.
As of contradictions between natural language texts, the research in this
direc-tion is supported by the RTE challenge6, which initiated a three-way classification
task in 2008. In addition to the two-way classification between entailment and non-entailment, this task includes detection of contradiction as a part of non-entailment classification.