COMPLICATIONS RISK ASSESSMENT FOR ESOPHAGEAL
STENT POSITIONING
Lorenzo Fuccio
Department of Medical and Surgical Sciences, S. Orsola-Malpighi Hospital, University of Bologna, Bologna, Italy
Michele Scagliarini1
Department of Statistical Sciences, University of Bologna, Bologna, Italy Giorgio Battaglia
Division of Endoscopy, Veneto Oncological Institute (IOV-IRCCS), Padova, Italy
1. Introduction
Esophageal cancer is the eighth most common cancer worldwide (Ferlay et al., 2013). Unfortunately, despite many advances in diagnosis and therapy, the larger amount of patients have inoperable disease at the diagnosis stage. For these per-sons, palliative treatment is required in order to mitigate symptoms (usually dys-phagia) and to re-establish an acceptable quality of life.
Self-Expanding Metal Stent (SEMS) placement is the recommended method for palliation of dysphagia due to esophageal cancer. However, life-threatening com-plications may occur after SEMS placement such as perforation, massive bleeding, aspiration pneumonia (ASGE, 2013; Didden et al., 2012).
The issue concerning the identification of predictors for complication due to self-expanding stents in patients with esophageal cancer has been largely debated without achieving a definite conclusion (Didden et al., 2012; Lecleire et al., 2006; Homs et al., 2004; Iraha et al., 2006; Ross et al., 2007).
This work intends to study and discuss an approach to identify predictor vari-ables for assessing the risk of developing SEMS-related complications. The results, based on a multivariate logistic regression model, allow clinicians to group patients according to the risk of developing complications in such a way to design the most suitable palliative treatments.
The paper is organized as follows: the next section introduces the data; Section 3 contains the estimation of the logistic regression model; Section 4 reports results and discussion; finally, Section 5 contains the concluding remarks.
2. The data
The data set used in the present work has been conveniently extracted from SEMS database of Veneto Oncology Institute (IOV) in Padua (Italy), which serves as tertiary referral center for esophageal diseases. The patients who consecutively underwent SEMS placement for stricture due to esophageal cancer between 2002 and 2011 were identified. Only patients for whom SEMS placement was technically and clinically successful and where follow-up data was available were included. In the 2002− 2011 period a total of 356 patients with dysphagia due to esophageal cancer were treated with SEMS placement with 42 subjects having been excluded since they did not satisfy the inclusion criteria. The remaining 314 patients were included in the study.
The follow-up for each patient starts at the moment of SEMS positioning and the outcome of interest, Y , is the occurrence of a major complication (Y = 1) during the follow-up. A major complication is defined as a complication for which a repeated endoscopic intervention or hospitalization was required.
A summary of the clinical characteristics of our population study is presented in Table21.
3. The model
Logistic regression is well suited for studying the relation between a categorical or qualitative outcome variable and one or more predictors.
Consider a collection of p independent variables denoted by the vector x′ = (x1, x2, ..., xp) and let the conditional probability that the outcome is present be
denoted by π (x) = P r (Y = 1|x).
The multivariate logistic regression model has the general form
π (x) = 1
1 + exp{−g (x)} (1)
where g (x) = β0+ β1x1+ β2x2+ ... + βpxp is the logit of the model, β0 is the intercept and βj (j = 1, 2, ..., p) are the slope parameters.
Since SEMS-related complications may be influenced by several factors we initially fit a multivariate logistic model including all clinically and intuitively relevant covariates.
With the aim of finding the best fitting and most parsimonious clinically inter-pretable model within the constraint of the available data we disclose that: Age and Lesion length, considered as continuous covariates, did not result statistically significant; Lesion site, Karnofsky score , Histology and Cancer stage all consid-ered as polychotomous covariates and included in the model using design variables (three design variables for Lesion site, three design variables for Karnofsky score,
2
In Table 1 Karnofsky score quantifies the functional status of a patient: 100-80 the patient is able to carry on normal activity and to work; 80-60 the patient is unable to work and requires occasional assistance; 60-40 the patient requires considerable assistance and frequent medical care; < 40 the patient is severely disabled and requires hospital care.
TABLE 1
Baseline patients characteristics
Patient characteristics Continuous Variables
(mean± SD; min; max; median)
Categorical Variables n (%)
Age (years) 69.54± 12.05; 32; 93; 70
Length of the follow-up since
SEMS placement (days) 139.99± 124.42; 1; 870; 109.50
Lesion length (cm) 6.09± 2.92; 0; 17; 6
Stent diameter (mm) 17.67± 1.80; 10; 28; 18
Gender
Male 254 (80.9%)
Female 60 (19.1%)
Prior anti-tumoural therapy
Chemotherapy and/or radiotherapy 184 (58.6%)
None 130 (41.4%) Lesion Site Upper esophagus 63 (20.1%) Mid esophagus 111 (35.4%) Lower esophagus 122 (38.9%) Anastomosis 18 (5.7%) Karnofsky score 100− 80 83 (26.4%) 80− 60 103 (32.8%) 60− 40 95 (30.3%) < 40 33 (10.5%) Histology
Squamous cell carcinoma 198 (63.1%)
Adenocarcinoma 116 (36.9%) Cancer stage Ib 2 (0.6%) IIa 4 (1.3%) IIb 24 (7.6%) IIIa 71 (22.6%) IIIb 1 (0.3%) IIIc 42 (13.4%) IV 152 (48.5%) Recurrence 18 (5.7%)
Patients who had a complication
during the follow-up 96 (30.6%)
TABLE 2
Estimation results for the SEMS-related complications model
Predictors Est. Coeff. Std. Err. z-value p-value Est.odds ratio (95%CI) Intercept −1.9230 0.2853 −6.739 < 0.001 P CRT 0.6176 0.2697 2.290 0.0220 1.8545 (1.0932− 3.1461) L FUP 0.0049 0.0011 4.482 < 0.001 1.0049 (1.0027-1.0070)
one design variable for Histology and seven design variable for Cancer stage) did not result statistically significant; all interaction effects did not result statistically significant (Hosmer et al., 2013).
The logistic regression analysis showed that only two covariates are significant in estimating the risk of SEMS-related complications:
1. Prior anti-tumoural treatments -Chemotherapy and/or Radiotherapy- (P CRT : Y ES = 1; N O = 0)
2. Length of the follow-up since SEMS placement (L FUP , in days). The maximum likelihood estimates are shown in Table 2.
Therefore the estimated logit (or risk score) is
bg(x) = −1.9230 + 0.6176 × P CRT + 0.0049 × L F UP (2) 3.1. Model performance assessment
For the evaluation of model performance we consider overall performance, calibra-tion and discriminacalibra-tion.
The generalized likelihood ratio, which assesses the overall significance of the model, is L.R. = 26.87 (p-value< 0.001) and the goodness of fit test (le Cessie and van Houwelingen, 1991) is z = 1.5382 (p-value= 0.1240). Therefore we can conclude that there is no evidence of lack of fit (Harrell, 2001; Agresti, 2002).
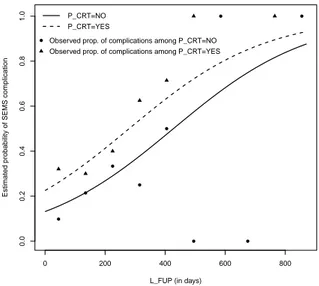
The model calibration, i.e. the agreement between predicted probabilities and observed frequencies of the event of interest, can be assessed by means of Figures 1 and 2. Figure 1 shows the estimated probability curves for subjects who did not receive any prior tumoural treatments and for those who received prior anti-tumoural therapy as a function of the duration of the follow-up. The Figure also shows the observed proportions of subjects who experienced a SEMS-related complication among those who received a prior anti-tumoural therapy (triangles) and who did not receive any therapy (circles) obtained by grouping the data into L F U P intervals (≤ 90], (90, 180], ..., (810, 900]).
Figure 2 shows the validation graph for the estimated model: ”Non-parametric” is a smoothed function of observed events plotted versus predicted probabilities
0 200 400 600 800 0.0 0.2 0.4 0.6 0.8 1.0
L_FUP (in days)
Estimated probability of SEMS complication
P_CRT=NO P_CRT=YES
Observed prop. of complications among P_CRT=NO Observed prop. of complications among P_CRT=YES
Figure 1 – Estimated risk curves and observed proportions stratified for P CRT versus
length of the follow-up.
0.0 0.2 0.4 0.6 0.8 1.0 0.0 0.2 0.4 0.6 0.8 1.0 Predicted risk Obser v ed propor tions Ideal Nonparametric Grouped observations
while ”Ideal” is the ideal 45-degree line and the triangles indicate the outcomes for deciles of prediction.
Examining the results we note an appreciable agreement between predicted probabilities and observed frequencies of the event of interest in particular for values of risk ranging from 0.25 to 0.4.
The model’s ability to discriminate between those subjects who experience the outcome of interest versus those who do not, can be assessed by means of several measures. The concordance statistic, or c-index, is the most commonly used performance measure to indicate the discriminative ability of generalized linear regression models (Royston and Altman, 2010). It is the proportion, among all pairs of patients with different outcomes, in which the event probabilities predicted by the model are in the same order as the actual outcomes. The c-index is thus the probability, across all patients, that a model will be correct in predicting that one patient has a higher probability of the outcome than another patient.
For a binary outcome, the c-index is identical to the AUC: the Area Under the Receiver Operating Characteristic (ROC) Curve.
Usually, the outcome prediction is bY = 1 whenbπ(x) > π0 and bY = 0 when bπ(x) ≤ π0, where π0is the cut-off probability. Let us denote with T P the number of true positives (i.e. bY = 1 when Y = 1 ), T N the true negatives (i.e. bY = 0 when Y = 0 ), F P the false positives ( bY = 1 when Y = 0) and F N the false negatives ( bY = 0 when Y = 1 ). Sensitivity and specificity are defined in terms of T P , T N , F N and F P :
sensitivity = T P
T P + F N (3)
specif icity = T N
T N + F P (4)
The ROC curve plots the sensitivity against one minus specificity for a range of possible cut-off probabilities.
The ROC curve for the fitted model is shown in Figure 3. In our case AUC=0.670 (95%CI: 0.607− 0.733) which indicates that the estimated model has a moderate discrimination ability.
4. Results and discussion
The estimation results show that previous anti-tumoural therapy is significantly associated with SEMS-related complications: the estimated risk of developing a SEMS-related complication increases among those who underwent prior anti-tumoural therapy (P CRT = Y ES, Figure 1) and the odds of developing a com-plication for subjects who did receive prior anti-tumoural treatments is 1.8545 (95%CI: 1.0932− 3.1461) greater than the odds of a complication among subjects who did not receive treatments (Table 2).
As far as the covariate L F U P is concerned, the estimated probability of de-veloping a complication increases as the duration of the follow-up increases. The estimated odds ratio reported in Table 2 is referred to a one-unit (i.e. one day)
0.0 0.2 0.4 0.6 0.8 1.0 0.0 0.2 0.4 0.6 0.8 1.0 1 − specificity sensitivity c−index (AUC) = 0.670
Figure 3 – ROC curve for the fitted logistic regression model.
increment in the predictor. Since a one-day increment is not likely to be clinically interesting we complete the picture by introducing Table 3 which contains the estimated odds ratios for one month (30 days) increments in the covariate.
As an example, for an increase of two months in the duration of the follow-up the odds of developing a complication are estimated to increase 1.34 times (34%). These results, conveniently contextualized in a clinical context can be very helpful.
Let us consider, as an example, a patient who did not undergo prior anti-tumoural therapy: for L F U P = 90 the estimated probability of a SEMS compli-cation is 0.1848 (95% CI: 0.1256−0.2633). In other words, a patient not previously treated with chemo and/or radiotherapy with a supposed life expectancy of three months at the moment of SEMS placement, has an 18.48 percent risk of develop-ing a SEMS related complication. Let us now consider a subject who underwent prior anti-tumoural therapy: for L F U P = 90 the estimated probability of a com-plication is 0.2959 (95%CI: 0.2317− 0.3693). In other words, a patient previously treated with chemo and/or radiotherapy with, a supposed life expectancy of three months at the moment of SEMS placement, has a 29.59 percent risk of developing a complication.
To facilitate the use and the interpretation of our results we provide a nomo-gram and a point scoring system (see the Appendix for details) which allow to compute the probability of developing a SEMS-related complication.
TABLE 3
Estimated odds ratios for SEMS complications for monthly increments in the predictor L FUP
L FUP increments Estimated OR 95% CI
1 month 1.157 1.086-1.234 2 months 1.340 1.179-1.522 3 months 1.550 1.280-1.878 4 months 1.795 1.390-2.318 5 months 2.077 1.509-2.860 6 months 2.404 1.638-3.528 4.1. Cut-off analysis
The discrimination ability of the estimated model is moderate (AUC=0.670). However, our result is similar to other scores used in clinical medicine (Green-land et al., 2004; Steyerberg et al., 2005, 2010). Therefore, even with several cautions, we shall explore the potentialities of a prognostic decision rule based on the estimated model.
The optimal probability cut-point π0for the purposes of classification is usually chosen according several criteria among which we mention:
• a) the criterion based on Youden’s J-statistic (Royston and Altman, 2010) where the optimal cut-off point maximizes the sum of sensitivity and speci-ficity minus 1
J = max(sensitivity + specif icity− 1) (5) • b) the cut-off which minimizes the distance d between the curve and the
upper left corner of the graph, where
d =√(1− sensitivity)2+ (1− specificity)2 (6) • c) the cut-off which maximizes both sensitivity and specificity.
For the fitted model: the probability cut-off that satisfies criteria a) and b) is π0 = 0.3197885 for which J = 0.258505 and d = 0.535553 (sensitivity = 0.552083, specif icity = 0.706422); the cut-off which maximizes both sensitivity and specificity is π0= 0.290114, this ”optimal” choice for the probability cut-point is approximately where the sensitivity and specificity curves cross (sensitivity = 0.614583 and specif icity = 0.614679). These results are summarized in Figure 4 and 5 respectively.
Choosing as cut-off π0 = 0.290114 (sensitivity=specificity) the corresponding value of the risk-score is gπ0(x) =−0.8948. The estimated risk-score (2) equals
the value gπ0(x) =−0.8948 when L F UP = 84.25 for subjects who underwent a
prior therapy and when L F U P = 211 for who did not undergo any therapy. Thus contextualizing these findings in a prognostic framework, a patient with a life expectancy equal or less than 84 days who underwent prior anti-tumoral
0.2 0.4 0.6 0.8 0.0 0.2 0.4 0.6 0.8 1.0 probability cut−off J−inde
x and distance J−index distance
cutoff=0.3197855
Figure 4 – Plot of Youden’s J statistic and d (top-left corner distance) versus all possible
probability cut-off points.
0.2 0.4 0.6 0.8 0.0 0.2 0.4 0.6 0.8 1.0 probability cut−off
sensitivity and specificity
sensitivity specificity
cut−off=0.29011
therapy is classified by the model as bY = 0: a subject that likely will not develop a SEMS complication. A patient who underwent prior anti-tumoral therapy with a life expectancy equal or greater than 85 days is classified by the model as bY = 1: a subject that likely will experience a SEMS-related complication.
Similarly, a person who did not receive any therapy with a life expectancy of less than 211 days is classified as bY = 0: a patient that likely will not have a complication. Finally, a patient who did not receive any therapy with a life expectancy equal or greater than 211 likely will develop a SEMS complication.
Summarizing: patients with a poor prognosis not previously treated with anti-tumoral therapy might benefit from SEMS-placement, since the risk of developing stent-related complications is very low; for patients with good prognosis it is pos-sible to estimate the probability of having a complication and possibly alternative palliative procedures might be considered.
5. Concluding remarks
To sum up the estimated model might provide a useful clinical decision aid. We have identified the two main predictors for the probability of developing SEMS-related complications and discussed their contribution to the risk estimation.
This quantification of the risk could allow clinicians to group patients according to the probability of developing complications in order to design the most suitable and effective palliative treatments for improving the patients quality of life.
Acknowledgements
The authors are grateful to the Editor and the Reviewers for their valuable sug-gestions which helped in improving the paper.
Appendix
A nomogram (Figure 6) is a convenient graphical tool to compute the probability of an outcome of interest. Each predictor variable has a corresponding point value based on its position on the top point scale and contribution to the model. A total score is given to each subject by adding up the points. The probability of developing a SEMS-related complication for each subject can be calculated by the total score from the scale presented on the bottom line. The nomogman has been obtained by using the R ”rms” package (Harrell, 2014; R Core Team, 2013).
For instance, let us consider a patient who did not receive any prior therapy (P CRT = N O) and with a supposed life expectancy of 120 days: this subject has 0 points due to prior therapy and about 14 points due to the length of follow-up (120 days); thus the total points are 14 and the corresponding estimated proba-bility of having a complication is about 21%.
A point scoring system is also provided to readily calculate the risk score and the total point score (Table 4). For example, a patient who did receive prior anti-tumoural therapy (15 points) and with a length of the follow-up equal to 6
Points 0 10 20 30 40 50 60 70 80 90 100 P_CRT NO YES L_FUP (days) 0 60 150 240 330 420 510 600 690 780 870 Total Points 0 10 20 30 40 50 60 70 80 90 100 110 Risk Score −2 −1.5 −1 −0.5 0 0.5 1 1.5 2 2.5
Risk of SEMS compl.
0.1 0.2 0.3 0.4 0.5 0.6 0.7 0.8 0.85 0.91
TABLE 4
Point scoring system for the predictor variables and probability of complication at different total point scores
Predictor variables Points assigned
P CRT NO 0 YES 15 L FUP 1 month 3 2 months 7 3 months 10 4 months 14 5 months 17 6 months 21 7 months 24 8 months 28 9 months 31 10 months 34 11 months 38 12 months 41
Total points score Risk score Risk of SEMS complication %
-6 -2.1972 10 13 -1.3863 20 25 -0.8473 30 36 -0.4055 40 45 0.0000 50 55 0.4055 60 65 0.8473 70 78 1.3863 80 86 2.1972 85 100 2.3763 91.15
months, or 180 days, (21 points), is assigned a total score of 36, which translates into a 40% probability of developing a complication.
References
A. Agresti (2002). Categorical Data Analysis, 2nd edn. Wiley, Hoboken. ASGE, American Society for Gastrointestinal Endoscopy, Standards of Practice
Committee (2013). The role of endoscopy in the assessment and treatment of esophageal cancer. Gastrointestinal Endoscopy, 77,pp.328-334.
P. Didden, M.C. Spaander, E.J. Kuipers, M.J. Bruno (2012). Safety of stent placement in recurrent or persistent esophageal cancer after definitive chemora-diotherapy: a case series. Gastrointestinal Endoscopy,76, pp.426-30.
2012 v1.0, Cancer Incidence and Mortality Worldwide: IARC CancerBase No. 11, International Agency for Research on Cancer, Lyon, France.
P. Greenland, L. LaBree, S.P. Azen, T.M. Doherty, R.C. Detrano (2004). Coronary artery calcium score combined with Framingham score for risk prediction in asymptomatic individuals. Journal of the American Medical Asso-ciation, 291, pp.210-215.
F.E.Jr Harrell (2001). Regression Modeling Strategies: with applications to linear models logistic regression and survival analysis, Springer, New York. F.E.Jr Harrell (2014). rms: Regression Modeling Strategies. R package version
4.1-1. http://CRAN.R-project.org/package=rms.
M.Y. Homs, B.E. Hansen, M. van Blankenstein, J Haringsma, E.J. Kuipers, P.D. Siersema (2004). Prior radiation and/or chemotherapy has no effect on the outcome of metal stent placement for oesophagogastric carcinoma. European Journal of Gastroenterology and Hepatology, 16, pp.163-70.
D.W.Jr Hosmer, S. Lemeshow, R.X. Sturdivant (2013). Applied Logistic Regression 3rd edn. Wiley, Hoboken.
Y. Iraha, S. Murayama, T. Toita, T. Utsunomiya, O. Nagata, T. Akamine, K. Ogawa, G. Adachi, N. Tanigawa (2006). Self-expandable metallic stent placement for patients with inoperable esophageal carcinoma: in-vestigation of the influence of prior radiotherapy and chemotherapy. Radiation Medicine, 24, pp.247-52.
S. le Cessie, J.C. van Houwelingen (1991). A Goodness-of-Fit Test for Binary Regression Models, Based on Smoothing Methods. Biometrics, 47, pp.1267-1282. S. Lecleire, F. Di Fiore, E. Ben-Soussan, M. Antonietti, M.F. Hel-lot, B. PailHel-lot, E. Lerebours, P. Ducrott, P. Michele (2006). Prior chemoradiotherapy is associated with a higher life-threatening complication rate after palliative insertion of metal stents in patients with oesophageal cancer. Alimentary Pharmacology and Therapeutics, 23, pp.1693-1702.
R Core Team (2013). R: A Language and Environment for Statistical Computing, R Foundation for Statistical, Vienna, Austria. URL http://www.R-project.org/. W.A. Ross, F. Alkassab, P.M. Lynch, G.D. Ayers, J. Ajani, J.H. Lee, M. Bismar (2007). Evolving role of self-expanding metal stents in the treatment of malignant dysphagia and fistulas. Gastrointestinal Endoscopy, 65, pp.70-76. R. Royston, D.G. Altman (2010). Visualizing and assessing discrimination in
E.W. Steyerberg, M.Y. Homs, A. Stokvis, M.L. Essink-Bot, P.D. Siersema, SIREC Study Group (2005). Stent placement or brachytherapy for palliation of dysphagia from esophageal cancer: a prognostic model to guide treatment selection. Gastrointestinal Endoscopy, 62, pp.333-40.
E.W. Steyerberg, A.J. Vickers, N.R. Cook, T. Gerds, M. Gonen, N. Obuchowski, M.J. Pencina, M.W. Kattan (2010). Assessing the Perfor-mance of Prediction Models A Framework for Traditional and Novel Measures. Epidemiology, 21, pp.128-138.
W.J. Youden (1950). Index for rating diagnostic tests. Cancer, 3, pp.32-35.
Summary
Self-expanding metal stent positioning is the recommended method for palliation of dysphagia due to esophageal cancer, although it is not free from complications. In this work we identify predictor variables for quantifying the risk of stent-related complications. The results, based on a multivariate logistic regression, would al-low clinicians to stratify patients according to the risk of developing complications in such a way to design the most suitable palliative treatments.
Keywords: Logistic regression; Risk assessment; Esophageal stent; Nomogram, Prognostic rule