POLITECNICO DI MILANO
School of Industrial and Information Engineering
Department of Energy
Energy Engineering
Access to energy in Mozambique: the Maxixe district analysis
Advisor:
Prof. Emanuela COLOMBO
Co-advisor: Prof. Michele UGOLINI
Candidate:
Carlo VIMERCATI
Matr. 786819
Sommario
Il lavoro descrive gli utilizzi energetici della popolazione di una comunità rurale del Mozambico, sita in un’area tale da poter potenzialmente disporre del collegamento a rete elettrica e tale da essere influenzata da relazioni con centri cittadini non troppo distanti. Ho avuto l’opportunità di collaborare con il team del progetto Mo.N.G.U.E. e di partecipare ad una trasferta in Mozambico di una decina di giorni, presso la comunità di Mongue con caratteristiche tipicamente rurali ma collegata in parte alla rete elettrica nazionale e raggiungibile in un’ora da Maxixe (meno di 20km), significativo centro di aggregazione urbana ed economica.
Il mio lavoro in loco è consistito in una indagine, basata su questionario cartaceo, condotta osservando gli utilizzi energetici di un campione di nuclei familiari residenti nell’area di Mongue, aventi caratteristiche perlopiù omogenee ascrivibili alla attività prevalentemente agricola o della pesca, e all’utilizzo delle fonti di energia quasi esclusivamente in ambito domestico. La raccolta dati durante il periodo di permanenza si è svolta in un tempo concentrato tra il 14 ed il 19 febbraio 2017.
Il lavoro di analisi sul campione dei nuclei familiari considerati viene integrato da una descrizione introduttiva del contesto nazionale con riguardo alle fonti energetiche ed ai loro utilizzi (Energy-System-Framework National Level).
La analisi condotta consente di rappresentare un utilizzo di energia elettrica da parte dei nuclei familiari del campione suddiviso tra telefonia, illuminazione, refrigerazione per conservazione alimenti, collegamento radio e TV.
Pur considerando che non tutti i nuclei familiari analizzati dispongono di collegamento diretto delle abitazioni con la rete elettrica, è stato rilevato che la totalità del campione dispone di almeno un telefono cellulare per nucleo familiare ed è in grado di operarne la ricarica elettrica; la quasi totalità del campione utilizza energia elettrica per illuminazione degli ambienti abitativi; solo circa la metà dei nuclei familiari del campione utilizza energia elettrica per la refrigerazione/conservazione degli alimenti, mentre la quasi totalità utilizza la combustione di bio-massa per generare l’energia termica necessaria alla cottura dei cibi; la quasi totalità dei nuclei familiari considerati utilizza energia elettrica per alimentare un dispositivo di collegamento radio e/o TV.
Vale la pena di rilevare il diffuso ricorso a dispositivi di connessione telefonica e dati internet, sia ai fini di comunicazione che di accesso a fonti informative, oltre che per accesso a mezzi di pagamento.
Per quanto riguarda i possibili sviluppi nell’utilizzo di fonti energetiche da parte del campione considerato è verosimile che aumenti il ricorso ad energia elettrica utilizzata per alimentare dispositivi di refrigerazione/conservazione degli alimenti, mentre ad oggi non pare essere percepita dal campione la necessità di variare le attuali modalità di cottura dei cibi (cottura su appoggi di pietra al suolo e fuoco a legna ) con modalità più moderne.
Abstract
The work describes the energy uses of the population of a rural community of Mozambique, located in an area potentially connected to the electricity grid and potentially influenced by relations with city centers not too distant.
I had the opportunity to be involved in the Mo.N.G.U.E. project, and to work on site in the community of Mongue. This area has typical rural characteristics, is connected in part to the national electricity grid, and can be reached in an hour from Maxixe (less than 20km), a significant center of urban and economic aggregation.
In my work I carried out a door to door survey over randomly selected sample of households with the purpose of observing their energy uses. All families reside in the area of Mongue, and have mostly homogeneous socio-economic characteristics referring to the predominantly agricultural or fishing activity, and to the use of energy sources almost exclusively in the domestic environment. The surveys took place during the period of my on-site staying between 14 and 19 February 2017.
The analysis work on the sample of households considered is integrated by an introductory description of the national context with regard to energy sources and their uses (Energy-System-Framework National Level).
The analysis carried out reports the use of electricity by the families of the sample divided between telephony, lighting, refrigeration for food preservation, radio and TV connection. Even considering that not all the households analyzed have direct connection with the electricity grid, it was found that the totality of the sample has at least one cellular telephone per household and is able to operate its electric recharge; almost all of the sample uses electricity for lighting living spaces; only about half of the households uses electricity for refrigeration / food preservation, while almost all households use bio-mass combustion to generate the thermal energy needed to cook food; a large part of the households use electricity to power a radio and / or TV connection device.
It is worth noticing the widespread use of telephone connection devices and internet data, both for communication and access to information sources, as well as for access to payment methods.
As far as possible developments in the use of energy sources by the considered sample, it is likely that the use of electricity for refrigeration / food preservation devices could increase, while today it does not seem to be perceived the need to modify the current cooking methods (cooking on three-stone fire) in more modern ways.
Contents
Sommario iii Abstract v List of Figures ix List of Tables xi 1 Introduction 12 Energy System framework – National level 2
2.1 General overview for the Energy Sector ... 2
2.2 Access to energy ... 2
2.2.1 Quantitative data analysis ... 2
2.2.2 Renewable electricity potential in Mozambique ... 9
3 Energy System framework – Province level (Maxixe) 14 3.1 The Mo.N.G.U.E. Project ... 15
3.2 Local surveys results ... 17
4 Conclusion 28
Appendix 29
AppendixReferences 30
List of Figures
2.1 Mozambique Forest Concessions Map ... 3
2.2 Total Primary Energy Supply ... 4
2.3 TFC per fuel (a) and per sector (b) ... 5
2.4 Energy Production ... 5
2.5 Electricity Production ... 6
2.6 Mozambique’s electricity transmission infrastructure ... 7
2.7 Mozambique Biomass potential atlas ... 9
2.8 Mozambique Solar potential atlas ... 10
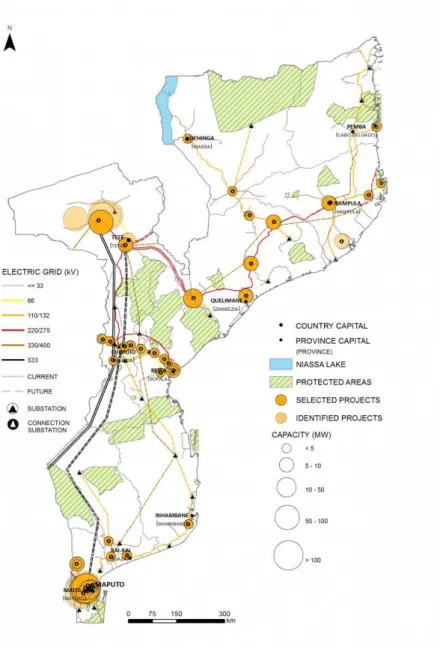
2.9 Identified Solar Projects ... 11
2.10 Mozambique Wind potential atlas ... 12
2.11 Mozambique Hydro potential atlas ... 13
2.12 Potential hydro projects ... 13
3.1 Map of the surveyed area ... 15
3.2 - 3.8 Photos from the surveyed site ... 16
3.9 Employment status ... 20
3.10 Population by Age class ... 20
3.11 Gender of the respondent ... 21
3.12 Back-up options in case of black-out ... 25
3.13 Deforestation awareness ... 25
List of Tables
I Maximum electricity demand in Mozambique’s provinces ... 8
II Household energy sources penetration at District and Province level ... 14
III Population with access to electricity by province ... 14
IV Context and economic data ... 18
V Energy data ... 22
VI Firewood and cooking data ... 26
1
1
Introduction
The work described in these sections has been developed has part of the Polisocial Award 2015-2016 Project Mo.N.G.U.E. (Mozambique.Nature.Growth.University.Education.).
Mo.N.G.U.E. is a multidisciplinary project that has been carried over in the specific area of Mongue, located 20km far the town of Maxixe, in the South-East of Mozambico. Different aspects of the area have been considered in the project, in particular architectural, building restoration and urban concerns, and sustainability and energy sector related ones.
I was involved in the sustainability and energy team and I spent two weeks on February 2017 in Mozambique in Maxixe.
The energy sector in Mozambique is characterized by abundant resources with generally a low level of exploitation and internal use.
My main contribution has been the collection of data obtained from a paper based survey from local households, and their organization for subsequent analysis. The information collected were aimed at obtaining statistics on energetic supplies, such as electricity, firewood, charcoal, kerosene etc. and their use.
This analysis of the basic households needs has been then used in the Energy Planning proposal aiming at guiding and selecting an optimum mix of energy technologies to provide the energy needs (MONGUE REPORT).
The work is divided in two main sections:
• Energy System framework – National level In this section, an analysis of the Mozambique’s energy resources and of energy access has been reported (see MONGUE
REPORT). The analysis presents not only a view of Mozambique’s electricity energy sector
but also an overview of the renewable electricity potential resources.
• Energy System framework – Province level (Maxixe) In the second section the characteristic of the household energy sources and the results of the surveys are shown. In the surveys the socio-economic conditions of the local population and their energy habits are investigated. A sample of the questionnaires is given in the appendix.
2
2
Energy system framework - National level
2.1 General overview for the Energy Sector
The Energy Sector in Mozambique is characterised by abundant resources with generally a low level of exploitation and internal use.
The energy sector is currently fundamental to the country's economy, where energy exports cover a large share of total foreign financial exchanges, and where new energy projects are expected to contribute further in the years to come: more hydropower, further gas exploitation, renewed coal exports, perhaps petroleum. Within the national economy, the key activity is electrification, mainly of urban areas, based on the cheaply available hydropower. A large part of external resources for the energy sector is given to the electricity transmission and distribution rehabilitation and expansion.
The more significant hydropower plant is the Cahora Bassa power station, though almost 90% of the 2,075 MW capacity is exported to South Africa. Considerable natural gas reserves exist, where export to South Africa has recently begun, while domestic use is marginal. Forests provide more than 85% of the primary energy requirements at the national level and more than 95% in rural areas. There are large reserves of coal, for which the Government of Mozambique (GoM) has recently signed an agreement with a Brazilian firm and other companies to re-initiate production and exports. Oil exploration activities are taking place, and while no commercially viable fields have been found yet, the hope is that Mozambique may also become a petroleum producer.
Use of modern energy is key to the economic growth and human development as it is stated in the Mozambique’s Plan for the Reduction of Absolute Poverty (PARPA II and III) (AFRORAD, 2007).
On the other hand, the impact of energy use on the environment in Mozambique makes the promotion of energy efficiency another key element. In this regard, it is highly relevant to promote the efficient use of energy resources, but also to carry out awareness campaigns, mainly with local communities or people living in rural areas, where inefficient energy use is apparent, causing damage to the environment. These activities must be accompanied by a process of harmonisation and coordination among the different government entities in order to merge the various policies and strategies, especially regarding natural resources use.
Almost 54.7 % of the population lives below the poverty line and cannot afford commercial forms of energy to a significant degree. As a matter of facts, according to the International Energy Agency (IEA), 96% of population rely on traditional use of biomass for cooking; within rural communities this accounts for nearly all the energy consumed (MoE, 2013).
Around 67% of population have access to electricity in urban areas, while only 27% in rural areas. Most of these urban centres are connected to the main national electrical grid, which is owned and operated by the Mozambican power utility Electricidade de Moçambique (EdM).
2.2 Access to energy
2.2.1 Quantitative data analysis
Mozambique is a developing country where resources such as coal, titanium, natural gas, hydropower, tantalum, graphite are abundant.
3
Energy situation: outline
The Total electric power generating capacity, almost all provided by hydropower, including the share from Cahora Bassa power plant (the biggest hydropower plant in Mozambique), is greater compared to the total final consumption in the country. However, due to the lack of a well-distributed and efficient transmission lines, the availability of electricity is largely restricted to urban areas. In other areas, electricity is generally not available or it is supplied by diesel generators.
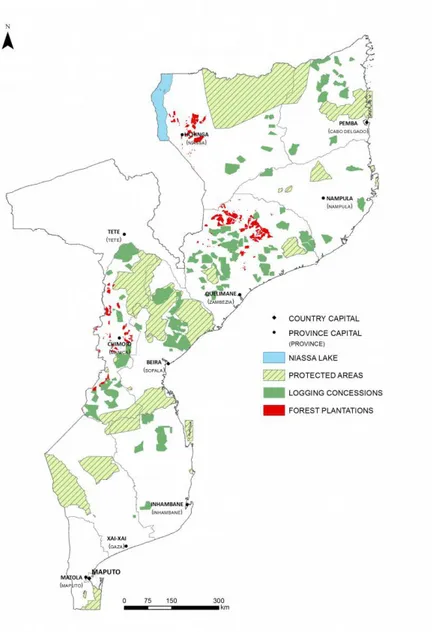
At the household level, the principal energy source for the majority of Mozambicans is biomass, particularly wood: on average, biomass energy accounts for about 80% of the total energy consumed by households and is provided by 30.6 million hectares of forests (see Figure 2.1).
Figure 2.1. Mozambique Forest Concessions Map (Source: ATLAS Renewable Energy Mozambique)
As far as lighting, in most provinces, where electricity is not available, the majority of the population uses kerosene, followed by firewood.
4
massive biomass usage to modern energies such as electricity, gas and modern renewable (mainly solar and wind), but this change probably will not come in a short term.
With regard to natural gas, extraction activities in Mozambique have been developing only in recent years: in 2000 the Government and SASOL Petroleum International signed the first agreement for the extraction of gas in the towns of Pande and Temane. The production, originally planned for 120 MM GJ/year, started in 2004, and in 2010 it grow up to 147 MM GJ/year. However, the 89.6% of the gas produced is exported, and only 11.4% is used in the Mozambican domestic market, mainly in industry and in transport sectors.
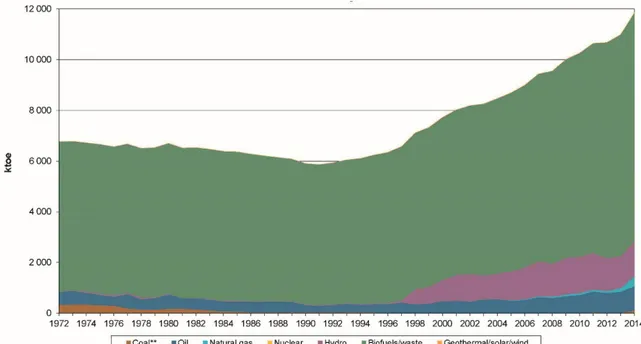
Energy situation: Total Primary Energy Supply
According to the last available data provided by IEA, the amount of Total Primary Energy Supply (TPES) is today a little less 11.6 Mtoe. In Figure 2.2 the trend of TPES is reported in the interval 1972- 2009. Net export of electricity (roughly 300 ktoe) is not included. At the contrary, gas export is included. About 80% of the TPES is covered by the voice “Combustible Renewables and Waste”, which is mostly constituted by traditional and non commercial biomass. Few contribution started to come from oil in the late 1900s, and from gas in the late years. Coal gave its contribution only until the 1980s.
Figure 2.2. Total Primary Energy Supply (IEA Energy Statistics - 2014).
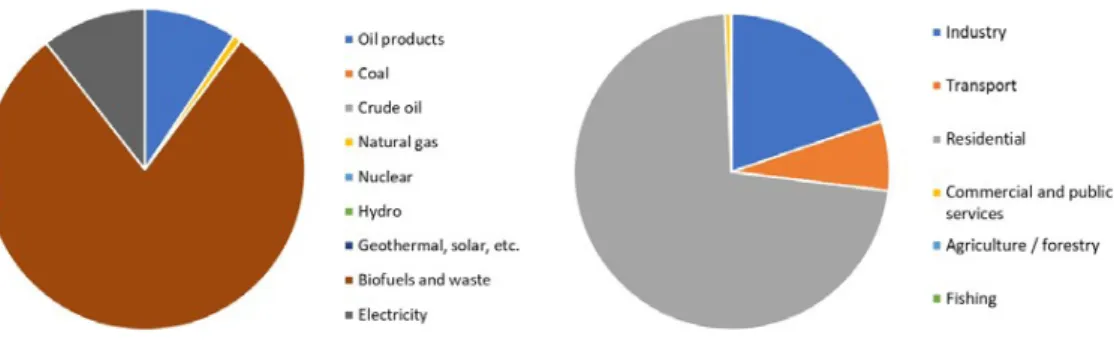
Energy Situation: Total Final Consumption
The Total Final Consumption (TFC) is a little more than 10154 ktoe. In Figure 2.3 (a), the share of TFC per fuel and per sector is reported. Moreover, in Figure 2.3 (b) the share of the TFC is reported per fuel in each sector.
5
Figure 2.3. TFC per fuel (a) and per sector (b) (IEA 2016: 2014 data).
Energy situation: Energy Production
Total Energy Production in Mozambique amounts to about 17989 ktoe, with a consistent contribution coming from hydroelectricity. The most significant hydropower source is the Cahora Bassa power station, but almost all of its 2,075 MW capacity is exported to South Africa.
As previously underlined, gas exploitation in Mozambique started quite recently. The difference between the Figure 2.4 and Figure 2.5 represents, except the electric energy trades, the net export of the country.
6
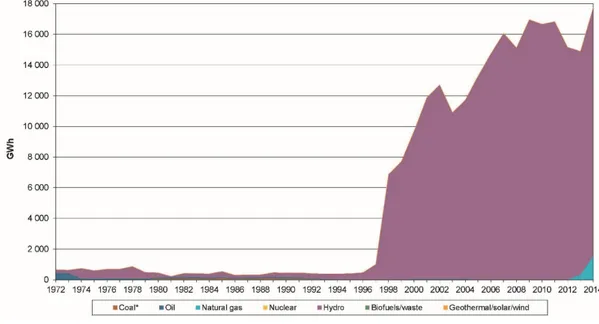
Energy situation: Electric Energy
Electricity production mostly comes from hydropower. Figure 2.5 shows total production in GWh per year.
Figure 2.5. Electricity production (IEA 2016).
The most important power company is Electricidade de Moçambique (EdM), a 100% national company. Due to the large share of electricity provided by the hydro power station at Cahora Bassa, de facto the company is also a large transmission and distribution utility.
7
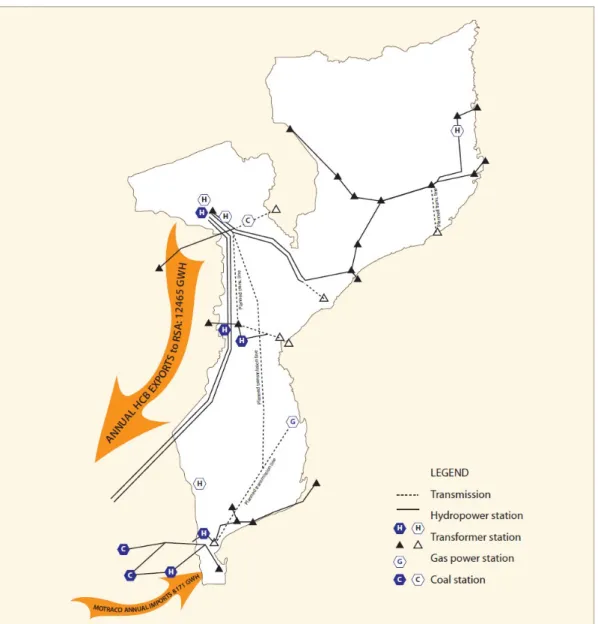
Figure 2.6. Mozambique’s electricity transmission infrastructure (Amado L. ,2009).
Most of the electricity produced in the country is exported to South Africa and Zimbabwe via the Southern African Power Pool (SAPP). Some of the electricity exported is re-imported from SAPP to the southern part of Mozambique, hosting the capital. Import is facilitated by Mozambique Transmission Company (MoTraCo) (SAPP, 2012).
All the provincial capitals and most of the municipal areas are supplied with electricity, and a number of these urban centres are connected to the main national electrical grid, which is owned and operated by EdM (Figure2.6).
8
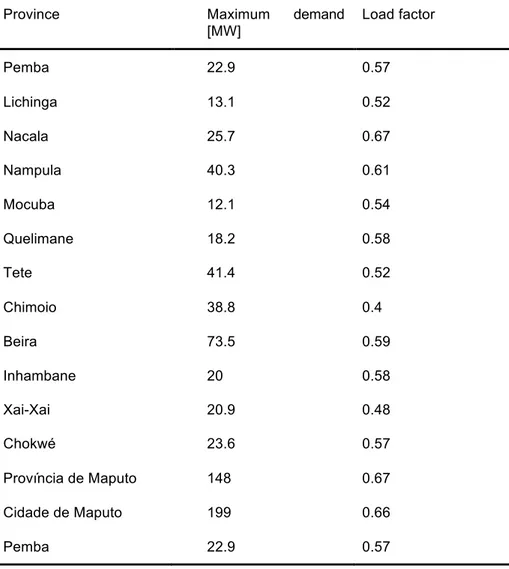
Province Maximum demand
[MW] Load factor Pemba 22.9 0.57 Lichinga 13.1 0.52 Nacala 25.7 0.67 Nampula 40.3 0.61 Mocuba 12.1 0.54 Quelimane 18.2 0.58 Tete 41.4 0.52 Chimoio 38.8 0.4 Beira 73.5 0.59 Inhambane 20 0.58 Xai-Xai 20.9 0.48 Chokwé 23.6 0.57 Província de Maputo 148 0.67 Cidade de Maputo 199 0.66 Pemba 22.9 0.57
Table I. Maximum electricity demand in Mozambique's provinces (EdM, 2013)
Table I gives a detailed idea about electricity access: Mocuba region is characterized by the lowest electricity demand, while Maputo is the most served area.
9
2.2.2
Renewable electricity potential in Mozambique
Biomass
Forest biomass and sugar cane industry are the main energy resources in Mozambique. The biomass electricity generation potential Atlas results from the combination of the aggregated potential from forest biomass in a 50 km radius with the potential for sugar cane plantations within a 20 km radius. The biomass potential is higher in the north of the country mostly due to higher rainfall levels and favourable climate conditions, particularly in the case of forest biomass resource in the Zambézia and Niassa provinces. Regarding sugar production, the largest areas can be found in the Zambezi river delta and in the south in the Limpopo river delta.
10
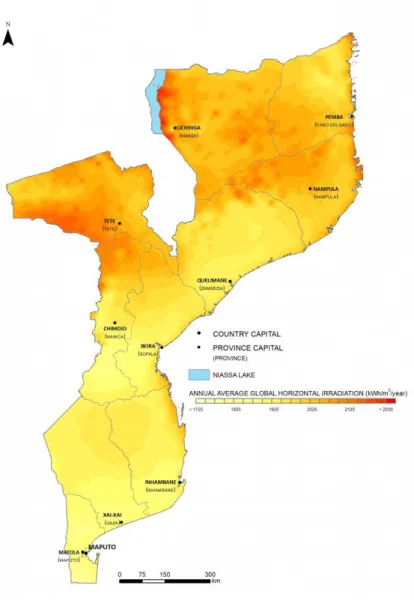
Solar energy
In Mozambique the global horizontal irradiation varies between 1.785 and 2.206 kWh/m2/year. Based on the global irradiation on inclined surface and in the analysis of the terrain slope, forest density and flooded areas, the solar potential of Mozambique is 23 TWp. Given this high resource potential, solar resource in Mozambique offers many possibilities for grid connection and rural electrification projects: totally, it is estimated a potential of more than 2,7 GW, of which 599 MW with potential grid connection.
11
12
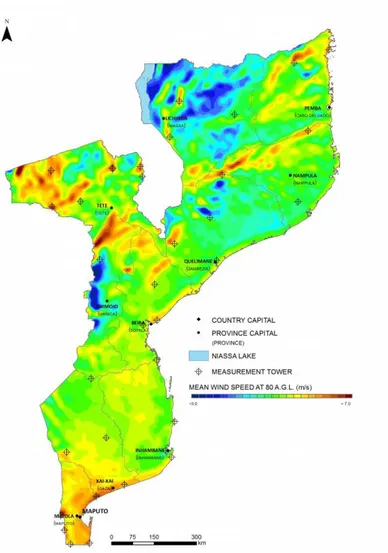
Wind
Mozambique is characterized by winds of moderate-low intensity with average speeds between 4 and 6 m/s at 80 m height, except in the south of the country and in the highlands of the Center and North where winds can reach higher speeds. The highest wind energy potential can be observed in the provinces of Maputo, Tete, and Sofala, Inhambane and Gaza coast. Last national surveys confirm that within 1.100 MW of projects with potential for immediate grid connection, about 230 MW are considered projects with high potential, characterized by having more than 3.000 equivalent hours at rated power. The remaining 3.4 GW of potential wind projects identified present as major constraint to their development the weak Mozambique grid.
13
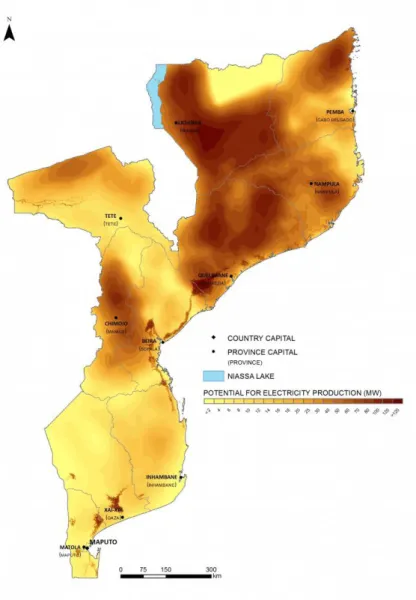
Hydropower
National surveys confirm that a total of 1.446 new hydro projects were then identified with a potential of 18 GW (Figure 2.11). Among these, 5.6 GW with economic potential. Tete province presents the largest potential for hydroelectric projects, followed by Manica and Nampula. From the 5.6 GW of priority projects, about 3 GW are very competitive projects, mainly concentrated in large projects (over 100 MW) on the Zambezi river (Figure 2.12).
Figure 2.11. Mozambique Hydro Potential Atlas (Source ATLAS Renewable Energy of Mozambique)
14 District Province Pop. % Pop. % Electricity 5129 19.9 14269 4.9 Solar panels 96 0.4 2254 0.8 Gas 11 0 129 0
Diesel / Paraffin / Kerosene 19545 76 221220 76
Candle 535 2.1 18103 6.2
Batteries 54 0.2 3358 1.2
Firewood 160 0.6 29021 10
Others 180 0.7 2769 1
3
Energy system framework – Province Level (Maxixe)
Maxixe is the largest city and economic capital of the province of Inhambane. Very little information is available regarding the energy situation in the province. The Instituto Nacional de Estatística, in its Estatísticas do Distrito de Cidade Da Maxixe, reports the penetration of single energy sources among households at the province and district level. The latest information is reported in Table II and refers to 2007 data.
Table II. Household energy sources penetration at District and Province level
Regarding access to electricity, Table III reports the trend from 2005–March 2008 in Inhambane province, showing a positive growth.
Table III. Population with access to electricity by province (%), 2005–March 20081.
2005 2006 2007 March 2008
3.1 4.1 5.5 5.8
According to Cuvilas et al. (2010)1, the province of Inhambane seems offering considerable
oil and gas exploration possibilities. Moreover, together with Sofala, the area of Inhambane is an important provider of firewood for Maputo city, accelerating the process of local natural resources depletion. The Mozambican oil company Petromoc owns a biodiesel plant in the Inhambane Province, with a total capacity of 40 million l/year. Concerning renewable energy, the South African electricity company Eskom has invested in and completed the installation of a wind power system in the southern Mozambican province of Inhambane in August 2009, having the capacity to generate 300 kW of electricity.
1 Cuvilas, Carlos Alberto, Roel Jirjis, and Carlos Lucas. "Energy situation in Mozambique: A review."
15
3.1. The Mo.N.G.U.E. Project
As said in the Introduction, a local survey has been carried over considering households living along the road from Maxixi to Mongue. (In Figure 3.1 shows a map of the surveyed area, in Figure 3.2 the road from Maxixi to Mongue is shown, and in Figure 3.3 typical houses are shown).
The questionnaires were proposed to 31 families, constituting a randomly identified population sample. Data collection - carried out in the period from 14 to 19 February 2017 – took place “directly” by interviewing families door to door with the support of a local interpreter (Figure 3.4). Two main difficulties arose in the process of data collection which limited the number interviewed families: the necessity of an interpreter and the arrival of a cyclone (Figure 3.5: work on electricity grid after the cyclone).
The information collected refer to socio-economic conditions of the local population and their energy habits and were aimed at obtaining statistics on energetic supplies, such as electricity, firewood, charcoal, kerosene etc. and their use. The number of electrical appliances for each family was investigated, as well as the nature of the energy sources used, and the quality of the electricity grid service, if connected. An example of the questionnaires is reported in the Appendix.
In Section 3.2 an analysis of the data obtained is shown.
16
Figure 3.2. The road Maxixe-Mongue Figure 3.3. Typical houses
Figure 3.4. The questionnaire Figure 3.5. After the cyclone
Figure 3.6. Three stones fire Figure 3.7. Lighting source
17
3.2. Local surveys results
18 N° HH Loc a tion HH h e a d 's ge nde r HH h e a d 's ag e Ag e Cl a s s HH s iz e HH h e a d 's ed u cat io n So u rc e o f in c o m e Mo n th ly in c o m e (M Z N /m o n th ) Mo n th ly Ex p en d itu re s (M Z N /m o n th ) 1 Na m a xa xa Fe m a le 42 31 -50 5 Pr im a ry Ag ric u ltu re 300 200 2 Na m a xa xa Ma le 64 51 -100 12 Pr im a ry Ag ric u ltu re 400 350 3 Na m a xa xa Fe m a le 20 16 -30 3 Pr im a ry Ag ric u ltu re 300 300 4 Na m a xa xa Fe m a le 30 31 -50 1 No n e Ag ric u ltu re 300 300 5 Na m a xa xa Fe m a le 60 51 -100 4 No n e Sa la rie d 3000 2000 6 Mo n g u e Ma le 31 31 -50 5 Pr im a ry Sa la rie d 4500 4500 7 Mo n g u e Ma le 31 31 -50 4 Pr im a ry Fi sh in g 2500 2500 8 Na m a xa xa Fe m a le 68 51 -100 3 No n e Ag ric u ltu re 300 300 9 Mo n g u e Fe m a le 35 31 -50 1 Pr im a ry Ag ric u ltu re 350 350 10 Mo n g u e Fe m a le 45 31 -50 1 No n e Ag ric u ltu re 400 400 11 Ch ic u q u e Fe m a le 38 31 -50 3 Pr im a ry Ag ric u ltu re 1000 1000 12 Ch ic u q u e Fe m a le 66 51 -100 6 Pr im a ry Sa la rie d 3000 2500 13 Ch ic u q u e Fe m a le 17 16 -30 7 Se co n d a ry Sa la rie d 3500 3000 14 Ch ic u q u e Fe m a le 41 31 -50 10 Pr im a ry Sa la rie d 4000 3000 Ta bl e IV . C ont e x t a nd e c onom ic da ta .
19 15 Ch ic u q u e Ma le 40 31 -50 6 Se co n d a ry Ag ric u ltu re 700 700 16 Ch ic u q u e Fe m a le 69 51 -100 5 Pr im a ry Ag ric u ltu re 800 800 17 Ma xix e Ma le 38 31 -50 8 Pr im a ry Sa la rie d 3500 3500 18 Ch ic u q u e Ma le 30 31 -50 9 Se co n d a ry Cu ra n d e ro 4500 4000 19 Ch ic u q u e Ma le 52 51 -100 7 Pr im a ry Ag ric u ltu re 600 600 20 Ch ic u q u e Fe m a le 33 31 -50 4 Se co n d a ry Ag ric u ltu re 700 600 21 Ch ic u q u e Fe m a le 31 31 -50 9 Pr im a ry Fi sh in g 2000 2000 22 Ch ic u q u e Fe m a le 30 31 -50 1 Pr im a ry Fi sh in g 2000 1500 23 Ch ic u q u e Fe m a le 29 16 -30 4 Pr im a ry Sa la rie d 2500 2000 24 Ch ic u q u e Fe m a le 42 31 -50 13 Pr im a ry Ag ric u ltu re 400 400 25 Ch ic u q u e Fe m a le 40 31 -50 6 No n e Ag ric u ltu re 400 400 26 Ch ic u q u e Fe m a le 26 16 -30 11 Pr im a ry Ag ric u ltu re 400 400 27 Ch ic u q u e Ma le 21 16 -30 6 Pr im a ry Ag ric u ltu re 1000 1000 28 Ch ic u q u e Ma le 68 51 -100 7 Pr im a ry Ag ric u ltu re 500 500 29 Ch ic u q u e Fe m a le 14 0 -15 5 Se co n d a ry Sa la rie d 3000 3000 30 Ch ic u q u e Fe m a le 41 31 -50 3 Pr im a ry Ag ric u ltu re 350 350 31 Ch ic u q u e Ma le 42 31 -50 7 Pr im a ry Ag ric u ltu re 450 450
20
The area considered is a rural area characterized by a subsistence economy. In Figure 3.9 the employment status of the households is presented. Indeed, only 25% of the households has a member employed with a regular salary.
Agricolture Salaried_employment Fishing Curandero
Figure 3.9. Employment status.
100% 90% 80% 70% 60% 50% 40% 30% 20% 10% 0% 51-100 31-50 16-30 0-15
Figure 3.10. Population by Age Class.
People interviewed are relatively old. The sample is 40.3 years old on average (see Figure 3.10), while the median age value is 39, which is 20 years higher than 17.1, the median value for Mozambique2.
2 CIA Factbook, 2017. https://www.cia.gov/library/publications/the-worldfactbook
1
3
8
21 Male Female
Figure 3.11. Gender of the respondent.
Furthermore (Figure 3.11), a particularly high percentage of females characterizes the sample: 22 individuals interviewed were females.
The most relevant results related to the energy habits are reported in Table V.
9
22 N° HH En e rg y Ex pe ndi tur e s (M Z N /M o n th ) En e rg y Ex p e n d itu re s (a s % o f to ta l exp .) Ra d io ow ner shi p (n ° de v ic e s ) Mo b ile s ow ner shi p (n ° de v ic e s ) TV ow ner shi p (n ° de v ic e s ) La m ps ow ner shi p (n ° de v ic e s ) Fr igo ow ner shi p (n ° de v ic e s ) Is t h e g rid re lia b le ? We e k ly bl ackout s Ba c k u p _ s o u rc e 1 100 50% 1 2 0 2 0 Ye s 3 Ca n d e la 2 200 57% 1 3 0 2 0 No ND Ca r B a tte ry 3 100 33% 1 2 0 2 0 Ye s 2 Ca n d e la 4 150 50% 1 1 0 0 0 No ND Ca r B a tte ry 5 700 35% 1 3 1 1 1 Ye s 3 Pe tró l la m p 6 800 18% 1 2 1 1 1 No ND So la r H o m e Sy ste m 7 400 16% 1 3 1 1 1 No ND So la r H o m e Sy ste m 8 100 33% 2 2 1 3 0 No ND Ca r B a tte ry 9 100 29% 1 1 0 0 0 No ND Ca n d e la 10 150 38% 1 1 0 2 0 No ND Ca r B a tte ry 11 200 20% 1 3 1 4 0 Ye s 3 Pe tró l la m p 12 500 20% 1 6 1 7 1 Ye s 2 Ge n e ra to r Tabl e V . E ner gy dat a
23 13 300 10% 1 3 1 6 1 Ye s 4 Ge n e ra to r 14 600 20% 1 5 1 6 1 Ye s 2 Ge n e ra to r 15 300 43% 1 4 1 3 1 No ND Ca n d e la 16 250 31% 0 1 0 2 0 Ye s 3 Ge n e ra to r 17 600 17% 1 2 1 6 1 Ye s 4 Ca n d e la 18 1000 25% 1 4 2 8 1 Ye s 2 Ge n e ra to r 19 200 33% 1 2 0 1 0 No ND So la r H o m e Sy ste m 20 250 42% 1 2 1 4 0 Ye s 2 Pe tró l la m p 21 250 13% 1 1 0 2 1 Ye s 4 Pe tró l la m p 22 100 7% 1 1 0 1 1 Ye s 4 Pe tró l la m p 23 300 15% 1 1 0 1 1 No ND Ge n e ra to r 24 150 38% 1 3 1 6 0 No ND Ca n d e la 25 100 25% 1 1 0 2 0 No ND Ca n d e la 26 150 38% 1 4 1 2 0 No ND Ca n d e la 27 200 20% 1 3 1 3 1 No ND So la r H o m e Sy ste m 28 200 40% 1 3 1 3 0 No ND Ca n d e la
24 29 400 13% 1 3 1 6 1 Ye s 4 Ge n e ra to r 30 100 29% 1 5 1 4 0 No ND Ca n d e la 31 100 22% 0 4 1 1 0 No ND Pe tró l la m p
25 The results suggest that:
• Energy expenditures represent 28% of the total monthly expenditures, on average; • Every household has at least one mobile phones, while 29 of 31 households
have at least one light bulb and one radio;
• Almost half of the population thinks that the electricity supply from the grid is reliable, while the second half reports 2 black-outs per week at least;
• People use candles as the main back-up options in case of black-out (Figure 3.12).
Candela Car Battery Petról lamp Solar Home System Generator
Figure 3.12. Back-up options in case of black-out.
Table VI reports the most important results concerning the use of firewood and its supply. Every respondent indicates firewood as the main fuel used for cooking and “three-stone fire” has the main cooking device. Half of the population says that is not aware of the problem of the impact of wood gathering on local deforestation, suggesting that there would be the need to implement local awareness campaigns (Figure 3.13).
I don't think so Definitely yes No idea
Figure 3.13. Deforestation awareness.
7 10 4 4 6 5 15 11
26 Tabl e V I. Fi rew ood and cooki ng dat a. N° HH Fi re w ood us e Co o k in g s y s te m In d o o r o r o u td o o r co o ki n g So u rc e o f f ire w o o d Da ily fi re w o o d su p p ly (T im es / D ay) Fi re w ood & def or est at ion 1 Ye s 3_s tones _f ire out side_hous e In _ th e _ w o o d 2 I d o n 't th in k s o 2 Ye s 3_s tones _f ire in sid e _ h o u se In _ th e _ w o o d 2 no idea 3 Ye s 3_s tones _f ire out side_hous e In _ th e _ w o o d 2 no idea 4 Ye s 3_s tones _f ire out side_hous e In _ th e _ w o o d 2 I d o n 't th in k s o 5 No ND ND ND ND De fin ite ly y e s 6 Ye s 3_s tones _f ire in sid e _ h o u se In _ th e _ w o o d 2 I d o n 't th in k s o 7 Ye s 3_s tones _f ire in sid e _ h o u se In _ th e _ w o o d 2 I d o n 't th in k s o 8 Ye s 3_s tones _f ire in sid e _ h o u se in _ th e _ w o o d 2 I d o n 't th in k s o 9 Ye s 3_s tones _f ire in sid e _ h o u se In _ th e _ w o o d 2 I d o n 't th in k s o 10 Ye s 3_s tones _f ire in sid e _ h o u se In _ th e _ w o o d 1 I d o n 't th in k s o 11 Ye s 3_s tones _f ire in sid e _ h o u se In _ th e _ w o o d 2 I d o n 't th in k s o 12 Ye s 3_s tones _f ire out side_hous e In _ th e _ w o o d 2 I d o n 't th in k s o 13 Ye s 3_s tones _f ire in sid e _ h o u se In _ th e _ w o o d 2 no idea 14 Ye s 3_s tones _f ire in sid e _ h o u se In _ th e _ w o o d 2 no idea
27 15 Ye s 3_s tones _f ire in sid e _ h o u se In _ th e _ w o o d 1 no idea 16 Ye s 3_s tones _f ire in sid e _ h o u se In _ th e _ w o o d 2 I d o n 't th in k s o 17 Ye s 3_s tones _f ire in sid e _ h o u se In _ th e _ w o o d 3 I d o n 't th in k s o 18 Ye s 3_s tones _f ire in sid e _ h o u se In _ th e _ w o o d 2 De fin ite ly y e s 19 Ye s 3_s tones _f ire out side_hous e In _ th e _ w o o d 2 De fin ite ly y e s 20 Ye s 3_s tones _f ire in sid e _ h o u se In _ th e _ w o o d 4 De fin ite ly y e s 21 Ye s 3_s tones _f ire out side_hous e In _ th e _ w o o d 1 I d o n 't th in k s o 22 Ye s 3_s tones _f ire out side_hous e in _ th e _ w o o d 1 De fin ite ly y e s 23 Ye s 3_s tones _f ire out side_hous e In _ th e _ w o o d 3 De fin ite ly y e s 24 Ye s 3_s tones _f ire in sid e _ h o u se In _ th e _ w o o d 2 I d o n 't th in k s o 25 Ye s 3_s tones _f ire in sid e _ h o u se In _ th e _ w o o d 2 De fin ite ly y e s 26 Ye s 3_s tones _f ire in sid e _ h o u se In _ th e _ w o o d 3 De fin ite ly y e s 27 Ye s 3_s tones _f ire in sid e _ h o u se In _ th e _ w o o d 2 I d o n 't th in k s o 28 Ye s 3_s tones _f ire in sid e _ h o u se In _ th e _ w o o d 2 De fin ite ly y e s 29 Ye s 3_s tones _f ire in sid e _ h o u se In _ th e _ w o o d 3 De fin ite ly ye s 30 Ye s 3_s tones _f ire in sid e _ h o u se In _ th e _ w o o d 2 I d o n 't th in k s o 31 Ye s 3_s tones _f ire in sid e _ h o u se In _ th e _ w o o d 2 De fin ite ly y e s
28
4
Conclusion
The collection of data and their analysis leads to the following consideration.
The data show that the context in which they were collected is a rural context, characterized mainly by agricultural and fishing activities, which sees over 70% of the population employed. Of the remaining 30% of the working population, around 25% carry out salary-based duties, and 5% perform professional services. The questionnaires were answered by a prevalent number of female individuals - about 70% - most likely associated with domestic activities, compared to male individuals, most likely engaged in agricultural work, and there at the time of the door to door survey.
The presence of at least one mobile phone in each family is particularly significant, regardless of income or composition. This electrical equipment is not only aimed at communication, but also used as a payment method through the exchange of telephone credit.
As far as energy habits are concerned the more significant results are that energy expenditures represent 28% of the total monthly expenditures, on average, 29 out of 31 households have at least one light bulb and one radio. Almost half of the population thinks that the electricity supply from the grid is reliable, while the second half reports 2 black-outs per week at least. And eventually, the main back-up options in case of black-out are candles.
Another significant finding ca be considered the fact that the 48% of the population does not believe that there may be any danger of deforestation, even though wood is the main method for cooking food.
29
Ho
us
eho
ld
N°
Ge n er al in fo rm at io n Da te : … ../. .… /… .… Lo ca tio n: … … … Na me : ... Ag e: …………. Ro le : ………… Ed uc ati on : .. .... .... ... Nr . me mb er s i n y ou r f ami ly : .. .... .... ... 1. Ho w ma ny ro oms a re th er e i n y ou r hous ehol d? .... ... 2. Wh at is th e m ain so ur ce o f i nc om e o f th e hous ehol d? a. Ag ric ul tu re b. Ca ttl e br ee di ng c. Sa la rie d em pl oy m en t d. Se lf em pl oy m en t e. Ot he r …… 3. Ho w mu ch in co me d oe s y ou r h ou se ho ld g et pe r mo nth ?.. .... .... . Pa ym en t 7. Ho w of te n d o y ou p ay y ou r e le ctr ic ity bi ll? a. Da ily b. We ek ly c. Mo nt hl y d. Bi m on th ly e. Th re em on th ly f. Ot he r ( pl ea se sp ec ify ).. .... .... .... .... .… … . 8. Wh ic h i s t he a ve ra ge b ill fo r e le ctr ic ity fo r y ou r a cti vit y o n a mo nth ly ba sis ? ... [l oc al cu rren cy /m on th ] El ec tr ic ity fr om g rid c on n ec tio n s (s ki p th is pa rt if no t co nn ec te d) 9. Is th e qua lit y of e le ctr ic ity se rvi ce the sa m e a ll ye ar ? 4. Ho w mu ch mo ne y d o y ou sp en d p er mo nth ?.. .... .... ... Ho w mu ch o f t his mo ne y d o y ou sp en d f or e ne rg y u se s? … … . El ec tr ic ap p lian ce s us ed 5. Wh ic h t yp e o f e ne rg y s ou rc e d o y ou u se fo r el ect rici ty su pp ly ? a. Lo ca l m in i g rid co nn ect io n b. El ec tri c Ge ne ra to r c. N° R ec ha rg ea bl e b att er y a nd st or ag e d ev ic es (e .g .: c ar ba tte ry) d. N° S ol ar Ho m e Sy ste m e. N° S ol ar L an te rn /li gh tin g sy st em f. Ot he r, sp ec ify ………… 6. Co m ple te th e ta ble b as ed o n th e a pp lia nc es y ou us e: 10. Ho w ma ny o uta ge s/b la ck ou ts oc cu r i n a we ek ? 11. Wh at is th e t ota l d ur ati on o f a ll t he o uta ge s/b la ck ou ts in a we ek ? Wh at is yo ur m ain b ac k-up sour ce of e le ctr ic ity for light ing and appl ia nc es (i nc ludi ng m obi le phone ch ar gin g) d ur in g o utag es/ black ou ts of th e gr id ? 12. Wh at ar e th e mo st ser io us pr obl em s you ex per ien ce wi th your gr id el ect rici ty ? Re co rd u p t o 2 re sp on se s am on g: a. Su pp ly sh or ta ge /n ot e no ug h h ou rs o f el ect rici ty b. Lo w /h ig h v ol ta ge p ro bl em s o r v ol ta ge fl uc tu ati on s c. Un pr ed ic ta bl e in te rru ptio ns d. Un ex pe cte dl y h ig h bi lls e. Hi gh c os t o f el ect rici ty f. Do n ot tr us t t he su pp lie r g. Ca nn ot pow er la rg e ap pl ian ces h. Ma in te na nc e/s er vic e pr obl em s i. Un pr ed ic ta bl e bi lls j. Ot he r, sp ec ify k. No pr obl em s Fi re w oo d us e an d su p p ly 13. Do y ou u se fi re wo od in y ou r h ou se ho ld ? Ye s No (if N o s kip th is sect io n) Ot he r Ot he r Ot he r Ot he r appl ianc e No m in al P owe r [ W ] Nu m b er N° o f hour s of ef fect iv e u se p er day Func tio ni ng wi n d ow (e .g : fro m 6 p m to 10 pm for light s) Mi n im u m ti m e o f ope rat ion eac h ti m e s om eo n e tu rn s i t on in . lig hts ( la m p, bul b) out . li ght s ( la m p, bul b) Ra dio phone /ba tte ry ch ar ger
30
14. Which are the main purposes of using firewood?
a. Cooking
b. Space heating
c. Water heating (hot bath, laundry, etc.) d. Others (specify: ... )
15. Which are the cooking systems used? a. 3 stones fire
b. Saw dust stove
c. Mud stove
d. Improved stove
e. Wood stove
f. other (please specify ... ) 16. Where do you usually cook?
a. inside the house b. outside the house
17. On a daily basis, how many meals do you cook using firewood? …… 18. Where do you take the firewood from?
a. In the wood for free b. by purchasing it
c. other (please specify ... )
19. How is the firewood transported to your household? a. by hands
b. by motorbike c. by car d. by truck
e. other (please specify ... )
20. How often do you provide firewood to your household Once every …
21. How much do you collect? (use the mean of transportation above as unit of measure) ……. 22. Are you aware of the issue of deforestation linked to the use of wood as fuel?
a. Definitely yes b. I don’t think so c. I’ve no idea
Charcoal use and supply
31
24. Which is the main purpose of using charcoal?
a. Cooking
b. Space heating c. Water heating
d. Other (please specify ... )
25. How much charcoal do you make or purchase per week ? ... (kg or volume)
Kerosene use and supply
26. Do you use kerosene in your household? Yes No (if No skip this section) 27. Which is the main purpose of using kerosene?
a. Cooking
b. Water heating
c. Others (please specify ... )
28. How much kerosene do you purchase per week?. ... (litres or kg or volume)
Diesel use and supply
29. Do you use diesel in your household (i.e, for a GenSet or transportation)? Yes No (if No skip this section) 30. Which is the main purpose of using kerosene?
a. GenSet
b. Transportation (car, tractor, truck, ... ) c. Others (please specify ... )
31. How much diesel do you purchase per week?. ... (litres or kg or volume)
Petrol (gasoline) use and supply
32. Do you use gasoline in your household ( i.e, for transportation)? Yes No (if No skip this section) 33. Which is the main purpose of using gasoline?
a. Transportation (car, tractor, truck, …) b. Others (please specify ... )
34. How much petrol do you purchase per week?. ... (litres or kg or volume)
Other comments
……… ………
32
References
AFRODAD (African Forum and Network on Debt and Development) (2007). The Second Generation Poverty Reduction Strategy Papers (PRSPs II) - The Case of Mozambique, AFRODAD, Zimbawe
Amado L. (2009). EdM master plan presentation, Maputo
CIA Factbook (2017). https://www.cia.gov/library/publications/the-worldfactbook
Colombo E., Riva F., Mattarolo L., Barbieri J., Access to energy in Mozambique, Maxixe
district and energy planning for Mongue, Proposal Report , 31 July 2017 (MONGUE REPORT)
Cuvilas, Carlos Alberto, Roel Jirjis, and Carlos Lucas. "Energy situation in Mozambique: A review." Renewable and Sustainable Energy Reviews 14.7 (2010): 2139-2146.
EdM (Electricidade de Moçambique) (2013). Relatorio anual de estatistica
EdM (Electricidade de Moçambique) (2013). www.edm.co.mz
Funae. (2017). ATLAS Renewable Energy Mozambique. http://atlas.funae.co.mz/ GoM (Government of Mozambique) (2009a). Estrategia de Energia, Boletim da Republica, quinta-feira, I serie, Numero 22, 2009
GoM (Government of Mozambique) (2009b). Politica de desenvolvimento de Energias
Novas e renovaveis, Boletim da Republica, I serie, Numero 41
GoM (Government of Mozambique) (2009c). Politica e Estrategia de Biocombustiveis, Boletim da Republica, I serie, Numero 20, 2009
GoM (Government of Mozambique) (2013). Portal do Governo
de Moçambique, www.portaldogoverno.gov.mz/
IEA (Mozambique) (2016)
https://www.iea.org/countries/non-membercountries/mozambique/ INE (Instituto Nacional de Estatística) (2013). Estatísticas do Distrito Cidade de Maxixe.
https://www.iea.org/countries/non-membercountries/mozambique/
Mandelli, Stefano, et al. "Sustainable energy in Africa: A comprehensive data and policies review." Renewable and Sustainable Energy Reviews 37 (2014): 656-686.
Mandelli, Stefano, et al. "Off-grid systems for rural electrification in developing countries: Definitions, classification and a comprehensive literature review."
Renewable and Sustainable Energy Reviews 58 (2016): 1621-1646.
Mandelli, Stefano, Marco Merlo, and Emanuela Colombo. "Novel procedure to formulate load profiles for off- grid rural areas." Energy for Sustainable Development 31 (2016): 130-142.
MoE (Mozambique's Ministry of Energy) (2013). www.me.gov.mz
IRENA (2012). Mozambique – Renewables readiness assessment 2012.