1
ALMA MATER STUDIORUM - UNIVERSITÀ DI BOLOGNA
SCUOLA DI INGEGNERIA E ARCHITETTURA
DIPARTIMENTO DI INGEGNERIA INDUSTRIALE
CORSO DI LAUREA MAGISTRALE IN INGEGNERIA ENERGETICA
TESI DI LAUREA MAGISTRALE
In
Metodi matematici e numerici per l’energetica M
APPLICATION OF PHASE CHANGE MATERIALS FOR HEAT STORAGE
IN WATER TANKS
CANDIDATO: RELATORE:
Edoardo Lippa Prof. Domiziano Mostacci
CORRELATORI: Prof. Matthias Rädle
Frederik Wunder Sebastian Sonnick
Anno accademico 2018/19 Sessione III
3
Abstract
La tesi mira a studiare l'applicazione dei Phase Change Materials (PCM) in un serbatoio d'acqua per aumentare la capacità di accumulo termico negli impianti di riscaldamento degli edifici. La possibilità di utilizzare l'acqua come acqua calda sanitaria è stata esclusa dallo studio, per cui si è ipotizzato di utilizzarla solo per il riscaldamento o il raffreddamento a pavimento. La prima parte della tesi è dedicata ad un'ampia introduzione su tutti i tipi di PCM, sulle loro particolari proprietà, sulle loro applicazioni e in particolare sul loro utilizzo per l'accumulo termico nei serbatoi d'acqua.
I PCM mostrano un'elevata entalpia di fusione con la capacità, in un volume relativamente piccolo, di immagazzinare o rilasciare grandi quantità di energia come calore latente durante la fusione e la solidificazione. Inoltre, i PCM in pratica richiedono che le loro temperature di transizione di fase superiore e inferiore siano all'interno dell'intervallo di temperatura operativa per una data applicazione e posseggano un'elevata conducibilità termica per un efficiente trasferimento di calore con un comportamento di scambio di fase congruente per evitare la separazione irreversibile dei loro costituenti. Durante lo sviluppo dei PCM, sono stati studiati molti gruppi diversi di materiali, tra cui composti inorganici (sale e idrati salini), composti organici come paraffine, acidi grassi e persino materiali polimerici come il PEG. La relazione tra la struttura fondamentale e le proprietà di immagazzinamento dell'energia di questi PCM è stata esaminata negli anni per determinare i meccanismi di accumulazione/emissione di calore con riferimento alle loro caratteristiche finali di immagazzinamento dell'energia.
Il lavoro svolto, oggetto dell’elaborato, ha previsto un'analisi delle diverse modalità di incapsulamento del PCM in contenitori di diverse forme e dimensioni. L'attenzione si è concentrata su una forma parallelepipeda da inserire in un serbatoio rettangolare o cubico.
La ricerca ha richiesto diverse esperienze in laboratorio. La prima esperienza che è stata effettuata ha riguardato la produzione effettiva di un PCM. Successivamente gli altri esperimenti hanno riguardato la misura di alcune
4
proprietà termiche del PCM, come i calori specifici (fase solida e liquida) e il calore latente. In particolare, per queste misurazioni sono stati utilizzati un calorimetro e il metodo T-history, di cui sono forniti anche i riferimenti bibliografici.
Una parte dello studio ha compreso anche l'uso di Matlab per eseguire una simulazione numerica di tipo annuale di un impianto di riscaldamento. Nel capitolo relativo a questa parte computazionale della ricerca, vengono spiegate le relazioni e i metodi utilizzati per calcolare gli scambi e le perdite di calore che si verificano durante il funzionamento dell'impianto. Si è ipotizzato di utilizzare energia elettrica da pannelli fotovoltaici per far funzionare la pompa di calore dell'impianto. Sono quindi stati utilizzati i dati, forniti dal dipartimento CeMOS, relativi alla radiazione solare in Germania a Mannheim. Per quanto riguarda la simulazione della richiesta di energia durante l'anno, sono stati utilizzati i dati di una piccola casa indipendente, anch’essi precedentemente raccolti dal dipartimento CeMOS.
L'ultima parte di questa ricerca ha riguardato la costruzione e la messa in funzione di un sistema sperimentale. È stato costruito un serbatoio d'acqua con 180 “PCMboxes” all'interno e le connessioni di ingresso e di uscita per il flusso d’acqua. Successivamente è stato costruito l'intero sistema di tubazioni, comprese le pompe idrauliche e la pompa di calore. Una volta costruito il sistema, sono state effettuate delle misurazioni per stimare la capacità di accumulo termico del serbatoio.
Alla fine della tesi è presente una conclusione dove vengono spiegate alcune idee su possibili lavori che possono essere svolti in futuro.
Per quanto riguarda la produzione di PCM, cercando possibilmente di evitare le paraffine, in quanto tossiche ed infiammabili, e cercando sempre di utilizzare PCM “salt hydrates” (inerti), si potrebbe tentare di produrne uno con una temperatura di cambiamento di fase di 34-36 °C; mantenere l'acqua a queste temperature per un tempo più lungo sarebbe più adatto per gli impianti di riscaldamento degli edifici.
Le misurazioni delle proprietà termiche del PCM (calore specifico della fase solida e liquida e calore latente) potrebbero essere effettuate utilizzando metodi più precisi e ricalibrando tutte le termocoppie.
5
Per l'incapsulamento del PCM si potrebbe provare a sviluppare forme diverse da quella utilizzata; un'idea potrebbe essere quella di impiegare una forma di un “piece of cake” (settore cilindrico) nel caso si volesse riempire un serbatoio cilindrico. Il tipo di incapsulamento è un costo che deve essere considerato. Se si riesce a trovare un buon tipo di incapsulamento, che riempia bene il serbatoio, che permetta un buon scambio termico e che sia economico, allora questo sarà facilmente commercializzabile.
Per quanto riguarda il sistema sperimentale che è stato costruito, è stato possibile effettuare solo due misure, una per il processo di riscaldamento e una per il processo di raffreddamento; sarebbe certamente più interessante effettuare più misure sui due processi consecutivamente l'una all'altra e alternarle ogni volta che il sistema raggiunge l'equilibrio. Per fare questo sarebbe necessario monitorare non solo la temperatura dell'acqua ma anche la temperatura del PCM all'interno dei boxes; una volta che entrambe le temperature sono uguali e abbondantemente al di sopra (o al di sotto) della temperatura di fusione del PCM allora si dovrebbe avviare il processo di raffreddamento (o riscaldamento).
Una tale misura non solo fornirebbe risultati più accurati in termini di capacità di accumulo termico e di coefficiente di trasferimento di calore, ma fornirebbe anche l'opportunità di vedere come il sistema risponde a diversi cicli consecutivi di riscaldamento e raffreddamento in termini di stabilità del PCM.
6
Index
1. Aim of the study ... 9
2. Introduction on Phase Change Materials [1] ... 11
2.1 Thermal energy storage (TES) methods ... 12
2.1.1 Sensible TES ... 12
2.1.2 Latent TES ... 13
2.2 Classification of PCMs ... 14
2.2.1 Solid–liquid PCMs ... 16
3. Potential PCMs for building applications [2] ... 24
4. Examples of encapsulation [3] ... 26
5. Stored Heat of materials [3] ... 29
5.1 Basics of calorimetry ... 29
5.2 General aspects in doing a measurement ... 33
5.3 Problems in doing measurements on PCM ... 34
6. Use of water-phase change material storage in conventional solar water heating systems [5] ... 38
6.1 Storage performance with controlled heat input ... 41
6.2 Storage performance with closed-loop solar system ... 44
6.3 Storage performance with open-loop solar system ... 46
6.4 Experiments’ Conclusions ... 49
7. PCM production process ... 51
7.1 Temperature Measurements over time and encapsulation ... 55
7.2 Subcooling [3] ... 58
8. Measurements of PCM properties with calorimeter ... 60
8.1 Working method ... 62
8.2 Measurement of the Cp solid ... 63
8.3 Measurement of the Cp liquid ... 65
8.4 Measurement of the latent heat ... 67
8.5 Data evaluation ... 69
9. T-History method [6] ... 73
9.1 Method of calculation: determinations of the heat of fusion, specific heat ... 75
7
9.2.1 First type of PCM measurement ... 79
9.2.2 PCMbags Measurement ... 83
10. Year-round Matlab simulation of the system ... 87
10.1 Solar energy ... 87
10.2 Heat losses ... 88
10.3 COP evaluation ... 90
10.4 Materials properties ... 93
10.5 System Simulation ... 94
10.6 Results of the simulation ... 98
10.7 Parametric study ... 100
11. System construction and its functioning ... 104
11.1 Organization ... 104
11.2 Construction of the tank ... 107
11.2.1 Test of the water inlet... 109
11.3 System set up ... 111
11.4 Functioning and measurements performed ... 116
11.4.1 Heating process ... 116
11.4.2 Cooling process ... 120
11.4.3 Calculation of the coefficient of heat transfer ... 121
8
Nomenclature
PCM phase change material PCMs phase change materials TES thermal energy storage
TESM thermal energy storage material SH sensible heat
LH latent heat
LHTES latent heat thermal energy storage SHS sensible heat storage
SHTES sensible heat thermal energy storage PCMboxes phase change material boxes
PCMbags phase change material bags HP heat pump
9
1. Aim of the study
This thesis aims to study the application of Phase Change Materials in water tanks to increase the capacity of thermal storage in buildings heating plants. The possibility of using water as domestic hot water was excluded from the study, it was assumed to use it only for underfloor heating.
The first part of the thesis is dedicated to a wide introduction on all types of PCMs, their particular properties, their applications and in particular their use for thermal storage in water tanks.
The work involves an analysis of different way of encapsulation of the PCM (phase change material) in containers of different shapes and dimensions. The main focus was on a parallelepiped shape container to be inserted into a rectangular or cubic tank.
The study has also the objective of finding an optimal condition at a thermo-fluid dynamic level in the interaction between the PCM, its encapsulation and the water flow.
For the research in subject study, several experiments were carried out in the CeMOS laboratory. The first experience, that was performed, concerned the production of a well-known PCM. Subsequently the other experiments concerned the measurement of certain thermal properties of PCM, such as specific heats (solid and liquid phase) and latent heat. In particular, a calorimeter and the T-history method were used for these measurements, of which bibliographical references are also provided.
The research has also required the use of the Matlab software in order to perform a year-round numerical simulation of a possible heating plant to be build. In the chapter concerning this computational part of the research, the relations and methods used to calculate the heat exchange and losses that occur during the functioning of the system are explained. It was assumed to use electricity from photovoltaic panels to run the heat pump of the system; The used data were previously recorded by the CeMOS department, concerning solar radiation in Germany, in Mannheim.
10
Regarding the simulation of the energy demand during the year, data of a small detached house were used, previously collected by the CeMOS department.
The last part of this research involved the construction and commissioning of an experimental system. A 180 PCMbags water tank was built with inlet and outlet connections, besides the entire piping system including hydraulic pumps and the heat pump. Once the system was built, measurements were taken to estimate the thermal storage capacity of the tank.
At the end of the thesis there is a brief conclusion where some ideas about possible future work are explained.
11
2. Introduction on Phase Change Materials [1]
Using phase change materials (PCMs) for thermal energy storage (TES) that can be released as sensible heat (SH) and latent heat (LH) became an important aspect for energy management following the 1973–1974 energy crisis. Today, the limited reserves of fossil fuels and concerns over greenhouse gas emissions make the effective utilization of energy a key issue. Using PCMs for TES provides an elegant and realistic solution to increase the efficiency of the storage and use of energy in many domestic and industrial sectors. The application of PCMs for energy storage reduces the mismatch between supply and demand, improves the performance and reliability of energy distribution networks and plays an important general role in conserving energy.
PCMs exhibit a high enthalpy of fusion with the ability, in a relatively small volume, to store or release large amounts of energy as latent heat during melting and solidification. Additionally, practical PCMs require their upper and lower phase transition temperatures to be within the operational temperature range for a given application and possess high thermal conductivity for efficient heat transfer with congruent phase-change behaviour to avoid irreversible separation of their constituents.
During the development of PCMs, many different groups of materials have been studied, including inorganic compounds (salt and salt hydrates), organic compounds such as paraffins, fatty acids and even polymeric materials such as PEG. The relationship between the fundamental structure and the energy storage properties of these PCMs has been critically examined to determine the heat accumulation/emission mechanisms with reference to their ultimate energy storage characteristics.
12
2.1 Thermal energy storage (TES) methods
Thermal energy storage (TES) can be achieved by cooling, heating, melting, solidifying, or vaporizing a material with the energy becoming available as heat when the process is reversed. TES methods are classified as sensible heat thermal energy storage (SHTES) or latent heat thermal energy storage (LHTES). SHTES occurs when a material is driven to increase or decrease its temperature. The effectiveness of the method depends on the specific heat capacity of the material and, if volume is an important consideration, on the material’s density. LHTES depends of a material’s ability to accumulate energy densities at almost isothermal conditions and over a narrow temperature range. Such phase change thermal energy storage systems offer a number of advantages over other systems (e.g. chemical storage systems), particularly the small temperature difference between the storage and retrieval cycles, small unit sizes and low weight per unit of storage capacity. PCMs absorb energy as the phase change occurs during the heating process and then can release this energy during cooling.
2.1.1 Sensible TES
Sensible heat storage (SHS) involves storing thermal energy by raising the temperature of a solid or liquid. The principle is based on the material’s change of heat capacity and temperature during the process of charging and discharging.
The amount of heat stored is a function of the specific heat of the medium, the temperature change and the mass of storage medium – Eq. (1).
𝑄 = ∫ 𝑚 𝑇𝑓 𝑇𝑖
𝐶𝑝𝑑𝑇 = 𝑚𝐶𝑎𝑝(𝑇𝑓− 𝑇𝑖) (1)
where Q – quantity of heat stored (J), Ti – initial temperature (°C), Tf – final temperature (°C), m – mass of heat storage medium (kg), Cp – specific heat (J/kg K), Cap – average specific heat between Ti and Tf (J/ kg K). The storage materials absorb heat by the conventional heat transfer mechanisms of
13
radiation, conduction and convection. As the materials cool at night or on cloudy days, the stored heat is released by the same modes. Active space heating systems commonly use tanks of water or rock bins as TESM.
Water, stored in plastic, fibreglass, or glass-lined steel containers, is the typical thermal SHS medium for solar heating systems – as it absorbs heat, its temperature increases, and the systems become warm to the touch. Water is the best SHS liquid available because of its low cost and high specific heat.
2.1.2 Latent TES
Latent heat storage is a most efficient method of storing thermal energy. Latent heat storage (LHS) relies on the storage material absorbing or releasing heat as it undergoes a solid to solid, solid to liquid or liquid to gas phase change or vice versa. The storage capacity of an LHS system with a PCM is given by: 𝑄 = ∫ 𝑚𝐶𝑝𝑑𝑇 + 𝑚𝑎𝑚Δ𝐻𝑚+ ∫ 𝑚𝐶𝑝𝑑𝑇 𝑇𝑓 𝑇𝑚 𝑇𝑚 𝑇𝑖 (2)
where am – fraction melted, ΔHm – heat of melting per unit mass (J/kg) and Tm – melting temperature.
LHS offers a much higher storage density with a narrower temperature range between storing and releasing heat than SHS. The ideal PCM should meet a number of criteria related to the desired thermophysical, kinetic and chemical properties:
Thermal properties:
• a melting temperature in the desired operating range, • a high phase transition latent heat per unit volume,
• a high specific heat, to provide significant additional SHS, • high thermal conductivity of both phases.
Physical properties:
• a small volume change on phase transformation, • a low vapour pressure at the operating temperature,
14
• favourable phase equilibrium, • congruent melting of the PCM, • a high density.
Kinetic properties: • no supercooling, • a high nucleation rate,
• an adequate rate of crystallization. Chemical properties:
• long-term chemical stability,
• a completely reversible freeze/melt cycle, • compatibility with the construction materials,
• no corrosion influence on the construction materials,
• it should be non-toxic, non-flammable and non-explosive to ensure safety. The PCM should be readily available in large quantities at low cost. In practice, those criteria are not fully met by most PCMs. However, recent progress in the design and characterization of novel materials for energy storage, including nanomaterials, has opened new possibilities for enhanced performance with extended lifetimes.
2.2 Classification of PCMs
Over the last 40 years different classes of materials, including hydrated salts, paraffin waxes, fatty acids, the eutectics of organic and non-organic compounds and polymers have been considered as potential PCMs. PCMs can be divided into three main groups – based on the temperature ranges over which the TES phase transition occurs: (i) low temperature PCMs – with phase transition temperatures below 15 °C, usually used in air conditioning applications and the food industry; (ii) mid temperature PCMs, the most popular – with phase transition temperatures in the range 15–90 °C with solar, medical, textile, electronic and energy-saving applications in building design; (iii) high temperature PCMs with a phase transition above 90 °C developed mainly for industrial and aerospace applications.
15
PCMs can be classified by their mode of phase transition: gas–liquid, solid– gas, solid–liquid and solid–solid systems, see Fig. 1. The applications of PCMs with a solid–gas or liquid–gas phase transition are limited in TES systems because of the large volume changes associated with the transition – even if they possess a high phase transition latent heat. Significantly smaller volume changes occur, usually ca. 10% or less, with solid–solid and solid– liquid transformations. This makes them economically and practically attractive as materials for TES systems despite their smaller heat of phase transition. Solid–solid PCMs employ the heat associated with the phase transition one to another crystalline form and can be considered as an alternative to solid–liquid PCMs. Generally, the heat of phase transition for solid–solid PCMs is lower than that of solid–liquid PCMs. However, employing the former group of materials can avoid the problems of PCM leakage at temperatures above the phase transition temperature, a significant technical problem with solid–liquid PCMs.
16
Only solid-liquid PCMs will be taken into consideration in this thesis because they are the ones that allow to accumulate more energy thanks to a high heat of phase transition.
2.2.1 Solid–liquid PCMs
Many different types of solid–liquid PCMs are employed for thermal storage applications, such as water, salt hydrates, paraffins, selected hydrocarbons, polymers and metal alloys. In the following subsections, the various classes of solid–liquid PCMs will be described.
Inorganic PCMs
The various inorganic substances, eutectics and mixtures for low and high temperature applications that have been considered as potential PCMs are given in Tables 1–3. A number of the thermophysical properties, such as melting point, heat of fusion, thermal conductivity and density, is presented.
Table 1 - Inorganic compounds with potential use as PCMs (adapted from [1])
Compound Melting temperature (°C) Heat of fusion (J/g)
AlCl3 192 280 LiNO3 250 370 NaNO3 307 172 KNO3 333 266 Na2O2 360 314 KOH 380 150 KClO4 527 1253 LiH 699 2678 MgCl2 714 452 NaCl 800 492 Na2CO3 854 276 KF 857 452 LiF 868 932 K2CO3 897 235 NaF 993 750 MgF2 1271 936
17
Salt hydrates. Salt hydrates with the general formula AB∙nH2O, are inorganic salts containing water of crystallization. During phase transformation dehydration of the salt occurs, forming either a salt hydrate that contains fewer water molecules:
ABn·nH2O → AB·mH2O+(n- m)H2O
or the anhydrous form of the salt
AB·nH2O → AB+nH2O.
Table 2 - Salt hydrates with potential use as PCM (adapted from [1])
Compound Melting temperature (°C) Heat of fusion (J/g) Thermal conductivity (W/mK) Density (solid) (103 kg/m3) Liquid Solid LiClO3·3H2O 8 253 KF·4H2O 18.5–19 231 1.45 Mn(NO3)2·6H2O 25.3 125.9 CaCl2·6H2O 28.0–30.0 190–200 0.540 1.088 1.80 LiNO3·3H2O 30 256 Na2SO4·10H2O 34 256 Na2CO3·10H2O 33 247 NaCH3COO·3H2O 55.6–56.5 237–243 CaBr2·6H2O 34 115.5 2.19 Na2HPO4·12H2O 35–45 279.6 0.476 0.514 1.52 Zn(NO3)2·6H2O 36 146.9 0.464 Zn(NO3)2·4H2O 45.5 Zn(NO3)2·2H2O 54 Na2S2O3·5H2O 48–55 201 1.75 Na(CH3COO)·3H2O 58 226 1.45 Cd(NO3)2·4H2O 59.5 Na2B4O7·10H2O 68.1 Na3PO4·12H2O 69.0 Na2P2O7·10H2O 70 184 Ba(OH]2·8H2O 78 266 (NH4)Al(SO4)2·12H2O 95 269 MgCl2·6H2O 117 169 Mg(NO3)2·6H2O 89.3 150
18
Table 3 - Eutectic and non-eutectic mixtures with potential use as PCM (adapted from [1])
Mixture Melting temperature (°C) Heat of fusion (J/g) Density (kg/m 3) Eutectic mixtures 66.6% CaCl2·6H2O + 33.3% MgCl2·6H2O 25 127 50% CaCl2 + 50% MgCl2·6H2O 25 95 48% CaCl2 + 4.3% NaCl + 0.4% KCl + 47.3% H2O 27 188 47% Ca(NO3)2·4H2O + 53% Mg(NO3)2·6H2O 30 136 40% CH3COONa·3H2O + 60% NH2CONH2 30 200.5 50% Na2SO4·10H2O + 50% NaCl 18 61.5% Mg(NO3)2·6H2O + 38.5% NH4NO3 52 125 58.7% Mg(NO3)2·6H2O + 41.3% MgCl2·6H2O 59 132 53% Mg(NO3)2·6H2O + 47% Al(NO3)2·9H2O 61 148 59% Mg(NO3)2·6H2O + 41% MgBr2·6H2O 66 168 14% LiNO3 + 86% Mg(NO3)2·6H2O 72 180 66.6% urea + 33.4% NH4Br 76 161
11.8% NaF + 54.3% KF + 26.6% LiF + 7.3% MgF2 449 2160 (liquid)
35.1% LiF + 38.4% NaF + 26.5% CaF2 615 2225 (liquid)
32.5% LiF + 50.5% NaF + 17.0% MgF2 632 2105 (liquid)
51.8% NaF + 34.0% CaF2 + 14.2% MgF2 645 2370 (liquid)
48.1% LiF + 51.9% NaF 652 1930 (liquid)
63.8% KF + 27.9% NaF + 8.3% MgF2 685 2090 (liquid) 45.8% LiF + 54.2% MgF2 746 2305 (liquid) 53.6% NaF + 28.6% MgF2 + 17.8% KF 809 2110 (liquid) 66.9% NaF + 33.1% MgF2 832 2190 (liquid) Non-eutectic mixtures H2O + polyacrylamide 0 292
50% Na(CH3COO)·3H2O + 50% HCONH2 40 255
Depending on the melting behaviour, the salt hydrates can be classified as: • salt hydrates with congruent melting behaviour – at the melting
temperature the salt is soluble in the hydration water;
• salt hydrates with incongruent melting – at the melting temperature salt is only partially soluble in the hydration water;
19
solid and liquid phases that are in equilibrium have different compositions because of the transformation of the salt hydrate to a salt hydrate with a lesser amount of hydration water.
Unfortunately, a large number of salt hydrates which could be considered as potential PCMs as they possess a large phase transition latent heat and suitable melting temperature melt incongruently. Consequently, the amount of released water is insufficient to dissolve the crystalline salt formed during the dehydration process. This leads to density differences, phase separation and sedimentation in containers causing serious technical problems in practical applications.
Alloys. Metallic alloys are used as high-temperature PCMs as they offer high
thermal reliability and repeatability. The largest phase transition heat, on a mass or volume basis, has been found for binary and ternary alloys of the relatively plentiful elements Al, Cu, Mg and Zn, but not all of the potential materials are suitable for use in TES system. Compared to other latent heat energy storage materials eutectic aluminium alloys were principally investigated for use as PCMs in high temperature TES systems because of their suitable phase change temperature, high latent heat density and good thermal stability.
Organic PCMs
Organic PCMs are constituted by a wide range of materials including paraffins, fatty acids and their eutectic mixtures, esters and other organic compounds. The various compounds and a selection of their thermophysical properties are shown in Tables 4–7.
Table 4 - Paraffins with potential for use as a PCM (adapted from [1])
Paraffin Number of carbon atoms in molecule Melting temp. (°C) Heat of fusion (J/g) Density (g/cm3) n-Tetradecane 14 5.8–6.0 227–229 n-Pentadecane 15 9.9–10.0 206
20 n-Hexadecane 16 18.0–20.0 216–236 0.773 n-Heptadecane 17 22–22.6 164–214 0.778 n-Oktadecane 18 28.0–28.4 200–244 0.776 n-Nonadecane 19 32.0 222 0.785 n-Eicozane 20 36.6 247 0.788 n-Heneicozane 21 40.2 213 0.791 n-Docozane 22 44.0 249 0.794 n-Trikozane 23 47.5 234 0.796 n-Tetracozane 24 50.6 255 0.799 n-Pentacozane 25 53.5 238 0.801 n-Hexacozane 26 56.3 256 0.803 n-Heptacozane 27 58.8 235 0.779 n-Oktacozane 28 41.2 254 0.806 n-Nonacozane 29 63.4 239 0.808 n-Triacontane 30 65.4 252 0.775
Table 5 - Fatty acid with potential for use as a PCM (adapted from [1])
Fatty acid Number of
carbon atoms in molecule
Melting temp. (°C) Heat of fusion (J/g) Density (g/cm3) Caprylic acid 8 16.3 148 – CA 10 31.3–31.6 163 – LA 12 41–44 183–212 0.87 MA 14 51.5–53.6 190–204.5 0.86 PA 16 61–63 203.4–212 0.942 SA 18 70.0 222 0.94 Arachidic acid 20 74.0 227 – Undecylenic acid 22 24.6 141
Table 6 - Fatty acid eutectic mixtures with potential for use as a PCM (adapted from [1])
Fatty acid eutectic mixtures Content (wt.%) Melting temp. (°C)
Heat of fusion (J/g)
CA/LA 45/55 17–21 143
21 LA/MA 66.0/34.0 34.2 166.8 LA/PA 69.0/31.0 35.2 166.3 LA/SA 75.5/24.5 37 182.7 MA/PA 58.0/42.0 42.6 169.7 MA/SA 64.0/36.0 44.1 182.4 MA/SA 65.7/34.3 50–52 162.0 PA/SA 64.2/35.8 52.3 181.7
Table 7 - Other organic compounds with potential for use as a PCM (adapted from [1])
Class of compounds Compound Melting temp. (°C) Heat of fusion (J/g) Monohydroxy
alcohols
1-Dodecanol 17.5–23.3 184.0–188.8
1-Tetradecanol 39.3 221.23
Ketones Phorone 27 123.5
Ethers Diphenyl ether 27.2 97
Esters of fatty acids Methyl palmitate 27 163.2
Allyl palmitate 23 173 Propyl palmitate 16–20 186–190 Methyl stearate 38–39 160.7 Isopropyl palmitate 11 100 Isopropyl stearate 14 142 Butyl stearate 17–23 140–200
Ethylene glycol distearate 63.2 215.80
Dimethyl sebacate 21 135
Methyl-12-hydroxystearate 43 126
Vinyl stearate 27 122
Halogen derivative 1-Iodehexadecane 22.2 131
Chlorobenzothiazole 18.6 65
3-Iodoaniline 23 64
Sulphur compounds Octadecyl 3-mercapto-propionate
21 141
Octadecyl thioglycolate 26 91
Dilauryl thiopropionate 39 159
22 Sugars Erythritol 117 344 Mannitol 165 341 Xylitol 93 280 Sorbitol 97 110 Granulated sugar 179 179
White superior soft sugar 172 110
Dienes Dicyclopentadiene 28.7 11.7
Oleochemical carbonates Decyl carbonate -2.2 144
Dodecyl carbonate 19.3 200
Tetradecyl carbonate 33.7 227
Hexadecyl carbonate 44.9 219
Octadecyl carbonate 51.6 223
Paraffins. Paraffins (saturated hydrocarbons with CnH2n+2 formula), which
constitute the broadly used solid–liquid PCMs, possess a high latent heat storage capacity over a narrow temperature range and are considered as non-toxic and ecologically harmless. Paraffin waxes exhibit moderate TES density, but a large surface area is needed as they have low thermal conductivity. This reduces their rate of heat charging and discharging during the melting and solidification cycles. The latent heat of paraffins is molar mass-based and their various phase change temperatures give the flexibility to select an appropriate PCM for a specific LHTES application. They are economically viable and repeated cycling across the solid–liquid transition does not induce phase separation. Paraffins between C5 and C15 are liquids with the higher analogs being waxy solids with melting temperatures ranging from 23 to 67 °C. Commercial grade paraffin wax, which is a mixture of different hydrocarbons, is produced by the distillation of crude oil. In general, the longer the average length of the hydrocarbon chain, the higher the melting temperature and heat of fusion. This relationship can be employed to design the PCM properties by mixing physically different paraffins. In fact, most paraffin PCMs are mixtures of saturated hydrocarbons with different numbers of carbon atoms in the molecules.
23
The literature data show that after 1000–2000 cycles commercial grade paraffin waxes and other pure paraffins have stable properties and good thermal reliability. Paraffin waxes are safe, non-reactive and are compatible with metal containers as they do not promote corrosion.
Alcohols. Alcohols have been tested for energy storage applications for four
decades, but recent advances in such PCMs are associated with nanomaterials or special composites with unique properties, such as the introduction of electrical conductivity.
Fatty acids. The interest in fatty acids (CH3(CH2)2n-COOH) as PCMs for energy storage has increased recently as they possess desirable thermodynamic and kinetic characteristics for low temperature LHS. They exhibit a high latent heat of fusion, compared to that of paraffins, and reproducible melting and freezing behaviour, with little or no supercooling. However, fatty acids are more expensive than technical grade paraffins, are mildly corrosive and possess a disagreeable odour. With an increasing number of carbon atoms in the fatty acids molecule, the melting and freezing points, the heat of melting and the degree of crystallization gradually increase. Carboxylic acids with an even number of carbon atoms in the structure possess higher values of thermal parameters than those with odd numbers of C-atoms. The former shows a tendency for more regular alignment and a denser crystalline lattice arising from hydrogen bonding between the carboxylic acid molecules. The melting and boiling points of fatty acids are relatively high and the saturated fatty acids exhibit low phase transition volume changes with very little or no supercooling when freezing.
Esters. Fatty acid esters show a solid–liquid transition over a narrow
temperature range and their mixtures can form eutectics, similar to numerous inorganic salt mixtures, with little or no super- cooling. Most of the fatty acid esters are commercially available as large quantities are produced for the polymer, cosmetics, textiles industries and other applications.
24
3. Potential PCMs for building applications [2]
As we know, many factors influence the indoor air temperature of a building. These include climate conditions (outdoor temperature, wind velocity, solar radiation and others), building structure and the building material´s thermophysical properties (wall thickness, area ratio of window to wall, thermal conductivity and specific heat of wall material), indoor heat source, air change rate per hour and auxiliary heating/cooling installations.
It has been shown that the difference between the indoor temperature and the comfort range determines the heating and cooling load when there is no space heating and cooling. Therefore, the heating and cooling load will decrease with decreasing this temperature difference. For a certain building placed in a specific region, the building structure parameters such as wall thickness, area ratio of window to wall, cubage of the room, are known, however the outdoor temperature and solar energy change with the different hour and day during the entire year. Then, with a certain interior heat source, the natural room temperature (i.e. the room temperature without any active cooling or heating) depends on the material thermophysical properties (thermal conductivity, λ, and specific volumetric heat, C (the product of the density by the material’s specific heat, ρ · cp).
If there are certain building materials whose λ and ρ · cp values can make the given room meet the condition Iwin = Isum ≈ 0, (being Iwin, integrated discomfort level for indoor temperature in winter and Isum, integrated discomfort level for indoor temperature in summer), we can call these materials ideal building materials. This means that the indoor temperature will be in the comfort range all year round without auxiliary heating or cooling.
The application of PCMs in building can have two different goals. first, using natural heat, that is solar energy, for heating or night cold for cooling; second, using artificial heat or cold sources. In any case, storage of heat or cold is necessary to match availability and demand with respect to time and also with respect power.
25
Basically, there are three different ways to heating or cooling a building. They are:
• PCMs in building walls;
• PCMs in other building components other than walls; • PCMs in heat and cold storage units.
The first two options are passive systems, where the heat or cold stored is automatically realized when indoor or outdoor temperature rises or falls beyond the melting point. The last one is an active system, where the stored heat or cold is in containment thermally separated from the building by insulation, so the heat or cold is only used on demand not automatically. Some authors classified passive systems applications in the building envelope into two main categories, PCM “integrated” and PCM as “component”. The main difference between them is that component can be manufactured before the building being constructed and have a particular design. For example, blinds with integrated PCM are considered as component.
26
4. Examples of encapsulation [3]
To encapsulate salt hydrates, usually plastic containers are selected because of material compatibility. Plastics are not corroded by salt hydrates; however, attention has to be paid to the water tightness of the material of the capsule wall. This is to make sure that the water content in the capsule and thus the composition of the salt hydrate does not change with time. Plastic encapsulations can also be used for organic PCM, but the combination of PCM and encapsulation material has to be chosen very carefully because organic materials may soften plastics.
Fig.2 shows several examples of macro encapsulation in plastic containers from different companies. Many companies produce a selection of different encapsulations. Because plastic containers can nowadays be produced easily in a high variety of shapes, there are few restrictions on the geometry of the encapsulation.
Fig. 2 - Encapsulation in plastic containers. From left to right: bar double panels, panel, flat container and balls (adapted from [3])
Another form of encapsulation shows fig.3. Here, plastic sheets form small containments for the PCM that are sealed with a plastic foil. Such encapsulations called capsule stripes or dimple sheets are useful to cover large surfaces and can be manufactured on a fully automated production line.
27
Fig. 3 - Encapsulation in capsule stripes for inorganic PCM (adapted from [3])
It is of course also possible to use only foils as a wall material; the resulting product is PCM encapsulated in bags. Fig.4 shows two examples. To ensure tightness of the bag regarding water, usually plastic foils combined with a metallic layer are used.
Fig. 4 - Encapsulation in bags (adapted from [3])
If good heat transfer is important, the low thermal conductivity of container walls made of plastic can be a problem. An option is to choose containers with metal walls. Metal walls also have the advantage of higher mechanical stability if a sufficient wall thickness is chosen. It is however necessary to select a suitable metal which is not corroded by the PCM. This selection should also consider that depending on the metal different options and restrictions for shaping, welding, etc exist. Fig.5 shows two examples of metal containers used to encapsulate PCM.
28
Fig. 5 - Macroencapsulation in metal containers: left, aluminium profiles with fins for improved heat transfer, and right, coated aluminium plate (adapted from [3])
On the left is a ClimSel Thermal Battery: a hollow aluminium profile with cooling fins that is filled with PCM. The batteries can be connected to each other, as shown in the background. On the right is a coated aluminium plate filled with PCM.
29
5. Stored Heat of materials [3]
The stored heat between two temperatures is the most important characteristic of PCM materials and objects, as the final goal in an application is to store heat. Before starting with the detailed discussion, it is necessary to go through some definitions.
5.1 Basics of calorimetry
The stored heat can be given with respect to the volume or mass in case of a material, or with respect to a given object. The calorimetric formula
𝑑𝑄 =𝑑𝑄
𝑑𝑇∙ 𝑑𝑇 = 𝐶 ∙ 𝑑𝑇 (3) defines the relation between the stored heat and the heat capacity C (e.g. J/K). The heat capacity of a material can be given with respect to mass (e.g. J/kg⋅K), volume (e.g. J/m3⋅K) or amount of the material (e.g. J/mol⋅K). If the heat capacity is with respect to mass, volume, or amount, it is called specific heat capacity and c is used instead of C. The heat capacity depends also on the boundary conditions; for constant pressure, it is denoted as Cp, and for constant volume as Cv. Because of the relation between the enthalpy H, internal energy U, pressure p, and volume V
𝐻 = 𝑈 + 𝑝𝑉 (4)
and the first law of thermodynamics
𝑑𝑈 = 𝑑𝑄 − 𝑝𝑑𝑉 (5)
follows
𝑑𝐻 = 𝑑𝑈 + 𝑑(𝑝 ⋅ 𝑉 ) = 𝑑𝑄 − 𝑝𝑑𝑉 + 𝑝𝑑𝑉 + 𝑉𝑑𝑝 = 𝑑𝑄 + 𝑉𝑑𝑝 (6) For constant pressure follows then
𝑑𝐻 = 𝑑𝑄 (7) And consequently also
∆𝐻 = ∆𝑄 (8) Further on 𝑑𝐻 𝑑𝑇|𝑝 = 𝑑𝑄 𝑑𝑇|𝑝 = 𝐶𝑝 (9)
30
For solids and liquids, which under usual conditions are incompressible, the term 𝑉 ∙ 𝑑𝑝 can be neglected in eq.6. Then, independent of the pressure conditions, eq.7, eq.8, and eq.9 are valid. Changes of enthalpy ΔH and of heat ΔQ are therefore often used synonymously when dealing with solids and liquids. From a physics point of view, there is however an important difference between H and Q: heat is something that only shows up in the transfer of thermal energy and the amount transferred depends on the path between the initial and the final state of the system. Enthalpy H is a thermodynamic potential and therefore characteristic of a state.
The correct expression is therefore that the heat stored or lost is equal to the enthalpy increase or reduction of the storage material.
Methods to determine the change of heat in any kind of process are called
calorimetric methods. A calorimeter usually works in one of the following
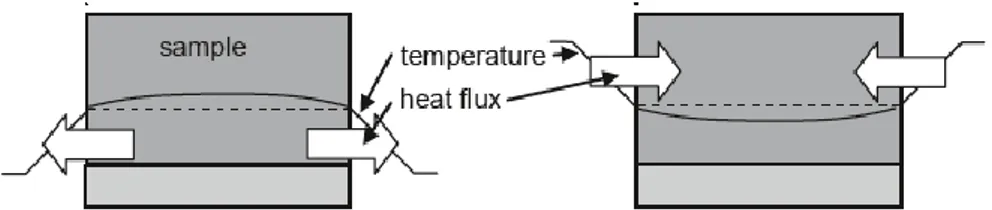
ways shown in Fig.6, based on the calorimetric formula (eq.3):
• The calorimeter actively supplies heat to the sample via an electrical resistance heater and measures the temperature change of the sample. The electrical energy supplied is calculated from the voltage and current
of the heater.
• The calorimeter actively supplies heat to the sample via a thermal resistance and a temperature difference between the sample and its surrounding. Further on, it measures the temperature change of the sample. The heat supplied to the sample across the thermal resistance is calculated from the temperature gradient across the thermal resistance. The value of the resistance can be calculated. However, usually it is determined via a calibration using standard materials with a known heat capacity or melting enthalpy.
Fig. 6 - Supply of the heat elettrically (left), or by a heat flux from the outside (right) (adapted from [3])
31
An advantage of the electrical heating is that it needs no calibration. On the other hand, it can only be used for heating, while with a thermal resistance there is also the possibility of measuring upon cooling when the temperature of the surrounding is below the sample temperature. There are several modes
to operate calorimeters to determine the heat storage capacity within a
temperature interval of interest. They differ in the resolution of the data on the heat supplied to the sample and the corresponding temperature change: 1. Interval mode: heating or cooling is between the start and the end of the temperature interval of interest, indicated on the left in Fig.7 by “|”. Then
∆𝑄 = ∫ 𝐶𝑝𝑑𝑇 = 𝐶𝑝∙ ∆𝑇 = 𝐶𝑝∙ (𝑇𝑒𝑛𝑑− 𝑇𝑠𝑡𝑎𝑟𝑡) 𝑇𝑒𝑛𝑑
𝑇𝑠𝑡𝑎𝑟𝑡
(10)
It is important that the sample is isothermal at the start and end temperatures, otherwise these states are not well defined, and the heat supplied is not determined correctly. The heat supplied or extracted for the temperature change can be measured with high accuracy; the temperature resolution of the stored heat however is very poor. The heat capacity value determined is an average value for the whole interval. Fig.7 shows this for the case of a material with a melting temperature, and not a melting range.
2. Step mode: heating or cooling is as with the interval mode, but the whole interval of interest is now divided into small intervals, called steps. For these steps, the same treatment as described for the interval mode before is applied. This increases the temperature resolution of the stored heat. The resolution is equal to the height of the temperature steps; however, the start and end of each step must again be an isothermal state, otherwise the change in heat in each step is not determined correctly.
3. Dynamic mode: the interval is scanned by continuously heating or cooling according
𝑑𝑄 =𝑑𝑄
32
There are no steps to wait for thermodynamic equilibrium anymore. The heating or cooling rate has to be slow enough to assure thermodynamic equilibrium within the sample, however. If not, the heat supplied at each data recording (equal to the enthalpy change dH, eq.7) cannot be assigned to the measured temperature. Too high heating or cooling rates cause significant errors in the data of the heat stored as a function of temperature. The resolution of the data itself is only restricted by the data recording system.
Fig. 7 - Data sets for interval (left), step (center), and dynamic mode (right) for the case of a material with a melting temperature. The total heat ΔQ supplied to the sample (=ΔH) over the whole interval is the same, but the resolution of the data ○ increases from left to
right (adapted from [3])
From the data of the heat supplied to the sample and the corresponding temperature change the heat capacity can be calculated. Actually, in the case of a melting temperature the heat capacity, which is the 1st derivative of the stored heat with respect to temperature, would be infinite. Therefore, many people do not like to call the values a heat capacity, even if there is a melting range instead of a melting temperature. However, for a melting range it is not possible to distinguish the temperature ranges of melting and of only sensible
33
heat storage. Any attempt to do it anyway leads to confusion and uncertainties as the past has shown. Further on, even for a melting temperature the measurement will never result in an infinite value. Years of experience have shown that the best way is to strictly follow the definition and use the heat capacity throughout, even in the presence of a melting temperature.
Fig.7 shows data sets for interval (left), step (centre) and dynamic mode (right) for the case of a melting temperature. The total heat supplied to the sample over the whole interval results from adding up the heat supplied in each interval. As the top row of diagrams shows, it is the same for all measurement modes, but the resolution of the data ○ increases from left to right. The influence of the resolution on the heat capacity data shown in the lower row of diagrams is dramatic. It is obvious that the interval mode gives the worst resolution because it averages over the whole measurement interval where, due to the phase change, dramatic differences in the heat capacity occur. Between step and dynamic mode, there is no significant difference in the range of sensible heat storage. In the range of phase change, the width of the measurement interval has a strong influence on the peak value of the heat capacity data. This effect can be dramatic when pure substances with a melting temperature are analysed, but it is usually less pronounced when measuring PCM because most PCM have a melting range.
5.2 General aspects in doing a measurement
From what was discussed up to this point in chapter 5, it is possible to summarize that aspects related to doing a measurement include general aspects of calorimetry and the materials investigated. Three main aspects have to be considered:
1. The sample has to be representative for the investigated material
This originates from the definition of a material property.
To assure that the sample is representative, the sample must be larger than typical inhomogeneities of the material.
2. Correct determination of the exchanged heat and temperature of the sample
34
This originates from the use of the calorimetric formula.
For the temperature, the correct determination is usually assured by a calibration procedure, where standard materials with known melting temperatures are used. This procedure has to be repeated from time to time. Usually the temperature is not measured within, but only close to the sample. This can lead to an offset between the measured and the real sample temperature.
For the heat flow, the correct determination is usually also assured by a calibration. If a measurement has to be very accurate, the calibration should be done just before or after a sample measurement.
3. Thermodynamic equilibrium in the sample
Thermodynamic equilibrium in the sample requires first that the sample is
isothermal, otherwise the heat flux cannot be attributed to a single
temperature indicated at the sensor. Therefore, the measurement should be done slow enough, or the sample should not be too large. This can be in conflict with the necessity to have a sufficiently large sample to be representative for the investigated material.
Further on, the sample should be in reaction equilibrium, otherwise the enthalpy at the measured temperature has no defined value, and consequently enthalpy differences are also not well defined. This refers to two aspects: first, dynamic processes have to proceed to a stable state, and second, there should only be one stable state at the same temperature. There are several occasions causing problems with regard to reaction equilibrium, for example very slow reactions, metastable states like amorphous instead of crystalline structures, subcooling, and different crystalline structures.
5.3 Problems in doing measurements on PCM
Besides the general aspects just summarized that apply to any material, PCM pose additional problems or larger problems due to their high phase change enthalpy.
Regarding point 1, saying that the sample has to be representative for the investigated material, subcooling can be a problem. Subcooling can depend
35
on the sample size and therefore the sample size should be typical for the application if possible.
Regarding point 2, the correct determination of the exchanged heat and temperature of the sample, PCM will give a large signal in the temperature range where the sample melts, and a small signal outside that range. The calibration therefore should be done for large signals.
Regarding point 3, the thermodynamic equilibrium in the sample, the measurement on PCM can cause severe problems. The requirement of reaction equilibrium is violated during subcooling of a sample, or if upon cooling crystals form slowly. This means the heating / cooling rate should be small. To get the sample isothermal can also take a lot of time with a PCM during the phase change, because of the large amounts of heat involved and the usually low thermal conductivity of PCM. If not done properly, there will be significant errors as Fig.8 shows. When the temperature of the sample is measured at the sample surface, which is usually the case, the heat released or supplied to the sample is then attributed to a wrong temperature, too low when cooling and too high when heating.
Fig. 8 - Left: temperature profile in a cooling measurement for a material storing only sensible heat (- - -) and a PCM during phase change (⎯). Right: the same for a heating
measurement (adapted from [3])
Outside the melting temperature range, this effect is relatively small; because only sensible heat is stored, the temperature gradients remain small. While most calorimeters are constructed to give accurate results for sensible heats of “ordinary” materials, a significant offset can be observed in the melting range of PCM with their special, high phase change enthalpy. Upon cooling, the situation can even be worse.
36
In most cases, interval and step mode are not critical, as isothermal conditions are attained when waited for long enough. In dynamic mode, where also many data points lie in the melting and solidification temperature range of the PCM, different measurement results are obtained on heating and cooling (Fig.9, left). This is often called hysteresis; however, most people understand
hysteresis as a property of the material / sample only. Effects, which are only
due to the measurement conditions, are usually not called hysteresis, but
apparent hysteresis.
Fig. 9 - Left: apparent hysteresis caused by non-isothermal conditions. Center: real hysteresis as a material property caused by subcooling. Right: real hysteresis by slow heat
release or a real difference between the phase change temperatures (adapted from [3])
To find out if an observed hysteresis is real or only apparent, that means if it is a property of the material or only due to the measurement apparatus or procedure, it is necessary to have isothermal conditions in the sample. Therefore, the heating and cooling rate should be small, or the sample size should be small. However, small sample size contradicts the requirement of having a representative sample, and small heating and cooling rates will lead to a low signal to noise ratio. Therefore, it often cannot be avoided to have different results from heating and cooling measurements. To get at least an idea what the result would be if temperature equilibrium were attained, it is necessary to measure always upon heating and cooling and with a small heating and cooling rate as possible. The closer the result, the better temperature equilibrium was attained. A comparison of results from
37
measurements with different heating rates indicates also how close temperature equilibrium was attained. There are several effects due to the material, which cause real hysteresis.
The most common one is subcooling. Subcooling will lead to different results for heating and cooling; however, it is not a shift of the results to higher temperatures on heating and lower temperatures on cooling. Subcooling is restricted to the temperature range where solidification is started, as fig.9 shows. Another cause of hysteresis is when the latent heat is released too slowly on cooling, e.g. because the crystal lattice forms very slowly or because diffusion processes are necessary to homogenize the sample. The temperature of the sample then drops below the melting temperature. Upon melting, a similar effect is usually not observed (Fig.9, right) because during melting the kinetic effects proceed much faster. Another possible cause of hysteresis is when upon solidification the sample forms a different solid phase than the one it was at the beginning of melting process. This can be an amorphous phase, or a different crystalline structure.
Up to now, the discussion and the diagrams discussed the case of a melting temperature. Because PCM are usually not pure substances and therefore usually have a melting range, it is not possible to detect from any single measurement what exactly the underlying effects are and to eliminate the deviations in the data caused by not having isothermal conditions, reaction equilibrium, etc. It is therefore strongly recommended to try to measure at least as close as possible to isothermal conditions and to make measurements on heating and additionally on cooling.
The problems in doing measurements on PCM, discussed here on a theoretical basis, will then be discussed in connection with the measurement systems and real measurement results.
38
6.
Use of water-phase change material storage in
conventional solar water heating systems [5]
Domestic water heating, which constitutes a significant share of the residential energy consumption, is an excellent application for utilizing solar energy. However, due to the intermittent, unsteady, and time-dependant characteristics of solar radiation, the widespread use of solar water heating systems relies heavily on the availability of reliable and feasible energy storage methods.
Solar thermal energy had been traditionally stored in the form of sensible heat by raising the temperature of water or rocks for later use. Despite the obvious simplicity of such storage methods, they are inefficient as their storage capacities are limited. In contrast, solar thermal energy can be stored in the form of latent heat by using suitable phase change materials, which can offer high storage capacity per unit volume, and per unit mass. This is essentially due to the fact that for most materials, the latent heat of fusion is very much larger than their enthalpy change (for example: the ratio of the latent heat to the specific heat of water is around 80). The melting of a phase change material (PCM) enables the absorption of large amounts of heat which can be excessively available during the daytime. This stored heat can then be released to the surrounding medium during the evening and night hours as the PCM changes its phase again from liquid to solid. Such method of storage is also advantageous in reducing the temperature fluctuations in a solar thermal system by absorbing the extra heat at peak radiation hours to release it when solar radiation is absent.
A wide range of PCMs can be used for latent heat storage applications, including salt hydrates, paraffin waxes, fatty acids, and sugar alcohols. For use in domestic solar water heating applications, paraffin waxes represent the most suitable option due to their congruent melting temperatures, availability, low cost, and non-corrosiveness. However, they usually suffer from relatively high volumetric expansion ratios and low thermal conductivity values. The poor thermal conductivity can be overcome by using the PCM through
39
geometries with large surface area to volume ratios. Over the past two decades, the area of latent heat thermal energy storage has generated a great deal of interest. Detailed reviews have been presented of phase change materials, applications, and theoretical and experimental investigations. Different designs of integrated and compact phase change material solar collectors have been proposed and experimentally evaluated. Alternatively, the use of different PCMs with different configurations in the storage tanks of solar collector systems has been experimentally investigated under various conditions.
I.Al-Hinti et al. experimentally investigated the effect of using paraffin wax as a phase change material in containers packed in the storage tank of a conventional solar water heating system. The investigation includes a set of day-long experiments representing different practical application scenarios. The suggested storage configuration is simple and can be easily used with existing conventional systems without major or expensive modifications. A schematic diagram of the experimental setup is shown in Fig. 10. The setup is essentially similar to conventional, commercially available, solar water heating systems with a few differences.
It consists of four south-facing flat plate 1.94 m * 0.76 m * 0.15 m collectors with a tilt angle of 30°. The collectors, which have ordinary single glass covers and black painted absorber plates, are connected to the main water supply and the hot water storage tank through a set of three valves enabling open-loop and closed-loop operation. A standard 90W circulation pump, with a maximum capacity of 10 l/min, is also available on the collectors-storage tank loop to enable forced circulation investigations, in addition to natural circulation.
The galvanized steel storage tank is cylindrical in shape having a length of 675 mm, an inner diameter of 450 mm and a volume of 107.4 l. It is insulated with 75-mm thick layer of rock wool insulation. Fig. 11 shows a detailed cross-sectional view of the storage tank. The tank contains a total of 38 thin walled, cylindrical, aluminium containers. Each container has a volume of 1.3 l and contains 1.0 kg of paraffin wax which was used in this investigation as the PCM.
40
The thermophysical properties of the paraffin wax are given in Table 8. The PCM containers are arranged in the tank on two levels, each containing 19 containers, with the aid of two perforated sheet metal separators.
The choice of these containers was meant to reach a relatively large heat transfer surface area in comparison with the volume of the PCM, and to minimize the thermal resistance between water and the PCM. The total volume of the PCM containers is 49.4 l, with water occupying the remaining 58 l in the storage tank. The bottom section of the storage tank also contains an auxiliary 2 kW electrical heater, in order to enable controlled conditions investigations.
The measurement system includes a total of seven pre-calibrated K-type thermocouples: One at the inlet line and one at the outlet line of the storage tank, three distributed at the upper, middle, and lower sections of the storage tank, one thermocouple inserted in a PCM container at the central section of the tank, and one to measure the ambient air temperature.
All thermocouples are connected to an HP 34970A-type data logger connected to a PC to enable the continuous recording of the temperature readings during various test scenarios. In the experiments described in the following section, temperature readings were continuously recorded with 1, 5, or 10 min intervals between each reading and the other, depending on the experiment requirements.
Two flow meters with an accuracy of ±2% are also available at the inlet and outlet lines of the storage tank to measure the water flow rates when needed. All the experiments were conducted during the period extending from 1 to 24 April 2008 at the campus of the Hashemite University. This site is located at 32.1°N and 36.2°E, with an altitude of around 620 m. The climate is semi-arid and is characterized by low annual rain fall and around 3300 h of sunshine per year. The annual-average daily solar radiation is around 5.5 kWh/m2.
The hourly average radiation for the month of April is shown in Fig. 12, with the months of January and August shown for comparison purposes. It can be seen that the month of April represents the yearly average climatic and radiation conditions of the site.
41
Table 8 - Thermophysical properties of the phase change material (adapted from [5])
Melting point Latent heat of fusion
Density (solid phase)
Density
(liquid phase) Specific heat
Thermal conductivity 52 °C 230 kJ/kg 820 kg/m3 780 kg/m3 2.4 kJ/kg K 0.25 W/m K
Fig. 10 - Schematic of the experimental setup (adapted from [5])
6.1 Storage performance with controlled heat input
Fig. 13 shows the time variation of the water temperature at the tank midpoint section, the PCM temperature, and the ambient air temperature, during a controlled heating conditions experiment.
In this experiment, the storage tank was separated from the system by closing the valves on the inlet and the outlet lines. The electrical heater was turned on for a period of 3 h to reach a maximum water temperature of 76 °C. Afterwards the heater was turned off, and the temperature measurements continued for a further 20 h.
42
Fig. 11 - Cross sectional view of the storage tank with PCM containers (adapted from [5])
Fig. 12 - The hourly average radiation for January, April, and August at the experiment site (adapted from [5])
43
Fig. 13 - Temperature–time variations in the storage tank during controlled energy (adapted from [5])
It can be seen that at the beginning of the heating period, the water temperature increases at a faster rate in comparison with the PCM, which is initially in the solid phase. Then a sudden drop in the temperature of the PCM temperature is witnessed as it reaches a temperature of around 50 °C, which is close to its reported melting point. This can be explained by realizing that at this stage the PCM is undergoing phase change and therefore it is absorbing large amounts of heat without increasing its temperature. Following this, the temperature of the PCM starts to increase at a faster rate to catch up with the water temperature at the end of the heating stage. In less than 1-h time after the heater is switched off, the water temperature drops below the PCM temperature and continues to be 1-2 °C lower until the end of the experiment. During this stage, the PCM continues to release the stored heat to the surrounding water, and thus reducing the rate at which the temperature of water decreases.
In order to investigate the validity of this discussion and the extent of the advantage obtained by using the PCM, the same experiment was repeated under similar ambient conditions but with the PCM containers removed from the storage tank and the remaining tank volume filled with water. Fig. 6 shows the time variation of the difference between the water temperature at the tank midpoint section and the ambient air temperature, with the existence of the PCM and without it.
44
It can be seen that although the difference between the water temperature and the ambient temperature reaches a maximum of around 58 °C at the end of the heating process in both cases, water gains and looses heat at a slightly slower rate in the presence of PCM during the first 8 h of the experiment. A significant difference between the two cases becomes apparent after that, as the water temperature reaches around 50-55 °C. This is attributed to the release of the stored latent heat during the gradual solidification of the PCM at this range of temperatures. The temperature advantage of the PCM case reaches 13-14 °C after 16 h of the start of the experiment. It is obvious that at 17 h after the heater was switched off, the temperature of water in the presence of the PCM was still 36 °C higher than the ambient temperature, in comparison to a difference of only 22 °C in the case without PCM.
Fig. 14 - Time variations of the temperature difference between the tank midpoint and the ambient, with and without the PCM containers, during controlled energy input experiment
(adapted from [5])
6.2 Storage performance with closed-loop solar system
Although the advantage of water-PCM storage was clearly demonstrated under the controlled conditions of the previous experiment using the electrical heater as the energy source, the performance of the PCM in the storage tank needs to be tested under real operational conditions.
45
Fig. 15 shows the time variation of the water temperature at the midpoint section of the storage tank, the temperature of the PCM, the inlet temperature to the storage tank, in addition to the ambient air temperature. These results were recorded with the storage tank connected to the flat plate collectors in a closed loop with natural circulation over a continuous period of 24 h which started at 8:00 am on 6 April 2008. No water was discharged from the system through the outlet line.
The intermittent characteristics of the solar radiation absorbed by the system are evident in the fluctuating inlet water temperature reaching the tank from the collector plates. These fluctuations are effectively smoothed in the storage tank as shown from the water and PCM temperatures. Although the ambient temperature drops at night hours to as low as 13 °C, the water temperature in the tank does not drop below 45 °C at any time which is considered acceptable for most domestic applications. A 1-h time lag is noticed between the maximum ambient temperature, and possibly solar radiation as well as seen from the inlet temperature, and the maximum water temperature in the tank. The slowing water and PCM temperature gradient when solar radiation is absent is clear as the PCM approaches its melting temperature.
Fig. 16 shows the results of a similar experiment that was started at 8:00 am on 14 April 2008, with one difference: the circulation pump was operated for 10 min after 90 min of the start of the experiment. The purpose of this experiment was to investigate the effect of limited periods of forced circulation on the performance of the system in general and on reducing the time lag between the peak radiation and the peak water temperature. It is obvious that such effect is minimal and is only limited at the time of pump operation only as the whole system temporarily approaches an almost uniform temperature, but the temperature variations continue after that with a trend similar to that observed in the natural circulation experiment. The only exception is that following the forced circulation, the PCM temperature becomes slightly higher than the water temperature throughout the experiment.
![Table 1 - Inorganic compounds with potential use as PCMs (adapted from [1])](https://thumb-eu.123doks.com/thumbv2/123dokorg/7386548.96899/16.892.83.800.639.1096/table-inorganic-compounds-potential-use-pcms-adapted.webp)
![Table 3 - Eutectic and non-eutectic mixtures with potential use as PCM (adapted from [1])](https://thumb-eu.123doks.com/thumbv2/123dokorg/7386548.96899/18.892.89.827.140.887/table-eutectic-non-eutectic-mixtures-potential-pcm-adapted.webp)
![Table 4 - Paraffins with potential for use as a PCM (adapted from [1])](https://thumb-eu.123doks.com/thumbv2/123dokorg/7386548.96899/19.892.85.831.978.1117/table-paraffins-potential-use-pcm-adapted.webp)
![Table 6 - Fatty acid eutectic mixtures with potential for use as a PCM (adapted from [1])](https://thumb-eu.123doks.com/thumbv2/123dokorg/7386548.96899/20.892.83.824.585.931/table-fatty-acid-eutectic-mixtures-potential-pcm-adapted.webp)
![Table 7 - Other organic compounds with potential for use as a PCM (adapted from [1])](https://thumb-eu.123doks.com/thumbv2/123dokorg/7386548.96899/21.892.83.828.105.295/table-organic-compounds-potential-use-pcm-adapted.webp)
![Fig. 5 - Macroencapsulation in metal containers: left, aluminium profiles with fins for improved heat transfer, and right, coated aluminium plate (adapted from [3])](https://thumb-eu.123doks.com/thumbv2/123dokorg/7386548.96899/28.892.242.652.107.367/macroencapsulation-containers-aluminium-profiles-improved-transfer-aluminium-adapted.webp)
![Table 8 - Thermophysical properties of the phase change material (adapted from [5])](https://thumb-eu.123doks.com/thumbv2/123dokorg/7386548.96899/41.892.190.708.326.730/table-thermophysical-properties-phase-change-material-adapted.webp)
![Fig. 11 - Cross sectional view of the storage tank with PCM containers (adapted from [5])](https://thumb-eu.123doks.com/thumbv2/123dokorg/7386548.96899/42.892.195.694.153.565/fig-cross-sectional-view-storage-tank-containers-adapted.webp)
![Fig. 13 - Temperature–time variations in the storage tank during controlled energy (adapted from [5])](https://thumb-eu.123doks.com/thumbv2/123dokorg/7386548.96899/43.892.258.626.120.382/fig-temperature-time-variations-storage-controlled-energy-adapted.webp)
![Patrimonio comune dell'umanità [dir. int.]](data:image/gif;base64,R0lGODlhAQABAIAAAP///wAAACH5BAEAAAAALAAAAAABAAEAAAICRAEAOw==)