Unfolding the innovation system
for the development of countries:
coevolution of Science, technology
and production
emanuele pugliese
1,2,3,6, Giulio cimini
1,4*, Aurelio patelli
1,7, Andrea Zaccaria
1,2,
Luciano pietronero
5,1,2& Andrea Gabrielli
1,8We show that the space in which scientific, technological and economic activities interplay with each other can be mathematically shaped using techniques from statistical physics of networks. We build a holistic view of the innovation system as the tri-layered network of interactions among these many activities (scientific publication, patenting, and industrial production in different sectors), also taking into account the possible time delays. Within this construction we can identify which capabilities and prerequisites are needed to be competitive in a given activity, and even measure how much time is needed to transform, for instance, the technological know-how into economic wealth and scientific innovation, being able to make predictions with a very long time horizon. We find empirical evidence that, at the aggregate scale, technology is the best predictor for industrial and scientific production over the upcoming decades.
Knowledge production and organization represents the main activity of modern societies – “learning econo-mies”1 in which most of the wealth of a country is intangible, and the organization of the national innovation
system2, and of diffused creativity3 are the crucial capabilities for success. Therefore, in the last thirty years the
relationships between science, technology and economic competitiveness have become an important focus for social sciences in general and economics in particular4,5. Even though the layman narrative links science,
technology and economic productivity in a direct flow6, actual interactions on the fine-grained scale of
indi-vidual activities are typically multi-directional and far more entangled7,8. The literature on industrial
organ-ization and evolutionary economics changed the description of the innovation system from a directed chain to a co-evolution of distinct processes driven by different motives and routines9. This non-hierarchical and
multi-directional interplay among the individual components of the innovation system is indeed the footprint of a complex system.
Differently from the traditional social science approach, the new techniques of Economic Complexity do not try to average out the complexity of the system, but embrace it by explicitly building on the heterogeneity of indi-vidual actors, activities and interactions to extract the relevant and statistically robust parameters characterizing the system. Trying to recover the qualitative insights10 and the few quantitative attempts11,12 of the heterodox
economists and social scientists, researchers used this approach to study unobservable features and capabilities of countries13–15, and to unearth unexpected synergies among different activities16,17 (see also18).
Following this line11,16,17,19, here we create the network of interactions between the different human activities
involved in the innovation system. Differently from previous analyses, that describe the interactions between very general and broad activities (e.g., science and technology) or represent specific case studies (e.g., relation-ships between technological development and productivity in the semiconductor industries), our construction provides, for the first time, a disaggregated picture of the bidirectional impact between all the possible pairs 1Istituto dei Sistemi Complessi (ISC)-CNR, 00185, Rome, Italy. 2International Finance Corporation, World Bank Group, 20433, Washington, USA. 3University of Bath, Bath, BA27AY, United Kingdom. 4IMT School for Advanced Studies, 55100, Lucca, Italy. 5Dipartimento di Fisica, Sapienza Università di Roma, 00185, Rome, Italy. 6Present address: European Commission, Joint Research Centre (JRC), 41092, Seville, Spain. 7Present address: Service de Physique de l’Etat Condensé, CEA-Saclay, 91191, Gif-sur-Yvette, France. 8Present address: Dipartimento di Ingegneria, Università Roma 3, 00146, Rome, Italy. *email: [email protected]
of activities (e.g., export of semiconductor transistors and technological development in organic chemistry), using a uniform methodology with a few controlled assumptions. In particular, our network encompasses activities in different realms (or layers): scientific fields, technological sectors, and economic production. We build such a comprehensive multi-layer network20, namely a system where entities belong to different sets
and several categories of connections exist among them, using the following key assumption: if two activities co-occur significantly more often than randomly (in terms of appropriate null models) in the same countries at given times, then there is an overlap between the capabilities required to achieve proficient level (i.e., com-petitive advantage) in both. Notice that in this narrative we use a very wide definition of the term capability, to mean at the same time physical and intangible (cultural or technological) resources. In particular, the presence of an activity could be intended itself as a capability for a different activity (for example through complemen-tarities and spillovers21).
As detailed in the Methods section, the starting point of our construction are the bi-adjacency matri-ces Mc,aL(y) whose elements indicate whether country c has a competitive advantage in activity a belonging to
layer L, in year y. L stands for the layer of analysis, consisting in the set of all activities related to either Science,
Technology or Products export. Note that each of these layers has an intrinsic hierarchical structure: for instance,
in the science layer we can consider activities like Physics and Astronomy or corresponding sub-activities (like
Statistical Physics, Condensed Matter Physics, Nuclear and High Energy Physics). Thus, our matrices do depend on
the resolution used for activities classification (even if not explicitly reported in the notation). We use different established databases to construct the multi-layer space: for Science, we take bibliometric data on papers in the various scientific fields from Scopus (www.scopus.com); for Technology, we consider the number of patents in different technological sectors extracted from Patstat (www.epo.org/searching-for-patents/business/patstat); and for Products, we use export data collected by UN COMTRADE (https://comtrade.un.org/)—which are typically used as proxy of a competitive industrial production.
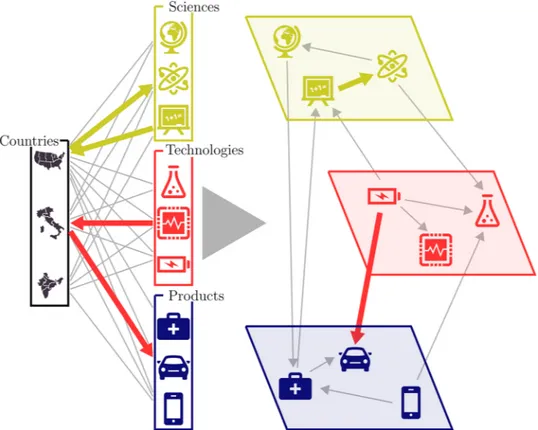
Using these matrices we compute the probability of having a comparative advantage in activity a2 ∈ L2 in the year y2, conditional to having a comparative advantage in activity a1 ∈ L1 in the year y1 (Fig. 1). This is defined by the Assist matrix17 (see Methods)
Figure 1. Visual representation of the multilayer space of innovation activities. Left panel: Schematic
visualization of the triple bipartite network with Countries in one partition and activities (Sciences,
Technologies, and Products) in the other one. Right panel: Tri-layer representation of the resulting Assist matrix
between activities. The generic element of the Assist matrix is equal to the probability that a bit of information, randomly diffusing in the triple bipartite network, travels from one activity to another. This can happen in the same activity layer, as it is the case for the yellow path linking two sciences, or among different layers, as it is the case for the red path going from a technology to a product.
∑
∑
= | = | | = →→ B y y Pr a y a y Pr a y c a y Pr c a y M y d y M y u y ( , ) ( ; ; ) ( ; , ; ) ( ; ) ( ) ( ) ( ) ( ) (1) aL aL c c c aL cL c aL aL 1 2 2 2 1 1 2 2 1 1 1 1 , 2 2 , 1 1 11 22 2 2 2 1 1 11where u yaL11( )1 = ∑c c aML,11( )y1 is the ubiquity of activity a1 ∈ L1 in year y1, and d yc ( )= ∑ ∈ M ( )y L
a L c aL
2 , 2
2
2 2 22 is the
diver-sification of country c in the layer L2 in year y2. These probabilities can be associated with the overlap between the capabilities required to perform activities a1 in the year y1 and a2 in the year y2, under the assumption that these capability requirements are the same for each country. However we are not assuming that capabilities of individ-ual countries in different years are independent: indeed, these dependencies are intrinsically present in the data we use.
In order to interpret the empirical observed values of BaL11→→aL22( , )y y1 2, we have to assess their statistical signifi-cance using a null model based on appropriate network randomization techniques22–25. This model is built on the
assumption that the ubiquity of activities and diversification of countries in each layer sum up all the information. The corresponding null hypothesis is thus that activities are independent, and there is no capability structure behind the networks: co-occurrences between activities happens at random, some more likely than others only because of the ubiquities of the two activities – e.g., some technological fields and the export of some products are less ubiquitous and thus they are both more likely to be performed by advanced and more diversified countries. Therefore, any specific observed link a1 → a2 for which we can reject such null hypothesis is interpreted as the signal of some real interdependency between the specific capabilities required by a country to perform those specific activities – either at the same time or with a time delay.
Results and Discussion
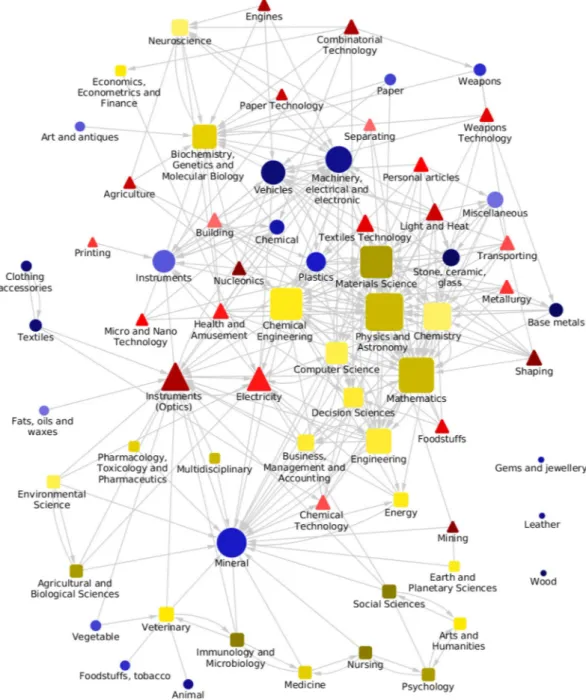
The described methodology allows obtaining unprecedented qualitative and quantitative insights on the complex dynamics of development. By linking together those activities which are related at a given significance level, we can build the whole multilayer space in which scientific, technological and industrial activities are embedded (Fig. 2). We also perform a more focused analysis and show how a detailed activity (e.g., the export of an indi-vidual product) is related to activities in other layers at various aggregation levels. An example is shown in Fig. 3, where we plot the scientific and technological fields related to the export of Desktop Computers. We can draw from the figure two observations: (i) significant peaks, i.e., values of assist matrix elements observed in the real data with less than 5% probability to occur in the null model, are meaningful according to our understanding of the scientific and technological prerequisites to be competitive in Desktop Computers export; (ii) technology tends to be more significantly related than science to the export of this product, the overall significance of assist matrix entries (i.e., the signal-to-noise ratio) being higher in the first case. This is not an exception related to this product, as we shall see next.
The representation of Fig. 2 suggests that any modeling of the Innovation System assuming a standard direc-tion of the dynamics between layers (e.g., from Science to Technology to Products) is simplistic. In other words the assumption that all activities belonging to the same layer behave similarly in determining the innovation cascade is empirically unjustified: the division in scientific, technological and production activities is not greatly informative of their role in the network. A technological activity could be a precursor of some scientific activities, while the opposite could be true for different activities in the same layers: a complex system where no set of labels is fully informative of the dynamic structure. We can however provide some insights on the average interactions between activities in two specific layers to assess if the aggregate models of the innovation system1 offer at least a
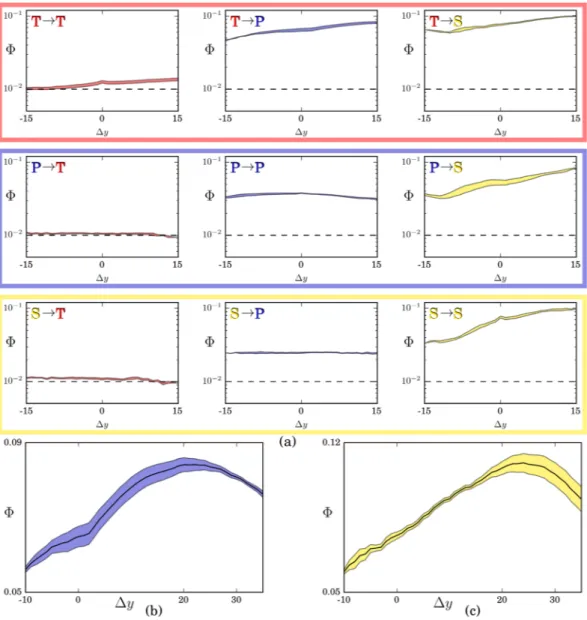
proper description of the most common modes of interaction. Given two layers L1 and L2 and a time lag Δy, we compute a signal-to-noise ratio ΦL1→L2( )Δy as the average for different years y of the fraction of significant links
a1 → a2 in the matrix BaL11→→aL22( ,y y+ Δ). We consider the links significantly more co-occurring than random with
a 99% confidence level. Therefore for two unrelated layers we expect Φ ≃ 1%, and any value above that is the foot-print of signal overcoming the noise. Repeating this simple exercise for different temporal windows allows shed-ding light on the following issues: What is the average influence of the activities in L1 on the activities in L2 after a given time? How many years does it take to maximize such impact?
The results, shown in Fig. 4, are striking. First, the signal between different layers is (almost everywhere, see ahead) very high, even for long time differences. Beyond the slowly-changing structure of countries’ activity, this is explained with the strong overlap of countries’ capabilities on different layers. For instance, the ability to patent successfully in a given technological field is a strong predictor for the successful export of specific products and the publication of papers in specific scientific fields. Second, the technology layer is clearly the best precursor for both science and export, and in both cases the signal reaches its maximum after around 20 years: knowing a country’s preferred technologies today gives the highest predictive power for its preferred scientific fields and market sectors in about two decades. It is also the layer more difficult to influence: the capabilities in science and technology in a given year do not give any information on the technological activities in the future. Third, the scientific layer is both the most capability driven, its future activities being strongly related to the present tech-nological, production and even scientific activities, and the least informative about the future activities of the country. Importantly, a higher significance level corresponds to higher accuracy when predicting which activities countries will become proficient with in the future (see the Supplementary Information [Prediction Accuracy] for a recommender systems approach26 to this task).
Notice however that we are not giving a direct causal interpretation, saying for instance that there is no impact of science on technology. Rather we measure conditional probabilities for the co-occurrence of activities within the same country at a given time delay. From this viewpoint, having more signal going from present technology to future science than the viceversa is less counterintuive, because the technological spillovers of scientific activ-ities are not appropriable by the economic actors in a country, while patented technologies are. In other words, the chance of someone producing a new patent after reading a scientific paper is not easily appropriable by the country, while possible advances of science due to new technologies (like the discovery of superconductors after advancements in cryogenic techniques) are more likely to be localized in the same country. Moreover, while a technology can have a deep impact on specific scientific fields, scientific research can potentially lead to wide technology spillovers in every fields (think for instance of scientists at CERN inventing the World Wide Web), which however leave no footprint in our signal. Nevertheless we can confidently say that knowing the technolog-ical portfolio of a country gives more information on the future scientific fields than the opposite.
Figure 2. Multilayer network of broadly aggregated activities. The network includes 23 scientific major
categories, 25 technological sub-sections, and 21 product sections. Links are obtained using a significance level of 99.999%. To increase the signal-to-noise ratio, we compute B as the average of three consecutive years in the middle of our sample (2008–2010). Red triangular nodes represent technologies, yellow squared nodes represent scientific fields and finally blue circle nodes represent the export of products. The node sizes are proportional to their degree.
Overall, the methods and techniques we presented – in addition to shed light on the dynamics of innovation – can find invaluable use to forecast the scientific fields and market sectors in which countries can have (and will have) a competitive advantage based on their current patent portfolios (see27 and the Supplementary Information
[Case Study 1 and 2] for instances of implementation of our methodology by international organizations for policy making and applied research). The technical capabilities a country possesses today will define the scientific and market opportunities for the next generation.
Methods
Data.
The data that support the findings of this study are available from www.scival.com (SciVal), www.epo.org/ searching-for-patents/business/patstat (PATSTAT) and https://comtrade.un.org/ (UN COMTRADE), but restrictions apply to the availability of these data, which were used under license for the current study, and so are not publicly avail-able. Processed data on coarse-grained Assist matrices are however available from the authors upon reasonable request.Science. We use data on scientific productivity and impact of countries collected from the SciVal platform, a
new API aggregating data from Scopus. The database covers journals, trade publications, book series, conference proceedings, and books. Note that while Scopus was shown to have a broader coverage than Web of Science, and to have a more reliable classification system than Google Scholar, analyses based on either of these databases usually yields very similar results—especially when performed at the country level28.
Collected data cover years from 1996 to 2013 and refer to the corpus of scientific publications, each belonging to a given scientific sector (or sub-sector). Data are then aggregated at the country level, so that Wc,sS(y) is the number of
sci-entific documents produced by country c in scisci-entific sector s during year y. Note that these values are computed using a full counting method for internationally co-authored papers, which may cause a bias towards small countries with high level of internationalization to the detriment of large standalone countries29. Biases can arise also for anglophone
countries in Social Science and Humanities, as documents written in other languages and published in national jour-nals—which are important especially in such sectors—are not covered in full30. However, these sectors are presumingly
less connected to patenting and productive activities, and as such do not hinder the results of our analyses.
Figure 3. Sample analysis for “export of Desktop Computers” (Harmonized System code 847149) in 2006–
2010. The radar plots (a,b) show how a successful export in Desktop Computers is related to the various technology (a) and science (b) fields in 2004–2008. The blue contour corresponds to the empirical values of the assist matrix B, while the black line denotes the 95% confidence interval under the null model (we do not report the 5% confidence interval here). A technological or scientific field is significantly related to the export of Desktop Computers if the blue silhouette exceeds the confidence interval. We can thus see that while (a) shows many fields where co-occurrences are not explained by random noise, (b) shows that only a few fields are significantly above the noise, and barely so. Panel (c) reports a higher resolution analysis with technological section “G: Physics” expanded in its classes (three digits codes) and sub-classes (four digits codes) on the horizontal axis. Blue and black lines have the same meaning of panels (a) and (b). The peaks in “G06” corresponds to the “Computing” class.
Technology. We use patent data contained in PATSTAT to measure technological capabilities of countries.
PATSTAT collects all the patents (approximately 100 millions) by different Patent Offices (almost 100) all around the World. The time span is extremely broad, going from mid-19th century to today. Patent Offices organize knowledge by tagging each patent with one or more codes from the International Patent Classification (IPC). IPC codes define a hierarchical classification consisting of six levels (sections, sub-sections, classes, sub-classes, groups,
sub-groups), ranging between 8 and over 70 thousand codes (note that we discard classes “99” and sub-classes
“Z”, as they represent other technologies not classified in other classes or sub-classes, and they are therefore not well defined). PATSTAT also records the country of origin of the applicant (usually a firm) of each patent. Finally, PATSTAT defines “families” of patents according to primary citations among them31, i.e., all patents with
com-mon priorities. Indeed, multiple patents could be referred to the same innovation, for example because the same firm applied to different patent offices to extend the protection of their patent to wider markets, or because spe-cific patent offices have heterogeneous regulation about the limits of one patent. In particular we use INPADOC families, or extended family, which collects all the documents that are directly or indirectly linked by one or more priorities.
Figure 4. Average interactions between layers for varying time lag Δy. In panel (a), each plot displays the signal
ΦL1→L2( )Δy given by the fraction of significant links going from the activities of layer L1 to the activities of layer L2. L1 varies across rows and L2 varies across columns, the order being Technology, Products and Science. The time series are build aggregating three years at a time and looking at all the possible pair of years giving the desired Δy. The shaded area denote the one sigma confidence interval. The analysis is done at a medium level of disaggregation: Technology is split in subclasses (~600), Production at 4 digits level (~1000) and Science in categories (~300). Dashed black lines mark the noise level Φ = 1%, as we consider significant links at the 99% confidence interval. The same analysis with a longer time frame is reported in panels (b) and (c) respectively for
The basic units of observation are thus the families of patents. Each family is related to one or more countries, through the origin of the applicants of the patents in the family, and one or more technological code. Of course the technological codes depend on the aggregation used. In constructing the matrices, we assume that each family counts as a unit and thus weights accordingly within the matrix. Hence, for each family found in our dataset in a given year, we evenly split its unit of weight among all the technology codes and all the countries it maps to, for the years in which there were applications for patents in that family. With these caveats in mind, we define Wc,tT(y)
as the number of patent families, or the attributed parts of such families, in the field t (indexed by its IPC code) applied (i.e., filed, not granted) by firms located in country c on year y.
Products. To proxy economic production we use the BACI export data, recorded by the UN COMTRADE and
processed by CEPII32. The original database reports the import-export flows among countries with a data span
20 years, from 1995 to 2014. This database includes about 5000 products classified according to the Harmonized System 2007 of the World Customs Organization, which denotes them with a set of 6-digits codes organized in a hierarchical way. A given code is divided into three 2-digit parts, each specifying one level of the hierarchy. Hence, the first part indicates the broadest categories, such as “live animals and animal products” (01xxxx) or “plastics and articles thereof” (39xxxx). The second two digits specify further distinctions in each category, such as “live swine” (0103xx) or “live bovines” (0102xx), while the last two digit are even more specific. The trade flows are quantified in thousands of current US dollars. After a data sanitation procedure, a country-product matrix is obtained, whose generic element Wc,pP(y) represents the monetary value of the overall export of country c for
product p during year y.
Note that by using these data we are implicitly assuming that export is a good proxy for production. Even if this hypothesis is frequent in the economic complexity literature13,14, we stress that since we are interested in
quantifying the capabilities and the competitiveness of countries, using export themselves could be even better than using data on production. Indeed, the very fact to be able to export competitively a given product is an even clearer signal of having the required capabilities, being instead production biased by country-based effects and internal demand. In this respect, internal demand can represent a capability itself, required to develop a compara-tive advantage. Note also that UN-COMTRADE data take into account the re-exports of countries and so imports do not need to be taken into considerations.
A final remark on these data is in order. We measure exports according to their value in dollars, a rather dif-ferent unit than “number of documents” used for Science and Technology. In these two latter cases, however, the output of countries can be assessed using not only such number, but also the backward citations accrued by those documents — which may be close to the notion of “value”. In the Supplementary Information [Robustness Check] we discuss the various pros and cons of this choice with respect to the aims of the present study, and perform a robustness check by showing that our results are qualitatively unchanged by using backward citations instead of number of documents.
Analytical techniques.
Revealed comparative advantage. Given the raw matrices {WL(y)} for L ∈ {S, T, P}and for the different years y, described in the section above, the first task is to determine whether a given country
c shows a comparative advantage in activity a (belonging to layer L), both with respect to other countries as well
as to other activities of the same kind. This is achieved through the revealed comparative advantage (RCA)33, an
intensive metric computed as the ratio between the weight of activity a in the activity basket of c and the weight of activity a in the total world activity. As a comparative advantage is revealed if RCA > 1, we binarize the raw matrices to obtain new matrices {ML(y)}:
= ∑ ∑ ∑ ≥ . ′ ′ ′ ′ ′ ′ ′ ′ M y( ) 1 if W yW( )( )y W yW ( )( )y 1, 0 otherwise (2) c aL c aL a c aL c c aL c a c aL , , , , , ,
While originally developed in the economic context, the use of the RCA-like metrics is also common in stud-ies of scientific and technological activitstud-ies (see for instance34–38). The use of the same RCA formulation for the
different layer here is mainly motivated by having a coherent way to build them. Note that the RCA filter is properly normalized by making quantities related to different countries, activities and years comparable. Take for instance the Science layer: by assessing the number of papers of a country in a given year and a given scientific sector against the overall world count for that year and that sector, we get rid of both temporal variations and sec-tor differences39. And when number of citations is used instead of number of papers, the RCA filter also removes
the bias towards old papers which had more time to accrue citations than recent ones40 (however, the small
num-bers typical of recent years can lead to less reliable results). The RCA normalization is also particularly useful to weaken the various issues affecting patent data (see below).
Finally note that the RCA, the standard metric used in economic complexity studies, does provide an effective overall measure for how competitive a country is at the global level, but not a specific assessment with respect to each other country to which the exports are directed. Yet taking into account these “local” effects would require introducing additional parameters and arbitrary assumptions. On one hand this could generate uncontrolled statistical biases; on the other hand, increasing the dimensionality of the problem (i.e., increasing the number of variables) can increase spurious mixing of data and thus reduce the time-scale of prediction.
The multilayer space. Once the binary matrices {ML(y)} are defined, we build the multi-layer space connecting
layers (L1, L2) ∈ {P, T, S}, in order to assess whether countries having a comparative advantage in activity a1 ∈ L1 in year y1 are more likely to have an advantage also in activity a2 ∈ L2 in year y2, we have to perform an appropriate contraction of M ( )L y
1
1 with M ( )L y
2
2 over the country dimension (i.e., the set C of countries), and take the element
(a1, a2). The detailed prescription to build the Assist matrix derives from the so called probabilistic spreading approach41.
Let us consider a bit of information placed on a generic activity a1 in layer L1. We aim at describing how this information can spread to activities in layer L2. As first step, information jumps to countries according to the connection patterns of M ( )L y
1
1 : the transition probability that the bit of information goes from a1 to a given
coun-try c is ρaL→→cC( )y =M ( )y u ( )y c aL aL 1 , 1 1 1 1 1 1 11 , where u ya ( )= ∑∈ M ( )y L c C c aL 1 , 1
11 11 is the ubiquity (or degree) of a1 in L1 for
year y1. We thus assume equal transition probabilities for countries having a comparative advantage in a1, which is motivated by the maximum uncertainty principle since we do not want to introduce biases in the processes. As second step, information located on countries jumps to activities in layer L2, now following the connection patters of M ( )L y
2
2 . Again assuming maximum uncertainty, the transition probability that the bit of information goes from
c to a given activity a2 in layer L2 is ρc aC L→→2( )y2 =Mc aL, ( )y d2 cL( )y2
2
2
2 2 , where d y( )= ∑M y( )
cL2 2 a c aL,2 2 is the diversifica-tion (or degree) of country c in layer L2 for year y2. Putting these two steps together, the probability that the bit of information jumps from activity a1 ∈ L1 to activity a2 ∈ L2 finally reads:
∑
ρ ρ =∑
≡ . ∈ → → →→ ∈ → → y y u y M y M y d y B y y ( ) ( ) 1 ( ) ( ) ( ) ( ) ( , ) (3) c Ca c L C c aC L aL c C c aL c aL cL a a L L 1 2 1 , 1 , 2 2 1 2 1 1 2 2 11 1 1 2 2 2 11 22The above equation defines a bipartite network between layers L1 and L2, which can be interpreted as the flow of information from activities in L1 in year y1 to activities in L2 in year y2 (i.e., after a given time). We can interpret the connections of this network as conditional probabilities Pr(a2; y2|a1; y1) according to the following considerations.
• The bit of information (know-how) associated with a generic activity a1 is transferred to the various activities in L2 through the countries having a comparative advantage in a1.
• In order to account for the highly competitive nature of countries’ development dynamics (be it scientific, technological or economic), we can naturally assume that transferring the know-how from a1 to any activity
a2 is not convenient for all countries. In particular, in order to get a competitive advantage from a1, a given country c active in a1 will put an effort in such a transfer which at first approximation is inversely proportional to the number of countries having a1 in their activity baskets. Thus, the probability that country c exploits the information provided by a1 is given by:
ρ | ≡ →→ . c a y y Pr( ; ) aL cC( ) (4) 1 1 1 1 1
• When a country c transfers its know-how in a1 to activities in L2, it is natural to assume that a specific activity
a2 will be chosen with a probability inversely proportional to the number of activities in L2 in which country
c is active. This assumption derives from the finite and fixed amount of resources every country is endowed
with for activity transfer. Thus, the conditional probability for the transfer of know-how from activity a1 to activity a2 performed by a given country c reads:
ρ ρ ρ ρ | | ≡ = →→ →→ →→ →→ Pr a y c a y Pr c a y y M y y y y ( ; ; ; ) ( ; ) ( ) ( ) ( ) ( ) ( ) (5) c aC L c aL aL cC c aC L aL cC 2 2 1 1 1 1 2 , 1 1 2 1 2 2 1 1 1 1 2 2 1 1
where the term Pr(a2;y2|c;a1;y1) contains the dependence on the starting point through Mc aL, 1 11( )y , yet the final equality holds since
= Mc aL, ( )y1 Mc aL ( )y 2 , 1 1 1 1 1 .
Finally, the probability composition formula to assess the transition probability from activity a1 to activity a2 leads directly to Eq. (3):
∑
≡ | = | | . →→ ∈ B ( , )y y Pr a y a y( ; ; ) Pr a y c a y Pr c a y( ; , ; ) ( ; ) (6) aL aL c C 1 2 2 2 1 1 2 2 1 1 1 1 11 22Note that the time direction of the process is given by the time lag y2 − y1. In the case y1 > y2, Eq. 3 remains unchanged (still representing the transition probability from a1 to a2), but the interpretation in terms of informa-tion flows is the opposite: BaL11→→aL22( , )y y1 2 becomes the probability that a bit of information reaching activity a1 ∈ L1 originally came from activity a2 ∈ L2.
Statistical hypothesis testing. To assess the statistical significance of elements of the Assist matrices, we resort
to a null model for the bipartite matrices {ML(y)}, built by randomly reshuffling their elements (i.e., the network
connections of layer L), but preserving country diversifications and activity ubiquities (i.e., degrees). This means that we wipe out the signal coming from the network connectivity patters, beyond that encoded by the degree val-ues. Yet in order to formalize the null model analytically (and thus avoid relying on a conditional uniform graph test42), degree constraints are imposed on average—as for the Canonical ensemble in Statistical Mechanics. We
thus end up with a null hypothesis described by the Bipartite Configuration Model (BiCM)22, an extension of the
standard Configuration Model43 to bipartite networks.
Formally, the BiCM null model for a given matrix ML(y) is defined as the ensemble ΩL(y) of bipartite network
configurations which are maximally random, except for the ensemble average of the degrees that are constrained to the values observed in the empirical network: 〈d ycL( )〉ΩL( )y =d ycL( ) ∀c ∈ C and 〈u yaL( )〉ΩL( )y =u yaL( ) ∀a ∈ L. To ease the notation, in the following we omit the explicit dependence of quantities on the layer L and year y, which do not vary throughout the construction of the BiCM. Furthermore, we use symbols with the tilde for quantities assessed on null model configurations, and without the tilde for observed values.
Let ∈ Ω∼M be a network configuration in the ensemble and P M( ) be the probability of that graph within the ∼ ensemble. Following the statistical mechanics prescriptions, the least biased choice of probability distribution is the one that maximizes the Gibbs entropy
∑
= − ∼ ∼ ∈Ω ∼ S P( ) ln ( ),M PM (7) Msubject to the normalization condition ∑∼M∈ΩP M( )∼ =1 plus the constraints:
∑
∑
〈 〉 = = ∀ ∈ 〈 〉 = = ∀ ∈ . ∼ ∼ ∼ ∼ Ω ∈Ω Ω ∈Ω ∼ ∼ d P d d c C u P u u a L M M M M ( ) ( ) , ( ) ( ) (8) c c c a a a M MIntroducing the respective Lagrange multipliers ω, {μc}c∈C and {νa}a∈L (one for each country and activity of the
network), the probability distribution that maximizes the entropy satisfies, for all configurations ∈ Ω∼M :
∑
∑
∑
∑
∑
δ δ ω μ ν = + − + − + − . ∼ ∼ ∼ ∼ ∼ ∼ ∈Ω ∈ ∈Ω ∈ ∈Ω ∼ ∼ ∼ P S P d P d u P u M M M M (M) M) 0 ( ) 1 ( ) ( ) ( ) ( (9) c C c c c a L a a a M M M The solution is:μ ν μ ν
| =
∼ − ∼| μ ν
P( { }, { })M c a e H(M { },{ })c a / ({ }, { }),Z c a (10) where H M( { }, { })∼|μc νa is the graph Hamiltonian and Z({μc},{νa}) is the partition function
∑
∑
μ ν μ ν | = + ∼ ∼ ∼ ∈ ∈ H( { }, { })M d( )M u( ),M (11) c a c C c c a L a a∑
μ ν = ω+ = μ ν . ∈Ω − | ∼ ∼ Z({ }, { }) e e (12) c a H M M 1 ( { },{ })c aEquations (10), (11) and (12) define the BiCM model, namely the distribution over a specified set of network configurations that maximizes the entropy subject to the known constraints. As we are considering local con-straints (the degrees), we can work out on Eq. (10) to obtain22:
∏ ∏
μ ν π π | = − ∼ ∈ ∈ ∼ ∼ P M( { }, { }) (1 ) , (13) c a c C a L c a M c aM ,c a, , c a,where πc,a is the ensemble probability for the connection between country c and activity a:
∑
π μ ν η θ η θ = 〈 〉 = | = + ∼ ∼ ∼ Ω ∈Ω ∼ M M P M( { }, { }) 1 (14) c a c a c a c a c a c a M , , ,with ηc = e−μc and θa = e−νa. Note that in Eq. (13) the network probability is obtained as the product of connection
probabilities over all possible country-activity pairs, meaning that in the BiCM context links results as independ-ent random variables. The probability distribution in Eq. (13) yet depends on the values of the Lagrange multipli-ers, which have to be estimated as:
μ μ ν ν μ ν − ∂ ∂ = 〈 〉 ∀ ∈ − ∂ ∂ = 〈 〉 ∀ ∈ . Ω Ω Z d c C Z u a L ln ({ }, { }) ln ({ }, { }) (15) c c a c a c a a
To obtain the numerical value of the ensemble average of the constraints, we maximize the log-likelihood function:
∑
∑
∑ ∑
μ ν μ ν η θ η θ = | = + − + ∈ ∈ ∈ ∈ P d u M ({ }, { }) ln ( { }, { }) ln ln ln(1 ), (16) c a c a c C c c a L a a c C a L c awhich means solving the system of |C| + |L| equations in |C| + |L| unknowns:
∑
∑
∑
∑
π η θ η θ π η θ η θ = = + ∀ ∈ = = + ∀ ∈ ∈ ∈ ∈ ∈ d c C u a L 1 1 (17) c a L c a a L c a c a a c C c a c C c a c a , ,Connection probabilities of Eq. (14) are now well defined, and can be used to directly sample the ensemble of bipartite configurations or to compute the quantities of interest analytically.
Reintroducing in the notation the explicit dependence on the layer L and year y, we finally build the null model ΩL→L( , )y y
1 2
1 2 for the Assist matrix from layer L
1 at y1 to layer L2 at y2. This is done by contracting the two BiCMs for the matrices M ( )L y
1
1 and M ( )L y
2
2 along the country dimension, as for Eq. (3). We have:
∑
= . ∼ ∼ → → ∈ B y y u y M y M y d y ( , ) 1 ( ) ( ) ( ) ( ) (18) aL aL aL c C c a L c a L cL 1 2 1 , 1 , 2 2 1 2 1 2 11 1 1 2 2 2 The distributions of → → BaL1 aL2( , )y y1 21 2 values describing the null model can be in principle obtained using exact
techniques23,24. Due to the non-Gaussianity of such distributions, here we resort to a more practical sampling
tech-nique. We thus use Eqs. (14) and (18) to generate null Assist matrix networks, and populate the ensemble ΩL→L( , )y y
1 2
1 2 to estimate the full distributions. The generic observed element BaL→→aL( , )y y
1 2
11 22 is then deemed
statisti-cally significant depending on the p-value that we can infer from its distribution under the null hypothesis. The specific threshold for statistical significance and the size of the generated ensemble vary on the exercises performed (as highlighted in the text). It is useful to recall that the two choices, the threshold and the size of the ensemble, are not unrelated: the higher the threshold we want to test, the bigger the sample we require. At the very least, if we set a 99% threshold we naturally need at least 100 realizations of the null model to distinguish empirical points overcom-ing the threshold, whereas, at least 1000 realizations would be required to test against a 99.9% threshold. While this bare minimum is not enough if we want to test a specific link, it could be enough when, as in Fig. 1 of the main text, we just want to check the share of significant links out of a large sample. This is indeed the case of the last exercise, whose results are reported in Fig. 4 of the main text. There we fix a pair of layers (L1, L2) and a given aggregation level. Then, for a given time lag Δy, we set a measure of signal-to-noise ratio ΦL1→L2( )Δy equal to average percentage, over the different years y, of significant connections observed in the matrix BL1→L2( ,y y+ Δy) using a threshold of 95%. Therefore, we expect ΦL1→L2( )Δy 5% when no signal is found.
Scale of analysis. The scale of the analysis (i.e., the aggregation level of data) is crucial when performing the various
exercises. Indeed, even if we do not use an explicit notation, any analysis can be performed at different aggregation levels, in multiple dimensions. First, trivially, we can perform the analysis at different aggregations along the different activities. At a very broad aggregation we can consider “Physics” as one scientific activity, while at a finer aggregation we can consider any subfield of Physics as an activity. Second, we can compute co-occurrences at different geographical aggregations: we can look if two activities co-occur in the same countries, or in the same regions. Third, we can look at different temporal aggregations: we can compute the raw matrices WT(y) looking at the patents produced in one month,
in one year or in five years. The choice of the scale of observation can be a relevant ingredient to look at specific effects: for example the capabilities required at the country level to perform an activity, like “diffused security and education”, can be widely different from the capabilities required at the local level, like “infrastructure” or a specific “climatic con-dition”. In other situations, the choice of the scale of observation can be driven mostly by our specific interest in a more or less granular result. This is for example shown in Fig. 3 of the main text, where we look at the technological fields required to kick-start the export of Desktop Computers at different technological resolutions.
There are however practical reasons constraining the possible resolutions which can be accessed. Data availability is indeed a critical issue. For example, while patents can be assigned to a region at any different scale, both by looking at the address of the inventors and at the address of the assignee firm, exports are recorded by customs and are therefore not easily available at finer geographical resolutions. In general, if we are looking at the same time at scientific papers, patents, and exports, the common geographical resolution cannot be finer than the country, and the time interval can-not be shorter than one year. The second constraining reason is the statistical power of our tests. The finer the activity or time resolution, the less the signal to noise ratio is required to validate each link. This is due to the fact that there will be less activities of a specific kind in a short time, and therefore randomness can play an important role. We have therefore a trade-off, a sort of indetermination principle: if we are interested at specific activities, we have to increase the time window by pooling different years. This can be done both by summing up the matrices for the years in the time interval, or by stacking the matrices by considering different yearly observations of the same country as different rows, as in17.
This is what we do in the paper when we say that we pool different years. Otherwise, when we are interested in a finer time analysis, like that generating Fig. 4 of the main document, either we look at very aggregated fields or, like we do in that analysis, we ignore the specific fields and we simply look at the number of significant fields.
typical issues with the use of patents data.
There are several issues about measuring technological outputs of countries by patents counting. First, in different fields there is a very different propensity to patenting, and such propensity can vary in time following technological or institutional changes44. Second, differentcoun-tries have different institutional frameworks providing heterogeneous incentives to patenting. Third, partially related to the previous two points, patenting can have different purposes (e.g., defensive patenting) other than the protection of a specific output business-related R&D. Fourth, not all technology is patented, and in particular patent holders may also expect future returns, therefore a technological indicator based on patents can have a natural relation with industrial productivity. These issues are common to the literature on patents, and are actually less problematic in our case – since we are using the RCA binary filter (indicating whether a country c reveals a competitive advantage in field t in year y), and not actual values. Indeed, by computing the RCA each field spe-cific, country spespe-cific, time spespe-cific, field-time specific and country-time specific possible bias is washed away by the RCA measure itself. There are still possible biases related to country-field specific effects (e.g., regulations are stricter in Europe than US in patents related to ICT) that have to be acknowledged as possible limitations.
A further issue is related to the limited presence of patents in some parts of the technological spectrum. Other than the already discussed sector-specific potential biases, there are biases related to the specific kind of innovation and to the motives behind innovation. For example, due to the monetary cost and monetary reward of patents, patenting is focused on innovations with a strictly economic advantage, i.e., innovations for which the inventors can extract an important part of the value added of it. This is in sharp contrast, for example, with scientific research, where different motives (prestige, but also interest and curiosity) lead the choices of actors. In the light of this issue, we could expect that patent data can have a high forecasting power when considering production and export, but could fail to properly forecast future scientific progress. The strong signal observed in the determination of future scientific fields is however reassuring. If anything, had we additional data other than patents at our disposal to represent the technology output of countries, and to properly measure non economically-viable innovation, we could have expected an even higher signal from technology to science.
Received: 18 December 2018; Accepted: 22 October 2019; Published: xx xx xxxx
References
1. Lundvall, B. & Johnson, B. The learning economy. Journal of Industry Studies 1, 23–42 (1994). 2. Nelson, R. R. National Innovation Systems: A Comparative Analysis (Oxford University Press, 1993). 3. Florida, R. The Rise of the Creative Class–Revisited: Revised and Expanded (Basic Books, 2014). 4. Romer, P. M. Endogenous technological change. Journal of Political Economy 98, S71–S102 (1990).
5. Dosi, G., Freeman, C., Nelson, R., Silverberg, G. & Soete, L. (eds) Technical Change and Economic Theory (Pinter Publishers, 1988). 6. Bozeman, B. Technology transfer and public policy: A review of research and theory. Research Policy 29, 627–655 (2000). 7. Hughes, T. P. The seamless web: Technology, science, etcetera, etcetera. Social Studies of Science 16, 281–292 (1986).
8. Etzkowitz, H. & Leydesdorff, L. The dynamics of innovation: from national systems and “mode 2” to a triple helix of university-industry-government relations. Research Policy 29, 109–123 (2000).
9. Gittelman, M. & Kogut, B. Does good science lead to valuable knowledge? biotechnology firms and the evolutionary logic of citation patterns. Management Science 49, 366–382 (2003).
10. Hirschman, A. O. The Strategy of Economic Development, vol. 10 (Yale University Press, 1958).
11. Teece, D. J., Rumelt, R., Dosi, G. & Winter, S. Understanding corporate coherence: Theory and evidence. Journal of Economic
Behavior and Organization 23, 1–30 (1994).
12. Nesta, L. & Saviotti, P. P. Coherence of the knowledge base and the firm’s innovative performance: Evidence from the us pharmaceutical industry. The Journal of Industrial Economics 53, 123–142 (2005).
13. Hidalgo, C. A. & Hausmann, R. The building blocks of economic complexity. Proceedings of the National Academy of Sciences 106, 10570–10575 (2009).
14. Tacchella, A., Cristelli, M., Caldarelli, G., Gabrielli, A. & Pietronero, L. A new metrics for countries’ fitness and products’ complexity.
Scientific Reports 2, 723 (2012).
15. Cimini, G., Gabrielli, A. & Sylos Labini, F. The scientific competitiveness of nations. PLoS ONE 9, e113470 (2014).
16. Hidalgo, C. A., Klinger, B., Barabási, A.-L. & Hausmann, R. The product space conditions the development of nations. Science 317, 482–487 (2007).
17. Zaccaria, A., Cristelli, M., Tacchella, A. & Pietronero, L. How the taxonomy of products drives the economic development of countries. PLoS ONE 9, e113770 (2014).
18. Gao, J., Zhang, Y.-C. & Zhou, T. Computational socioeconomics. Physics Reports 817, 1–104 (2019).
19. Klimek, P., Hausmann, R. & Thurner, S. Empirical confirmation of creative destruction from world trade data. PLoS ONE 7, e38924 (2012).
20. Boccaletti, S. et al. The structure and dynamics of multilayer networks. Physics Reports 544, 1–122 (2014).
21. Owen-Smith, J. & Powell, W. W. Knowledge networks as channels and conduits: The effects of spillovers in the boston biotechnology community. Organization Science 15, 5–21 (2004).
22. Saracco, F., Di Clemente, R., Gabrielli, A. & Squartini, T. Randomizing bipartite networks: The case of the world trade web. Scientific
Reports 5, 10595 (2015).
23. Gualdi, S., Cimini, G., Primicerio, K., Di Clemente, R. & Challet, D. Statistically validated network of portfolio overlaps and systemic risk. Scientific Reports 6, 39467 (2016).
24. Saracco, F. et al. Inferring monopartite projections of bipartite networks: An entropy-based approach. New Journal of Physics 19, 053022 (2017).
25. Cimini, G. et al. The statistical physics of real-world networks. Nature Reviews Physics 1, 58–71 (2019). 26. Lü, L. et al. Recommender systems. Physics Reports 519, 1–49 (2012).
27. Pugliese, E. & Tübke, A. Economic complexity to address current challenges in innovation systems: a novel empirical strategy for regional development. Industrial R&I – JRC Policy Insights (2019).
28. Waltman, L. A review of the literature on citation impact indicators. Journal of Informetrics 10, 365–391 (2016).
29. Aksnes, D. W., Schneider, J. W. & Gunnarsson, M. Ranking national research systems by citation indicators. a comparative analysis using whole and fractionalised counting methods. Journal of Informetrics 6, 36–43 (2012).
30. Nederhof, A. J. Bibliometric monitoring of research performance in the social sciences and the humanities: A review. Scientometrics
66, 81–100 (2006).
32. Gaulier, G. & Zignago, S. Baci: International trade database at the product-level. Working Papers 2010-23, CEPII research center https://ideas.repec.org/p/cii/cepidt/2010-23.html (2010).
33. Balassa, B. Trade liberalisation and “revealed” comparative advantage. The Manchester School 33, 99–123 (1965). 34. Soete, L. L. G. A general test of technological gap trade theory. Review of World Economics 117, 638–660 (1981).
35. Bowen, H. P. On the theoretical interpretation of indices of trade intensity and revealed comparative advantage. Weltwirtschaftliches
Archiv 119, 464–472 (1983).
36. Patel, P. & Pavitt, K. Uneven (and divergent) technological accumulation among advanced countries: Evidence and a framework of explanation. Industrial and Corporate Change 3, 759–787 (1994).
37. Kim, S. Expansion of markets and the geographic distribution of economic activities: The trends in US regional manufacturing structure, 1860–1987. The Quarterly Journal of Economics 110, 881–908 (1995).
38. Guevara, M. R., Hartmann, D., Aristarán, M., Mendoza, M. & Hidalgo, C. A. The research space: Using career paths to predict the evolution of the research output of individuals, institutions, and nations. Scientometrics 109, 1695–1709 (2016).
39. Radicchi, F., Fortunato, S. & Castellano, C. Universality of citation distributions: Toward an objective measure of scientific impact.
Proceedings of the National Academy of Sciences 105, 17268–17272 (2008).
40. Medo, M., Cimini, G. & Gualdi, S. Temporal effects in the growth of networks. Physical Review Letters 107, 238701 (2011). 41. Zhou, T., Ren, J., Medo, M. & Zhang, Y.-C. Bipartite network projection and personal recommendation. Physical Review E 76,
046115 (2007).
42. Zweig, K. A. & Kaufmann, M. A systematic approach to the one-mode projection of bipartite graphs. Social Network Analysis and
Mining 1, 187–218 (2011).
43. Park, J. & Newman, M. E. J. Statistical mechanics of networks. Physical Review E 70, 066117 (2004).
44. Hall, B. H. & Ziedonis, R. H. The patent paradox revisited: an empirical study of patenting in the US semiconductor industry, 1979–1995. The RAND Journal of Economics 32, 101–128 (2001).
Acknowledgements
This work was supported by the Italian PNR project CRISIS-Lab. G.C. also acknowledge support from the EU project CoeGSS (676547). The funders had no role in study design, data collection and analysis, decision to publish, or preparation of the manuscript.
Author contributions
All authors designed the study; E.P., G.C. and A.Z. performed the analysis; E.P., G.C., A.P., A.Z. and A.G. contributed data & methods and analysed the results. All authors reviewed the manuscript.
competing interests
The authors report no conflicts of interest. The findings, interpretations, and conclusions expressed in this paper are entirely those of the authors. They do not necessarily represent the views of the International Bank for Reconstruction and Development/World Bank and its affiliated organizations, or those of the Executive Directors of the World Bank or the governments they represent.
Additional information
Supplementary information is available for this paper at https://doi.org/10.1038/s41598-019-52767-5.
Correspondence and requests for materials should be addressed to G.C. Reprints and permissions information is available at www.nature.com/reprints.
Publisher’s note Springer Nature remains neutral with regard to jurisdictional claims in published maps and
institutional affiliations.
Open Access This article is licensed under a Creative Commons Attribution 4.0 International
License, which permits use, sharing, adaptation, distribution and reproduction in any medium or format, as long as you give appropriate credit to the original author(s) and the source, provide a link to the Cre-ative Commons license, and indicate if changes were made. The images or other third party material in this article are included in the article’s Creative Commons license, unless indicated otherwise in a credit line to the material. If material is not included in the article’s Creative Commons license and your intended use is not per-mitted by statutory regulation or exceeds the perper-mitted use, you will need to obtain permission directly from the copyright holder. To view a copy of this license, visit http://creativecommons.org/licenses/by/4.0/.