Tor Vergata University
Ph.D. in ‘Economic Theory and Institutions’
Thesis in ‘Economic History’
Three Essays on Nutrition and Economic
Growth. The Case of Italy: 1880-1960
Supervisor
Prof. Gianni Toniolo
Ph.D. Candidate
Luca Tasciotti
INDEX
THREE ESSAYS ON NUTRITION AND ECONOMIC GROWTH.THE CASE OF ITALY:1880-1960.
INTRODUCTION________________________________________________________________________ 4
CONTENT OF THE THESIS _________________________________________________________________ 4
DIET AS A WELFARE INDICATOR____________________________________________________________ 4
MACRO DATA VERSUS MICRO DATA_________________________________________________________ 6
THE HOUSEHOLD BUDGET DATABASE _______________________________________________________ 7
NUTRITION AS A MEASURE OF THE STANDARD OF LIVING? _______________________________________ 9
CONTENT OF THE THREE PAPERS __________________________________________________________ 11
THE EVOLUTION OF FOOD CONSUMPTION IN ITALY,1861-2001.ANALYSIS OF MACRO DATA ___________ 11
FOOD EXPENDITURE AS A MEASURE OF THE ITALIAN STANDARDS OF LIVING,1890-1960______________ 12
EXPENDITURE PATTERN IN ITALY,1875-1960.A COMPLETE QUADRATIC DEMAND SYSTEM ESTIMATION
WITH DEMOGRAPHIC VARIABLES__________________________________________________________ 14
CONCLUSION _________________________________________________________________________ 16
APPENDIX I ___________________________________________________________________________ 17
THE EVOLUTION OF FOOD CONSUMPTION IN ITALY,1861-2001.ANALYSIS OF MACRO DATA________ 20
INTRODUCTION________________________________________________________________________ 20
SECTION 1.FOOD CONSUMPTION IN THE LONG TERM __________________________________________ 22
SECTION 2.A REVISITATION OF THE THEORIES OF CONSUMPTION IN THE FIRST FIFTY YEARS OF ITALIAN
UNIFICATION _________________________________________________________________________ 24
SECTION 3.THE TWO WARS AND THE FASCIST PERIOD ________________________________________ 28
SECTION 4.CONSUMPTION IN THE MODERN EPOCH____________________________________________ 32
SECTION 5.CONCLUSIONS _______________________________________________________________ 35
APPENDIX I ___________________________________________________________________________ 38
APPENDIX II __________________________________________________________________________ 45
FOOD EXPENDITURE AS A MEASURE OF THE ITALIAN STANDARD OF LIVING,1890-1960 ____________ 49
INTRODUCTION________________________________________________________________________ 50
SECTION 1.1890-1960, MICRO DATA: SOURCES AND THEIR STORAGE______________________________ 53
SECTION 2.HOW DATA REPRESENTS THE POPULATION_________________________________________ 56
SECTION 3.NON RESPONSES AND DATA IMPUTATION__________________________________________ 60
SECTION 4.FOOD EXPENDITURE IN THE FAMILY BUDGET IN ITALY:1890-1960 ______________________ 63
SECTION 5.ENGEL CURVE AND THE PATTERN OF THE BUDGET SHARE _____________________________ 69
SECTION 6.CONCLUSIONS _______________________________________________________________ 72
APPENDIX I ___________________________________________________________________________ 74
EXPENDITURE PATTERN IN ITALY,1875-1960.A COMPLETE QUADRATIC DEMAND SYSTEM ESTIMATION
WITH DEMOGRAPHIC VARIABLES ________________________________________________________ 89
ABSTRACT ___________________________________________________________________________ 89
SECTION 1.INTRODUCTION ______________________________________________________________ 90
SECTION 2.THEORETICAL FRAMEWORK ____________________________________________________ 93
SECTION 3.DATA DESCRIPTION, SUB SAMPLES CREATION AND MISSING VALUES PROBLEMS____________ 98
SECTION 3.1.CREATION AND REPRESENTATIVENESS OF SUB SAMPLES_____________________________ 98
SECTION 3.2.DEALING WITH MISSING VALUES ______________________________________________ 100
SECTION 3.3.QUALITY OF DATA _________________________________________________________ 103
SECTION 4.EMPIRICAL RESULTS _________________________________________________________ 105
SECTION 5.DOES THE ITALIAN EXPERIENCE HELP US TO RESOLVE THE FOOD PUZZLE?CONCLUSIONS___ 112
APPENDIX I __________________________________________________________________________ 114
Three Essays on Nutrition and Economic Growth. The Case of Italy:
1880-1960.
Introduction
1Content of the thesis
The thesis studies the standards of living of Italians from the nutritional point of view through the use of micro and macro data on family expenditure. The thesis is composed by three papers:
1. ‘The Evolution of food consumption in Italy, 1861-2001. Analysis of macro data’ which studies the trend of macro variables related to the families’ nutrition and food consumption;
2. ‘Food Expenditure as a measure of the Italian Standards of Living, 1890-1960’ analyses the evolution of food expenditure in Italy through the use of micro data coming from family budgets;
3. ‘Expenditure Pattern in Italy, 1875-1960. A complete quadratic demand system estimation with demographic variables’ studies how family expenditure choices depend on a set of variables related to the prices of goods, to the total expenditure and to family size and composition.
Diet as a welfare indicator
The beginning of Italy’s ‘modern economic growth’ (à la Kuznets) can be dated to around the middle of the 19th century. Between the last decade of the 19th century and the first half of the 20th gross domestic product (GDP) per capita increased by 3.3 times and private consumption by 1.3 times (constant prices 1938). Over the same period of time, the Italian economy began to catch up with other advanced European countries. A comparison to the United Kingdom (UK) shows that in 1880 Italy’s GDP per person was only 45% of the UK’s but eighty years later (in 1930) it was 80%.
1
I would like to express my deep and sincere gratitude to my supervisors, Professor Gianni Toniolo and Professor Giovanni Vecchi. Their wide knowledge and their logical way of thinking have been of great value for me. Their understanding, encouraging and constant personal guidance have provided an excellent basis for the present thesis. I thank Prof. Albert Carreras, Prof. Stefano Fenoaltea, Prof. Nicholas T. Longford and Dr. Valentina Nigro for extremely helpful discussions and comments on various aspects of this thesis.
I wish to express my sincere thanks to the editors of this work, Michael Barbour, Fabienne Gousset and Brent Larson, to my family and to all the people who have supported me during this period of time.
This thesis will explain how this economic success impacted on the nutrition of Italians, and how these nutritional improvements were distributed. A study on the standard of living of a country requires computing if growth has been equal among all the social classes or if it produced gains only for some classes and losses for others.
Standards of living are a hot topic among historians, economists and economic historians. They all have all been working on new approaches to measure and assess the welfare of given populations. Body height, life expectancy at birth, literacy and aggregated indicators such as the human development index have all been used as indicators of the quality of life. In this thesis, the standard of living of Italians is discussed by considering per capita total expenditure and per capita food expenditure.
The importance of considering indicators related to nutrition is a pre-requisite in order to assess the standard of living of a country in its developing phase,. This point is clearly stated by Baudet and Van der Meulen (1982): “The consumption of principal foodstuffs and stimulants
(except alcohol), insofar as this can be established with sufficient certainty, is without doubt one of the most important data from which conclusions can be drawn about tendencies in national prosperity over a specified period of time. A nation is more prosperous the more amply it is able to provide for its need”.
Massimo Livi Bacci (1987) identified a very high correlation between a person’s nutrition and the occurrence of diseases such as cholera, diarrhoea, herpes, leprosy, breath infection, measles, tuberculosis, whooping cough and intestinal parasitosis.
The studies of McKeown (1979) continue in the same vein that arguably, in Europe and America, “the mortality rate dropped off in the 18th and 19th century primarily thanks to the increasing availability of food which leads to better nutrition”. Thus, “from the second half of the
19th century, an individual’s nutritional improvement has reduced the exposition to infectious diseases”.
Nutrition has always been a controversial and fleeting topic: always revealing new suggestions and approaches to understanding it better. This is the case because studies on nutrition have economic implications which merge with sociological, anthropological and religious matters and the researchers always needs to face the tri-dilemma about what is eaten, why it is eaten and what is available to be eaten.
The nutrition issue is made more complex by the fact that official statistics on food consumption are often imprecise as they do not take into consideration objective factors which often have an influence on the diet and do not specify how each family allocate food within its
the part of the diet deriving from self-consumption or consumption of groceries cultivated in the State demesne and who did not eat at home because they were daily employed in the fields where it was impossible to return home to eat.
Macro data versus micro data
One of the novel aspects of the thesis consists of the use of micro data regarding family budgets, a relatively new source of data in Italy.
On the contrary, data on average per capita food expenditures, which represents the base for macro series, are easier to find. Data on food production, changes in their inventories and net exports have been collected in a more continuous way.
Italian Macro series on food expenditures cover only the whole of the country, while - as it is well known– marked regional differences in income are a strong feature of Italy’s long-term growth pattern. Moreover, macro series on food consumption:
1. are currently challenged for 1861 and 1911;
2. there are methodological inconsistencies across periods;
3. allow only the study of mean values (whereas variance is particularly relevant).
These problems have led most economic historians interested in nutrition to focus on rather short periods of time, thus missing the long run view.
The recent use of family budgets, as in Rossi, Toniolo Vecchi, aims at gaining a more detailed view of consumption than is possible by aggregate statistics alone. Family budgets if sufficiently numerous, and comparable over time:
1. allow a check on the aggregate statistics;
2. allow for geographical and sectoral disaggregation;
3. may provide more detailed information about specific components of the diet.
Micro data on family consumption can be considered the optimal source of data in order to avoid vagueness and imprecision. Valeri (1977) insisted that micro data in their self do give a truncated image of the food consumption phenomena if the right mix of statistical methodologies are not used. ‘Many historians pretend to study nutrition of Italians taking into consideration isolated
groups of people such those living in convents, noble houses and ships, thus failing to represent the diversity of the Italian population’.
The household budget database
Before 1970, Italian researchers missed the use of various aspects of economic history in their statistical analysis and preferred to study only the social and political aspects of life in Italy. Starting from approximately 1970, analysis regarding the Italian economic history has been enriched by studies based on the trends of ‘macro’ variables and their comparison with other European economies. Such studies used the trend of GDP per sector of activity and that of expenditure (Rossi et al., 1993), kilocalories (Federico, 2003), the standard of living in a circumscribed period (Fenoaltea, 2002) and nutrition and expenditure choices in the long run (Zamagni, 1998).
Quantitative micro data based analysis on the standard of living and nutrition of Italians started in the last decade and are, thus, in a very initial phase. Those analysis are concentrated on some particular aspects of the welfare: income distribution, consumption pattern and the relationship between nutrition and growth (Vecchi, 1999; Rossi, Toniolo and Vecchi, 2001; Vecchi and Coppola, 2006). To be in line with the previous analysis, the current thesis represents an attempt to study one aspect of the standards of living, quantifying and analysing the total family expenditure for distinct categories of households over the long run.
The current thesis enjoys the findings and the researches of a group of scholars based in the university of Tor Vergata. Their works, as well as all the data previously collected, constitute the basis of the analysis presented here. The research of new data regarding family budgets, their reclassification in a homogeneous dataset and part of the statistical analysis, which is the core of the thesis, has the origin and uses tools previously applied in the papers cited above. It must be said that the experience acquired by the previously named senior economists, in more than ten years of work devoted to such issues, has been a constant and robust source of help in developing this thesis. It is not intended that the studies to date represent an end to the historic study of the Italian standard of living. They rather constitute a new starting point for those who wish to enrich and pursue such an interesting and alive issue.
The fulfilment of the thesis on the Italian standard of living is based on the analysis of micro data that has required several steps which can be summed up in the following four phases:
1. conduct of ‘field work’ in order to look for new data on Italian family budgets in different archives in the main Italian cities;
2. design of a Questionnaire which was meant ad hoc to organize the data; 3. compilation of data including data entry and quality control;
Compared to the other works based on data on Italian family budgets, this research can boast a larger number of observation (approximately 50 per cent more than other studies to date). The sources of the additional data is not unique and has its derivation from many types of sources since ‘learned men such as anthropologists, nutritionists, chemists, social scientists, politicians,
intellectuals, and philanthropists practiced the art of compiling household budgets’ (Vecchi and Coppola, 2006). ‘Field works’ consisted of intensive researches in public and private archives and libraries in Italy.
The total number of family budgets collected and used for this research is 8,918. For a detailed geographical distribution of the family budgets see Table 1. Table 1 also indicates whether the head of the household is employed in the agricultural sector or in other sectors of activity.
New and ‘old’ data have been organized in a data set, later called a ‘Questionnaire’, in order to have an homogeneous organization to the data. The structure of the Questionnaire takes the form of a survey known as ‘Living Standards Measurement Study’ (LSMS) which was established by the World Bank in 1980 in order to monitor the standard of living for households in developing countries (Grosh and Gelwwe, 1995). When entering data regarding families into the
Questionnaire, we pretended the interviewee was alive answering to the survey. It is worth to notice that all the interviewees were deceased when the survey was designed and when data were entered into the Questionnaire.
The main feature of LSMS survey is the presence of multi-topic questionnaires designed to study multiple aspects of household welfare and behaviour. Accordingly to LSMS surveys, the
Questionnaire was designed to collect data on many dimensions of a household’s well-being, including expenditure, income, savings, employment, health, education, fertility, nutrition, housing and migration.
The Questionnaire designed for use in this study is divided into three specific sections each containing appropriate questions (Table 2):
1. the first is directed to the head of the household and collects aggregated data about the family;
2. the second is directed to each family component in order to collect detailed information on different aspects of each component’s life and
3. the third is again directed to the head of the household and aimed at surveying the presence of community infrastructures.
Several features of the Questionnaire help to minimize ‘interviewer’ or ‘interviewee’ errors. For example, the Questionnaire makes extensive use of ‘controls’ especially in the expenditure or income modules so that mistakes are automatically highlighted. Decision making during the data collection phase has been limited to circumstances in which the value of a variable did not match with the sum of all its components. This happens very infrequently and all mistakes, which were clearly obvious, have been corrected or the data was rejected.
There are two other issues that tend to compromise the quality of expenditure data. Both are associated with the fact that a majority of the families ‘interviewed’ were employed in the agricultural sector and families did not differentiate production and consumption. The first problem is that some households, especially small plot owners, hire some workers (as domestic servants or agricultural workers) and supply them with food. Food expenditure will therefore include food expenditures for items that are not consumed by the family. When food expenditures were not clearly consumed by just the family, the data was not considered.
The second problem relates to consumption of items produced by the family, typically food grown or raised on the farm. Such items, often referred to as auto or self consumption, are properly recorded although auto consumption is difficult to be valued. Some measurement errors might occur in this situation.
Other problems encountered were with regards to missing values and how the sample is related to the entire Italian population. The ‘missing values problem’ has been resolved by using two procedures called the ‘Missing Imputation by Chained Equations’ (MICE in the following text, Royston 2005) and the ‘Hotdeck Imputation Method’. MICE has proved to be an imputation technique superior to ‘hotdeck’ especially when many missing values are numerous (Royston, 2005).
The representativeness problem arises when sample units have not been chosen following a sample design. This happened here since it was not possible to design a sample strategy; the observations, i.e. families, were surveyed randomly. In order to let the sample represent the entire Italian population we follow the post stratification strategy (Holt and Smith, 1979 and Rossi and al. 2001) which gives different weights to different observations of the sample.
Nutrition as a measure of the standard of living?
In order to measure the standard of living, there is strong evidence in favour of using measures based on consumption and not on income. The standard argument, that by the permanent income hypothesis consumption is a better indicator of the welfare than current income, is much weaker
smooth their consumption over shorter periods, days, months and seasons, and to some extent over a number of years, while incomes, especially agricultural ones, might be extremely variable over a few months or years. Farmer’s income in any month is a poor indicator of the standard of living in that month. A better case can be made for annual income, but if farmers can smooth out their incomes over good and bad years then consumption will be the better measure. At a practical level, the difficulties of measuring income are much severe than the one of measuring consumption, since the former might derive from self employment in agriculture and in many cases the salary is represented by goods rather than by money (Deaton, 2000).
Family budgets surveys in Italy look more at nominal expenditures rather than on consumption. The conversion of expenditure into consumption requires the use of retail prices. In some surveys, households were asked to report both quantities and expenditures on goods, especially on food, and this data can be used to calculate unit values. Although unit values might be used to replace prices, accurate price indexes for each region cannot be obtained from these unit values.
Italian statistics at the moment do not offer regional retail prices which are essential in catching regional and rural-urban differences. This explanation represents the main reason why household expenditures have been preferred to household consumption.
In the eye of many economists, the standard of living is closely related to whether or not people can get enough to eat so that documenting the welfare of people becomes a question of counting calories or assessing the food basket purchased by a household. Although we do think that food and non food household expenditures are good measures of the standard of living of a family, we will supplement the analysis with other measures of well being, both quantitative (mainly regarding the nutritional status) and qualitative (coming from the historiography).
The most straightforward way to measure the standards of living is a purely statistical one: the mean, the median and the inter-quartile range of total expenditure represent the most common methods used in welfare studies.
One of the most traditional uses of household survey data was the one made by Prais and Houtakker’s (1955) in one of their more known classic studies. That literature shows the distribution of the budget over goods, how the allocation changes with levels of living and the behaviour of the Engel curve. This Engel curve analysis has been an important ingredient in understanding how the structure of the families’ spending changes as the economy strengthens. Many of the works regarding the link between household size and expenditure choices have been motivated by attempts to understand the ‘food puzzle’, which is an economic paradox observed in many economies.
Great importance will be then given to theoretical approaches such as those regarding the pattern of the Engel curve (Paper 2) or those studying the demand system (Paper 3). Such analysis will be pursued trying to identify differences between the 4 groups of households (strata). Family diversification comes from the sample division into 4 strata depending on 2 geographical macro areas, North-Centre or South-Islands, and two sectors of activity in which the head of the household is engaged in, the Agricultural Sector or the Industrial and Service Sector. The analysis will be pursued dividing the time spam of approximately 80 years into 5 sub periods of 15 years each on average. These sub periods allow us to characterize the different phases in Italian history.
Content of the three papers
The Evolution of food consumption in Italy, 1861-2001. Analysis of macro data
The paper analyses the standard of living of Italians in the long run through the use of macro data. The welfare of Italians is studied taking into account indicators on food and non food expenditure, per capita kilo calories and per capita food consumption. This study is conducted for the period between 1861 and 1997.
The first step has been the computation of a food expenditure series for the period going between 1861 and 1911 since the existing one, estimated by Istat, is not considered reliable (Fenoaltea, 2002). The new series has been computed using two benchmark estimations regarding food consumption in 1891 and 1911 (Federico, 2003) and the prices for food categories (Istat, 1958 and Barberi, 1961). The other series are considered with the remaining years and are computed by Barberi (1961), Golinelli-Monterastelli (1990) and Rossi-Sorgato-Toniolo (1993).
The findings can be summed up briefly in the following statements:
1. a high and constant share of the budgets are devoted to food purchases until World War I (approximately 60 per cent over 50 years). After World War I, this percentage decreased until approximately from 1920 to the end of the World War II. Between 1950 and 1960, the size of food budget share in Italy did not present any remarkable differences with other countries having approximately the same level of per capita GDP;
2. the usual dynamic of the Engel law was not verified in the Italian experience. The growth of per capita GDP and that of total expenditure was not followed by a substantial decreased in food budget share. The values of the total expenditure elasticity range from a maximum of 0.86 in the period between 1861 and 1880 to a minimum of 0.47 between 1950 and 2001;
3. the quality of food consumed in the Italian diet improved constantly. Cereal consumption, cheap carbohydrates, has been gradually complemented and substituted for more expensive protein and fat (especially those of animal origin). The consumption of meat as well as that of fats, sugar and coffee has noticeably increased.
No pattern of consumption between different households living in distinct areas developed studying the trend of macro series and this limitation has been addressed in Paper 2 thanks to the use of micro data.
Food Expenditure as a measure of the Italian Standards of Living, 1890-1960
In the second paper, we derive some conclusions on the behaviour of families expenditures differentiating for the 4 strata, over the period between 1890 and 1960. this paper investigates the quality of the diet in part of the 19th and 20th century. Economic historians have stated that changes in diet were the driving force of economic growth in the past, with dietary changes explaining as much as 50% of economic growth (Fogel 1994). It is important, then, to investigate the precise type of dietary change that took place in Italy.
Special attention is given to the evolution of the food budget shares. The paper focuses on changes in food budget shares in response to changes in total expenditure. We will show how the quality of the diet improved over years.
The overall conclusions coming from micro data partially match with evidences of paper 1, which were based on macro series. The common evidences refer to the following facts:
1. food budgets shares in the four strata stay constantly above the 50 per cent level for the period between 1890 and 1940 (higher for agricultural based families and for households living in the South). This percentage represents the upper limit of food budget share for some countries (USA, Canada, Norway, Sweden, Germany; Deaton, 1976) which had a level of GDP per capita close to Italy;
2. an high portion of food expenditures was devoted to cereal purchases until World War II. An improvement to the variety of food purchased was indicated by the purchases of meat, vegetables and wine. Almost no fats, animal nor vegetable, were at the beginning added to the meals. The complete shift from a cereal based diet to a protein based one was delayed in Italy compared to other developed countries and occurred just after World War II;
3. the pattern of the total expenditure elasticity follows the same path showed by macro data. High values of elasticity, close to the unit value, stayed until the beginning of the 20th
century; then the values of the elasticity showed a slow decrease (-20% ) over the next 40 years and a faster decrease (-25%) between 1940 and the post World War II period.
The assumption made by Fogel (1994) who assumes that income increases lead workers’ diets to shift ‘from grains and food with high fibre content to sugar and meats’ is verified in Italy. Households in the 20th century did substitute among different food groups, preferring dairy and meat to cereals as their incomes increased.
The strata analysis leads to other interesting evidences which are:
1. the variance in terms of total expenditure is larger between households employed in the agricultural sector and those working in the other two sectors (industry and services). The standard of living of people employed in agriculture was, on average, much lower than that of people employed in the industry or services sectors (total expenditures were 20 per cent less on average for the entire period). In addition, families living in the North and Centre of Italy were better off than families living in the Islands and South of Italy (the amount of total expenditures were 10 per cent more). Differences between peasants living in the North and those living in the South, computed at constant 1938 lire, were remarkable at the end of the 19th century (families living in the south purchased less meat, 145 lira versus 27 lira, less vegetables, 154 versus 21, less fats, 46 versus 16, and alcoholic drinks, 92 versus 46);
2. expenditures on non food goods do not show any divergence pattern among strata until 1946;
3. the Engel curve does not follow the usual pattern for the poorest 75 per cent of Italian families. This means that increases in total expenditure availability for richest families were devoted to buy extra food as well as non food items. Poorer households used extra money to buy extra food;
4. after World War II, Italians had a weighted diet guaranteed by a good mix of cereal, proteins and fats. Differences between the 4 strata only show up in the pattern of expenditure regarding non food items.
Engel’s law, which says that there is an inverse relationship between the food share and total household expenditure, or sometimes income, does not apply to the poorest Italian family until the end of World War II. The reasons for this suggested in the paper, briefly, these are of two different
quantitative point of view from the last decade of the 19th century up to the 1950s. This means that households kept spending a higher share of their disposable income for food purchases, although the total expenditure rose. The second explanation lays in the fact that food for Italians mattered more than other needs. As soon as the Italian diet reached an adequate level, from the kilocalories intake point of view, it seemed more urgent to ensure a higher qualitative standard for nutrition rather than certifying their improved standard of living by buying non food items such as nicer clothes and bigger houses.
Previous explanations solve this dilemma questioned by the Engel’s second law, which claimed that the food share constitutes an inverse indicator of welfare across households. According to the previous law, the standard of living of Italian households would be lower compared to that of households in other economies which devoted a sensible lower share of their money towards food purchases. But, are we sure that the quality of the food basket was the same in Italy as in the other countries? The higher quality of the Italian food, which made the Italian ‘cuisine’ well known in the world, could pose a problem on the effectiveness of the Engel’s second law.
Expenditure Pattern in Italy, 1875-1960. A complete quadratic demand system
estimation with demographic variables
In Paper 3 we explore two related issues: the estimation of a complete system of demand equations using household budget data and the incorporation of demographic variables into such a system. The estimation of a demand system’s parameters will help us understanding the pattern of Italians expenditures and its evolution over time. The study of the effects of household size and composition on demand is more than a simple academic curiosity. The introduction of demographic variables into the model is meant to enlighten the ‘food puzzle’ paradox which is still a controversial issue in both theoretical and applied economics. When household size increases, the presence of economies of scale connected to intra-household public goods should free resources and generate savings that may be channelled towards the purchase of private goods like food. The economic intuition for that is straightforward: the family is now bigger and these extra people need to be fed. The result should be an increase in the food budget. The empirical evidence is exactly the opposite and it appear to be consistent among rich and poor countries such as the United States, Britain, France, Taiwan, Thailand, Pakistan and South Africa. This type of theoretical framework is still a virgin territory in regards to Italy.
The analysis is carried out taking into consideration the same 4 strata introduced while the time spam is now slightly longer, between 1875 and 1960.
The first interesting result is in the fact that the impact of household size on food expenditure is surprisingly negative for many food items. This means that an increase in the number of children or adults, reduces a family’s expenditures for some food categories. There are systematic differences in expenditure choices related to the presence of an extra child or an extra adult:
1. an additional adult has a smaller negative effect on the food budget share compared to that of an additional child’s effect;
2. in the two sub periods 1913-1929 and 1946-1960, an additional adult increases the food budget share while an additional child did not;
3. an additional adult leads the household to substitute more expensive foods with cheaper groceries. In particular the budget share for cereals increases while that for fats and dairy products decreases;
4. when an additional child is added to the household, such a substitution effect does not apply (apart in the post World War II period).
The unusual behaviour of the share of the budget for food is in response to the fact that the enlargement of a family deepens the ‘food puzzle’ paradox. Our explanation is based on the differentiation between children and adults’ nutrition within the same household.
There is a large amount of literature documenting that, at least in some areas of the today’s world, the allocation of household resources favours some members rather than others.
In Italy too, the nutritional treatment that each family member received is proved to be heavily based on the sex and on the age of the household member. That behaviour has to do mainly with food scarcity, the less food there is, the less you give to people who are unable to work and thus to produce. The other reason of that regularity is that in ‘old times’ the head of the household and adult men in the family had a predominant role over women and children. Nutrition within the family reflects that distinction.
Proofs that diet within family members depended on the age of the person have been found both in the trends of variables related to nutrition and in the reports and surveys that statisticians and historians used to make in order to study and document poverty. This paper gives the reader a large variety of evidences to consider.
The analysis of the total expenditure elasticity reveals a trend towards greater consumption of meat, fats and clothing as soon as total expenditure increases. For these goods the elasticity in the total expenditure is constantly higher than the one (luxury goods). An increase in families incomes
yields a new set of consumption decisions and a shift in expenditure towards more expensive calories. There is no negative total expenditure elasticity which indicates an inferior good.
Within this classification, cereals based foods and vegetables represent the base of the Italian diet. The change in diet, which may be inferred from the values of elasticity, suggests a slow but regular increase in cereal consumption during all the years considered.
If on one side expenditures on meat, fats and clothing rapidly increased when income improved then on the other hand the same expenditures quickly retreated when these goods became more expensive.
Conclusion
The aim of the thesis was to study the nutrition of Italians in the long run. In particular, we were concerned about the nutrition of Italians and the evolution of their food expenditure between the last decades of the 19th century and the fifteen years after the end of World War II.
Studies on this topic in Italy concentrated more on the analysis of the trend of macro variables. This thesis represents a way to strengthen the importance of micro data when analysing the welfare of a country. The combination of micro and macro data seems preferable to one or to the other measure because it allows to study the phenomena from a more complete point of view.
The fulfilment of the thesis has required the collection of the micro data on family budgets through intensive researches in private and public archives. The organization of the data in a dataset has just preceded the analysis of them.
The main conclusions regard the pattern of the food share, which has been almost constant between 1880 and 1920. Food budget share for Italians started to assume the same size as those in foreign countries just after World War II. Paper 2 tries to answer to the question- Why food budget share were so high in Italy compared to other countries in Europe? That weird behaviour of the food budget share makes the Engel curve not applied in the Italian context.
Other findings concern the relationship between the food budget share of a family and the family size and composition. It seems obvious that family enlargement leads the household to devote a bigger share of its money to buy food. In Italy, as in other economies, that does not happen. Has it any link with the presence of children or adults in the household? Is the family diet sensible to the presence of children? Paper 3 mainly deals with the fact that nourishment within a family was differentiated between children and adults and that the formers were nutritionally penalized.
Appendix I
Table 1
Geographical and sectorial distribution of family budgets in Italy
Region Sector of economic activity
Agriculture Industry & Other Total
Piemonte Lombardia
Trentino Alto Adige Veneto
Friuli Venezia Giulia Liguria Emilia Romagna Toscana Umbria Marche Lazio Abruzzo Molise Campania Puglia Basilicata Calabria Sicilia Sardegna Totale 17 92 109 180 870 1,050 9 0 9 96 7 103 42 3,297 3,339 4 12 16 466 62 528 213 882 1,095 57 23 80 4 0 4 4 210 214 5 0 5 84 106 190 157 324 481 466 15 481 83 29 112 398 27 425 111 465 576 29 72 101 2,425 6,493 8,918
Table 2
Modules, unit respondent and subject of the modules in the Questionnaire
Modules in the Questionnaire
Module Respondent Subject
Head of the Household Part
Household composition Head of the household Household roster, demographic data
Consumption Modules
Food Expenditures Head of the household Food expenditures in the past 12 months, consumption of
home production in the past 12 months
Non-Food expenditures Head of the household Expenditures in the past 12
12 months
Housing Head of the Household Type of dwelling, housing
structure and facilities Durable goods Head of the household Inventory of durable goods and their prices
Income- related Modules
Family income Head of the household First job and second job income, income from other sources, remittances, public and private transfers Farm activities Head of the household Size of plots, crops, income and expenditure from raising crops and animals; livestock and farm equipment
inventory
Non farm activities Head of the household Income and expenditure for household businesses
Assets Head of the household Value of property and savings Credit Head of the household Credit facilities,
Family Component Part
Household composition Each component Age, sex, working condition Education Each component Years of schooling
Health Each component Medical situation
Migration Each component Any move in the last 5 years Fertility Each woman Number of pregnancy, number of abortion
Anthropometrics Each component Height and weight measures Labour Each component Labour condition, type of Employment, number of working hours, salary
Community Questionnaire
Economy and Infrastructure Head of the Household Access to roads, electricity, water, public services Education Head of the household Location of schools in the community
Health Head of the household Location of health
The Evolution of food consumption in Italy, 1861-2001. Analysis of macro data
Introduction
The study of a nation’s diet is beginning to be a preferred method of measuring the economic development of a country and its inhabitants’ quality of life.
This article proposes to examine the evolution of the dietary standard of living in Italy in the 150 years since Unification.
In order to make comparisons over such a long period it is necessary to adopt a system which is both consistent throughout the period under consideration and, at the same time, a valid measure of dietary and nutritional standards. To this end, a range of indicators will be considered, such as the elasticity of spending on food to income, the average quantity of calories consumed daily, the extent of consumption and of spending on food and we shall examine the evolution of these indicators during the period from 1861 to 2001.
In the recent literature on the subject of calories and income debate has arisen around the relationship between per capita income and spending on food, and whether and to what measure this latter variable is reactive to variations in income. To the extent to which the demand for calories increases with an increase in income, the economic growth of a country ends up being a necessary means of overcoming malnutrition. In other studies conducted by Behrman and Deolalikar (1988), Bouis and Haddad (1992), Bouis (1994), it has been shown, instead, how the values of the elasticity, even in situations of malnutrition, are so close to zero as to imply that an increase in income does not lead unequivocally to a substantial change in diet2. If this proposition were to be verified also in Italy, a large part of the discussion on the well-being of the country based on the various measurements of the per capita GDP would have to be widely reconsidered.
The analysis of the dietary standards of the Italians, hereunder presented, will be supported as much by quantitative evidence as by qualitative material, in such a way as to provide strength to the results derived from statistical measurements.
The data analysed in this study have been collected by the ’ISTAT’, which represents the Italian Statistical Office, and published in the ‘Sommario di statistiche storiche italiane’. Where a reliable historical sequence is not available the author proposes one ex novo, calculated in a preliminary manner with the sole purpose of filling the gap as necessary to describe the progression of a phenomenon over a long period. The modern historical Italian quantitative documentation,
2
thanks to the work of Rossi, Sorgato and Toniolo (1993) and of Fenoaltea, Federico e Zamagni (1992), even beyond providing a valid alternative to the statistics of ISTAT, has filled the gaps for the period before the World War I. In those years, the statistical information, provided by individual scholars and municipal offices of the principal cities, relative to taxes, to supplies policy, to agricultural production, to immigration statistics, to salary changes, did not reach adequate standards of reliability3.
The first fifty years of the history of nutrition in Italy is marked as a period of slow but continuous growth. Some regions of Italy which, in the late 19th century were living in largely pre-industrial conditions of widespread poverty and undernourishment (Zamagni, 1998), pulled themselves out of the slough of malnutrition although without managing to achieve a recognisable and unequivocal level of well-being. The improvements observed from the beginning of the Giolittian period were instead, interrupted by the great crisis of the 1930s, the Fascist period and the World War II.
Unlike the majority of the countries which form the developed area of the world, Italy reached the daily 3000 calories per capita only in relatively recent years4, starting from 1960. There had been earlier years in which that threshold had been reached but they were sporadic episodes rather than long term cycles.
The percentage of spending on food remained anchored at a very high level of about 65 per cent of total spending until the late twentieth century. If account is taken of the other primary necessities such as habitation and clothing, one realises how limited were the resources destined to those things which were then considered non-essentials : expenses on transport and communication, on personal hygiene and beauty products, and on education and entertainment.
The situation in Italy differed from that observed in most of the countries of continental Europe where, in the same years the level of spending on food consumption was below 50 per cent of total spending, a demonstration that higher levels of income made resources available to spend on exigencies other than food (Deaton, 1976).
The structure of demand changed irreversibly only at the start of the decade following World War II. A major diversification in food spending was accompanied by doubled consumption of meat, while consumption of sugar and coffee increased fourfold. There is too an increase in the
3
Lenti, (1906) writes, apropos pre-World War I statisticians:]not only did they proceed with different criteria, the one from the other, often rendering uncomparable the data calculated, but they did not always have at their disposal the basic documentation sufficient to reach plausible results.
resources given over to the purchase of goods, services, pastimes and entertainment, considered until then the prerogative of only a few classes of the population.
The slow change observed even from the first years of Unification in both the number and quality of the calories consumed, ratified a growing consumption of products of animal origin and the consistent reduction in those of vegetable origin.
This article is structured thus: in Section 1 the analysis of both food and non-food consumption in the long term gives an overview of the evolution of the indicators which are subsequently analysed in detail and for briefer periods: 1861-1911 (Section 2), 1912-1950 (Section 3), 1950-1997 (Section 4). The period divisions correspond mainly to the exigencies of comparisons of the data notwithstanding it being a necessary step to individualising the different phases of the evolution of the Italian diet. The conclusions are contained in Section 5. Appendix I reports all the tables and the figures. In Appendix II is a clarification of the method of estimating spending on food in the period 1861 to 1911.
Section 1. Food consumption in the long term
Figure 1 shows the trend of the budget shares, calculated at current prices, for five aggregates of expenses for the period from 1861 to 1997.
The items of major interest which are revealed in the graph, can be summarised by four points:
1. for the first forty years an average of 65 per cent of the total expenditure was assigned to food, while 15 percent was spent on household goods and 11 percent on clothes;
2. spending on food in Italy undergoes its first significant changes only from 1911. For thirty years, until 1940, the percentage of spending on food diminishes, never, however, falling below the level of 50 per cent of the total spending;
3. during the period of the World War II spending on food returns to the level of the previous century, over 60 percent;
4. from 1950 a consistent fall in the percentage is registered.
An important element is the absence of a significant dynamic in the Engel curve for at least 50 years: while there was a steady growth in the per capita GDP (average annual increase of 1 percent between 1861 and 1914, Fenoaltea (2005)) the amount spent on food remained stable. In other countries in Europe spending on food consumption widely shows a level below 50 percent (Table 1).
Considering the same data, we can estimate the elasticity of food spending to total expenditure to be about 0.86 before 1920, 0.57 between 1921 and 1950, and equal to 0.47 in the following
years. A part of the decrease in the value of the elasticity between the first and second periods and between the first and third periods is neutralized if the changes in relative prices is taken into consideration. There is no doubt that the relative price of food diminished in the period for reasons attributable to the major increases in agricultural and industrial production. Nevertheless, the values shown above imply unequivocally, an inverse proportion between income and elasticity, suggesting the existence of a saturation level of food consumption after 1920, beyond which the elasticity to income became noticeably less than 1.
An initial breakdown of spending on food is presented in Table 2. The high spending on cereal is immediately evident in relation to the lesser expenditure on fruit, vegetables, and legumes and on meat. The consumption of coffee and sugar are limited while there is a high consumption of wine and tobacco within the same category. Spending on meat remained stable until after the World War II when it then doubled: this increase together with a decrease in the relative price testifies to the importance which it held in the Italian diet after 1950. The budget share of food spending remains constant but the figures record the process of substituting cereals, a food which costs little and is of high calorie content, with vegetables and fats whose place in the Italian diet increased considerable already in the second period (more than 50 percent and 82 percent respectively).
It is opportune to remember that the values of the budget share do not adequately measure the average consumer’s pattern of consumption. In fact, the value of each quota, being determined by the relationship between the expenditure on an aggregate and the total spending, assigns a greater weight to the pattern of spending of the rich consumers who spend much more than the poor consumers. Luxury goods therefore have a weightier role than goods of primary necessity for which reason the pattern of spending calculated is representative of the consumer who has an income level higher than the average (Deaton, 1976).
The indicators shown in Table 3 refer to the nutritional status of the Italian population. The first shows the daily average consumption of calories per capita, while the other categories show average quantities of nutrients consumed daily by the Italians.
The increase in the calories indicator follows the same phases as seen in describing the budget share while the course of the consumption of nutrients follows the composition of the food budget.
1. the average of 2,500 calories available to the Italians already recorded from 1861 makes of them a population sufficiently fed, for as much as the statistics used say nothing about the distribution of the calories and therefore about the undernourishment of a section of the population;
3. the low quota of lipids reflects the limited consumption of meat and dairy products, with an adequate protein intake of about 80 percent being of animal origin;
4. the increase in animal protein, as of lipids, continues throughout the period with the exception of the decade corresponding to the World War II;
5. in the last decades for which estimates are available, the glucides, while still representing a considerable portion of the diet, are joined by an adequate protein intake. Animal protein by now overtakes that of vegetable origin while the consumption of lipids has increased by 225 percent since 1861.
Given the aggregated nature of the data it is not possible to observe any substitution of ‘cheap calories food’ such as the inferior cereals and foods with a source of major protein content and for the same reason aspects of the quality of food are not accounted for. What is clear however, is the substitution of cereal based food and food with a major concentration of protein. The transition from a diet based primarily on carbohydrates to one which is based on animal nutrients will be analysed within the present article.
Section 2. A revisitation of the theories of consumption in the first fifty years of Italian Unification
The debate between optimists and pessimists about the standard of living in Italy during its first half-century seems, for the moment, to be on the side fo the former. The discussion, even though addressing a longer period, is focussed on the 1870s and 1880s, precisely coinciding with what became known as the ‘agrarian crisis’.
The new data on the GDP per capita presented by Fenoaltea (2005) and that on calories by Federico (2003); the indications of growth in the consumption of luxury and non-luxury goods (beer, coffee, sugar, textiles, cotton and wool; Fenoaltea, 2003); the increase in real wages of about 17 percent for unskilled male workers and of 10 percent for female semi-skilled textile workers (Fenoaltea, 2002); the fall in the number of undernourished in Italy (Vecchi and Coppola, 2004) all constitute ample support, both statistical and theoretical, in favour of the optimists’ thesis.
Nevertheless the data, since they provide no analysis of the geographical subtleties nor sectorial differences, don’t allow for inferences on malnutrition, nor on the distribution of welfare and income, criteria which are fundamental for the evaluation of the quality of a growth process (Toniolo, 2003). An ideal macro series in fact, should be capable of showing a significant representation not only of the average population but also of the richest and poorest parts thereof (Mokyr, 1988).
The figures on calorie intake presented by Federico (2003) seem preferable to those of Barberi not only because they interpret the modern optimist ideas, but also for methodological reasons. The same methodological problems are to be noticed in the macro series on food consumption and therefore on spending on food, calculated by Barberi for the period from 1861 to 1911.
It is as well to specify that the level of consumption in the long term is determined by the national production modified by the disinvestment in the stockpile and the net imports (offset by exports). From a methodological viewpoint, Barberi’s figures reflect the statistical errors on agricultural production, furnished by ISTAT, on which his reconstruction of consumption is based. Production statistics are not always available and when they are, they are erroneous. The figures regarding cattle are based on five benchmarks, three of which are simply conjecture. Moreover there are no data on the production of fruit and vegetables before 1910. Continuing on the methodology adopted to estimate the value of production, ISTAT used weighted means to evaluate those goods whose 1861 prices were not available5.
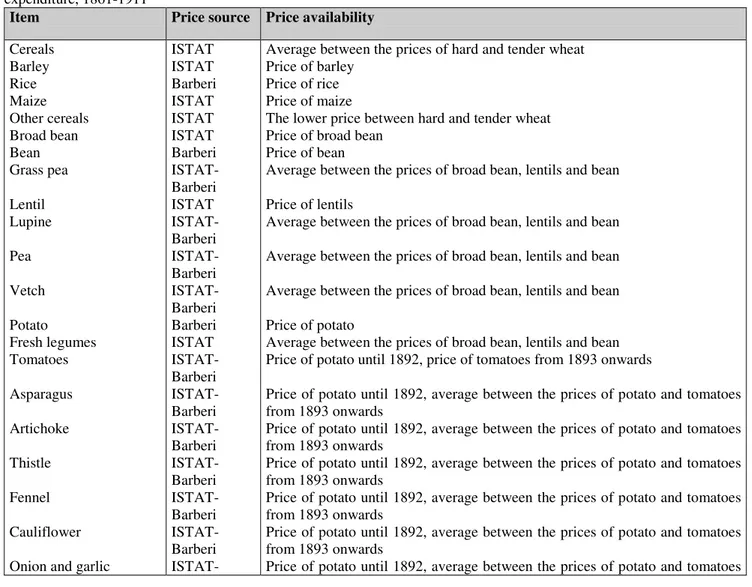
Furthermore to reconstruct the historic data on food prices ISTAT has used the statistics gathered in only two cities, Milan and Rome (Barberi, 1961). Finally, the prices refer to the whole year and no longer to the harvest period with the result that any price variations of the short term are negated6.
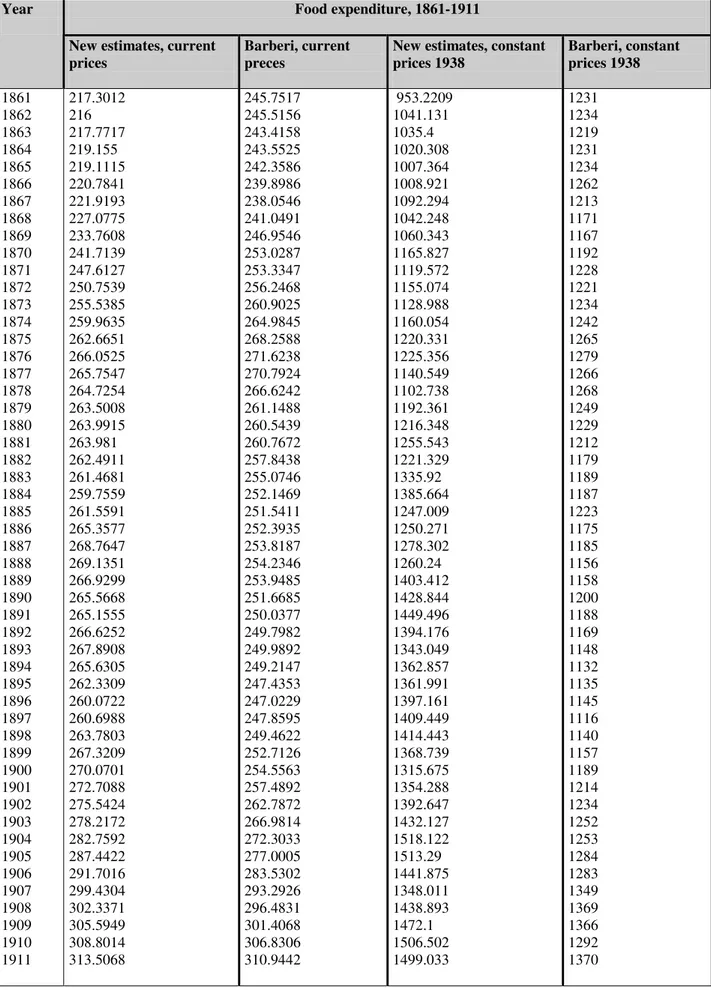
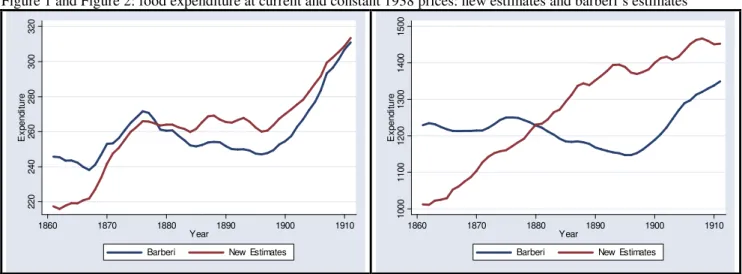
The author here proposes a new data series on the food budget constructed by a re-extrapolation of the consumption figures calculated in the benchmark years 1891 and 1911 by Federico and taking account of the data on food prices calculated by Barberi and by ISTAT. The results, notwithstanding the limited methodology are consistent with the per capita calorie consumption values calculated by Federico and with those regarding the per capita GDP calculated by Fenoaltea. Appendix II shows the method of these calculations.
The disaggregated consumption figures in Table 4 allow for a comparison with corresponding data presented by Barberi and show that:
1. the consumption of cereals while remaining high, is a minor percentage of the diet. Moreover the figures for cereal consumption are largely dependable in as much as they present no sharp decreases and no sudden increases but have a steady growth7;
5
The items in question are cheese the price of which is available from 1870, ham (1890), cornflour and vegetables (1900), wheat flour (1912), fresh fruit (1914) and fresh fish (1938).
6
It would be as well to consider, by means of an opportune weighting, the difference between the various markets based on the characteristics of their centres of production, consumption and importation. It’s most likely that the prices
2. the consumption of potatoes and vegetables assumes a major part in the diet, at more than about 20 kg for each of the years in the period with respect to Barberi’s figure. With minor differences the same goes for the fresh and dried fruit aggregates;
3. a major contribution of animal derived calories from a higher consumption of meat, milk and eggs;
4. the diet of the Italian family underwent great changes in terms of what it ate during the period described, as shown by the different compositions of the basket at the beginning and at the end of the period.
What the data do not reveal is that there were entire areas where the dietary conditions were worse than those so far discussed and where people were existing faithfully on polenta (White, 1877), corn flour or bread, accompanied, only on feast days, by wild herbs and lard (Jacini, 1984). One can say that an adult in a family like this would eat a kilo of polenta a day for eight months of the year and an onion and a piece of cheese would sometimes ‘pretend’ to serve to enhance it. For the other four months the polenta gave place to bread, they bought eggs, and even meat would put in an appearance (Albertoni and Novi, 1984).
Vecchi and Coppola (2006), using Fogel’s method (Fogel, 1997)8, measured how undernourishment in Italy moved between 25 and 30 percent in the first thirty years after Unification, then declined evenly to arrive at 16.8 percent in 1911.
However, the inequality of consumption is notable to the detriment of the peasant families. The consumption of meat, estimated at around 22 kilograms per capita for the fifty years in question, is clearly higher in the city, with a maximum of 89 kg in Sardinia and a minimum of 31.5 kg in Sicily (Toniolo, 1988), and largely precluded peasant families. The farm labourers of southern Italy, according to Bodio, consumed about 10 kg of meat a year, substituting it with salted fish and lard (Bodio, 1979).
In England the annual ration of meat increased from 40 kg in 1851 to 52 kg in 1887, while in France in the same period it rose from 31 to 32 kg (Toniolo, 1988).
The low consumption of meat is partially explained by the duty on the slaughter of pigs, introduced in 1868. The burdensome tax on slaughter had to be paid on every pig slain by the peasants and farm workers, and over and above being simply unpopular, was absolutely unbearable. It takes little to understand that a poor country family that scarcely manages to buy and feed a pig, whose meat provides the best and perhaps only addition to its poor and insipid polenta, absolutely cannot pay the sixteen lire that, incredibly, is asked by the consumption duty agent (Zangheri 1977)
8
Again: in the first decade of the twentieth century the diet in many rural areas remained that which it had always been, based on the prevalent use of maize (yellow bread and polenta in the north; in the south, black bread with the addition of poorer cereals) and of poor foods, while the consumption of wheat (white bread, flour, pasta etc) and quality food such as meat was found only among the working classes (Barbagli, 1988).
In spite of the notable increase in agricultural production in the first thirty years of Unification9, the social and productive structure in Italy meant that this increase benefited not the farm workers but only the owner and capitalist classes in the form of income and profits. If one speaks of a restraint in consumption, then this refers above all to the spending of the rural classes who shared in only a reduced measure, the increased agricultural income produced by themselves. The shortage of quantitative sources does not help demonstrate what has been stated. It seems that agricultural wages registered a small increase or remained stationary in the regions of the Centre-South, Lazio, Umbria, Marche and Campania, and notable but rare increases in some provinces of Piedmont (33 percent more in the decade 1870-1880), of Mantua (25 per cent between 1854 and 1874) and of Liguria (50 percent ) (Arcari, 1936). The price increases of the major share of foodstuffs (Table 5), were partially absorbed when wages were paid in kind, but the imposition of the tax increases on flour and salt, give however, the idea of a vast rural mass whose dietary conditions remained still critical.
The tax on flour and that on salt sharpened the difference between those who were able to pay a further tax and those who couldn’t. An income-diet investigation among various northern Italian families reported the case of a farming family in the province of Ferrara comprising 12 persons. Estimating an average consumption of 48 ‘sacks’ of wheat and corn a year, it was calculated that the family was paying a flour tax of 60 lire, on an income which altogether amounted to 1,200 lire. For the right to eat bread, therefore, the family was paying 5 percent of its income. If one then considers that the tax on salt was 4 lire per person, it can be calculated that for just salt and bread the Ferrara farmer was paying 10 percent of his income (Pepoli, 1874).
With the flour tax abolished there were the protectionist tariffs of 1887 to limit consumption; there was a levy on foreign grain which rose from 30 lire a tonne to 75 lire in 1894. To this tax were added the local duties on grain and flour which varied from town to town and which were generally heavier in the towns of the South.
9
Proof of the progress in agricultural production is evidenced by the export of Italian agricultural products during the two decades after Unification. The increase in exports, writes Romeo (1959), reflects effectively Italian economic fortunes: slower and floundering until 1866, then more rapid and turned towards more decisive progress” thanks to the sustained development in agriculture. The presumed stagnation of agriculture which derives from analysis of the ISTAT
The elasticity of the spending on food to total spending calculated using least ordinary squares and assuming a constant function of elasticity for the period, gives an adequate measure of the average level of hunger in Italy in the period. The model is expressed by the function:
(1) ln(PCFE)=a+b ln(PCTE)+e
where PCFE stands for per capita food expenditure and PCTE represents the per capita total expenditure; a is the constant term and e is the error term.
The logarithmic transformation has been used because the joint density function represents a good compromise for the joint bivariate normality; in this way the regression function is linear (Deaton 1996).
The values of the elasticity are here interpreted as the percentage increase in spending on food which would result from an increase of 1 percent in total spending. From the lessons of economic theory in the subject of consumer demand, we expect to observe a decline in the values of the elasticity for growing levels of income.
Table 6 shows the estimates of the elasticity of food spending in the total budget for the period from 1861 to 1911 and three sub-periods. The elasticity for the three shorter periods have values very close to one another and a little less than 1. It reaches its maximum in the years 1861-1880 even if the difference over the other two periods is very limited. The values of the elasticity suggest how the average Italian would have liked to spend a large part of the increased food budget.
Section 3. The Two Wars and the Fascist Period
Benedetto Barberi (1961) maintains that from the so-called Giolittian period up to 1950 consumption of food by the Italians is not distinguished by a quantitative increase but by a better, even though minimally better, level of nutrition due to a more balanced rapport between animal and vegetable foods. The experts, writes Barberi, let it be clearly understood that, at least in a large part of our country, the environment, climate, etc. impose upon the diet a prevalently vegetable character (Barberi, 1963).
Actually, such study of the elasticity as much as that of the quantity of food, demonstrates how the diet underwent clear improvements as much quantitative as qualitative, continuing that process which had been partially observed in the previous period. Furthermore, even the budget share analysis seems to arrive at the same sort of conclusion: the percentage of the budget spent on food undergoes the first decline in the early ‘20s liberating resources which would be spent on domestic items, hardware and transport.
Other indicators also furnish proof of this increased well-being (Table 7):
1. the per capita GDP estimated by Rossi, Sorgato and Toniolo grows in the period 1915- 1926 by 7.2 percent (estimates at constant prices 1938) and total consumption reveals a growth that double that;
2. spending on food reaches a level never attained in the preceding years;
3. the calorie intake figures are partially comforting; in fact there is no series available for the years 1911-1920, but only an average for the decade. The rate of growth within this period is, however, 9 percent, a growth rate never before seen in a span of ten years.
What surprises is how, even during the World War I, through extensive imports from the United States (Porri, 1920), a high demand for food which Italy would not otherwise have been able to guarantee because of the fall of food supplies, was able to be satisfied10’.
The climate of prosperity of the decade assumes a major relief if compared with the stagnation of the previous period, 1911-1915, and with the decline that set in from the ‘20s to the beginning of the ‘50s.
Toniolo (1980) pinpoints the period 1922-25 as the last period of that thirty years of growth that began with the new century. Agriculture remained a slave to its own backwardness and was incapable of carrying out a transformation towards stock raising for lack of a political base but also for the weakness of consumer demand for more expensive food because of the low wage level. Fascism impoverished agriculture by obstructing its modernisation, by proposing the ‘battle of the wheat’, the reclamation of the marshes, which, ex post didn’t have much effect on income and the level of unemployment. And not least, it encouraged an increase in births at a time when emigration was the only safety valve to the growing poverty (Toniolo, 1980).
Of the three classes of worker whose wages increased in the period after the World War I, farm workers, industrial workers and railway workers, only the latter maintained the favour acquired, although their numbers were cut as soon as the Fascists came to power (Zamagni, 1993).
The reduction of wage rates began in October 1927, following agreement drawn up by various trade associations which meant reductions of between a minimum of 10 and a maximum of 20 percent, in contractual wages (Vannutelli, 1958) giving the start to the phase of a regression in consumption. In December 1930 workmen’s wages were again reduced by 8 percent and those of white collar workers by 8 percent up to a wage of 1000 lire and of 10 percent for higher wages. A further reduction was imposed in 1934 to the extent of 7 percent. Between 1928 and 1934 the