Università degli Studi del Piemonte Orientale
“Amedeo Avogadro”
Dipartimento di Dipartimento di Scienze e Innovazione Tecnologica
Dottorato di Ricerca in Chemistry&Biology
XXIX ciclo 2013-2016
THERMODYNAMIC, KINETIC AND NMR
RELAXOMETRIC STUDIES OF
Mn(II) COMPLEXES AS MRI PROBES
Attila Forgács
Supervised by Prof. Mauro Botta
Table of Contents Page
Chapter 1···1
Introduction
Chapter 2··· 22
Outline of the thesis
Chapter 3···25
Experimental techniques
Chapter 4···31
Bis-Hydrated Mn2+ Complexes with the picolinate binding unit
Chapter 5···64
Developing the Family of Picolinate Ligands for Mn2+ Complexation
Chapter 6···85
Bisamide Derivative of Mn[1,4-DO2A]
Chapter 7···109
Hexadentate Macrocyclic Ligands for Mn(II) Complexation
Summary···131
Acknowledgements···136
Chapter 1
Magnetic Resonance Imaging (MRI) is one of the most successful and powerful non-invasive diagnostic methods among the several in vivo imaging techniques available in clinical diagnostic and biomedical research. MRI has severeal advantages as an imaging modality, which also explains its gain and very rapid development. These are:lack of ionizing radiation for image acquisition, noninvasiveness with a high patient acceptability, excellent delineation of anatomic systems that arises from a high level of inherent contrast, outstanding temporal and spatial resolution, ability of application to virtually every part of the body.[1] The use of contrast agents (CA) has become really important in improving the low intrinsic sensitivity of this method.[2] Traditionally, the imaging procedures have been combined with the use of dedicated contrast media, to further enhance the visualization of morphology and physiology. This combination of imaging hardware and contrast media was of high importance for the development of modern clinical radiology. MRI is no different in this respect, and the contrast media used are based largely on complexes of f-elements. The complexes need to be endowed with high stability to avoid the in vivo release of toxic free metal ions.
Even though inherent contrast in MRI can be manipulated to a much greater extent than in other imaging techniques, certain diagnostic questions cannot be answered easily and require the application of CAs. The contrast in an MR image is the result of a complex interplay of several factors, including instrumental parameters, proton density and the relative T1 and T2 relaxation times of the imaged tissues. Because it is nearly impossible to change the water content of tissues, CAs on the market or in clinical or pre-clinical trials focus upon T1,2 changes. Generally, the purpose is to reduce T1 in order to obtain an intense signal in short times and a better signal-to-noise ratio. These paramagnetic probes are essentially complexes of Gd (or Mn) due to the combination of high magnetic moment and favourable properties in terms of electronic relaxation. Well over 200 million patients have been dosed so far and the world market is estimated to be of the order of 1.2 billion/y. The solid-state structure, in vitro and in vivo properties of a large number of Gd3+-complexes have been investigated intensively in the last 20-25 years.
Timeline of MRI imaging:
The history of MRI imaging can be dated back in the late 19th century when Nikola Tesla discovered the Rotating Magnetic Field in Budapest, Hungary (1882). This was a radical discovery in physics. In 1946, two scientists in the United States, independently of each other, described a physico-chemical phenomenon, which was based upon the magnetic properties of certain nuclei in the periodic system. This was Nuclear Magnetic Resonance, for short NMR.
The two scientists, Edward M. Purcell and Felix Bloch, were awarded the Nobel Prize in Physics in 1952.
In 1955, Erik Odeblad and Gunnar Lindström from Stockholm published their NMR studies, with relaxation time measurements of living cells and excised animal tissue.
In 1971 Raymond Damadian, a physician and experimenter working at Brooklyn's Downstate Medical Center reported that discovered that tumors and normal tissue can be distinguished in vivo by nuclear magnetic resonance because of the differences in the relaxation times. One of the greatest pioneers in the history of NMR is Paul Lauterbur. In March 1973, he published the first images of two tubes of water in Nature.
In 1977-78, Raymond Damadian built the first MRI scanner, assisted by his two post-doctoral students, Michael Goldsmith and Larry Minkoff, at New York’s Downstate Medical Center. He recorded the first MRI scan of a healthy human body in 1977 and of a human body with cancer in 1978.
In 1987, real time MR imaging of heart becomes its development. In 1991, Filler and colleagues describe imaging of axonal transport of superparamagnetic metal oxide particles, a technique that later becomes important in imaging of neural tracts. In 1993, functional MRI of the brain is introduced. In 1994, the first intraoperative MR unit developed by GE and Harvard is installed at the Brigham and Women's Hospital in Boston. In the 1990's, in addition to research centers and large hospitals, small distant hospitals and imaging centers started to exploit MRI principally for neuroimaging and locomotor system imaging.
The use of contrast agents also started in the early 1980’s. Paul C. Lauterbur described the concept of using paramagnetic metal ions to enhance the contrast (and reduce acquisition times) of structures, in 1978. After injecting a manganese salt solution as contrast agent, he imaged five dogs with myocardial infarctions and was able to highlight them.
In October 1983, Lauterbur's group published a major overview of paramagnetic contrast agents in MRI, addressing problems and questions involved in the development of CAs. The patent application for Gd-DTPA dimeglumine was submitted in July 1981. In 1984, Dennis H. Carr and Wolfgang Schörner reported the first images in men. In 1988, Gd-DTPA (Magnevist) became commercially available, followed shortly afterwards in 1989 by the macrocyclic Gd-DOTA (Dotarem) from Guerbet (France). A number of other agents entered the marketplace during the 1990s.[3,4]
Over the last decades, more than 800 potential MR contrast agents have been described in the literature or have been patented, but only a dozen are available on the market for clinical use.
Nowadays there are more than 60 million experiments are carried out in every year, and MRI is still the most rapidly developing diagnostic method.
Classes of Contrast Agents:
MRI contrast agents can be conveniently classified into five different classes: T1 agents, T2/T2 * agents, CEST agents, 19F-based agents and hyperpolarized probes.
T1 agents:
T1 agents are mainly represented by complexes of paramagnetic metal ions [Gd(III) or Mn(II)] that enhance the MR water signal intensity. These are also called positive CAs because they provide brighter images in T1w scans. The main benefits using T1 agents arise from the high versatility of this contrast mechanism that is affected by a large number of factors related to either structural and dynamic characteristics of the agent and biological aspects like the intra-voxel distribution of the probe (e.g., intra/extra-vascular, intra/extra-cellular).[5,6,7] All Gd-based CAs have a low molecular mass of about 500 Da, are extremely hydrophilic complexes and are excreted unmetabolised in the urine. They have similar pharmacokinetic properties with similar plasma half-lives, and, due to their small size, extracellular Gd-based CAs are excreted almost exclusively by passive glomerular filtration through the kidneys with neither secretion nor reabsorption. However, protein binding GBCAs are also excreted to varying degrees by the hepatobiliary route.
T2/T2* agents:
T2/T2* agents are chemicals, mostly superparamagnetic nanoparticles made of iron oxides, capable to shorten the T2/T2* of water protons much more than T1. These complexes can be identified by the following molecular formula: Fe2IIIO3MIIO, where MII can be: Fe2+, Mn2+, Ni2+, Co2+, Mg2+. In solution, these complexes are assumed to be spherically symmetric solvated superparamagnetic iron-oxides (SPIO) nanoparticles. They can be classified into four groups based on their diameter. Oral-SPIO: 300 nm; Standard SPIO (SSPIO): 60-150 nm; Ultrasmall-SPIO (USPIO): 5 to 30 nm; and monocrystalline iron-oxide nanoparticles (MION): smaller than 10 nm. They are also referred to as negative CA because they decrease signal intensity, which results in darker images. Such nanoparticles possess a higher sensitivity than T1 agents that justifies their widespread use in MR-molecular imaging methods, particularly for cellular imaging.[8] An obvious disadvantage is that the signal loss is
not desirable, particularly when the target site has an intrinsically low signal (e.g., lungs, hemorrhages).
CEST agents:
The family of CEST agents is constantly growing; the peculiarities of these systems could open new and interesting future perspectives for MRI agents in pharmacology research. The diamagnetic metal-free systems can eliminate the risks associated with the use of metal-based contrast agents. The acronym CEST stands for Chemical Exchange Saturation Transfer and identifies those chemicals that generate a MRI contrast via the transfer, transmitted by chemical exchange, of saturated (i.e., after irradiation with a frequency specified RF pulse) protons from the donor pool (CEST agent) to the acceptor pool (bulk water). The most important advantage of using CEST agents is that the rate of the contrast is only dependent on the concentration of the contrast agent and their mobile protons exchange rate. A good CEST agent should be characterized by:
- fast proton exchange in physiological pH and temperature
- high chemical shift difference (Δω) among the mobile protons and the water protons - small toxicity, good solubility and small osmolality
Endogenous metabolites with exchangeable protons including many endogenous proteins with amide protons, glycosaminoglycans, glycogen, myo-inositol, glutamate, creatine and several others have been identified as potential in vivo endogenous CEST agents.
Paramagnetic lanthanide ions that induce large hyperfine shifted resonances in close protons are particularly useful for CEST contrast because high Δω values allow access to a wider variety of faster exchanging chemical systems. Lanthanide-based agents of this type are referred to as PARACEST agents.[6]
Heteronuclear agents:
CEST agents share the frequency-encoded contrast property with those agents containing MRI detectable nuclei different from protons. Among them, two classes deserve to be mentioned here because they comprise compounds already approved for use in humans or in advanced clinical trials: 19F agents and hyperpolarized probes.
19
F agents: 19
Consequently,19F agents are almost solely represented by nanosystems, where perfluorocarbon nanoparticles (PFCs) are by far the most commonly used.[9] The important advantage of fluorinated agents over the other types of contrast media systems from the possibility to correlate straightly the MR signal to the agent concentration, thus enabling the quantification of selected biomarkers and/or drugs transported at the site of interest.[10]
Hyperpolarized probes:
This class of MRI agents is by far the most sensitive one. These agents have some similarity with PET tracer, not only for the distinguished sensitivity, but also for the setback of the signal they generate (caused by the return back to the thermal polarization) that occurs on the timescale of the T1 of the polarized spin. Hence, one restriction in the use of hyperpolarized
probes is the loss of the signal over time that requires fast injection and rapid accumulation at the target site.[11]
Design of new contrast agents:
A contrast agent for MR must have the ability to change efficiently the T1 and/or T2 in tissues at low (μM to mM) concentrations with acceptable tolerance. The following points summarize the most important features of paramagnetic MRI contrast agents.
High Relaxivity:
The efficiency of the contrast agents is described by the parameter relaxivity (r1p), which is defined as the paramagnetic enhancement of the longitudinal relaxation rate (1/T1) of the water protons in 1mM aqueous CA solution. The value of the relaxivity is the combination of the inner, -second and the outer sphere contributions. The inner sphere contribution represents the transfer of the paramagnetic relaxation effect to the bulk via the exchange of directly coordinated water molecule(s) to the paramagnetic ion. The second sphere contribution arises from water molecules hydrating the complex (via hydrogen-bonding interactions) with a relatively long residency time, whereas the long-range interaction involving solvent molecules diffusing next to the complex represents the outer sphere term.
Relaxivity is the most important property of contrast agents. Each agent’s fundamental ability to reduce T1 and/or T2 is referred to as its ‘‘relaxivity,’’ r1p and r2p. An agent with a higher relaxivity will lower the T1 and/or T2 more at equivalent concentrations than an agent with a lower relaxivity. Higher relaxivities are associated with larger molecular weight ligands, and higher relaxivity means that lower dose is enough to reach good resolution.
High Stability:
Stability in this case means two different stabilities. One is thermodynamic stability and the other is kinetic inertia (commonly referred to as kinetic stability). Both of them are important to avoid toxicity problems. In general, thermodynamics describes the energy necessary to break the bonds between the metal ion and its chelating ligand and release the free metal ion (dissociation) independently from time. Kinetic stability refers to the rate at which dissociation occurs. Thermodynamic stability can be described quantitatively by the thermodynamic stability constant Ktherm (value given on a logarithmic scale, with larger values representing exponentially tighter binding) and the conditional thermodynamic stability constant Kcond. Ktherm is independent of pH, while Kcond is conditional, specifically reported in this context at physiologic pH. Kcond is therefore more useful than Ktherm to describe thermodynamic stability also in in vivo or ex vivo conditions.[13] Kinetic stability is characterized by the dissociation rate constants of the Gd chelates, a measure of how rapidly equilibrium is reached or how fast the Gd ion is released from a Gd(III) chelate when thermodynamic conditions are such that release can occur.[14] In this case slower dissociation means higher kinetic inertness and more stable complex.
Specific Biodistribution:
Tissue specificity refers to the distribution of contrast agents to some organs or tissues with a higher concentration than to others, lowering the required contrast agent dose, and/or increasing the sensitivity of lesion detection. Currently, there are agents that use hepatobiliary, renal, or both routes of excretion.[15]
Rapid Clearance:
MRI contrast agents should clear out rapidly and completely from the body after injection and subsequent imaging. This is necessary to prevent chronic toxicity due to the slow deposit of dissociated free metal ions in specific tissues or organs.
Low Osmolality and Viscosity:
Osmolality reflects the concentration of dissolved particles in a contrast agent's formulation. Most Gadolinium Based CAs are formulated at 0.5 M because of the need for rapid administration and therefore necessarily have some hyperosmolality relative to plasma. When
(0.5–2 mOsm/L compared to blood osmolality of 300 mOsm/L), i.e., much lower than that of iodinated contrast media. There are preclinical data showing the deleterious effect of high osmolality in the case of Gadolinium based CAs and cases of extravasated Gadolinium based CAs have been described.[16,17] Viscosity is a measure of the "thickness" and internal resistance to motion of a fluid. Formulations producing lower osmolality and viscosity may have improved dose tolerance and offer formulation flexibility, particularly for rapid bolus administration via a power injector.
Low Toxicity:
Contrast agents should have low acute toxicity, not producing side effects, such as allergic reactions and changes in normal serum parameters. Typically, ratios of >30 between rodent LD50 and human doses are sought. Problems in terms of chronic tolerance of agents should be nonexistent. Care regarding special patient populations such as those with renal impairment is of high importance.
Nephrogenic systemic fibrosis (NSF) is a serious late adverse reaction associated with exposure to Gadolinium based CAs in patients with renal insufficiency or on dialysis.[18,19] NSF is a rare, progressive, usually fatal disease characterized by skin thickening, painful joint contractures, and fibrosis of multiple organs including the lungs, liver, muscles, and heart. Basically all cases that has been documented have occurred in patients with chronic severe renal insufficiency who have received gadolinium contrast.[20] Therefore, researchers started to find an alternate solution for Gd. Complexes of Mn(II) can represent a possible solution. Manganese(II) shares several advantageous properties with gadolinium(III): high spin (five unpaired electrons), fast water exchange kinetics and slow electronic relaxation. Although Gadolinium has seven unpaired electrons and a larger magnetic moment, the water exchange rates on Mn2+ complexes are sufficiently fast not to limit relaxivity. Another advantage is that manganese is an essential metal ion and then the organism has developed a mechanism to remove the Mn(II) from the living system; a serum concentration of 0.5–1.2 μg/L[21] is essential for normal development and body function. Despite the important biological role of Mn2+, large doses of this metal ion are neurotoxic (LD50 = 0.22 mmol/kg for rat).[22,23] Humans overexposed to Mn2+ can suffer from neurological disorders, which results in a form of Parkinsonism termed manganism,[24] likely caused by the damage of basal ganglia.[25] In comparison with Gd3+, Mn2+ is less paramagnetic and has a lower charge and lower ionic radius. These differences lead to synthesize different ligands with a structure suitable for stable Mn2+complexation. Depending on the denticity and rigidity of the ligand (open chain,
macrocycle, benzene ring included), Mn2+ has common coordination numbers of 6 or 7 in its complexes. In order to act as an efficient CA, a Mn2+ chelate has to allow direct coordination of water molecule(s) to the metal ion. The outer-sphere contribution to relaxivity is even lower than that for a Gd3+ complex with a higher spin. In fact, a problem with Mn-based contrast agents could be the lack of inner sphere water molecule, which is essential for use as MRI contrast agent. The relation between ligand geometry and coordination number is hardly predictable. Hexadentate ligands can form complexes with both coordination numbers {[Mn(NOTA)]– CN = 6, [Mn(EDTA)(H2O)]– CN = 7} and rigid pentadentate aza-crown-ethers can form pentagonal-bipyramidal complexes with CN = 7.
The complex needs to have also high thermodynamic stability and kinetic inertness. In general, the thermodynamic stability of Mn2+ complexes is lower in comparison to that of Gd3+ analogues, because of the lower charge of the Mn2+ ion. Kinetic inertness is another important issue for safe in vivo application of CAs. In general most of the Mn(II) complexes of open-chain ligands were found to be kinetically too labile for in vivo use. Macrocyclic Mn(II) complexes have been reported to have reasonably high thermodynamic stability and kinetic inertness.
Paramagnetic enhanced relaxation rate:
In the presence of paramagnetic media, the theory of the solvent nuclear relaxation was developed by Solomon, Bloembergen, Morgan and others.[26-31] The paramagnetic complexes are able to reduce both the T1 and T2 relaxation times of solvent nuclei in the region where they are present. The observed relaxation rate (1/Ti,obs) is the sum of the diamagnetic (1/Ti,d) and the paramagnetic relaxation rates (1/Ti,p):
p i d i obs i T T T, , , 1 1 1 i=1, 2 (1)
The diamagnetic term (1/Ti,d) respects to the contribution of the diamagnetic environment (generally the water) to the observed relaxation rate in the absence of paramagnetic solute. The paramagnetic term (1/Ti,p) represents the “catalytic” effect of the paramagnetic substances on the relaxation rate of solvent nuclei. The 1/Ti,p values are directly proportional to the concentration of the paramagnetic complexes ([M]):
] [ 1 1 , , , M r T Tiobs id ip i=1, 2 (2) The relaxivity is usually given in terms of the increase in the longitudinal relaxation rates of water protons. The specific chemical interactions are generally realized by the coordination of the water molecule(s) in the empty coordination site(s) of the metal ion (ri,pis inner-sphere) and by the translation diffusion of the water molecules in the surrounding of the paramagnetic complexes (ri,pos outer-sphere). The third type of interaction is linked to the approximately long residence time of the water molecules in the proximity of the paramagnetic centers due to the hydrogen bond formation with the strongly polarized functional groups (e.g. carboxylate or phosphonate) of ligands used for the complexation of metal ions. The contribution of these processes to the overall relaxation enhancement is called second-sphere relaxivity (ri,pss). The observed paramagnetic relaxation rate (ri,p) of water protons may be considered as the sum of the inner- (ri,pis), outer- (ri,pos) and second-sphere (ri,pss) contribution of the paramagnetic complexes:
ri,p = ri,pis + ri,pos + ri,pss i=1,2 (3)
The inner-sphere relaxation mechanism is governed by the chemical exchange between the coordinated water protons and the bulk water. The longitudinal and transversal inner-sphere relaxation time of water protons are given by:
) ( 5 . 55 1 1M 1p T M M q T (4) ) ( T 5 . 55 ] [ 1 2 2 1 2 1 2 1 2 1 -2 2M 2 M M M M M M M p T T M q T (5)where q, M (corresponding to the inverse of water exchange rate 1/kex), 1/T1M, 1/T2M and M are the number of the inner-sphere water molecules, the lifetime of the water molecules in the inner coordination sphere of the paramagnetic metal ion, the longitudinal and transversa l relaxation rate of the inner sphere water protons and the chemical shift difference between the inner-sphere and bulk water, respectively. According to the Solomon-Bloembergen theory developed for the simple paramagnetic aqua ions, the relaxation rate of the inner-sphere water
protons are originated from the sum of the dipole-dipole (DD) and scalar/contact (SC) terms. The dipole-dipole interaction is affected by the modulation of the proton spin – electron vector, whereas the scalar term is only influenced by the electron spin relaxation and the water exchange. The dipole-dipole and scalar relaxation rates of the inner-sphere water protons are given by the Eqn.(6) – (11):
SC M i DD i,M i,M T T T , 1 1 1 i=1,2 (6) 2 1 2 1 2 2 2 2 2 0 6 2 2 2 1 1 3 1 7 4 ) 1 ( 15 2 1 c I c c S c MnH B I DD S S r g T (7) 2 2 2 2 2 1 3 1 ) 1 ( 2 1 e S e SC A S S T (8) 2 1 1 2 1 2 2 2 2 2 0 6 2 2 2 2 4 1 3 1 13 4 ) 1 ( 15 1 1 c c I c c S c MnH B I DD S S r g T (10) 2 1 2 2 2 2 2 3 1 ) 1 ( 2 1 e e S e SC A S S T (11)
where I, g, B, rMnH, S, A/ħ, I and S are the nuclear gyromagnetic ratio of proton, the Landé-factor for the free electron (2.0023), the Bohr magneton, the distance between the proton and the metal ion, the electron spin quantum number (5/2 for Mn2+), the hyperfine/scalar coupling constant between the unpaired electrons of the paramagnetic ion and the protons of the inner-sphere water molecule, the Larmor frequencies of the proton and electron (S=658.21I), respectively. The correlation times (ci and ei) which characterize the relaxation of the inner-sphere water protons are expressed as follows:
M ie R ci T 1 1 1 1 i=1, 2 (12)
M ie ei T 1 1 1 i=1, 2 (13)
where R, T1e and T2e are the reorientation time of the metal – proton vector (rotational correlation time), the longitudinal and transversal electronic relaxation times of the metal ion. Since the interaction between the Mn2+ ion and the donor atoms is predominantly ionic in nature, the scalar coupling between the protons of the inner-sphere water molecule and the electrons of the Mn2+ ion is very weak (to the best of our knowledge the value of the A/ħ value is unknown). On the other hand, the contribution of the e2/(1+S2e22) term can be neglected at higher frequencies (>10 MHz). By taking into account these considerations, the scalar contribution to the overall relaxation rate of the inner sphere water protons is very small.
According to the Bloembergen-Morgan model,[26] the magnetic field dependence of the electronic relaxation times (T1e and T2e) of the paramagnetic ions is interpreted by the variation of the transient zero-field splitting (ZFST) of the electronic spin states resulted in by the interaction of the ligand fields of the solvent molecules and the donor atoms participating in the coordination of the metal ion. The magnetic field dependence of the electronic relaxation times are given by the following equations:
2 v 2 S 2 v 2 S v 2 1 1 4 4 1 1 3 ) 1 ( 4 25 1 1 S S Te (14)
2 v 2 S 2 v 2 S v 2 2 1 4 2 1 5 3 3 ) 1 ( 4 50 1 1 S S Te (15)where 2 and v are the mean-square ZFST energy and the correlation time for the modulation of the zero-field splitting interaction. The complete paramagnetic enhanced inner-sphere relaxation theory can be obtained by the combination of Eq. 4 and 5 with the Solomon-Bloembergen (Eqs. 6 – 11) and Solomon-Bloembergen-Morgan (Eqs. 14 and 15) models which are referred to as the Solomon-Bloembergen-Morgan (SBM) theory. According to the SBM theory, the various determinants of the inner-sphere proton relaxivity can be taken into account separately. Eqs. 4 – 15 clearly indicate that the relaxation enhancement of the inner-sphere water protons is limited by the residence time of the inner-inner-sphere water molecule
under the slow exchange conditions (M>>T1M) and by the relaxation rate of water protons directly coordinated to the paramagnetic center in the fast exchange condition (M<<T1M). Moreover the relaxation time of the water protons (T1M) is also influenced by the rate of the exchange between the coordinated and the bulk water molecules, the rotational correlation time (R) and the electronic relaxation time of the paramagnetic center (T1e, Eq. 14). The variation of the Mn – H distances (rMnH in Eqs. 7 and 10) and the hydration number (q in Eq. 4 and 5) strongly affects the inner-sphere relaxivity. In order to obtain an easy overview of the effects of these parameters, the inner-sphere relaxivity have been calculated as a function of water exchange (1/M) and the rotational correlation rates (1/R) by using fixed v and 2 values (Fig. 1A). These model calculations were also performed by the simulation of the inner-sphere relaxivities as a function of v and 2 at constant 1/M and 1/R values (Fig. 1B and C). The prediction of the inner-sphere relaxivity values were made at 0.47 and 1.41 T field strength. Figure 1 clearly shows that the exchange rate of the inner-sphere water molecule, the reorientation correlation time and the electron relaxation time strongly influence the value of the inner-sphere relaxivity, which decreases with the increase of the field strength. In order to obtain the maximum relaxivity value, the reorientation correlation time must be increased (R109 s-1) whereas the exchange rate of the inner sphere water molecule (1/M) must be within the 3 - 30107 s-1 range. The maximum of the inner-sphere relaxivity of the low molecular mass monohydrated Mn(II)-complexes is around 3.5 mM-1s-1 at 0.47 and 1.41 T field strength (Fig. 1A). With the use of the M=10 ns and R=100 ps values, the maximum of the inner-sphere relaxivity (r1pin=3.5 mM-1s-1) can be obtained at 2<11019 s-2 mean-square ZFST energy value (Fig. 1B). However, the elongation of the reorientation correlation time (R = 33 ns) results in the large variation of the maximum inner-sphere relaxivity as a function of v and 2 values at different field strength (Fig. 1C). At 0.47 T, the plateau of the relaxivity (r1pin=125 mM-1s-1) can be achieved at 2<41018 s-2 mean-square ZFST energy. However, the inner-sphere relaxation enhancement of the monohydrated Mn(II)-complex endowed with the slow reorientational correlation time (R = 33 ns) shows the maximum curve as a function of v and 2 values at 1.41 T field strength. The maximum of the r1pin is about 46 mM-1s-1 which can be attained at 1.41 T in the 2=2 – 8 1019 s-2 and
Figure 1. r1pis values as a function of log(1/M) and log(1/R) (A) and as a function of log(1/v) and logfor R=10 ps (B) and R=33 ns (C) (q=1; rMnH=2.75 Å)
4 5 6 7 8 9 1011 12 4 5 6 7 8 9 10 11 0 10 20 30 40 50 60 70 80 r1p is ( m M -1s -1) log1/ M log 1/R 4 5 6 7 8 9 10 11 12 4 5 6 7 8 9 10 11 0 5 10 15 20 25 30 35 40 45 50 r1p is ( m M -1s -1) log1/ M log1 /R B0= 0.47 T 2=21019 s-2 B0= 1.41 T v= 20 ps A 18.0 18.8 19.3 19.9 20.6 21.0 13.0 12.2 11.7 11.1 10.4 10.0 0.0 0.5 1.0 1.5 2.0 2.5 3.0 3.5 4.0 r1p is ( m M -1s -1) log 2 log1/ v 18.0 18.8 19.3 19.9 20.6 21.0 13.0 12.2 11.7 11.1 10.4 10.0 0.0 0.5 1.0 1.5 2.0 2.5 3.0 3.5 4.0 r1p is ( m M -1s -1) log 2 log1/ v M=10 ns R= 100 ps B 18.0 18.8 19.3 19.9 20.6 21.0 13.0 12.2 11.7 11.1 10.4 10.0 0 20 40 60 80 100 120 140 r1p is ( m M -1s -1) log 2 log1/ v 18.0 18.8 19.3 19.9 20.6 21.0 13.0 12.2 11.7 11.1 10.4 10.0 0 5 10 15 20 25 30 35 40 45 50 r1p is ( m M -1s -1) log 2 log1/ v M=10 ns R= 33 ns C
Hydration number of Mn(II)-complexes:
The contribution of the paramagnetic metal ions to the inner-sphere relaxivity values is directly proportional to the number of the water molecules (q) directly coordinated to the metal ion (Eq. 4). The aqua complex of Mn2+ ion contains six inner-sphere water molecules, which results in a high enhancement of the relaxation rate due to the fast exchange between the inner-sphere and the bulk water molecules. By taking into account the known biochemistry[32] and chemical properties of Mn2+-ion, the free Mn2+ can interact with enzymes[32,33] and the Ca2+ or Mg2+ binding sites of proteins[34,35] and nucleic acids[36] which limit the in vivo application of the Mn(II)-salts (e.g. MnCl2 or MnSO4) in the MRI investigations, and as we mentioned before the free Mn2+ ion is neurotoxic. Therefore, the highly stable and kinetically inert polyamino-polycarboxylate complexes of Mn(II), which prevent the release of Mn2+ ion, are proposed to use in biological systems.
Mn(II)-complexes are generally formed with the open-chain and macrocyclic polyamino-polycarboxylate ligands (Scheme 1). The coordination number, the q values, the relaxivity, the water exchange rate and the reorientational correlation time of the Mn(II)-complexes are presented in Table 1. The open-chain chelating agents are generally the derivatives of EDTA and DTPA ligands. The detailed 17O-NMR, relaxometric and X-ray diffraction studies in solution and solid state indicate that the coordination number of the Mn2+-ion is 7 with one inner-sphere water molecule in the Mn(EDTA) and in the EDTA derivative complexes.[2] However, the relaxivity of the Mn(DEBPN) complex is double of that of Mn(EDTA), which was explained by the coordination of two or three water molecules directly to the Mn2+-ion.[37] The DTPA ligand is octadentate which hinders the direct coordination of the water molecule to the Mn2+-ion.[38] The relaxation enhancement observed for the Mn(DTPA)-derivatives is derived from the outer- and second-sphere contributions.[38]
The coordination number of the Mn(II)-complexes formed with macrocyclic polyamino-polycarboxylate ligands is 6, 7 or 8, determined by the size of the macrocyclic ring and the nature of the donor atoms. The Mn(II)-ion is hexacoordinated with no inner-sphere water molecule in the complexes formed with the nine-membered NOTA and its derivative ligands.[39,40] The coordination number of the Mn(II)-ion is 6 in the Mn(II)-complexes of the dimeric ENOTA[41] and 9-aneN2O-2P ligands[42] which contain one inner-sphere water molecule per Mn(II)-center. Interestingly, the relaxometric studies of the Mn(9-aneN2O-2A) complex indicate the hydration equilibrium between the 6 and 7 coordinatated Mn(II) with one and two inner-sphere water molecules.
The 12-membered macrocyclic ligands used for the complexation of Mn2+-ion are generally the DOTA and its derivative ligands furnished with the reduced number of donor atoms. The coordination number of the Mn(II)-ion is 6 with no inner-sphere water molecule in the Mn(DOTA),[38], Mn(DO3A)[43] and Mn(1,4-DO2A)[44] and Mn(1,7-DO2A) complexes (80% of Mn(1,4-DO2A) is presented in monohydrated form in solution, so CN=7).[45] The gradual replacement of the acetate pendant arms of DOTA with amide groups results in the formation of Mn(II)-complexes with seven (e.g. Mn(DO3AM), Mn(DO3AM-cyOH)) and eight coordinated (Mn(DOTAM) Mn(II)-ions with no water molecule directly coordinated to the metal center.[38] Similarly to the DOTA derivatives, the coordination number of the Mn(II)-ion is 6 in the Mn(12-pyN4A) and Mn(12pyN4P) complexes with one inner-sphere water molecule.[46]
The structure of the Mn(II)-complexes of aza- or aza-oxa crown ethers are generally pentagonal-bipyramidal (CN=7) with two inner-sphere water molecules in the axial positions.[47] However, the nature of the donor atoms, the size and rigidity of the macrocyclic ring may influence the coordination number of the Mn(II)-ion. In the Mn(II)-complexes of 15-aneN5, 17-pydienN5, 18-pydienN5 and 15-pyaneN5, the Mn(II) is six-coordinated with an sphere water molecule, whereas the Mn(II)-ion is heptacoordinated with two inner-sphere water molecules in the complexes of 15-pydienN5, 16-pydienN5, 16-pyaneN5 and (NH2Et)2-15-pydienN5.[47] The Mn(II)-complexes of the membered macrocyclic 15-pyN3O2 and 15-pyN5 ligands are bis-hydrated with heptacoordinated Mn(II)-ion.[48] Similar structural phenomena were identified in the Mn(II)-complexes of porphyrins.[49,50]
The heptadentate AAZTA ligand can be regarded as a combination of open-chain and macrocyclic ligands, which represent the formation of the relatively flexible coordination cage wrapping around Mn2+-ion.[51] Because of the seven donor atoms, the coordination sphere of the Mn(II) is fully occupied in the Mn(AAZTA). The replacement of the acetate pendant arm with hydrogen or methyl group in the exocyclic imino-diacetate fragment of AAZTA results in the hexadentate AAZ3A, AAZ3AMA and MeAAZ3A ligands which can form Mn(II)-complexes in different hydration states. The hydration number of the Mn(AAZ3A)-derivative complexes are varied from 0.64, 0.32 and to 0.24 for the Mn(AAZ3A), Mn(MeAAZ3A) and Mn(AAZ3MA), which indicate that the coordination number of the Mn(II) are changed from mainly 7 to mainly 6 due to the different structural rigidity of the Mn(II)-complexes.[51]
Table 1. The relaxivity (r1p, 20 MHz), the coordination number (CN), the number of the inner-sphere water molecules (q), the water exchange rate (kex298) and the reorientational correlation time (τR298) for the Mn(II)-complexes.
r1p (25/37C; mM-1s-1) CN q kex298 (107 s-1) τR298 (ps) [Mn(H2O)6]2+[44] 7.4/6.76 6 6 2.1 30 (308 K) Mn(NTA)-[45] 6 2 150 Mn(EDTA)2-[45] 3.08 7 1 47.1 57 Mn(CyDTA)2-[47] 3.47 7 1 14 Mn(PhDTA)2-[46] 7 1 35 Mn(TMDTA)2-[48] 2.2 7 1 13 Mn(EDTA-BOM)2-[49] 3.6 7 1 9.3 83.7 Mn(EDTA-(BOM)2) 2-[49] 4.3 7 1 13 110.8 Mn(diPHEDTA)2-[50] 5.8 7 1 23 Mn2(ENOTA)[51] 3.39/2.71 6 1/Mn2+ 5.5 85 Mn(1,4-DO2A)[45] 2.1 7/6 0.87 113.4 46 Mn(DO1A)[45] 2.4 6 1 595.7 22 Mn(9-aneN2O-2A)[35] 2.83/2.30 6/7 1/2 119 22 Mn(9-aneN2O-2P)[52] 5.08/4.29 6 1 1.20 103 Mn(12-pyN4A)[53] 2.39/1.94 6 1 303 23 Mn(12-pyN4P)[53] 2.84/2.32 6 1 177 39 Mn(15-pyN3O2)2+[54] 4.48/3.61 7 2 0.38 40.3 Mn(15-pyN5)2+[54] 3.56/3.13 7 2 6.9 28.3 Mn(AAZ3A)-[55] 2.49 6/7 0.64 4.7 50 Mn(MeAAZ3A)-[55] 2.01 6/7 0.32 12.6 50 Mn(AAZ3MA)-[55] 1.90 6/7 0.24 13.3 51
Mn2+ - H distance:
The effect of the Mn2+ - H distance (rMnH) on the relaxation rate of inner-sphere water protons governed by dipole-dipole interaction between the electron and nuclear spins are clearly indicated in Eqs. 7 and 10. In order to visualize the effects of the Mn2+ - H distance, the inner-sphere relaxivity have been calculated as a function of rMn-H by using the fixed values of 2,
M, R and v (Figure 2).
Figure 2. The logarithmic inner-sphere relaxivity values (log r1pis) as a function of rMn-H at 20 MHz (, ◊) and 60 MHz (■, □). (2=11019 s2; M=10 ns, R=100 ps (open symbols), R=33 ns (filled symbols) and v=20 ps)
As shown in Figure 2, the inner-sphere relaxivity increases by about 50% with the 0.2 Å decrease of the rMn-H distance due to the dependence of the 1/TiDD
on the sixth power of the rMn-H. The reduction of the rMn-H distance can be promoted by two ways: i) the increase of the tilt angle of the Mn2+ O-H bond; ii) the increase of the electron delocalisation towards of the ligand or the residual charge of the Mn(II)-ion. The first possibility could be achieved by the H-bond formation between the coordinated water molecule and the strongly polarised donor groups attached to the appropriate side of the ligand, which distorts the angle of Mn2+ O-H bond. The second variation might be controlled by the engage of the unsaturated C – C into the ligand backbone or the substitution of the charged donor groups with neutral donor atoms. In this order, there is an intense scrutiny to optimize the structural feature of the polyamino-polycarboxylate ligands for the complexation of Mn2+.
In spite of the important role of the Mn2+ - H distance, it is difficult to obtain the rMn-H values experimentally because the tilt angle of the Mn2+ – O-H bond is not well defined in
1 10 100 1000
solution. The rMn-H values are generally deduced from the Mn2+ – OH2 distance that can be determined more easily. The Mn2+ – OH2 distances obtained from the solid-state X-ray structure are used to estimate the rMn-H value in solution. The average Mn2+ – OH2 and Mn2+ – OH2 distances of the [Mn(H2O)6]2+ and Mn(II)-complexes determined by X-ray diffraction studies in solid-state are presented in Table 2.
Table 2. The rMn-O and rMn-H distances of the Mn(II)-complexes determined by X-ray diffraction studies in solid state.
rMn-O (Å) rMn-H (Å) Ref. [Mn(H2O)6]2+ 2.17 2.68 53 Mn(EDTA) 2.24 2.84 56 Mn(CyDTA) 2.27 2.79 56 Mn(PhDTA) 2.24 2.80 57 Mn(DEBPN) 2.16 2.76 37 Mn2(ENOTA) 2.14 2.75 41 Mn(15-pyN3O2) 2.23; 2.29 2.76; 2.77; 2.79; 2.80 48 Mn(15-pyN5) 2.30; 2.27 2.77; 2.86; 2.74; 2.98 Mn(15-pydieneN5) 2.22 2.75 58 Mn(15-pyaneN5) 2.28; 2.24 2.78, 2.70
The solid-state structure of the Mn(EDTA), Mn(CyDTA), Mn(PhDTA), Mn(15-pyN3O2), Mn(15-pyN5), Mn(15-pydieneN5) and Mn(15-pyaneN5) complexes of heptacoordinated Mn(II) reveals that the rMn-O and rMn-H distances of the coordinated water molecules are 2.23 - 2.30 and 2.74 – 2.98 Å, respectively (Table 2). The X-ray analysis of the hexacoordinated Mn(II)-complexes ([Mn(H2O)6]2+ and Mn2(ENOTA)) indicate that the Mn2+ – OH2 and Mn2+
– OH2 distances are 2.14 – 2.17 and 2.68 - 2.75 Å, respectively (Table 2).
The comparison of the rMn-O and rMn-H values of heptacoordinated Mn(DEBPN) and Mn(EDTA) complexes (Mn(EDTA): rMn-O=2.24 Å, rMn-H=2.84 Å; Mn(DEBPN): rMn-O=2.16 Å, rMn-H=2.76 Å) shows that the replacement of the charged carboxylates with non-charged ester and pyridine groups results in the decrease of the Mn2+ – OH2 and Mn2+ – OH2 distances
References:
1. P. Caravan Chem. Soc. Rev., 2006, 35, 512.
2. B. Drahoš, I. Lukeš, É. Tóth, Eur. J. Inorg. Chem., 2012, 1975. 3. E. R. Andrew, Brit Med Bull., 1984, 40, 115.
4. D. M. Grant, R. K. Harris, Encyclopedia of Nuclear Magnetic Resonance, 1996. 3456. 5. P. Caravan, C. T. Farrar, L. Frullano, R. Uppal, Contrast Media Mol Imaging, 2009, 4: 89. 6. C. F. G. C Geraldes, S. Laurent, Contrast Media Mol Imaging, 2009, 4: 1.
7. S. Aime, D. Delli Castelli, S. Geninatti Crich, E. Gianolio, E. Terreno, Acc. Chem. Res., 2009, 42 (7) 822.
8. A. K. Srivastava, D. K. Kadayakkara, A. Bar-Shir, A. A. Gilad, M. T. McMahon, J. W. Bulte, Dis. Model
Mech., 2015, 8, 323.
9. C. Jacoby, S. Temme, F. Mayenfels, N. Benoit, M. P. Krafft, R. Schubert, et al. NMR Biomed., 2013, 27, 261.
10. G. M. Lanza, X. Yu, P. M. Winter, D. R. Abendschein, K. K. Karukstis, M. J. Scott, L. K. Chinen, et al.
Circulation, 2002 106, 2842.
11. E. Terreno, S. Aime Front. Pharmacol., 2015, 6, 290. 12. W. A. Gibby, K. A. Gibby, Invest Radiol., 2004, 39, 138.
13. W. P. Cacheris, S. C. Quay, S. M. Rocklage, Magn. Reson. Imaging, 1990, 8, 467.
14. T. Frenzel, P. Lengsfeld, H. Schirmer, J. Hutter, H. J. Weinmann, Invest Radiol., 2008, 43, 817. 15. J. L. Major, T. J. Meade, Acc. Chem. Res., 2009, 42, 893.
16. D. A. Carrier, J. J. Ford, L. A. Hayman, Am J Neuroradiol., 1993, 14, 363.
17. V. M. Runge, K. M. Dickey, N. M. Williams, X. Peng, Invest Radiol., 2002, 37, 393. 18. H. S. Thomsen, Eur Radiol., 2006, 16, 2619.
19. T. R. Elmholdt, M. Pedersen, B. Jorgensen, et al. Br J Dermatol., 2011, 165, 828. 20. S. P. Lin, J. J. Brown, J Magn Reson Imaging, 2007, 25, 884.
21. J. Crossgrove, W. Zheng, NMR Biomed., 2004, 17, 544.
22. M. Aschner, K. M. Erikson, D. C. Dorman, Crit. Rev. Toxicol., 2005, 35, 1. 23. A. C. Silva, J. H. Lee, I. Aoki, A. P. Koretsky, NMR Biomed., 2004, 17, 532. 24. M. G. Cersosimo, W. C. Koller, NeuroToxicology, 2006, 27, 340.
25. N. A. Bock, A. C. Silva, Future Neurol., 2007, 2, 297.
26. N. Bloembergen, E. M. Purcell, R. V. Pound, Phys. Rev., 1948 73, 679. 27. I. Solomon, Phys. Rev., 1955, 99, 559.
28. I. Solomon, N. Bloembergen, J. Chem. Phys., 1956, 25, 261. 29. N. Bloembergen, J. Chem. Phys., 1957, 27, 572.
30. N. Bloembergen, L. O. Morgan, J. Chem. Phys., 1961, 34, 842. 31. R. E. Connick, D. Fiat, J. Chem. Phys., 1966, 44, 4103. 32. D. W. Christianson, Prog. Biophys. Mol. Biol., 1997, 67, 217. 33. F. C. Wedler, R. B. Denman, Curr. Top. Cell Regul., 1984, 24, 153. 34. A. S. Mildvan, M. Cohn, Biochemistry, 1963, 2, 910.
35. S. Aime, S. Canton, S. G. Crich, E. Terreno, Magn. Reson. Chem., 2002, 40, 41. 36. J. Eisinger, F. Fawaz-Estrup, R. G. Shulman, J. Chem. Phys., 1965, 42, 43.
38. J. S. Troughton, M. T. Greenfield, J. M. Greenwood, S. Dumas, A. J. Wiethoff, J. Wang, M. Spiller, T. J. McMurry, P. Caravan, Inorg. Chem., 2004, 43, 6313.
39. C. F. G. C. Geraldes, A. D. Sherry, R. D. Brown III, S. H. Koenig, Magn. Reson. Med., 1986, 3, 242. 40. M. Tan, Z. Ye, E.-K. Jeong, X. Wu, D. L. Parker, D.-R. Lu, Bioconjugate Chem., 2011, 22, 931. 41. E. Balogh, Z. He, W. Hsieh, S. Liu, É. Tóth, Inorg. Chem., 2007, 46, 238.
42. B. Drahos, M. Pniok, J. Havlícková, J. Kotek, I. Císarová, P. Hermann, I. Lukes, É. Tóth, Dalton Trans.,
2011, 40, 10131.
43. S. Aime, P. L. Anelli, M. Botta, M. Brocchetta, S. Canton, F. Fedeli, E. Gianolio, E. Terreno, J. Biol.
Inorg. Chem., 2002, 7, 58.
44. A. Bianchi, L. Calabi, C. Giorgi, P. Losi, P. Mariani, D. Palano, P. Paoli, P. Rossi, B. Valtancoli, J.
Chem. Soc., Dalton Trans., 2001, 917.
45. G. A. Rolla, C. Platas-Iglesias, M. Botta, L. Tei, L. Helm, Inorg. Chem., 2013, 52, 3268.
46. B. Drahos, J. Kotek, I. Císarová, P. Hermann, L. Helm, I. Lukes, É. Tóth, Inorg. Chem., 2011, 50, 12785.
47. S. C. Jackels, M. M. Durham, J. E. Newton, T. C. Henninger, Inorg. Chem., 1992, 31, 234. 48. B. Drahos, J. Kotek, P. Hermann, I. Lukes, É. Tóth, Inorg. Chem., 2010, 49, 3224.
49. D. Lieb, A. Zahl, T. E. Shubina, I. Ivanovic-Burmazovic, J. Am. Chem. Soc., 2010, 132, 7282.
50. A. Budimir, J. Kalmár, I. Fábián, G. Lente, I. Bányai, I. Batinic- Haberle, M. Birus, Dalton Trans., 2010, 39, 4405.
51. L. Tei, G. Gugliotta, M. Fekete, F. K. Kálmán, M. Botta, Dalton Trans., 2011, 40, 2025.
52. P. M. T. Piggot, L. A. Hall, A. J. P. White, D. J. Williams, L. K. Thompson, Inorg. Chem., 2004, 43, 1167. 53. G. E. Kostakis, K. C. Mondal, C. E. Anson, A. K. Powell, Polyhedron, 2010, 29, 24.
54. P. Wang, J. P. Ma, Y. B. Dong, R. Q. Huang, J. Am. Chem. Soc., 2007, 129, 10620.
55. B. Wu, J. Liang, J. Yang, C. Jia, X. J. Yang, H. Zhang, N. Tang, C. Janiak, Chem. Commun., 2008, 1762.
56. X. F. Wang, J. Gao, J. Wang, Zh. H. Zhang, Y. F. Wang, L. J. Chen, W. Sun, X. D. Zhang Zh. Strukt.
Khim. (Russ.) (J. Struct. Chem.) 2008, 49, 753.
57. N. Nakasuka, S. Azuma, C. Katayama, M. Honda, J. Tanaka, M. Tanaka, Acta Crystallogr. Sect. C:
Cryst. Struct. Commun., 1985, 41, 1176.
58. O. Jiménez-Sandoval, D. Ramírez-Rosales, M. del Jesús Rosales-Hoz, M. E. Sosa-Torres, R. Zamorano-Ulloa, J. Chem. Soc., Dalton Trans., 1998, 1551.
Chapter 2
Outline of the thesis
The main goal of this thesis is the characterization in aqueous solutions of new Mn(II) complexes as MRI probes. Our investigation included thermodynamic, kinetic and detailed 1H and 17O NMR relaxometric measurements. We have taken into account Mn-complexes belonging to two different main types of structural units.
One encompasses the Mn(II) complexes containing the pentadentate coordinating units 6,6-((methylazanediyl)bis(methylene))dipicolinic acid. We considered several derivatives of the monomeric DPAMA ligand, including mono-, bi- and trinuclear bis-hydrated complexes (Chapter 4). In addition, we investigated a number of derivatives featuring different side arms and a couple of lipophilic derivatives (Chapter 5). All these complexes represent a fairly homogeneous series that has allowed us to obtain useful information on the relationship between the molecular structure, the thermodynamic stability and the relaxation parameters. The other class of complexes are those containing the macrocyclic unit cyclen and two coordinating pendant arms. These macrocyclic derivatives have been studied in detail, considering the chemical nature of the pendant arms, their relative position (cis/trans), the possible presence of isomers with different states of hydration, the kinetic and thermodynamic stability of the complexes and their relaxometric properties (Chapter 6). The synthesis of two novel derivatives bearing hydrophobic pendant groups enabled the investigation of the binding association with human serum albumin (Chapter 7).
The global set of experimental results has allowed us to deepen our understanding of the chemistry of Mn(II) complexes as potential MRI probes. We are confident that the new information gained will help in the future design and development of more effective and safer MRI contrast enhancing agents.
Chapter 3
Fast Field Cycling (FFC) NMR Relaxometry:
Field-cycling NMR relaxometry is the preferred technique for obtaining the frequency (or magnetic field) dependence of relaxation times (or equivalently of relaxation rates). For this reason it is also known as nuclear magnetic relaxation dispersion (NMRD).The relaxation of a nuclear magnetic spin in general is a function of experimental parameters such as temperature, pressure, sample composition and magnetic field, B0. Changing thermodynamic parameters, like the temperature, influences the physical or chemical state of the sample under investigation. Change of the magnetic field, however, has typically no influence on the chemistry of the sample. It is therefore a useful tool for separation of different interaction mechanisms and dynamic processes influencing the relaxation behavior. Fast Field Cycling (FFC) NMR relaxometry is an important analytical tool for NMR research and material characterization in both industrial and academic environments and has been successfully used in a wide range of fields. For example in: pharmaceutical, food, oil, gas and petroleum industry. FFC NMR relaxometry is a non-destructive low-field magnetic resonance method, which is performed in the range of a few kHz up to around 100 MHz, depending on the instrument. The information obtained is connected to the molecular dynamics of a material or complex substance through the characterization of the nuclear spin-lattice constant 1/T1 over a large range of magnetic field strengths, which is carried out on the same instrument (relaxometer). The technique is excellent in revealing information on slow molecular dynamics, which can only be done at very low magnetic field strengths. Examples of important molecular dynamics information that can be obtained through FFC NMR relaxometry:
• Characterization of rotational dynamics
• Identification of the presence of paramagnetic substances
• Evaluation of MRI CAs (coordination number, kinetics of exchange, electronic relaxation, correlation times in the spectrum of re-orientation and diffusional dynamics of molecules)
• Determination of aggregation states of complex biomolecules such as proteins
The magnetic field dependence of 1/T1 of a substance or material is shown in the graphical form as a Nuclear Magnetic Resonance Dispersion (NMRD) profile (Figure 1).
Figure 1. NMRD profile of a Mn(II) complex at 25 (black) and 37 °C (red)
The relaxation rate 1/T1 of a substance or material will tend to change when there is a variation in molecular dynamics, which may be caused by:
• change of state (e.g. solid to liquid; complex systems phase change, such as liquid crystals)
• concentration changes (e.g. effect on aggregation states of biomolecules) • temperature changes
• viscosity changes • paramagnetic impurities
FFC NMR relaxometry is a non-destructive method requiring a small amount of a solid or liquid sample (enough to fill a standard 10mm NMR tube to a volume of around 1cm3) with no other form of preparation required.
The basic FFC NMR experiment consists of cycling the Zeeman field, B0, which is applied to the sample, through three different values. In the first instance, a high magnetic field, Bpol (polarization field), is applied to pre-polarize the sample in order to boost signal intensity. The sample is then allowed to relax in a second field, Brelax (relaxation field), which can be set to any desired value, including zero. Finally, the field is set to the detection field, Bacq (acquisition field), for signal acquisition.[1]
Figure 2. Working of FFC NMR[1]
Changes in the relaxation rate, 1/T1, of a substance or material, are sometimes not evident at single magnetic field strengths, but when studied over a wide range of magnetic field strengths, as with FFC NMR relaxometry, changes are easier to identify as they are often more visible with the NMRD profile, especially at the lower magnetic field strengths.
Figure 3. The SmarTracer FFC-NMR relaxometer.
17
O NMR measurements:
In the 17O NMR measurements we measure the temperature dependence of the 17O NMR longitudinal and transverse relaxation rates as well as the chemical shifts of aqueous solutions of the Mn(II) complexes. The observed acceleration of the relaxation rates and the observed shift of the resonance frequencies can be described by the formulas developed by Swift and
Connick [2] for 1/T2 and Δω, the chemical shift difference, and by Zimmermann and Brittin[3] for 1/T1.
The detailed equations are in Chapter 4.
Figure 4. The superconductive magnet of the 500 MHz NMR spectrometer
pH-potentiometric titrations:
There are several ways to determine stability and protonation constants. In this work, we used direct pH-potentiometric titrations. The pH-potentiometry with a suitable ion-selective electrode can be a possibility to determine components (metal ion, ligand) equilibrium activity. A pH-potentiometric titration is one of the most common way to determine stability constants. The ligands are usually weak bases, so in the lack of metal ion the ligand is in a protonated form in a quite range pH-region. During the forming of the metal complexes a proton is removed from the coordinated group. Thanks to that with an indirect pH effect, we can use pH-potentiometry. The system is showing the difference in the pH during the measurement. In a pH-potentiometric titration, a generally used glass-electrode can be used between pH 1.7 and 11.8. The complexes stability constants can be calculated from the fit of the titration curves. For the calculation, it is necessary to know the ligand protonation
constants, and every other type of side effect that can have an influence of the complex’s formation. For example, we can calculate the stability constant with a general equation (Eq 1).
; r q pL H M rH qL pM pp qq r r H L M H L M pqr ] [ ] [ ] [ ] [
Figure 5. Titration curves of the well-known H3DO3A (1),and H4DOTA (2) ligands.
Figure 6. The automatic pH-potentiometric titrator.
References:
1. http://stelar.it/ffc_nmr.htm
2. T. J. Swift, R. Connick, E. J. Chem. Phys., 1962, 37, 307. 3. J. R. Zimmermann, W. Brittin, E. J. Phys. Chem., 1957, 61, 1328.
0 2 4 6 8 10 12 14 -3 -2 -1 0 1 2 3 4 5 6 pH ligand eq. 1 2
Chapter 4
Bis-Hydrated Mn
2+
Complexes with the
picolinate binding unit
Introduction:
Earlier we already mentioned that the application of Mn2+ complexes as MRI CAs was envisaged in the early times of MRI, in the late 1970s.[1,2] As a result of these pioneering studies a Mn2+-based CA, mangafodipir trisodium (Mndpdp, TESLASCAN, Scheme 1) was approved for clinical use. More recently, a mixture of MnCl2, alanine and vitamin D3, denoted as CMC-001, has been proposed as a CA for visualization of liver and bile, and it is currently undergoing phase III clinical trials.[3] Furthermore, preclinical safety assessment of Mndpdp serendipitously revealed superoxide dismutase activity, a useful property that can be potentially exploited for the treatment of several pathological conditions characterized by oxidative stress (i. e. cancer treatment, acute myocardial infarction…).[4]
An important advantage of Mn2+ CAs over the traditional Gd3+ counterparts is the lower toxicity of free Mn2+, which is highlighted by the formulation of CMC-001. On the other hand, the lower effective magnetic moment of Mn2+ complexes with respect to Gd3+ analogues generally results in lower relaxivities of the Mn2+ complexes.[5] An obvious strategy to increase relaxivity is to increase the number of water molecules coordinated to the paramagnetic ion (q), as the inner-sphere contribution to relaxivity is directly proportional to q. This approach has been successfully used to increase the relaxivities of Gd3+ complexes, although generally reducing the denticity of the ligand to increase the hydration number results in lower thermodynamic stabilities of the complexes.[6] Some attempts have also been made to obtain bis-hydrated Mn2+ complexes as potential MRI contrast agents, but the expected relaxivity gain was not observed due to a low exchange rate of the coordinated water molecule with the bulk water.[7] A second advantage of Mn-based contrast agents is that, in principle, they can be used as redox-sensitive MRI probes, providing that a suitable ligand stabilizes both Mn2+ and Mn3+.[8,9]
Scheme 1. Ligands mentioned in the chapter.
We decided to explore these issues and thus we have undertaken a study of the complexes based on a well-defined structural unit, the potentially pentadentate ligand dpama. So, we investigated the potential of the Mn2+ complex of H2dpama, mX(H2dpama)2 and mX(H2dpama)3. These ligand form, mono- bi- and trinuclear Mn2+ complexes potentially containing two water molecules coordinated to each metal center. These complexes are expected to display enhanced relaxivities, as well as relatively high affinities towards human serum albumin (HSA). In this chapter, we describe a detailed characterization of the Mn2+ complexes with these three ligands using 1H relaxometry and 17O NMR measurements. Furthermore, the ligand protonation constants and stability constants of the metal complexes were determined using potentiometric measurements. Cyclic voltammetry experiments were also carried out to investigate the relative stability of the Mn2+ and Mn3+ complexes. The hexadentate ligand H2bcpe was reported earlier.[10] It forms rather stable complexes with different divalent and trivalent metal ions.[11,12] Given the ability of Mn2+ complexes to form both six- and seven-coordinate complexes in aqueous solution, we have also checked whether
the [Mn(bcpe)] complex contains a coordinated water molecule or not by using 1H relaxometric measurements and X-ray diffraction studies.
Synthesis:
Prof. Carlos-Platas Iglesias, at the Departamento de Química Fundamental, Universidade da Coruña, performed the syntheses of the ligands. The H2dpama was synthesized in two steps. First step was a reaction of 6-chloromethylpyridine-2-carboxylic acid ethyl ester (1) with methylamine chlorohydrate in the presence of K2CO3,[13] followed by hydrolysis of the ethyl ester groups in 6 M HCl (Scheme 2). The desired ligand was isolated as the chlorohydrate salt with a yield of 66% over the two steps. This represents a 2.6-fold increase with respect to the yield reported previously for the analogous ligand derived from ethylamine.[14] Ligand mX(H2dpama)2 was prepared in 76% yield following a similar procedure by reaction of 1 with 1,3 phenylenedimethanamine (3) followed by acid hydrolysis of the ester groups. Reaction of H2dpama and mX(H2dpama)2 with Mn(ClO4)2·6H2O in the presence of triethylamine resulted in the formation of the charge neutral complexes [Mn(dpama)(H2O)2]·2H2O and [mX(Mn(dpama)(H2O)2)2]·6H2O, respectively, which were isolated in 65% yield. The synthesis of mX(H2dpama)3 (Scheme 3) was achieved in two steps by reaction of benzene-1,3,5-triyltrimethanamine (1b) and 6-chloromethylpyridine-2-carboxylic acid ethyl esther (2b) in the presence of K2CO3, and subsequent hydrolysis of the ethyl ester groups in 6M HCl. Reaction of the ligand with MnCl2·4H2O in the presence of trimethylamine produced the desired charge neutral complex. The synthesis of H2bcpe was achieved by following the previously reported procedure.[10] Reaction of H2bcpe with Mn(ClO4)2·6H2O in the presence of trimethylamine provided the charge neutral [Mn(bcpe)] complex, which was isolated in 60% yield The high-resolution mass spectra (ESI+) and analytical data confirm the formation of the desired neutral complexes (Figure 1-4).
Scheme 2. Synthesis of H2dpama and mX(H2dpama)2
Figure 1. Observed (left) and calculated (right) mass spectral isotopic distribution for the
fragment [Mn(dpama)+H]+ obtained from a solution of the complex in a H2O:CH3CN:MeOH mixture.
Figure 2. Observed (left) and calculated (right) mass spectral isotopic distribution for the
fragment [(mX(Mndpama)2+Na]+ obtained from a solution of the complex in a
H2O:CH3CN:MeOH mixture.
Figure 3. Observed (left) and calculated (right) mass spectral isotopic distribution for the
fragment [Na2mX(Mndpama)3]2+ obtained from a solution of the complex in a H2O:MeOH 1:1 mixture.
Figure 4. Observed (left) and calculated (right) mass spectral isotopic distribution for the
fragment [Mn(Hbcpe)]+ obtained from a solution of the complex in a H2O:MeOH 1:1 mixture.
Aiming to obtain information on the solution structure of the [Mn(dpama)(H2O)2] complex we turned our attention to theory. Prof. Carlos-Platas Iglesias carried out the DFT calculations and X-ray diffraction analyses. I report a representative figure of the optimized geometry and X-ray diffraction analyses of the Mn(II) complexes.
Figure 5. Optimized geometry of the [Mn(dpama)(H2O)2]·4H2O complex obtained with DFT
calculations performed in aqueous solution at the TPSSh/SVP level. (left) Average bond distances (Å) of the MnII
coordination environment: Mn-Owater 2.205(1); Mn-OCOO 2.335(64);
Mn-Namine 2.569; Mn-NPY 2.287(9). Optimized geometry of the
[mX(Mn(dpama)(H2O)2)3]·12H2O complex obtained with DFT calculations performed in aqueous solution at the TPSSh/SVP level.(right) Average bond distances (Å) of the Mn2+ coordination environment: Mn-Owater 2.213(19); Mn-OCOO 2.315(58); Mn-Namine 2.620(6); Mn-NPY 2.280(14). Hydrogen atoms, except those of water molecules, have been omitted for simplicity.
Figure 6. View of the X-ray structure of the [Mn(bcpe)] complex. Water molecules and
hydrogen atoms are omitted for simplicity. The ORTEP plot is at the 30% probability level. Bond distances: Mn(1)-O(1), 2.1771(12); Mn(1)-O(3), 2.1783(12); Mn(1)-N(1), 2.1919(15); Mn(1)-N(4), 2.1948(15); Mn(1)-N(2), 2.3046(14); Mn(1)-N(3), 2.3217(14) Å.
Ligand protonation constants and stability constants of the metal complexes:
The protonation constants (logKiH) of the previously mentioned ligands investigated in this
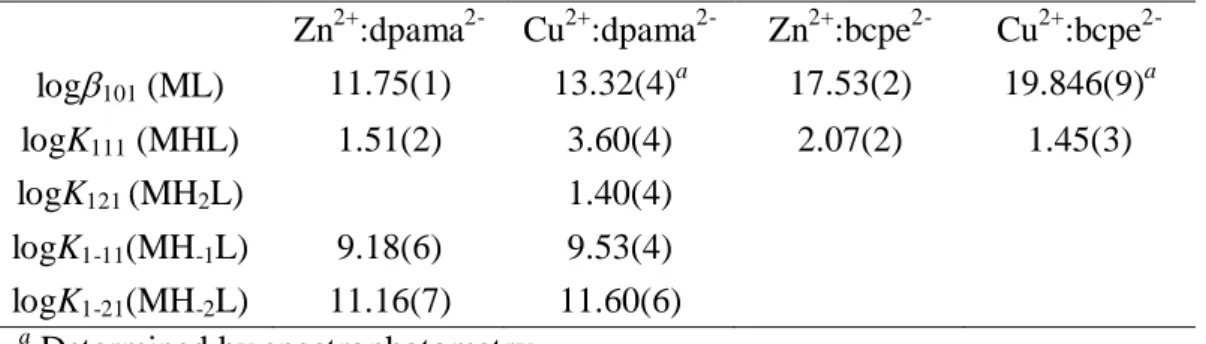
chapter have been determined by pH-potentiometry in 0.15 M NaCl. The values of the constants and standard deviations are listed in Table 1. The protonation constants are defined by eq 1: Hi-1L + H+ HiL ] L][Η [Η L] [Η Κ 1 i i Η i i=1, 2,…, 8. (1) Table 1. Protonation constants of ligands bcpe2-, dpama2-, mX(dpama)24-, mX(dpama)36- and picolinate (0.15 M NaCl, 298 K)
dpama2- mX(dpama)24- mX(dpama)36- bcpe2- Picolinatea
logK1H 7.82(1) 7.77(1) 7.73(1) 8.83(2) 5.25 logK2H 3.71(2) 6.49(1) 6.82(1) 6.22(3) 0.92 logK3H 2.61(2) 4.24(2) 6.06(1) 3.27(3) - logK4H - 3.45(2) 4.31(1) 2.03(3) - logK5H - 2.93(2) 3.70(1) - logK6H - 2.24(2) 3.30(1) - logK7H - - 2.79(1) - logK8H - - 2.36(1) - 1.01(3) ∑logKiH 14.14 27.13 38.09 20.36 6.17 a


![Figure 5. Optimized geometry of the [Mn(dpama)(H 2O)2]·4H2O complex obtained with DFT](https://thumb-eu.123doks.com/thumbv2/123dokorg/4807456.49666/39.892.187.750.600.773/figure-optimized-geometry-mn-dpama-complex-obtained-dft.webp)
![Figure 10. Species distribution diagram of the Mn 2+ - bcpe system at metal-to-ligand ratio 1:1 ([bcpe]=1.0 mM, 0.15 M NaCl, 298 K)](https://thumb-eu.123doks.com/thumbv2/123dokorg/4807456.49666/46.892.255.640.115.381/figure-species-distribution-diagram-metal-ligand-ratio-nacl.webp)
![Figure 14. Reduced transverse (blue ) 17 O NMR relaxation rates and 17 O NMR chemical shifts (red ) measured for [Mn(dpama)] at 11.74 T](https://thumb-eu.123doks.com/thumbv2/123dokorg/4807456.49666/50.892.74.824.167.542/figure-reduced-transverse-relaxation-chemical-shifts-measured-dpama.webp)
![Figure 18. Proton relaxation rate at 0.47 T and 310 K of a 0.98 mM solution of [Mn(dpama)]](https://thumb-eu.123doks.com/thumbv2/123dokorg/4807456.49666/57.892.235.661.457.729/figure-proton-relaxation-rate-and-solution-mn-dpama.webp)

