© Faculty of Mechanical Engineering, Belgrade. All rights reserved FME Transactions (2018) 46, 253-258 253
Received: June 2017, Accepted: October 2017 Correspondence to: Prof. Carlo Santulli, School of Architecture and Design, University of Camerino, Viale della Rimembranza, 63100 Ascoli Piceno, Italy E-mail: [email protected]
doi:10.5937/fmet1802253M
C. Mahil Loo Christopher Research Scholar Sathyabama University Department of Mechanical Engineering India T. Sasikumar Professor Lord Jegannath College of Engineering & Technology Department of Mechanical Engineering
India C. Santulli Associate Professor Università degli Studi di Camerino School of Architecture and Design Italy C. Fragassa Assistant Professor Alma Mater Studiorum University of Bologna Department of Industrial Engineering Italy
Neural Network Prediction of
Aluminum–Silicon Carbide Tensile
Strength from Acoustic Emission Rise
Angle Data
In this work, the ultimate strength of aluminum/silicon carbide (Al/SiC) composites was predicted by using acoustic emission (AE) parameters through artificial neural network (ANN) analysis. With this aim, a series of fourteen Al/SiC tensile samples were loaded up to the failure to investigate the amplitude distribution of AE events detected during loading. A back propagation ANN was prepared to correlate the amplitude values generated during loading up to 60% of known ultimate strength with ultimate failure strength of the samples. Three individual neural networks generated with parameters like hits, the Felicity ratio and rise angle were trained towards anticipating the ultimate strength value, which was predicted within the worst case error of -3.51 %, -4.73 %, and -2.73 %, respectively. The failure prediction accuracy by using rise angle as input was found to be slightly better, although the three neural networks all proved effective.
Keywords: Failure prediction, Acoustic emission, Felicity ratio, Rise
angle, feed forward neural network. 1. INTRODUCTION
Acoustic emission (AE), based upon the ultrasonic waves that are released by any fracture occurrence, is largely utilized for continuous monitoring of the state of materials and structures [1-6]. AE activity has a com– plex relation with the severity of cracks produced, in general terms a high rate of detected signals suggests the presence of irreversible damage, in the same way that low or zero activity would be associated with the material rigidity being preserved.
The use of a grid including few AE sensors does offer more information, permitting to localize AE events, therefore estimating which part of the structure has suffered a broader decay, allowing a better desc– ription of the geometric area of the fracture [7-9]. The waveform shape relies upon the fracture mode, but depends also on wave velocity across the material, which in turn depends also empowering the grouping of splits in various materials [10-12]. The signal is filtered through a minimum user set voltage to avoid back– ground noise. The waveform shape has also been evaluated through the variations of rise angle, which is the proportion of the rise time to the amplitude of the waveforms and that gives the idea of how much of the wave arrives in longitudinal mode (high rise angle) and how much in shear mode (low rise angle) [13].
In the particular case of metal matrix composites, the success of acoustic emission as a monitoring technique
has been quite limited so far, although some studies do exist. It was revealed that the parameters used for analysis are not always the same as in the case of polymer composites: for example, AE rise time and duration were effectively correlated with corrosive processes in these materials [14].
In fatigue testing, the rise angle value, defined as the ratio between the rise time and the peak amplitude of the signal, presents a clear shift well before that significant damage is produced [3-6, 15]. The reason why rise angle should bear some relation with damage produced in the composite is explained below. As suggested above, when a tensile event occurs, the sides of the splitting ends move far from each other, prompting a transient volumetric change of the material: consequently most of the activity is transmitted as longitudinal waves, while just a smaller portion as shear waves, which diffuse with lower velocity [16]. Therefore, in a tensile event, rise time, hence the delay between the onset of damage and reaching the peak amplitude, is short, which results in a high rise angle, as can be observed in Figure 1, where the signal is divided in primary wave, hence rise, and secondary one, hence decay.
Figure 1. Typical AE rise angles for tensile and shear mode of failure.
254 ▪ VOL. 46, No 2, 2018 FME Transactions
In this study, AE activity was likewise observed to check for the variation of AE features as the crack engendering rate is increased and damage is being gathered. Waveform parameters that have been appe– aring sensitive to damage produced in composite mate– rials, with particular attention to rise angle were analyzed for their effectiveness in damage observing in terms of crack engendering rate between progressive modes. Moreover, artificial neural networks were trai– ned to validate results obtained during tensile tests using AE parameters.
2. EXPERIMENT
2.1 Training and Testing of ANN Network
Feed forward back propagation artificial neural network uses a supervised learning algorithm [17], which is shown in Figure 2 and consists of input, hidden and output layers. When preparing this network, evaluations were carried out from input layer transformed toward the output layer of the network [18], to find the errors compared to known output values. Feed forward networks typically have one or additional hidden patterns of sigmoid neurons followed by an output layer of linear neurons [19]. Multiple layers of neurons with nonlinear transfer functions allow the network to learn nonlinear and linear relationships between input and output vectors because these neurons are not directly accessible [20]. The hidden neurons extricate critical elements contained in the input data. The outputs of a network such as between 0 and 1 are produced, so that the output layer can be used as a sigmoid transfer function [21].
Figure 2. Feed forward neuron model.
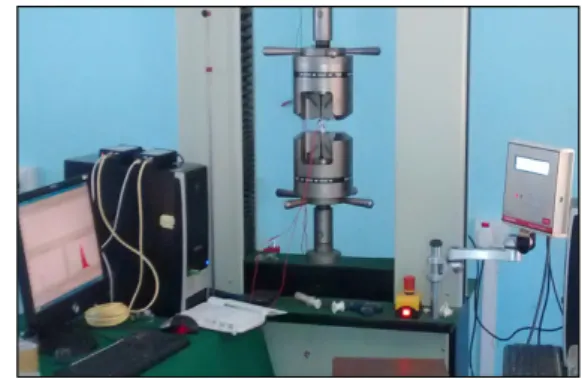
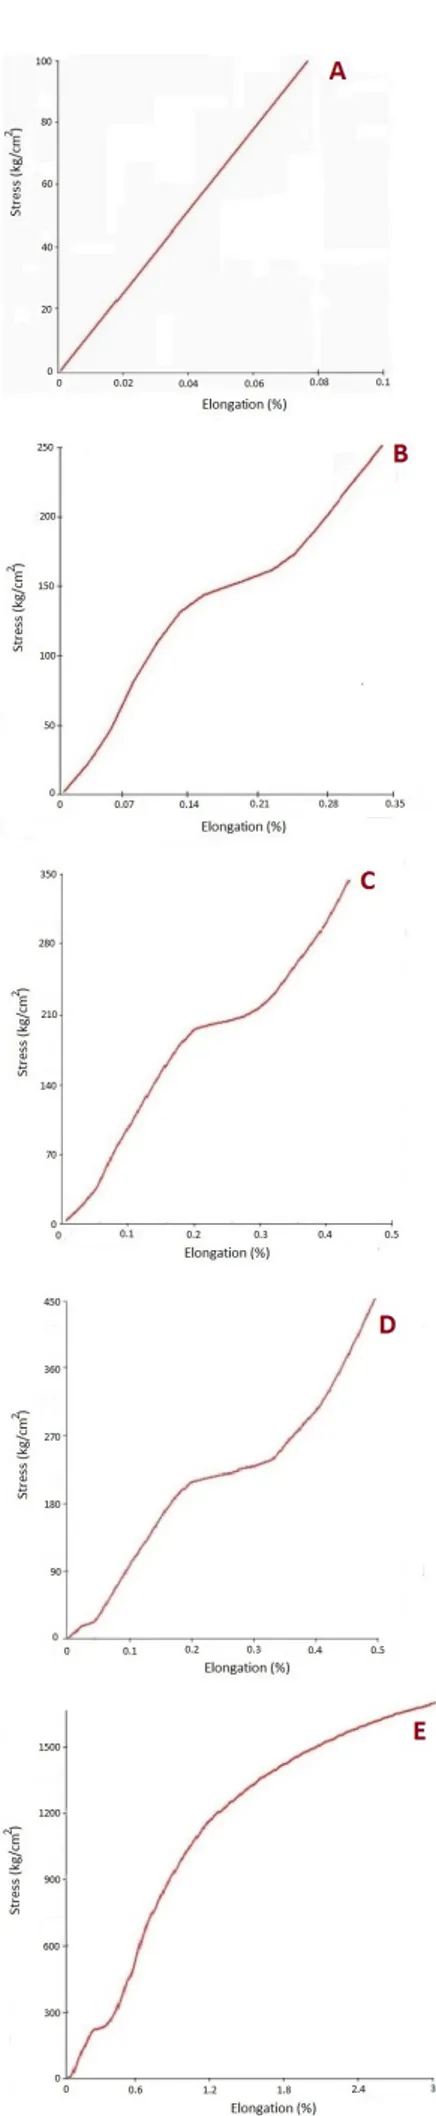
Al 6061 as matrix material and SiC particles added as reinforcements were used in this study. The samples, produced by using stir casting process [22], have 100 mm length, 6 mm thickness and 6 mm width, and were cut as per ASTM B557M-15 standard. Tensile tests were conducted on the 100 kN capacity universal testing machine as shown in Figure 3. AE activity was monitored by using computer controlled Physical Acou–stic Corporation (PAC) DISP AE system. The sensors are mounted on both sides of the sample by using silicone vacuum grease for proper signal transmission. Effective measurement from AE channels was verified before the test using pencil lead break test (ASTM E976-99). A threshold value of 40 dB was set to avoid background noises. Loading and unloading was perfor–med on the samples with an operating speed of 0.25 mm/s. It should be noted though that the stress strain curve shown in Figure 4 and disaggregated into five different sections
during tensile loading was highly nonlinear and therefore it was not easy to obtain structural information from it, not even to evaluate the elastic limit of the material to lead to some possible indication of the ultimate strength. The partition of the curve into different sections would in principle facilitate measurement, however, as a matter of fact it results confusing, in particular since linearity and non-linearity are alternate in a quite fuzzy way, moreover variable over the set of samples examined.
Loading, discharging and reloading allowed measu– ring the Felicity ratio, as the ratio between the load at which acoustic emission resumes and the load previ– ously reached [23]. In practical terms, the Felicity ratio was examined over the successive incremental load steps, involving loading of the material at 50, 100, 150, 200, 250, 300, 350, 400 kg/cm², and then up to failure. The load is always reset to zero at the onset of each cycle. At the same time, AE data were also gathered to predict the ultimate failure strength of the sample by using back propagation neural network in the Matlab-10 workspace.
Figure 3. Photography of testing setup. 3. RESULTS AND DISCUSSION
In Figure 4 the evolution of a typical stress-strain curve is reported. As it can be noticed, the stress significantly rises in the latter part of the curve to failure (Figure 4e): this is due to the progressive fracturing of the material, which leads to possible inaccuracy of the final part of the test, both in terms of stress and elongation values, since the two parts of the sample gradually detach from each other in a hardly predictable way. It can be suggested therefore that the only indication that can be retained as reliable during tensile tests on these materials is the sample strength.
In practical terms, ten samples were used to train the system and to predict the strength of the remaining four. The strength data obtained over the training set are given in Table 1 and show a significant variability, the average value including standard deviation being 5.43 ± 0.32 kN.
Table 1. Training samples ultimate strength results. Sample nr. Ultimate strength (kN)
1 5.07 2 5.12 3 5.33 4 5.26 5 5.18 6 5.28 7 6.00 8 5.71 9 5.65 10 5.74
FME Transactions VOL. 46, No 2, 2018 ▪ 255 Figure 4. Stress-strain curve obtained during tensile testing
of a sample up to: (A) 100 kg/cm² (B) 250 kg/cm² (C) 350 kg/cm² (D) 450 kg/cm² (E) failure.
Figure 5. Amplitude (dB) distribution of acoustic emission hits obtained during tensile testing of ten samples. 3.1 Acoustic emission results
The amplitude distribution of AE signatures shown in Figure 5 revealed some distinct differences in the AE response of the ten samples tested.
For the Al-SiC reinforced material the amplitude of hits was in the range from 40 to 100 dB with the maximum number of hits occurring in the range between 45 and 50 and in one case (sample nr. 8), anomalous with respect to the other up to 60 dB. It was noted in all the tested samples that hits generated during the initial stage of loading generally had lower amplitudes and that higher amplitudes mostly occurred at a higher level of load, an example is shown in Figure 6. It needs to be noticed also that after reaching the maximum load, when the samples start fracturing, no more acoustic emission is basically recorded.
Similarly, the rise time values of the AE signals at the early stage of loading are relatively low, but at higher loads high rise time values are recorded. Hits, rise time are collected from event with amplitude between 40 dB and 100 dB. The average values of the AE parameters hits and Felicity ratio are taken corresponding to amplitude. Trigonometric function tan θ, expressed as the ratio between amplitude and rise time, is utilized to isolate the shear mode waveforms, as shown in Figure 7. In case of a shear crack, the shape of the region near the crack is transiently influenced, shifting the proportion of energy to shear waves, which are slower. In this way, the most critical part of the waveform arrives later than the quick longitudinal arrivals, prompting to longer RT and consequently small rise angle are taken as shear waves.
256 ▪ VOL. 46, No 2, 2018 FME Transactions Figure 6. AE amplitudes vs. loading stress (sample nr.8).
Figure 7. Shear mode AE waveform. 3.2 Neural network analysis
Information was fed into the system through a variety of info neurons. Every information neuron was then completely associated by a progression of weighing capacities to a layer of hidden neurons and these were thus completely associated with the yield neuron. A bias neuron was weight associated with the hidden and yield layer neurons to serve, as a consistent reference or counterbalance esteem in the system. The weighting capacities serve as the memory of a prepared system by giving a multiplier between a going before neuron's yield esteem and a resulting neuron's information esteem.
A back propagation neural system works by mini– mizing the error between the created yield and the actual yield utilizing gradient descent approach. Randomized weights are at first given to the interconnections of the system and a yield worth is figured because of info information set. An error is then computed also, standardized so that an exchange capacity can decide the change, to back engender to each of the associations in the system. This procedure is then repeated until the error comes to a targeted limit. Ten training AE information sets shown in Table 1, were created by applying tensile loading up to breakage, while the AE action was observed with a single Physical Acoustics Corporation (PAC) R15 sensor.
Just the part of the AE amplitude information gathered up to 60% of the known failure load was applied as inputs to the measurable investigation and neural system models. Four extra tests were loaded to breakage and examined independently to give a test base to definitive quality forecast failure strength.
The first neural system was prepared utilizing the amplitude parameters as inputs to find the similarities with the trained actual load. A two layer system comprising of just an input and yield layer was utilized, since it was known from the existing experimental work that the parameters were directly identified with a definitive quality of the samples. The output of the back propagation system prepared with the testing samples appeared in Table 2. This was observed as being the essential classifier for foreseeing a definitive quality of the samples with a most extreme 5.89 % of error at the sample 14. On the other hand, when the Felicity ratio and amplitude parameter was utilized as a part of the item just a marginally better expectation 5.44% error at the sample 14 was made in the preparation set. In this way, the neural system methodology of mapping the amplitude, amplitude and FR parameters to the referred targeted ultimate strength was not as exact as the measurable examination shown in Figure 8.
It was imagined that a superior extreme failure forecast could be given by preparing the system with the characteristic of the waveforms obtained during loading. It was suggested that shear waves produce smaller angles due to longer rise time: these angles were calculated by a trigonometric function that gives only the stress waves obtained during the creation of cracks.
The background noises, which are detected at every further amplitude step of 1 dB, are discarded, and would serve as the contribution to the neural system. For this approach a multi-layer system was utilized.
The application of middle layer permits the system to portray the inconspicuous varieties in the conveyance and relate them to the known extreme strength in the preparation set [24]. The network engineering was constructed around a 61 neuron input layer, a 59 neuron hidden layer, a completely associated bias, furthermore, one output layer neuron for anticipating the ultimate failure strength. The distinct varieties found in the amplitude distribution were related to the samples reaching their maximum strength: a maximum worst case error of 1.3% related to sample nr. 12 was obtained.
Execution assessments of various composed models were looked at taking into account based on mean square error and correlation coefficient, Subsequent to training and evaluation, the generalization performance of the system is assessed with the test information that contains the combination of both typical as well as failure strength. An ANN of structure 61-59-1 was developed for the ultimate strength prediction was found.
The performance of the ANN during training, validation and testing gives the best training perfor– mance 0.0943 at 5 iterations (epoch), where error con– vergence threshold of 7x10⁻⁸ was met at 5 epoch, as shown in Figure 9. The network was developed using Matlab 10 neural network toolbox. In Figure 10 all the fourteen failed samples are shown, the fracture is very complicated and also not repeatable from one sample to the other, which justifies the previously noticed unre– liability of measurements taken after reaching the maximum load. It needs to be noticed that for sample number 8, which shows a markedly different AE signa– ture, the failure is closer to the grip ends than for all the other samples.
FME Transactions VOL. 46, No 2, 2018 ▪ 257 Figure 8. Error comparison by feed forward algorithm.
Figure 9. Artificial neural network (ANN) performance result for 61-59-1.
Figure 10. Fractured samples (for testing 1-10, for evaluation 11-14).
Table 2. Neural network analysis testing results. Event frequency Amplitude and Felicity ratio Rise angle Sample nr. Actual strength (kN) Predicted strength (kN) and error (%) Predicted strength (kN) and error (%) Predicted strength (kN) and error (%) 11 5.47 (+0.55) 5.5 5.47 (0) (-0.73) 5.43 12 5.33 (+0.38) 5.35 (+5.16) 5.62 (-1.31) 5.26 13 5.47 (+2.74) 5.62 (-5.30) 5.18 (-0.73) 5.43 14 5.33 (-4.13) 5.11 (+2.63) 5.47 5.43 (0) 4. CONCLUSION
The trial work in this paper showed that a feed forward artificial neural network model can be used to anticipate the extreme failure strengths in aluminum/silicon carbide tensile specimens by utilizing the low-rise angle (shear waves) distribution data, as the input vectors with the known ultimate strengths as the output vectors. Only the amplitude portion of the AE data taken up to 60% of the expected failure strength, (from a series of ten training specimens) was used in the input training vectors. The hidden layer of the neural network could concentrate and guide the distinction features of the amplitude distribution data to the known failure strengths of the samples tried. The procedure permitted a worst case ultimate strength prediction error of 1.3%. This is much lower than the 5.89% and 5.44% of worst case error from the other AE parameter analysis. The neural network was not able though to correlate the amplitude and Felicity ratio parameters with the ultimate strength of the specimen. This paper focuses on the waveform parameters like rise time and amplitude to the characteristics of the tensile and shear modes. Shear wave angle as input and ultimate strength as targeted output has predicted the failure of the specimen with low error margin.
REFERENCES
[1] Qamhia, I.L.-H.E. and El-Hajjar, R.F.: Identifi– cation of acoustic emissions from porosity and waviness defects in continuous fiber reinforced composites, ACEM, Vol. 2, No. 1, pp. 37–50, 2013. [2] Woo, S.C., Choi, N.S. and Cho, N.: Characterization
of the fracture process of notched glass fiber/ aluminum hybrid laminates by acoustic emission, Computer Science and Technology, Vol. 68, pp. 1521-1530, 2008.
[3] Petrašinović, N., Petrašinović, D., Rašuo B., Milković D.: Aircraft Duraluminum Wing Spar Fatigue Testing, FME Transactions, Vol. 45, No. 4, pp 531-536, 2017.
[4] Kastratović, G., Vidanović, N., Grbović, A., Rašuo, B.: Approximate determination of stress intensity factor for multiple surface cracks, FME Transactions, Vol. 46, No. 1, pp 41-47, 2018.
258 ▪ VOL. 46, No 2, 2018 FME Transactions
[5] Grbovic, A., Rasuo, B.: FEM based fatigue crack growth predictions for spar of light aircraft under variable amplitude loading, Engineering Failure Analysis, Volume 26, December 2012, Elsevier Ltd., pp. 50-64.
[6] Grbovic, M. A., Rasuo, B.: Chapter 2: Use of Modern Numerical Methods for Fatigue Life Predictions (pp.31-74), In: Recent Trends in Fatigue Design, (Ricardo Branco, Editor), Series: Mechanical Engineering Theory and Applications, Nova Science Publishers, New York, 2014.
[7] Aggelis, D.G., Shiotani, T., Momoki, S. and Hirama, A.: Acoustic emission and ultrasound for damage characterization of concrete elements, ACI Mat J, Vol. 106, No. 6, pp. 509-514, 2009.
[8 Grosse, C., Reinhardt, H. and Dahm, T.: Locali– zation and classification of fracture types in con– crete with quantitative acoustic emission measure– ment techniques, NDT&E Int, Vol. 30, No. 4, pp. 223–230, 1997.
[9] Yuyama, S., Yokoya, K., Niitani, K., Ohtsu, O. and Uomoto, T.: Detection and evaluation of failures in high-strength tendon of prestressed concrete bridges by acoustic emission, Constr Building Mater, Vol. 21, pp. 491–500, 2007.
[10] Anastassopoulos, A.A. and Philippidis, T.P.: Clustering methodology for evaluation of acoustic emission from composites, J. Acoustic Emission Vol. 13, No. 1/2, pp. 11–22, 1994.
[11] Ohtsu, M. and Tomoda, Y.: Phenomenological model of corrosion process in reinforced concrete identified by acoustic emission, ACI Materials Journal, Vol. 105, No. 2, pp. 194–200, 2007. [12] Shiotani, T., Ohtsu, M. and Ikeda, K.: Detection
and evaluation of AE waves due to rock deformation, Constr. Building Mater, Vol. 15, No. 5–6, pp. 235–246, 2001.
[13] Aggelis, D.G., Mpalaskas, A.C., Ntalakas, D. and Matikas, T.E.: Effect of wave distortion on acoustic emission characterization of cementitious materials, Constr Building Mater, Vol. 35, pp. 183-190, 2012. [14] Farid Uddin, A.K.M., Numata, K., Shimasaki, J.,
Shigeishi, M. and Ohtsu, M.: Mechanisms of crack propagation due to corrosion of reinforcement in concrete by AE-SiGMA and BEM, Constr Building Mater, Vol. 18, pp. 181-188, 2004.
[15] Soulioti, D., Barkoula, N.M., Paipetis, A., Matikas, T.E., Shiotani, T. and Aggelis, D.G.: Acoustic emission behaviour of steel fibre reinforced concrete under bending, Constr Building Mater, Vol. 23, pp. 3532-3536, 2009.
[16] Boinet, M., Bernard, J., Chatenet, M., Dalard, F., Maximovitch, S.: Understanding aluminum beha– viour in aqueous alkaline solution using coupled techniques: Part II: acoustic emission study, Elec– trochimica Acta, Vol. 55, pp. 3454–3463, 2010. [17] Tyagi, C.S.: A comparative study of SVM
classifiers and artificial neural networks application for rolling element bearing fault diagnosis using wavelet transform preprocessing. World Academy
of Science, Engineering and Technology, Vol. 43, pp. 309-317, 2008.
[18] Wu, J.D. and Liu, C.H.: Investigation of engine fault diagnosis using discreet wavelet transform and neural network, Expert Systems with Applications, Vol. 35, No. 3, pp. 1200-1213, 2008.
[19] Goyal, S and Kumar Goyal, G.: Cascade and Feedforward Backpropagation Artificial Neural Network Models for Prediction of Sensory Quality of Instant Coffee Flavoured Sterilized Drink. Canadian Journal on Artificial Intelligence, Machine Learning and Pattern Recognition, Vol. 2, No. 6, August 2011.
[20] Deka, P.C and Diwate, S.N.: Modeling compressive strength of ready mix concrete using soft computing techniques, Int J Earth Sc. Eng, Vol. 4 No. 6, pp. 793-796, 2011.
[21] Saridemir, M.: Predicting the compressive strength of mortars containing metakaolin by artificial neural networks and fuzzy logic, Adv Eng Soft, Vol. 40, No.9, pp. 920– 927, 2009.
[22] Hashim, J., Looney, L. and Hashmi, M.S.J.: Metal matrix composites:productionbythestircasting me- thod, J Mat Process Tech Vol.92–93, pp.1–7, 1999. [23] Ono, K. and Gallego, A.: Research and
Applications of AE on Advanced Composites, J Acoustic Emission, Vol. 30, pp. 180-228, 2012. [24] Sasikumar, T., Rajendraboopathy, S., Usha, K.M.
and Vasudev, E.S.: Failure strength prediction of unidirectional tensile coupons using acoustic emission peak amplitude and energy parameter with artificial neural networks, Comp Sci Tech, Vol. 69, No. 7–8, pp. 1151-1155, 2009. ПРЕДВИЂАЊЕ НЕУРОНСКЕ МРЕЖЕ ЗАТЕЗНЕ ЧВРСТОЋЕ АЛУМИНИЈУМ-СИЛИЦИЈУМ-КАРБИДА ИЗ АКУСТИЧНЕ ЕМИСИЈЕ УГЛА ЗВУКА Ц.М.Л. Kристoфер, Т. Сасикумар, K. Сантули, K. Фрагаса У овом раду предвиђена је крајња јачина композита алуминијум/силицијум карбида (Al/SiC) коришћењем параметара акустичне емисије (AE) кроз анализу вештачке неуронске мреже (ANN). Са овим циљем, серија од четрнаест затезних узорака Al/SiC била је учитана до настанка оштећења да би се истражиле амплитудне сметње АЕ догађаја откривених током оптерећења. ANN пропагација позадинског слоја је припремљена да би се нашла у вези са вредностима амплитуде насталих током учитавања до 60% познате чврстоће са коначном јачином отказа узорака. Три индивидулне неуронске мреже генерисане са параметрима као што су удари, Felicity фактор и угао пораста обучени су за предвиђање коначне вредности чврстоће, што је било предвиђено у најгорем случају грешке -3,51%, -4,73% и -2,73%, респективно. Утврђено је да је прецизност предвиђања неуспеха коришћењем угла звука као инпута нешто боље, мада су три неуронске мреже све показале ефективност.