Eionet Report - ETC/WMGE 2019/5
October 2019
Plastics waste trade and the environment
Authors:
Alessio D’Amato (SEEDS), Susanna Paleari (IRcRES-CNR), Maija Pohjakallio
(VTT), Ive Vanderreydt (VITO), Roberto Zoboli (SEEDS)
ETC/WMGE consortium partners: Flemish Institute for Technological Research (VITO), CENIA, Collaborating Centre on Sustainable Consumption and Production (CSCP), Research Institute on Sustainable Economic Growth of National Research Council (IRCrES), The Public Waste Agency of Flanders (OVAM), Sustainability, Environmental Economics and Dynamic Studies (SEEDS), VTT Technical Research Centre of Finland, Banson
Communications Ireland (BCI), The Wuppertal Institute for Climate, Environment, Energy (WI), Slovak Environment Agency (SEA)
Cover photo © SlobodanMiljevic, 25 June 2015 iStock photo ID 478409692
Legal notice
The contents of this publication do not necessarily reflect the official opinions of the European Commission or other institutions of the European Union. Neither the European Environment Agency, the European Topic Centre on Waste and Materials in a Green Economy nor any person or company acting on behalf of the Agency or the Topic Centre is responsible for the use that may be made of the information contained in this report.
Copyright notice
© European Topic Centre Waste and Materials in a Green Economy (2019) Reproduction is authorized provided the source is acknowledged.
More information on the European Union is available on the Internet (http://europa.eu).
European Topic Centre on Waste and Materials in a Green Economy Boeretang 200 BE-2400 Mol Tel.: +14 33 59 83 Web: wmge.eionet.europa.eu Email: [email protected]
Eionet Report - ETC/WMGE 2019/5
Contents
Acknowledgements ... 1
1 Trade and the changing plastic waste game ... 2
2 European countries’ trade in waste plastics ... 4
2.1. Plastics production, consumption, and waste ... 4
2.2. Plastics waste trade of EU countries ... 8
2.3. Changing trends ... 9
2.4. Changing destinations ... 12
2.5. Illegal plastic waste trade ... 13
3 Drivers and pressures of the trade in waste plastics ... 16
3.1. Drivers of trade in waste plastics ... 16
3.2. Environmental and climate pressure in plastics’ lifecycle ... 19
3.3. Pressures from trading plastic waste and potential benefits of ‘non-trading’ ... 27
4 Evolving policies and regulations ... 32
4.1. EU legal framework on plastic waste trade ... 32
4.2. Legislation/initiatives on trade in plastic waste to/by non-EU countries ... 32
4.3. Recent EU initiatives on plastic waste ... 34
4.4. EU legislation on chemicals ... 36
4.5. Voluntary initiatives by industry... 37
4.6. Options for ‘sustainable plastics waste trade’ ... 38
References ... 41
Annex I: Measures provided by the Single-Use Plastic Directive (EU, 2019a) and related deadlines for implementation ... 46
1
Acknowledgements
The report has been produced within the task on ‘Plastic waste trade and the environment’ of the 2019 ETC/WMGE work program. Lars Mortensen (EEA) has been the project leader and Roberto Zoboli (ETC/WMGE) has been the task leader.
The authors of the report are: Alessio D’Amato (SEEDS), Susanna Paleari (IRcRES-CNR), Maija Pohjakallio (VTT), Ive Vanderreydt (VITO), Roberto Zoboli (SEEDS).
Lars Mortensen (EEA) and Ioannis Bakas (EEA) contributed to the whole process of report design and making. Bart Ullstein (BCI) provided a very careful editing of the report. Margareta Wahlström (VTT) contributed to the final revision of the report.
The authors gratefully acknowledge the useful comments received fromGael de Rotalier and Kim Edou (DG Environment, EC) on an earlier version of the report. The usual disclaimer applies.
2
1 Trade and the changing plastic waste game
International trade has been an option for dealing with the growing amount of plastic waste in Europe, given the weakness of domestic economically viable post-collection treatment and recycling and the willingness of China and Asian countries, amongst others, to import waste. This trade prevailed even though it was known that treatment in non-European Union (EU) countries often caused higher environmental pressures than treatment/recycling in the EU.
The domino-like recent sequence of import restrictions on wastes, including on plastics, adopted by China (2018) and then other non-EU countries is pushing European countries to change their plastic waste management. Even though European export flows have found, for the moment, alternative destinations, the export option is bound to become increasingly difficult. The global plastic waste game is changing, creating both an immediate challenge and an opportunity for the EU.
The challenge is the domestic capacity for treatment and, in particular, recycling in EU countries. Although this seems to be slowly increasing, it is currently insufficient, and is now facing the effects of decreasing opportunities for exporting waste beyond the EU. The new and more ambitious recycling targets for plastics included in the 2018 Waste Directives are further exacerbating the challenge. The opportunity is to trigger a more robust and complete circular economy for plastics in Europe. At present, the industrial recycling and recovery system for plastics in the EU is underperforming relative to other waste sectors. From a circular economy perspective, this is a loss of materials and value. The pressure arising from the weakening of export options could push investment and innovation towards the creation of new business opportunities in the EU. At the same time, keeping waste plastics within the EU could reduce their net global environmental pressures by securing better environmental
management, under the EU standards.
These changes, challenges and opportunities are taking place within a rapidly evolving policy setting. The trade in waste plastics by EU countries is regulated by the Waste Shipment Regulation (WSR) (EU, 2006a), which prohibits the export of:
1) waste plastics for disposal to non-EU countries other than European Free Trade Association (EFTA) countries that are party to the Basel Convention; and
2) hazardous waste plastics for recovery to non-Organisation for Economic Co-operation and Development (OECD) countries – this includes hazardous waste containing plastics, such as end-of-life vehicles.
The shipment of non-hazardous waste plastics for recovery to non-OECD countries is regulated by WSR Article 37, which stipulates that the European Commission has to send a written request to each non-OECD country seeking confirmation in writing that non-hazardous waste may be exported for recovery in that country and under which control procedure, if any. Most non-OECD countries have decided to ban the import of such waste or to allow it under specified control procedures (see Section 4.2).
The WSR transposes the Basel Convention on the Control of Transboundary Movements of Hazardous Wastes and Their Disposal (Basel Convention) into EU law. The Convention, which prohibits the export of hazardous waste unless the importing state has given its prior consent in writing to the specific import, has recently been amended, based on a proposal from Norway, extending the current regime to include contaminated, mixed or hard-to-recycle plastic waste1.
Action on plastics has been identified as a key priority by the European Commission and several policies and legislation have recently been adopted which may impact the trade in waste plastics directly and indirectly. In particular, the 2018 EU Plastic Strategy (EC, 2018a) has shaped a systemic approach aimed
3 at transforming the way plastic products are designed, produced and recycled in the EU, possibly laying the foundations of a circular plastics economy.
New recycling targets for packaging waste, including a specific target for plastic packaging, and for municipal solid waste (MSW) were set in 2018. A new Directive on the reduction of the impact of certain plastic products on the environment (EU, 2019a) has been adopted, which provides, inter alia, for a ban on some single-use plastic items, the introduction of separate collection targets for recycling and targets establishing a mandatory recycled content in plastic beverage bottles. Other pieces of legislation, for example on chemical substances (EU, 2006), can also affect the waste plastics sector.
This report aims to contribute to a better understanding of the recent dynamics of the trade in waste plastics and the two-way relationship between this trade and the EU Plastics Strategy.
In Chapter 2, the EU’s rapidly changing international trade in waste plastics is analysed, including the illegal trade in waste plastics. In Chapter 3, the drivers of the waste trade are explored together with the environmental and economic implications of the international trade and ‘non-trade’ from Europe. In Chapter 4, the evolving policy framework for the trade in waste plastics is addressed by focusing on EU plastics and waste policies, and a set of options to better manage the trade within those policies is suggested.
4
2 European countries’ trade in waste plastics
2.1. Plastics production, consumption, and waste
The annual global production of plastics has increased from 2 million tonnes in 1950 to 380 million tonnes in 2015 and is projected to double by 2035 and almost quadruple by 2050. China is now the leading plastics producer responsible for 28 per cent of global production, the rest of Asia produces 21 per cent, the USA, Canada and Mexico together about 19 per cent and Europe 18 per cent and the rest of the world 14 per cent(Barra et al., 2018).
Plastics are a family of hundreds of different materials, which can be either fossil fuel based or bio-based, with a wide variety of properties and uses. The European plastics industry is made up of about 60,000 companies with a turnover in 2017 close to EUR 355 billion and providing direct employment to more than 1.5 million people.
About 64 million tonnes of plastic were produced in the EU, Norway and Switzerland in 2017 (Plastic Europe, 2018a). In the same year, the total demand for plastics in the EU, Norway and Switzerland amounted to about 51 million tonnes (Table 2.1).
Table 2.1. Plastics demand in the EU, Norway and Switzerland, by sector, 2017, per cent
Sector Per cent
Packaging 39.7
Building and construction 19.8
Automotive 10.1
Electrical and electronic 6.2
Household, leisure and sports 4.1
Agriculture 3.4
Others 16.7
Source: Plastic Europe, 2018a
Single-use plastic food packaging, which is difficult to recycle because it is made of multiple materials, makes up a large part of the plastic used for packaging (Schweitzer et al., 2018).
It is estimated that the total amount of plastic ever produced is around 8,300 million tonnes of which about 70 per cent is now waste (Geyer et al., 2017) and due to mismanagement around a third of that is estimated to have entered the environment as land, freshwater or marine pollution2. The World Wilde Fund for Nature (WWF) estimates that, despite increasing efforts to improve the collection and treatment, as much as 37 per cent of global plastic waste is currently managed ineffectively. Most plastics do not biodegrade, which means that if they leak into the environment they remain there for hundreds of years (WWF, 2019).
2 Mismanaged plastic waste refers to plastic left uncollected, dumped, littered, or managed through uncontrolled
landfills, and it is much more likely to become pollution than waste managed through a controlled waste treatment facility.
5
Figure 2.1. Global primary generation of waste plastics, 1950–2015
Keys: PP&A = polyphthalamide; PUR = polyurethane; PET = polyethylene terephthalate; PVC = Polyvinyl chloride; PS = polystyrene; PP = polypropylene; HDPE = high-density polyethylene; LD/LDPE = low-density polyethylene
Source: WWF, 2019
In 2016, 27.1 million tonnes of plastic waste were collected in the EU and sent for energy recovery, 41.6 per cent; recycling, 31.1 per cent; and landfilling, 27.3 per cent. Between 2006 and 2016, the volume of plastic waste collected increased by 11 per cent and, with regard to waste management operations, recycling and energy recovery increased by 79 and 61 per cent respectively, while landfilling decreased by 43 per cent (Plastic Europe, 2018a).
A significant share of waste plastic is exported to non- EU countries. Indeed, these totalled around 3.1 million tonnes in 2016, almost 39 per cent of the figure for its recycling in the EU – around 8 million tonnes in 20163. This makes plastic waste different, for example, from glass waste, for which traded volumes are small as compared to recycling volumes and trade flows are mostly within the EU4. On the other hand, plastic waste is closer to paper and cardboard waste, which also features significant extra-EU exports: in 2016, paper and cardboard waste recycling amounted to around 36.4 million tonnes, while extra-EU exports were around 11.6 million tonnes5.
3 The trade figures are from Eurostat statistics for international trade in goods
(https://ec.europa.eu/eurostat/web/international-trade-in-goods/data/database). The amount of extra-EU trade in waste plastics is calculated using HS code 3915 – Waste, parings and scrap of plastics. Data for recycling was obtained using data for plastic waste and selecting Recovery-recycling from the Eurostat database on Treatment of waste by waste category, hazardousness and waste management operations
(https://ec.europa.eu/eurostat/web/products-datasets/-/env_wastrt) (accessed 27 May 2019).
4 See
https://ec.europa.eu/eurostat/statistics-explained/index.php?title=Recycling_%E2%80%93_secondary_material_price_indicator#Price_and_trade_volumes.
5 The trade figures are from Eurostat statistics for international trade in goods
(https://ec.europa.eu/eurostat/web/international-trade-in-goods/data/database). The amount of trade in waste paper and paperboard to non-EU countries is calculated using HS code 4707 – Recovered (waste and scrap) paper or paperboard. Data for recycling of paper was obtained using data for paper and cardboard wastes and selecting
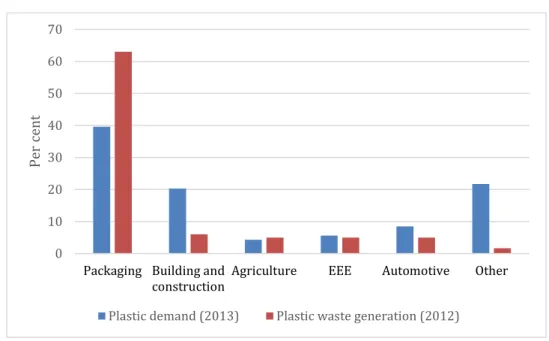
6 Figure 2.2 shows the share of different markets in total plastic demand and the share of different waste streams in total plastic waste generation in the EU. The share of packaging in plastic waste generation is considerably higher than in plastic demand. This may be due to the shorter average life time of
packaging compared to other applications such as electrical and electronic equipment (EEE) or cars and the fact that separate collection systems and the statistics may be more complete for waste plastic packaging than for other plastic waste types 6.
Figure 2.2. Plastics demand and plastics waste generation in the EU by sector, per cent
Source: Plastic Recyclers Europe, 2016
According to Material Economics (2018), only about 20 per cent of the plastic waste collected for
recycling in Europe actually ends up as recycled plastic, and the market of recycled plastics covers 10 per cent of the demand for plastics (Figure 2.3). Furthermore, the majority of recycled plastic ends up in lower-value applications such as flowerpots and buckets. The combination of high recycling costs, the low quality of recycled material and a lack of quality standards has resulted in a limited demand for secondary plastics. An improvement in the quality of the recycled plastics could considerably increase demand by enabling new application areas (Material Economics, 2018).
Recovery-recycling from Eurostat database on Treatment of waste by waste category, hazardousness and waste management operations (https://ec.europa.eu/eurostat/web/products-datasets/-/env_wastrt) (accessed 27 May 2019).
6 According to Bio Intelligence Service (2011), plastic products in the construction sector are designed to be durable
and can last between 30 and 40 years before being disposed of; electrical and electronic devices have on average a service life of 3–12 years, with larger objects having a longer service life. According to the European Automobile Manufacturers Association (ACEA) in 2016 passenger cars in the EU were on average 11 years old
(https://www.acea.be/statistics/tag/category/average-vehicle-age),. 0 10 20 30 40 50 60 70
Packaging Building and
construction Agriculture EEE Automotive Other
Per
c
en
t
7
Figure 2.3. From waste plastics collected in Europe to recycled plastics, 2015, million tonnes
Source: Material Economics, 2018
According to Plastic Recyclers Europe (2016), packaging is the biggest source of plastic waste in Europe, 63 per cent; followed by building and construction, 6 per cent; EEE, 5 per cent; end-of-life vehicles (ELVs), 5 per cent; and agriculture, 5 per cent. In 2016, the EU generated 16.3 million tonnes of plastic packaging waste, of which 74.3 per cent were recovered and 42.4 per cent recycled7.
Figure 2.4 Plastic packaging recycling and recovery in the EU, 2007–2016, per cent 8
Source: Eurostat website9
7 Eurostat Environment, Waste, Waste streams, Packaging waste by waste management operations and waste flow
(env_waspac (http://ec.europa.eu/eurostat/data/database).
8 According to Eurostat ‘The weight of recovered or recycled packaging waste shall be the input of packaging waste
to an effective recovery or recycling process. If the output of a sorting plant is sent to effective recycling or recovery processes without significant losses, it is acceptable to consider this output to be the weight of recovered or recycled packaging waste’. Recovery includes recycling.
9 Eurostat Environment, Waste, Waste streams, Packaging waste by waste management operations and waste flow
(env_waspac) ((http://ec.europa.eu/eurostat/data/database). 0 10 20 30 40 50 60 70 80 2007 2008 2009 2010 2011 2012 2013 2014 2015 2016 Pe rc ent
8 The EU’s Packaging and Packaging Waste Directive (PPWD) binding recycling target for plastics packaging waste, 50 per cent by 2025 and 55 per cent by 2030, implies that more than an additional 10 million tonnes of recycled material need to be absorbed by the markets. Compared to 2014, this corresponds to more than twice the amount of the total currently recycled material (Deloitte Sustainability, 2018). Some European countries already recycle 50 per cent or more of their plastics packaging waste. Currently, in 2019, however, the EU’s recycling rates are calculated as the waste collected for recycling
including waste exported for recycling. It is not always clear what happens to the exported waste and
whether the conditions of recycling meet the standards set by the EU. Furthermore, all the collected waste is counted as recycled, even though there are always some material losses in the sorting and recycling processes and, in many cases, some of the waste entering the sorting site is incinerated due to the poor quality, or contamination of the waste.
Changes in the calculation methods were introduced by the EU in 2018 (EU, 2018), with the recycling rate calculated on the basis of the amount of waste plastics that enters a recycling facility and not on the amount of waste plastics collected and sent for recycling (Member States shall transpose the Directive by 5 July 2020). This calculation method will necessitate the waste collector being more aware of what happens to the waste after collection. It is also likely to reduce the recycling rates as the collected amount is always higher than the amount that actually enters the recycling facility as it does not include rejects from sorting.
At the global level, according to the Ellen MacArthur Foundation (2017), 95 per cent of the material value of plastic packaging, USD 80–120 billion annually, is lost to the economy after a first use (one cycle). Globally, 40 per cent of plastic packaging waste is landfilled, 32 per cent escapes all waste management and leaks into the wider environment, 14 per cent is incinerated and just 14 per cent is collected for recycling. When additional value losses in sorting and reprocessing are taken into account, only 5 per cent of the original material value is retained for a subsequent use.
All products that contain plastics potentially contribute to the volume of plastic waste. The average content of plastics in European cars has increased from around 9 per cent of a vehicle’s weight at the end of the 1990s (Kanari and Shallari, 2003) to 16 per cent in 2016 (CBI Market Intelligence, 2016). In 2016, the EU generated 6.4 million tonnes of ELVs10, so assuming an average service life of about 10 years and applying a share of plastic content of 10 per cent, it can be roughly estimated that, in 2016, at least 645,000 tonnes of plastic waste were generated from ELVs.
The composition of waste electrical and electronic equipment (WEEE) depends on the type of appliance. Buekens and Yang (2014) have estimated that average plastic concentration in large and small household appliances is 9 and 48 per cent respectively. When applying these shares to the amount of WEEE
collected in the EU in 2015, about 180,000 tonnes and 181,000 tonnes of plastic waste was generated, respectively, from discarded large and small household appliances.
2.2. Plastics waste trade of EU countries
Exports of waste plastics, from both the EU and other regions/countries, increased significantly in recent years. In 2016, 4 per cent of global plastic waste was exported, amounting to roughly 13 million tonnes, of which nearly 50 per cent originated in G7 countries11. Brooks et al. (2018) report that 89 per cent of historical global plastic waste exports consist of polymer groups often used in single use plastic food packaging (polyethylene, polypropylene and polyethylene terephthalate) and, based on the UN
10 Eurostat Environment, Waste, Waste streams, End-of-life vehicles by waste management operations – detailed
data (env_waselv) (http://ec.europa.eu/eurostat/data/database):.
9 Comtrade Database, they estimated that, in 1998–2016, the EU was responsible for 31 per cent of global plastic waste exports.
In spite of growth in domestic recycling and recovery capacity, about half the plastic waste collected in the EU is sent abroad for treatment (EC, 2018a). More than 85 per cent of this was, until recently, shipped to China (EC, 2018a), which, since the 1990s, had been the main importer of plastic waste. Ships carrying the huge volumes of consumer goods imported from Asia facilitated the export of EU waste back to Asia but this suddenly changed when China, and subsequently other destination countries, progressively introduced rigid waste import policies culminating in bans on imports in 2018. This section presents the analysis of EU countries’ trade in waste plastics based on Eurostat data on international trade in goods12. The data were extracted from the Eurostat database13 and specifically the datasets on EU trade since 1988 by HS2-HS4 (DS-016894) and CN8 (DS-016890), depending on the information needed14.
2.3. Changing trends
Total exports of waste plastic increased steadily from 2000 to 2010, then fell until 2013 and again in 2017–2018 (Figure 2.5). Trade to China changed from almost zero in 2000 to slightly more than 1 million tonnes in 2017, but returned to very low levels in 2018. In recent years China moved towards a ban on the import of waste plastic, which became effective in January 2018 (Section 4.2). The recent decrease in extra-EU exports started even earlier, from 2014, while exports between EU Member States (intra-EU) shows a significant increase between 2000 and 2018, from 0.6 to around 2.5 million tonnes. As a result of these changes, intra-EU exports of waste plastic are now greater than extra-EU exports.
Import of waste plastics is largely an intra-EU flow. This trade increased steadily between 2000 and 2016, since when it has remained more or less constant (Figure 2.6)15.
The evidence from Figures 2.5 and 2.6 indicates that the Chinese trade ban has contributed to a reduction in total extra-EU exported quantities of plastic waste while the intra-EU trade has remained close to stable. This suggests that at least part of the previously exported waste is now being retained for management within the producing EU countries.
12 Based on the Waste Shipment Regulation, Eurostat provides data on the transboundary shipment of plastic
waste for 2001–2018. These data, however, are not used in this report for the following reasons. First, within this data set, only notified shipments are reported, i.e. mainly shipments of waste destined for disposal and of hazardous waste destined for recovery, excluding most of the trade in plastic waste, which mainly includes non-hazardous waste destined for recovery. Moreover, waste classification codes that are used in notification
documents, and which are correspondingly reported by Eurostat, are very generic. The Basel Convention lists 47 Y-codes, 45 of which cover hazardous waste. Non-hazardous waste is addressed only by Y-46 Waste collected from households and Y-47 Residues arising from the incineration of household wastes. The inclusion of the European Waste Catalogue codes, which could provide for a better identification of shipped types of plastic waste , is optional and the related code field is often unfilled or unknown.
13 https://ec.europa.eu/eurostat/web/international-trade-in-goods/data/database
14 In Figures 2.5, 2.6 and 2.9 we refer to HS4 code 3915 - Waste, parings and scrap of plastics. More specific codes
will be highlighted where needed (Figures 2.7 and 2.8).
10
Figure 2.5. Total exports of plastic waste from EU28, 2000–2018, million tonnes
Source: own elaboration on Eurostat EU trade since 1988 by HS2-HS4 (DS-016894) (accessed 9 July 2019)
Figure 2.6. Total imports of waste plastic from intra-EU and extra-EU countries, 2000– 2018, million tonnes
Source: own elaboration on Eurostat EU trade since 1988 by HS2-HS4 (DS-016894) (accessed 11 July 2019)
More detailed data on extra-EU exports of waste plastics, classified according to the related CN8 codes, are presented in Figure 2.7. Extra-EU exports are dominated by CN code 39151000 (Ethylene polymers) and by CN code 39159080 (other plastics, excluding ethylene, styrene, vinyl chloride and propylene). Figures 2.5 and 2.7 clearly show that extra-EU exports decreased significantly between 2017 and 2018, most significantly for ethylene polymers, and this can, at least partly, be explained by the Chinese ban.
0 1 2 3 4 5 6 2000200120022003200420052006200720082009201020112012201320142015201620172018 mil lion ton ne s
11
Figure 2.7. Extra-EU exports of waste plastic, by CN 8 Codes, 2010–2018, million tonnes
Source: own elaboration on Eurostat EU trade since 1988 by CN8 (DS-016890) (accessed 12 July 2019) Figure 2.8 shows the recent trend in the unit value of the two most important traded plastic waste types, based on the yearly quantities shown in Figure 2.716. The unit value of ethylene increased up to 2015 and decreased thereafter; for other plastics, it rose until 2012, then fell until 2016 since when it has
recovered slightly.
Figure 2.8. Average unit value of ethylene and other plastic waste exported to extra-EU destinations, 2010–2018, EUR per tonne
Source: own elaboration on Eurostat EU trade since 1988 by CN8 (DS-016890) (accessed 12 July 2019)
16 The price indicator measures the unit export price and is calculated as the ratio between yearly value (in EUR)
and yearly traded volume (in tonnes) for the relevant foreign trade statistics codes. See, among others, https://ec.europa.eu/eurostat/statistics-explained/index.php?title=Recycling_%E2%80%93_secondary_material_price_indicator#Price_and_trade_volumes. 0 50 100 150 200 250 300 350 400 2010 2011 2012 2013 2014 2015 2016 2017 2018 EU R p er to nne
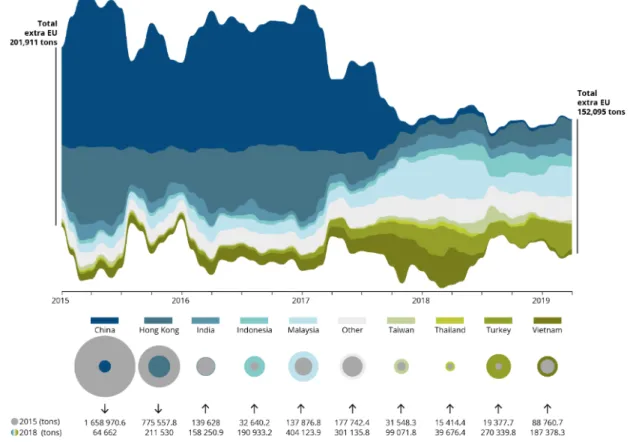
12 2.4. Changing destinations
Figure 2.9 provides a detailed picture of EU exports to key extra-EU destinations17. In line with data reported in Figure 2.5, a significant reduction in extra-EU exports of plastic waste took place between January 2017 and April 2019. Furthermore, extra-EU exports have been redistributed significantly across countries. The volumes of plastic waste exported to China and Hong Kong in 2018, for example, were, respectively, 96 and 73 per cent lower than in 2015, while the opposite occurred in other countries, with Turkey and Indonesia recording the most significant increases, +1,295 and +485 per cent respectively. The January 2018 Chinese ban, together with others or similar policies announced or introduced during 2018 in other countries18, suggest a possible explanation of these changes, although in some cases it may still be too early to observe an impact.
Figure 2.9. Extra-EU plastic waste exports by receiving country, tonnes, January 2015– April 2019
Source: Eurostat EU trade since 1988 by HS2-HS4 (DS-016894) (accessed 9 July 2019)
Changes took place between 2017 and 2018 also in intra-EU trade but these changes may be the outcome of multiple co-existing factors, and it is not possible to provide an in-depth analysis of the effects of bans in extra-EU destinations on intra-EU trade flows.
17 Based on Eurostat graph at:
https://ec.europa.eu/eurostat/statistics-explained/index.php?title=File:Figure_10_Export_of_plastic_waste_for_recycling_from_the_EU_to_receiving_coun tries,_2015_to_March_2018.png
13 2.5. Illegal plastic waste trade
Illegal shipments of plastic waste are likely to cause severe pressures on the environment. Plastic waste may be exported to EU countries for the purpose of disposal and hazardous plastic waste to non-OECD countries for the purpose of recovery both in breach of the WSR. It is worth noting that, since plastics are often mixed with hazardous waste to disguise illegal shipments of the latter, they can be contaminated. Moreover, hazardous waste containing plastic, such as ELVs and some WEEE, may be exported for recovery to non-OECD countries also in violation of the WSR. Finally, plastic waste may be illegally exported for recovery to non-OECD countries that have prohibited its import or in breach of the control procedure applied by the importing country (Section 4.1 and 4.2).
Data on illegal shipments of waste is provided by European Union Network for the Implementation and Enforcement of Environmental Law (IMPEL) under the Enforcement Actions (EA) Project. This has been regularly used since 2008 to carry out inspections aimed at enforcing the WSR and analysing the related data.
With regard to EA Project III (2012–2013), EA Project IV (2014–2015), and EA Project V (2016–2017), Figure 2.10 shows the share of transport and company violations19 related to plastics, WEEE and ELVs/car parts (IMPEL, 2018; 2016; 2013). It has to be underlined that each EA Project is characterised by a different number of administrative and transport inspections and of participating countries20.
19 The focus of the EA Projects was on transport inspections. Company inspections were introduced for verification
purposes and for authorities that have limited opportunities to carry out transport inspections or where company inspections are a more effective tool for particular waste streams.
20 EA III (2012-2013): 11,890 administrative and 10,524 physical transport inspections; 30 participating countries, 24
of which have reported inspection activities. EA IV (2014-2015): 4,787 administrative and 12,396 physical transport inspections; 31 participating countries, 26 of which reported inspection activities. EA V (2016-2017): 6,048
administrative and 16,222 physical transport inspections; 34 participating countries, 27 of which reported inspection activities. Please note that administrative inspections consist purely of a review of the paperwork associated with import/export traffic, for example, a review of port manifest documents to highlight shipments for further inspection, while physical inspections included a visual inspection of the consignment usually at a roadside location or a seaport if recorded as a transport inspection. They, however, could also take place at a known waste export site or reprocessing facility.
14
Figure 2.10. Violations by selected waste stream under IMPEL EA III, EA IV and EA V, per cent of violations
Source: own elaboration on data from IMPEL, 2018, 2016 and 2013
In 2016–2017, the major waste streams involved in transport violations were metals, 20 per cent; ELVs and car parts 14 per cent; paper and cardboard, 10 per cent; WEEE 10 per cent and plastics, 8 per cent. The major waste streams involved in company violations were household and mixed municipal waste, 23 per cent; WEEE, 18 per cent and plastics, 16 per cent.
In June 2017, Interpol conducted Operation 30 Days of Action, the largest law enforcement operation ever mounted against waste crime, targeting illegal landfill activities and illegal shipments of all types of waste and involving 43 countries from every region of the world. According to the operational findings (INTERPOL, 2017), Europe had most cases of illegal waste shipments (77 per cent) originating in the region. In particular, 68 per cent of all criminal cases involving inter-regional shipments consisted of exports from Europe to Africa. Waste types detected were essentially WEEE falsely declared as used electrical goods (43 per cent) and waste from the car industry (32 per cent), which mostly included used tyres (20 per cent), vehicle components and oil or a mixture of both WEEE and tyres.
The two main waste streams illegally exported from Europe to Asia were paper and cardboard, and metals, with plastics, WEEE and ELVs playing a minor role.
Europe was also the region from which most intra-regional and domestic illicit trade took place. These findings, however, should be analysed bearing in mind that more than 50 per cent of countries
participating in the operation were European with consolidated waste-crime related legislation and law enforcement capacity (INTERPOL, 2017).
0 5 10 15 20 Transport Company Per c en t Plastic EA III (2012-2013) EA IV (2014-2015) EA V (2016-2017) 0 10 20 30 40 Transport Company Per c en t WEEE EA III (2012-2013) EA IV (2014-2015) EA V (2016-2017) 0 5 10 15 Transport Company Per c en t
ELVs and car parts
EA III (2012-2013) EA IV (2014-2015) EA V (2016-2017)
15 Other information on illegal shipments of WEEE and ELVs comes from literature and reports. With regard to WEEE, according to Huisman et al. (2015), only 35 per cent (3.3 million tonnes) of all WEEE discarded in 2012 in the EU ended up in official collection and recycling systems, while 1.3 million tonnes were shipped as undocumented exports beyond the EU. In general, small scale exports are destined to West Africa, while larger and more structurally organised transport went to Southeast Asia, although China had introduced an import ban on all WEEE in 2000 (Palmeira et al., 2018; EFFACE, 2015).
Furthermore, it has been estimated that, on average, 25 per cent of all ELVs in the EU do not end up in authorised treatment facilities (European Commission, 2014). The 2017 Assessment of the implementation of the ELV Directive (European Commission, 2017) shows a significant increase in the number of unknown whereabouts21 in the EU, from 3.4 million vehicles in 2009 to 4.66 million vehicles in 2014. Some of these vehicles were illegally exported to non-OECD countries (European Commission 2017). The effectiveness of the EU WSR depends on several factors, such as inspection capacity, which requires well-trained staff, adequate financial resources and technical equipment; co-operation between
enforcement authorities within and beyond national borders – customs, police services, environmental agencies, etc.; the extent to which environmental crimes are prosecuted and infringements penalised in trading countries, etc. The revised WSR (EU, 2014) provides for stronger national inspection of waste shipments, including at the final destination.
Since not all trading countries have the same level of monitoring/enforcement, some illegal waste traders engage in port-hopping, choosing those ports where the import and/or export controls are weakest.
The illegal trade provides substantial profits, while the risk of fines or imprisonment is generally low. The trade is usually outsourced to small organised crime groups, typically of up to 10 people, which operate for a short period, take the profits and then rapidly dissolve to form new groups. Corruption of border guards, customs, officials and port operators is often used (Palmeira et al., 2018). Legal
activities/businesses, such as banks, hauliers and lawyers, are also frequently, whether intentionally or not, involved, making the export chain long and complex (EFFACE, 2017).
The main method used to breach customs systems is to mingle illegal and legal waste to obtain a false classification – trade the mixture using the HS code of the legal material. Enforcement is complicated by the broad definitions of waste applied in the EU – for instance, the Waste Framework DirectiveArticle 3 (EU, 2008) often makes the decision of whether a product is second hand or simply waste arbitrary22 – and by the existence of different code systems – WSR codes/Basel codes and HS codes used by custom authorities.
Based on the above considerations, unless inspections and enforcement are regularly implemented trade bans will probably not succeed in stopping the targeted waste flows.
21 Unknown whereabouts are vehicles that are deregistered without a certificate of destruction being issued or
available to the authorities and also with no information available indicating whether the vehicle has been treated in an authorised facility or has been exported.
22 However, the revised WSR has shifted the burden of proof regarding the distinction between waste and products
as well as the environmentally sound management in third countries to suspected illegal exporters. A similar provision has been introduced in the recast WEEE Directive (2012/19/EU).
16
3
Drivers and pressures of the trade in waste plastics
3.1. Drivers of trade in waste plastics
Drivers of the waste trade can be described by following the existing empirical literature that addresses the determinants of the trade (Mazzanti and Zoboli 2013; EEA 2012; Kellenberg 2012). These drivers also apply to the trade in waste plastic. A large part of the drivers identified in research and reporting are not regularly documented, however, and the empirical measurement of the role of different drivers, including those for the trade in waste plastic, can be challenging outside specific studies.
In the framework provided by Kellenberg (2012), domestic waste is generated by consumption and production, on the basis, among other things, of countries’ economic structures. Waste is then recycled, disposed of domestically or exported. Relevant factors that determine waste exports include domestic and foreign waste policies, infrastructure and traditional trade drivers.
Based on literature and studies, Mazzanti and Zoboli (2013) propose a more detailed set of drivers. 1. Gate fees and transportation costs. For a specific waste and a given management option such as
energy recovery, if there is enough management/treatment capacity in both the home and destination countries, a driver of the waste trade can be the difference between the domestic and foreign gate fees, excluding environmental taxes, or between domestic and foreign prices, if the price for the waste is positive. The gate fee differential must be weighed against transport costs because, to justify the export, the advantage (cost saving or benefit) in gate fees (or prices) abroad must be higher than the additional transport costs. When considering transport costs, it must be noted that some waste management locations, such as northern Italian regions, can be closer to foreign countries than certain home country destinations, southern Italy, for example. For long-distance transport costs, the working of the freight market must be considered, in particular return-freight costs may be very low as an alternative to return travel without a load. Return-freights costs may favour international shipment of non-hazardous waste or some waste categories such as plastics waste that do not require specialist transport facilities. Another factor is the availability of international harbours, such as in the Netherlands, which may explain the concentration of waste shipments and transits in some countries.
2. Administrative costs. Administrative costs must be added to the transport cost and they may reduce the profitability of international shipments. Specific administrative costs, notification fees for compliance to regulations, for example, must be added for some waste flows. For hazardous waste, these costs may be high compared to gate fee/price differential and may discourage legal international shipments.
3. Tariff and non-tariff barriers. For extra-EU destinations, there may be trade tariffs on waste in importing countries that may discourage the waste trade. For certain categories of waste there may be non-tariff customs measures or bans that may increase the costs of international shipment or even prevent it. This may explain changes in geography of trade if destination countries impose different tariff rates or non-tariff barriers.
4. Differences in environmental taxes and policy stringency. Different countries may apply different environmental taxes, for instance on landfill or incineration, on the same management/treatment of the same waste type. This may stimulate shipments out from high-tax countries. Different implementation of other economic instruments and (voluntary) environmental management systems can also contribute to push trade flows. In transitional phases of the regulatory process,
17 different maturity in the implementation of rules, even between EU countries, can explain waste being shipped for disposal.
5. Differences in treatment capacities between countries (excess supply/demand)). There may be a saturation of capacity for a given technology such as landfill at a reasonable distance within the home country. The consequent excess supply of waste requiring management may drive export flows. In some critical situations, institutional failures and lack of diversification in (technological) options can play a role. In this case, trade can be a necessary but not always the least-cost solution because trade is efficient only if its cost is lower than the least-cost mix of waste management at the local level. The capacity factors can also push demand to import waste. For example, large waste-to-energy capacities in a country in which recycling is increasing may push procurement of waste as an energy feedstock from others. In the capacity-differential discussion, dynamic considerations may be relevant: short-term benefits of trading could delay investment in domestic capacity; as a consequence, trade can be beneficial in the short run but may induce dependence on foreign capacity. The transition from landfill disposal to recycling/recovery starts with domestic policies on separate collection, which may face a short-term lack of
recycling/recovery capacity in the home country and then trade can prevail if there is enough capacity (in excess of domestic supply) in other countries. Imbalances between domestic supply and domestic demand capacity, as well as for different technologies, may occur asymmetrically between countries and can change dynamically over time. The gradual creation of domestic capacity can reduce trade flows and/or can change the quality, composition and destination of trade. The increase in transboundary shipments of waste, therefore, is driven partly, but hopefully temporarily, by the introduction of recycling/recovery requirements and targets. 6. Different incentives for recycling/ energy recovery. For waste suitable for energy recovery, energy
policies may indirectly stimulate waste trade. For example, the incentives on renewable energy sources (RES), which include waste as a feedstock, are still high in some EU Member States compared to others and non-EU countries. This may attract international procurement (import) of waste for energy.
7. Differences in legislation/classification. Differences in legislation or administrative practice for waste classification and treatment across countries could create incentives to ship waste internationally. These costs can be compared to others – gate fees, transport, taxes/incentives, administrative and customs costs – to determine whether the trade in waste is profitable. 8. Need for specific technologies. For some waste categories, for example some hazardous waste,
there may be limited capacity for treatment according to legislation in the home country. This may drive international flows to where the technology is in operation, even over long distances and at high transport and administrative costs.
9. Geographical characteristics of countries/regions. Although they may be proxied by some of the drivers discussed above, especially transport costs, the geographical characteristics of
countries/regions may be relevant drivers of waste trade. These are also easier to define than transport costs and may be used as proxies for the latter in empirical analyses.
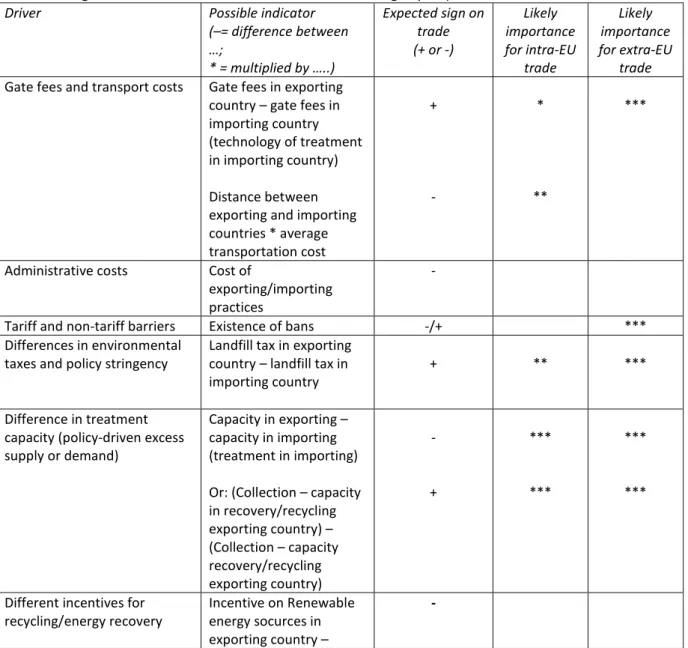
Table 3.1 summarises these drivers and possible empirical indicators. Most of the indicators, and the corresponding drivers, are poorly documented in official statistics, and require information that can be scant or fragmented, or may require direct enquiries.
Nonetheless, the trends and factors described in previous chapters suggest what can be the most important factors behind European countries’ international trade in waste plastics. These factors are shown in the last two columns of Table 3.1 for, respectively, intra- and extra-EU trade.
18 The combination of gate-fee differentials and transport cost can be relevant for extra-EU export of waste plastics, in particular gate fees given the possible low transport costs by sea to Asia, whereas high overland transport costs may discourage intra-EU trade. The existence of bans can be a very relevant factor in discouraging extra-EU trade. Different landfill taxes, when different from gate fees, can be relevant for both intra- and extra-EU trade. Differences in domestic capacity for treatment and recycling/recovery with respect to domestic collection capacity can be a very relevant factor behind both intra- and extra-EU trade in waste plastics, probably the most important one in pushing trade as a result of the rapid development of separate collection in most EU Member States not being matched by an equivalent increase of recycling capacity. While differences in classifications, legislation and, more importantly, different administrative practices across EU Member States cannot be excluded as a factor stimulating plastics waste trade, this can be much more important in pushing the extra-EU trade. Finally, both the need of specific technologies or the availability of different technologies giving economic value to waste plastics, as well as the closeness of countries and lower transport costs can be factors mainly behind intra-EU trade in waste plastics.
Table 3.1. Drivers of bilateral flows of waste and their possible importance for the treate in waste plastics waste
(Note: The sign of the indicator is the relevant one in driving export)
Driver Possible indicator
(–= difference between …; * = multiplied by …..) Expected sign on trade (+ or -) Likely importance for intra-EU trade Likely importance for extra-EU trade Gate fees and transport costs Gate fees in exporting
country – gate fees in importing country (technology of treatment in importing country) Distance between exporting and importing countries * average transportation cost + - * ** ***
Administrative costs Cost of
exporting/importing practices
-
Tariff and non-tariff barriers Existence of bans -/+ *** Differences in environmental
taxes and policy stringency Landfill tax in exporting country – landfill tax in
importing country + ** ***
Difference in treatment capacity (policy-driven excess supply or demand)
Capacity in exporting – capacity in importing (treatment in importing) Or: (Collection – capacity in recovery/recycling exporting country) – (Collection – capacity recovery/recycling exporting country) - + *** *** *** ***
Different incentives for
recycling/energy recovery Incentive on Renewable energy socurces in exporting country –
19 incentive on e-RES in
importing country Differences in
legislation/classification Stringency of legislation in exporting country – stringency legislation in importing country
+ * ***
Need for specific technologies Availability of X
technology in importing country only
+ if available ** Geographical characteristics of
countries region E.g. common borders countries have a e.g. + if the two border in common
***
Source: own elaboration starting from Mazzanti and Zoboli (2013) 3.2. Environmental and climate pressure in plastics’ lifecycle a) Source materials
The production of plastic is largely reliant on fossil hydrocarbons. In Europe, 49 million tonnes of oil and gas were used for the production of plastics in 2015, about 6 per cent of the total amount used (Kaiser et al., 2018). This is equivalent to the oil consumption of the global aviation sector.
If the growth in plastic production continues as expected, the plastics sector will account for 20 per cent of total oil consumption and 15 per cent of the global annual carbon budget by 205023. Incineration and energy recovery also result in a direct release of carbon (not taking account of the potential carbon savings of replacing it with another source of energy). If the plastics are landfilled, this feedstock carbon could be considered sequestered. If it is leaked, carbon might be released into the atmosphere. Even though plastics can bring resource efficiency gains during use, these figures show that it is crucial to address the greenhouse gas impact of plastic production and after-use (Ellen MacArthur Foundation, 2017).
23 The budget that must be adhered to if global warming is to be limited to less than 2° C above pre-industrial levels
20
Figure 3.1. The different stages of the plastic lifecycle
Source: UNEP, 2018
b) Product manufacture
One of the greatest technological challenges in increasing the recycling of plastics is the complexity of the materials in the market. Multilayer structures, the large selection of resins and the use of a variety of additives in the plastic materials create difficulties in waste sorting and refining. Few plastic
packaging materials and products are designed to be easily recyclable. The Ellen MacArthur
Foundation has estimated that without fundamental redesign and innovation, about 30 per cent of plastic packaging will never be reused or recycled. It is therefore of crucial importance that more attention is paid to end-of-life options from the initial design stages of materials and products (Ellen MacArthur Foundation, 2017).
The raw materials of plastics are delivered to plastics converters in the form of small plastic pellets. These typically have a diameter of 2–5 millimetres (mm) and are regular in shape. Smaller powders, often referred to as fluff, are also produced and have more irregular shapes and sizes. Pellets are transported from their production site by ship, train and/or truck to the facility where the final products are made. Some material can be lost at each stage of the production and transportation chain. Several studies indicate that, in many cases, pellets leak out of the system – plastic pre-production pellets have been found in environmental samples all over the world (Karlsson et al., 2018).
c) Use phase
About half the plastics produced are used in products and packaging the life cycle of which is less than three years. This, together with the lack of proper waste management in many developing countries, is the main cause of the leaking of plastics into the environment.
Two main issues, which can cause both environmental and health pressures in the use phase, are: i) the release of secondary microplastics24; and ii) the release of additives (or monomers/oligomers). In addition to polymers (resins) almost all plastic materials contain variable amounts of other
chemicals added to improve their processability and other properties. Several studies have highlighted
24 Primary microplastics are plastics originally manufactured to be that size, while secondary microplastics
21 the likelihoodof these additives contaminating air, food, soil and water (Hahladakis et al., 2018). Due to wearing, some break down into micro- (0.1–5 mm in length) and/or nano- (0.001–0.1mm in length) plastic particles, which are difficult to detect and remove from the air, oceans and soils. Microplastics can contain, on average, 4 per cent of additives and can adsorb other contaminants. Both additives and contaminants can be organic as well inorganic; as most plastics do not biodegrade, the
microplastic pollution stays in the environment for hundreds of years, and thus starts to accumulate. Microplastics have already been found in, amongst others, common table salt, both tap and bottled water and human manure25.
The impacts of microplastics in soils, sediments and freshwater are not known in detail. It is suggested that they may have a long-term damaging effect on terrestrial ecosystems globally through adverse effects on organisms, such as soil-dwelling invertebrates and fungi, needed for ecosystem services and functions. Up to 730,000 tonnes of microplastics are transferred to agricultural lands in Europe and North America every year from urban sewage sludge used as farm manure. Furthermore, toxicity and toxicokinetic data are lacking for a human risk assessment of both micro- and nanoplastics (Barra et al, 2018)26.
Plastics has become a serious challenge for the natural world. Wildlife entanglement has been recorded in more than 270 different animal species, including mammals, reptiles, birds and fish. It is estimated that about a thousand marine turtles die every year from entanglement in plastic waste. Studies have shown that more than 240 different animal species have been ingesting plastic. These animals are often unable to pass the plastic through their digestive systems, resulting in internal abrasions, digestive blockages and death. Toxins from ingested plastic have also been shown to harm breeding and impair immune systems (WWF, 2019).
d) End of life
Proper local waste management is a prerequisite for sustainable end of life of plastics. While some mismanagement of waste exists in many regions, it is greatest in low- and middle-income countries as a result of inadequate waste management infrastructure. In 2016, more than 76 per cent of total plastic waste in low-income countries was mismanaged (WWF, 2019).
Mismanaged plastic waste – plastic left uncollected, openly dumped, littered, or managed through uncontrolled landfills –, is much more likely to become pollution than waste managed through a controlled treatment facility. The majority of mismanaged plastic waste is believed to have polluted land-based ecosystems, and 80 per cent of ocean plastics are estimated to come from land-based sources, rather than from such sources as cruise ships or fishing boats. On land, plastic can also leak from collection sites to the ocean, but it is much more likely to reach the ocean if it was never collected formally in the first place. Mismanaged plastic waste has many negative impacts on the environment, human health and economies (Figure 3.2).
25 See
https://www.theguardian.com/environment/2019/mar/07/microplastic-pollution-revealed-absolutely-everywhere-by-new-research; https://www.theguardian.com/environment/2018/apr/27/the-hills-are-alive-with-the-signs-of-plastic-even-swiss-mountains-are-polluted;
https://www.theguardian.com/environment/2018/oct/22/microplastics-found-in-human-stools-for-the-first-time; The European Food Safety Authority (EFSA) Panel on Contaminants in the Food Chain (CONTAM), 2016.
26
22
Figure 3.2. Examples of impacts of mismanaged plastic waste
Source: UNEP, 2018
In 2016, McKinsey and the non-profit Ocean Conservancy conducted a study according to which roughly 60 per cent of all the plastic in global waters originates in five countries: China, Indonesia, the Philippines, Thailand and Viet Nam27. None of these five countries had a comprehensive formal recycling system in 2016. Instead they had waste pickers, who root through garbage piles to find reusable items to sell for cash. Only about 20 per cent of discarded plastic is valuable enough to be of interest to a waste picker, for example plastic bags are not collected – due to their light weight and balloon-like design, plastic bags are easily blown in the air, eventually ending up on land and/or the sea. Over the past two to three years China has made efforts to curb waste: in 2018, it ended imports of low quality foreign waste and in 2019 it has ordered 46 cities to begin sorting waste in order to achieve a 35 per cent recycling rate by 2020.
According to a study by the Helmholtz Centre for Environmental Research (2018) in Germany28, 10 rivers in Asia and Africa carry 93 per cent of plastic trash into seas. These rivers are the Yangtze, Yellow, Hai, Peral, Amur, Mekong, Indus and Ganges in Asia, and the Niger and Nile in Africa. The Yangtze alone dumps 1.5 million tonnes of plastic waste into the Yellow Sea each year.
With more than 150 million tonnes of plastic in the ocean, augmented each year by an estimated further 8 million tonnes, plastic pollution is a growing environmental problem worldwide – plastics take longer to degrade in the sea than on land due to the lower temperatures and the presence of salt. 27 https://qz.com/595673/more-than-half-the-plastic-in-the-ocean-comes-from-these-five-countries/ 28 https://www.weforum.org/agenda/2018/06/90-of-plastic-polluting-our-oceans-comes-from-just-10-rivers/ ; https://www.scientificamerican.com/article/stemming-the-plastic-tide-10-rivers-contribute-most-of-the-plastic-in-the-oceans/.
23
Figure 3.3. Overview of end-of-life options for plastics
Notes: * We consider that all landfills on high income countries are controlled based World Bank data from the ‘What a waste 2.0’ Report; ** Not accounting for plastic losses during the recovery process; *** Unless explicitly specified as ‘controlled’ or ‘sanitary’ landfills, we consider landfills in upper middle, lower middle and low income countries as uncontrolled or unspecified. Source: WWF, 2019, based on Dalberg analysis; Jambeck et al. (2015); World Bank (2018); SITRA (2018); European Commisison (2001)
d.i) Collection
Recycling supply chains in most countries are often quite complicated. For example, materials may be collected and sorted by contractors before being sold on to third parties. Collection systems are fragmented and much of the infrastructure is optimised to meet policy targets and not necessarily to the actual production of high-quality secondary materials. Furthermore, the dismantling of end-of-life products, such as the demolition of buildings and ELVs, needs to be improved to obtain better quality waste streams for further refining.
Under-developed waste management infrastructure is a major challenge in low- and middle-income countries and leads to low collection rates. Low-income countries invest three times less in waste management systems than high-income countries (WWF, 2019).
d.ii) Incineration
Plastics have a high caloric value and thus release a considerable amount of energy when incinerated. However, as many plastics are complicated mixtures of resins and additives, toxic emissions often occur during combustion due either to incomplete burning or the inherent behaviour of the
constituents. Incineration of plastics should, therefore, be carried out in controlled and professional waste-to-energy plants equipped with suitable filters, etc.
A significant proportion of end-of-use plastics ends up in MSW. In many developing countries
inadequate or informal waste management systems result in the waste usually being burned in open dumps or household backyards, often for heating and/or cooking purposes, exposing women and children particularly to significant toxic emissions. The open burning of plastics has several negative effects, for example it releases carbon dioxide and black carbon, often together with such other toxic
24 air pollutants as furans and dioxins. The toxic particles released can also settle on crops or in
waterways, degrading water quality and entering the food chain. Furthermore, illegal disposal practices of plastics waste often take the form of open burning, accentuating the release of toxic gases. Poorly regulated incineration or the open burning of plastics waste have been shown to human heighten respiratory ailments, increase the risk of heart disease and damage the nervous system. Communities living close to inadequately controlled waste management facilities are particularly at risk.
The incineration capacity for waste plastics is projected to grow in developing countries, for example, by 7.5 per cent in Asia by 2023. In order to guarantee safe operation, attention has to paid to regional environmental regulations and incineration plant performance. For example, 78 per cent of China’s current waste-to-energy facilities fail to meet EU standards for dioxin emissions (WWF, 2019; UNEP, 2018).
d. iii) Recycling
Currently the recycling plastics is almost entirely carried out by a mechanical route that is suitable only for homogenous and contaminant-free waste, which most of the plastic wastes are not. In general, mixed plastics waste will never be more than 60 per cent recyclable by mechanical means. This means that 40 per cent of the waste entering plants has to be treated separately, which creates a risk of mismanagement in countries with poorly developed environmental legislation. Globally it is estimated that only 9 per cent of the 6,300 million tonnes of plastic waste generated between 1950 and 2015 has been recycled (Geyer, R. et al., 2017).
Waste treatment of any kind needs careful risk management and special attention to issues including fire and occupational safety as well as emissions control. Examples exist of poorly managed plastics recycling plants in Asian countries causing environmental and health risks (GAIA, 2019).
Currently operating costs for recycling plastics are often high due to high collection and separation costs and a limited supply of recyclable plastic. Collecting and sorting is a time consuming and labour-intensive process, due to the high levels of mixed and contaminated plastic waste. Together, collecting and sorting constitute approximately 40 per cent of recycling costs. Securing of a supply of suitable plastics waste is one of the key elements of make recycling profitable but due to fragmented collections systems, this can be an important bottleneck for business development.
The focus of mechanical recycling has so far been on polyethylene terephthalate (PET), high density polyethylene (HDPE), and polypropylene (PP) recycling. The price of virgin plastic is linked to the price of oil, which is highly volatile. This fundamentally influences the price that manufacturers are willing to pay for recycled plastics. At the present, plastics recycling is in most cases down-cycling, which means that the quality of the recycled plastic is less than that of the original material (Hundertmark et al., 2018; Material Economics, 2018).
Chemical recycling can also play a role in developing a more circular economy for plastics, as it can offer pathways to achieve higher volumes and higher quality recycled materials. Chemical recycling of plastics, also known as tertiary recycling or feedstock recycling, means converting plastic waste into monomers, other chemical raw materials or fuels with the help of catalysts, heat and/or pressure. Chemical recycling encompasses a family of different technologies, but to fulfil their potential, most chemical recycling technologies still have to be further developed to ensure the reliable production of high-quality secondary raw materials in safe, sustainable and economically-feasible ways.
Furthermore, building new infrastructure for waste handling and chemical processing would be needed. New supply-chains also, including actors along the whole value cycle, will have to be
25 in which the thermochemical conversion of plastic waste into pyrolysis oil takes place in plants near the source of waste, thereby supporting local economies and job creation, and the oil then be shipped to centralised petrochemical sites for further refinement (De Smet 2019). Chemical recycling is still an emerging end-of-life option for plastics, and several technological and regulative challenges will have to be overcome before large scale utilisation can take place.
d. iv) Landfill
It is estimated that more than 60 per cent of the plastic made since 1950 is in landfills and the wider environment (Geyer et al., 2017). If current consumption patterns and waste management practices do not improve, by 2050, there will be about 12 billion tonnes of plastic in landfills and the natural environment. Furthermore, if the landfills are not well constructed, plastics will leak, polluting nearby aquifers, water bodies and settlement (Ellen MacArthur Foundation, 2017).
In Europe, waste legislation of some countries introduced bans the landfilling of organic waste, including plastics. This has created pressure on companies and municipalities to find new end-of-life options for plastics.
d. v) Mismanaged plastic waste
If plastics leak into the environment, the stay there for a long time – it can take hundreds of years for them to be broken down. This harms biodiversity and damages the ability of ecosystem to deliver services needed to support life. Plastic can enter the natural environment either in the form of litter, or micro- and nanoplastics. The main impacts of plastics in natural environment can be divided into 10 groups.
i) Release of harmful or toxic chemicals: some plastics contain toxic chemicals, including persistent organic pollutants (POPs), which have been linked to health issues including cancer as well as and mental, reproductive and development diseases. (WWF, 2019; Hahladakis et al., 2018)
ii) Spoilage of international waters: plastics pollution is prevalent in all the world’s oceans. At the global level, it is estimated that 15–51 trillion plastic particles are floating on the surface of oceans. In a business-as-usual scenario, the Ellen MacArthur Foundation (2017) estimates that the ocean will contain 1 tonne of plastic for every 3 tonnes of fish by 2025 and more plastic than fish by 2050.
iii) Harming biodiversity: plastics pollution is the second most significant threat to the future of coral reefs after climate change. Wildlife entanglement has been recorded in more than 270 different animal species, including mammals, reptiles, birds and fish, and more than 240 different animal species have been shown to have ingested plastic. High concentrations of plastic materials, particularly plastic bags, have been found blocking the breathing passages and stomachs of hundreds of different species. Plastic bags in the ocean resemble jellyfish and are often ingested by turtles and dolphins who mistake them for food. It is estimated that a minimum of a thousand marine turtles die every year due to entanglement in plastic waste, which includes lost or
discarded fishing gear. There is emerging evidence that the toxic chemicals added during the manufacturing processes transfer from the ingested plastic into the animals’ tissues and eventually enter the human food chain (WWF, 2019; UNEP, 2018).
iv) Land degradation and contamination of food systems: the emerging threat from microplastics to terrestrial ecosystems, especially agricultural soils, could lead to further land degradation affecting food production and contaminate of food products.
26 v) Air pollution: much microplastic ends up in ocean, but some travels long distances through the air to remote area including Pyrenees mountains. The maximum distance microplastics can travel is still unclear, but research has found that larger dust particles have travelled 3,500 kilometres across the Atlantic Ocean (Allen et al., 2019). Flying insects (ontogenic transference) are also a possible pathway for the aerial dispersal of microplastics (Al-Jaibachi et al., 2018)29.
vi) Hotspots for microbial activity: plastics and microplastics can create a micro-environment, within which microbial and chemical conditions differ significantly from surrounding water. Their influence on the transformation and composition of marine organic matter is still largely unknown, but some research results point to the possibility that marine microplastics act as localised hotspots of microbial activity, with the potential of influencing marine carbon dynamics. A research group in the National University of Singapore found more than 400 types of bacteria on 275 pieces of microplastic collected from local beaches. The bacteria include those associated with coral bleaching (Photobacterium rosenbergii) and those that cause wound infection (Vibrio) or gastroenteritis in humans (Arcobacter) (Curren and Leong, 2019; Galgani et al., 2018).
vii) Possible health effects to humans from the ingestion of plastics: humans are highly likely to ingest micro- and nanoplastics, but the direct health impacts are still unknown. Humans can ingest plastic by consuming foods contaminated with micro- and nanoplastics. This is most likely to occur through seafood, particularly shellfish, mussels and oysters, but there are many other potential sources of contamination. A recent study of bottled water found microplastic contamination in 93 per cent of bottles, sourced from 11 different brands (EFSA, 2016). viii) Social and tourism impacts: plastics waste at the seaside creates visual pollution, which is
increasingly becoming an issue, especially in countries that rely heavily on tourism, such as Small Island Developing States. For instance, the Asia-Pacific Economic Cooperation (APEC) estimated the economic impact of marine plastics on the tourism, fishing and shipping industry as USD1.3 billion per year (WWF, 2019; UNEP, 2018).
ix) Marine transport: commercial shipping vessels are extremely sensitive to collisions with plastic pollution and damage to vessels could also endanger human lives. The Asia-Pacific Economic Cooperation (APEC) estimated the annual cost of litter damage to commercial shipping as USD297 million (WWF, 2019).
x) Some mismanaged plastic waste such as plastic bags can choke waterways and intensify natural disasters. In 1988, poor drainage resulting from plastic bags clogging drains contributed to floods in Bangladesh, causing several deaths. In developing countries with inadequate solid waste management regulations, plastic bag litter can also raise the risk of the transmission of vector-borne diseases such as malaria by blocking sewage systems and providing breeding grounds for mosquitoes and other pests (WWF, 2019).
The total economic impact of plastic pollution is not yet known. Most research so far has focused on the impact on oceans. The UN Environment (UNEP) estimates the economic impact of ocean plastic pollution at USD8 billion per year. It is also estimated that there is four times more plastic pollution on land than in the oceans, suggesting that the total economic impact of plastic pollution is actually much greater (WWF, 2019).
29