HEIGHTS OF TWENTY YEARS OLD MALES OF FRIULI (ITALY)
BORN BETWEEN 1846 AND 18901
M. Breschi, A. Fornasin, L. Quaranta
1. INTRODUCTION
Historical heights are often used to reconstruct the evolution of a population’s nutritional status, changes in its health level, and fluctuations in its living stan-dards. When referring to the remote past, moreover, in the lack of adequate quantitative information on production, consumption and the flow of goods, stature is also employed to describe the level of economic well-being reached by a country or by a society.
Regardless of the large explanatory potentialities attributed to this and other physical characteristics of the individuals that make up a population, the informa-tion used can’t always be submitted to an adequate critical review, generally be-cause scholars are forced to work with aggregative data.
The availability of a very large quantity of information collected at an individ-ual level has allowed us to identify and, at least in part, emend the problems linked with the data quality.
The aim of this article is to reconstruct the historical trend of heights of con-scripts born in the province of Friuli (north-east Italy) in the years 1846-90. An extensive part of this work is dedicated to identifying the problems encountered when using enrolment lists and to proposing solutions which can, at least in part, correct these problems. In front of such a circumscribed objective, the results ob-tained in this study bring to light some possible weak points of the historical height series relative to the whole of Italy which exist up to date.
After a summary of the literature and a brief description of the sources used, we will present the first results, evidencing some factors which cannot be ne-glected when analysing heights obtained from military records. Initially, we will show how mean stature varies if we only consider individuals who attended their first medical examination or if we also take into account measures obtained dur-ing successive examinations. We will afterwards show the greater mean heights observed in periods where conscripts were measured at older ages, and the lower values of cohorts which had very high percentages of missing data.
1 This work was developed within the “Friuli/in prin” project, carried out by the Archivio di Stato di Udine in conjunction with the Department of Statistics of the University of Udine.
Successively, we will introduce the methodologies adopted to try to solve these problems. In particular, we will present a growth model which will allow us to standardize heights and therefore to correct for age differences, and we will de-scribe how missing statures can be estimated using Multiple Imputation. To con-clude, the reconstructed trend of mean heights will be shown, pointing out the advantages of using this new data instead of raw measurements.
2. LITERATURE
Studies of the evolution of height of populations have been based on docu-mentary sources of different nature. Not many are the contexts, both in the pre-sent and in the past, in which height was registered. Data can be obtained from archives of schools, colleges and academies, penitentiary archives, and military archives. In most cases, however, information is selective and incomplete. Selec-tivity problems may exist when measurements refer to specific groups, for exam-ple convicts, who are usually members of lower social-classes, or pupils of certain colleges who, on the contrary, generally come from families with medium-high socio-economic status. Military records, which is the source most often utilized to reconstruct trends of mean heights, in many countries lack measurements under a particular stature, determined by the criteria of soldier enrolment.
Each of these problems has generated a specific and parallel literature, aimed at amending the source documentation from the errors that derive from it. These studies are particularly diffused in the Anglo-Saxon context, where research in this sector is numerous, where sources used are very diverse and where, in many cases, data is very problematic. With regards to military records, in these countries individuals who did not reach the minimum required height did not attend the medical examination and therefore no measurements are available for them. The auto-selectivity of candidates determined a left truncation of the height distribu-tion, which, for a populadistribu-tion, is usually assumed to be approximately normal (Tanner, 1989; Bogin, 1999). Many studies have tried to reconstruct this missing tail, in order to be able to make inferences that relate to the entire population (Wachter and Trussel, 1982; Komlos and Kim, 1990; A’Hearn and Komlos, 2003; A’Hearn 2004; Komlos, 2004).
In Italy, instead, military service was universal from Unification until the end of the year 2005. All young males were therefore required to attend a medical ex-amination, independently of their physical characteristics and of the social strata to which they belonged. At national level, the first series of heights was devel-oped more than 50 years ago by Alessandro Costanzo (1948) and it regarded con-scripts born between 1854 and 1920. Resent studies have extended this trend over time and have also evidenced regional variations (ISTAT, 1958; Arcaleni,
1998; 2006).
Some of the limitations of the Italian data were identified by Costanzo, who posed particular attention on the differences in the age at which conscripts had been measured. He therefore stated that for analyses of height data to be correct,
it was necessary to standardize all measurements. Using growth rates calculated by Mackeprang (1907-1911) for Danish male conscripts, he centred the values of mean stature of each cohort at the precise age of 20.
Despite the fact that there is an extensive literature on the evolution of mean heights, under a historical perspective the topic of growth has been less devel-oped, especially with regards to its final stage, an aspect evidently important when using data obtained from military records. In Italy, we can cite the work of Ri-dolfo Livi (1896; 1905), Antropologia militare, which was carried out more than a century ago. In the two volumes which make up the work, the author analysed, under a longitudinal perspective, the health files of nearly 300,000 soldiers.
Amongst other things, he was able to observe some important peculiarities of the growth patterns of Italian conscripts. These characteristics, however, could not said to be representative of the population as a whole, since the data used only regarded individuals that had been successful at the medical examination and who had been enrolled in the army. They were, therefore, a selected group of young males and only part of those who had attended the examination. Further-more, these soldiers had already spent various months or even years in the army, and for this reason they had been subject to a specific and uniform diet, some-thing which was very much unusual in a population of the 1800’s.
Regardless of these limitations, Livi’s was one of the most important studies of this kind, both for its innovative nature and theoretical considerations and also for the very large amount of data which was used. One of the conclusions that he reached was that the final phase of growth varied from person to person in rela-tion to different elements, amongst which genetic aspects, environmental factors, health status, and nutritional quality. By looking at data on occupation, he was able to observe differences in height according to the social class to which the conscript belonged to; in particular, the higher the social status, the greater the height. Furthermore, he evidenced that the growth experienced in one year de-pended on the starting height: taller conscripts grew less rapidly than shorter con-scripts. Livi’s survey predominantly concentrated on social and economical as-pects, and genetic factors were only mentioned since it was not possible to meas-ure them. This was not, however, an important limitation, because differences in stature amongst populations are almost entirely caused by environmental factors (Steckel, 1983).
Based on these observations and on the reasoning that derives from them, Ri-dolfo Livi had stated that growth, more than ‘absolute’ height, synthesized impor-tant elements in the biographies of each single person. This implied that a general improvement in life standards led to the attainment of a higher mean height for the adult population and also to an anticipation of growth. He had therefore evi-denced all the elements that were required to reconstruct a time-series of heights: how much individuals grew at different ages (calendar effect) and the delay – or anticipation – of growth for different generations (cohort effect).
The link between age and growth was observed in a study developed in the XVIII century, which, for the first time, analysed stature longitudinally. It was con-cluded that growth does not follow a linear pattern, but that at some ages
individu-als develop more rapidly than at other ages. One of the most well-established mod-els which exist today in literature articulates growth into five stages. In the first, which goes from birth up to the third birthday, growth is very rapid at the start, and it slows down considerably as time passes; in the second, which goes from age 3 to 7, a slow rate of increase is observed, with a small acceleration towards the end of this period; in the successive “juvenile” phase, growth slows down further, and it reaches it’s lowest levels; with entrance to adolescence the maximum acceleration in development is registered, which culminates more or less around age 12 for females and 14 for males; the final stage of growth coincides with entrance to adulthood: the fifth and final stage (Bogin, 1999).
When discussing growth of different cohorts, we should consider that a good health status and an adequate nutrition are certainly elements which accelerate the development process of each person. In more general terms, at a population level, economic growth, together with increases in well-being, lead to improve-ments in the living conditions of younger generations with respect to older ones and therefore to increases over time in mean heights. According to a scheme proposed by V.M. Oeppers (quoted in Brinkman, Drukker, Slot, 1988; Coll, 1998), for Dutch males born in 1850, 1916 and 1960, the maximum increases in height took place, respectively, at ages 19, 17 and 15. Consequently, growth also reached its end at earlier times: ages 24, 22, 20. Today, in developed countries the culmination of growth is experienced around age 17 for women and 18 for men. However, in the past, or more precisely in populations with modest standards of living, growth could continue for a much longer period. According to some au-thors, and in different contexts, growth could be said to culminate at age 22 (De Beer, 2004), for others 23 (Komlos, 2004), and in some cases at age 26 (Hulan-icka, Kotlarz, 1991).
Improvements through time in living conditions determine a secular trend in heights (Cole, 2003). In particular, populations experience more closed up growth stages, the growth process culminates earlier and, furthermore, during the final stage of development increments in heights are, at the same ages, always smaller. At age 20 growth was greater in the past than it is today even though, because of this, a better health status is observed today. Gains in height of different genera-tions, however, occur within the first two years of life, meaning that the changes observed after the second birthday were not in the amount of growth experi-enced but only the periods over which this development took place.
3. SOURCES
The data used for this work regards the measurements of conscripts who re-sided in some of the military districts of the Province of Friuli2. In particular, the
2 Military districts of Ampezzo, Gemona, Latisana, Moggio, San Daniele, San Pietro, Tolmezzo, Cividale. These documents are preserved in the Archivio di Stato di Udine. Data of cohorts 1868 and 1874 for the districts of Ampezzo, Gemona, Latisana is not available, since the relative military reg-isters were lost.
extraction lists compiled between 1867 and 1910 have been considered. These relate to individuals born between 1846 and 1890. In total, we have data available for 90,320 conscripts.
The extraction lists were compiled for all military districts, using information obtained from the conscription lists of every municipality (Lamioni, 2002). They contain data on each conscript, following a random order. Part of this informa-tion regards name and last name, municipality of birth and of residence, names of parents, as well as a description of the outcome of the medical examination. In the first section, the physical characteristics of each individual are also described: eye colour, hair colour and type, condition of the teeth, height and chest circum-ference and identifying marks. In a second section, for those who were rejected either temporarily or definitively, the motivations that led to these decisions are listed. Conscripts considered temporarily unfit were asked to return to the medi-cal examination of the successive year.
4. FIRST TREND OF MEAN HEIGHTS
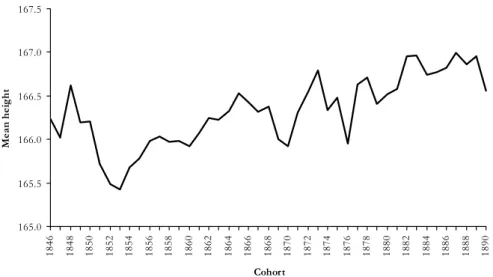
Figure 1 presents the trend in mean heights constructed using raw data, more precisely, considering all the information contained at each military register with-out making any kind of adjustments. In this case, labels of the x-axis do not ex-actly represent the year of birth of each individual, but the cohort of reference of the military medical examination.
165.0 165.5 166.0 166.5 167.0 167.5 1846 1848 1850 1852 1854 1856 1858 1860 1862 1864 1866 1868 1870 1872 1874 1876 1878 1880 1882 1884 1886 1888 1890 Cohort Me an h ei g h t
Figure 1 – Trend in mean height considering all the individuals measured at each examination.
The figure evidences an increasing trend in the heights of conscripts. The growth evidenced is not continuous, but presents, at par to many analogous se-ries, many irregularities and fractures. The most noteworthy discontinuity is
ob-served between 1851 and 1852, when, after a five-year period in which measured statures always exceeded 166 cm, there was drop of almost one centimetre. Even if a recovery is distinguished after a short time, the levels that were seen in the Forties are reached again only during the Sixties. Other fractures of lower impor-tance are encountered at the start and towards the end of the Seventies.
The trend of the series proposed in the figure does not, however, take into ac-count the specific characteristics of the data. In fact, between 1867, year in which the first Friulian conscripts were called for conscription in the Italian Army, and 1910, date in which our data collection was interrupted, what has changed was not only the stature of conscripts, but also the laws connected to the medical ex-aminations: the criteria adopted when dealing with exemptions was modified, the tables which stated the motivations for rejection were updated, and the levels of minimum height required to have access to the military service were retouched (Lamioni, 2002; Ilari, 1990; Rochat Massobrio, 1978). Lastly, the Friulian society, in correspondence with the start of the development of emigration flows, experi-enced at the time one of its epochal through-joints (Di Caporiacco, 1967-69).
These continuous adjustments imposed several consequences in the measure-ments of conscripts, which therefore reflect the quality of the data that we have available. Figure 2 outlines the main causes of distortion and error encountered.
Figure 2 – Problems encountered when using raw data to construct the trend in mean heights.
The figure shows the three main categories of problems identified. Firstly, we must observe which measurements were considered; more precisely whether mean values were calculated using heights obtained only during the first examina-tion of each individual or also during successive examinaexamina-tions. Secondly, we have to note at which age conscripts were measured, especially in historical contexts, where the growth period was a lot more extensive and where therefore most measurements regarded males who were still growing. Any comparisons made where data is not homogenous may, in fact, lead to incorrect results. Thirdly, in order to be able to state that the trend in heights effectively represents the popu-lation as a whole, it is important to observe whether data is available for all indi-viduals. If members of the population with particular characteristics were not measured or, in other words, if a non-random pattern of missing data is observed, then mean heights are biased.
Trend of mean heights
Measurements obtained during different examinations
First
examination examination Successive
Differences in age at measurement
First/successive
examination Within cohort effect Between cohort effect
Missing data
4.1. The problem of differences in the information contained at military registers
As figure 2 shows, one of the limitations is that military registers hold data which regards different types of individuals. In fact, each register contained in-formation on conscripts who attended their first examination and on those who had been visited in previous years and had been asked to return for a further ex-amination. These were temporarily rejected males, who were either affected by an illness or malformation which could be cured in the time elapsed between the two visits or whose height or chest circumference were slightly lower than the minimum requirements (it was, in fact, believed that they could grow in one year). These conscripts therefore represented a group with specific characteristics.
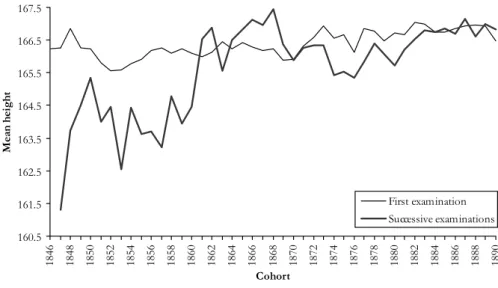
Figure 3, which contains the trends of mean heights of these two groups of conscripts, leads to several conclusions. Differences in mean heights can be ob-served, but these differences are not always of the same sign. Individuals who at-tended successive examinations usually show lower average statures, meaning that in terms of heights they also represented a selected group of males. In some cases, however, they were taller, which was due to the effect of age. These con-scripts were, in fact, older and had therefore grown for a longer period than those who were attending their first examination. An important observation can there-fore be made: when individuals were measured, at least part of them had not reached their final height.
160.5 161.5 162.5 163.5 164.5 165.5 166.5 167.5 1846 1848 1850 1852 1854 1856 1858 1860 1862 1864 1866 1868 1870 1872 1874 1876 1878 1880 1882 1884 1886 1888 1890 Cohort M ean he ig ht First examination Successive examinations
Figure 3 – Trend in mean heights of individuals at their first or their successive examinations3.
3 Since the first cohort to be examined was 1846, the relative register did not contain data of in-dividuals attending second or successive examinations. The large fluctuations observed in mean heights of males attending successive examinations for cohorts 1847-61 is partly explained by the fact that the proportion of these individuals with respect to all males represents less than 15%.
Considering these differences, and to follow what was done by other authors (Costanzo, 1948), from this point onwards we will only use data of each con-script’s first examination. Information of successive examinations can, however, be useful for other purposes. Since these individuals were measured more than once, it is possible to use their repeated height values to identify outliers4 and to
observe growth. This second aspect will be discussed further in the following paragraph.
4.2. The problem of differences in age at measurement
The age at which heights of conscripts were obtained did not just vary because some individuals were visited more than once. Variations in age can, in fact, also be observed if we only consider data of the first examination. In particular, we can identify differences within cohorts and also between cohorts. We must point out that age was not directly recorded in military registers, but that it could be calculated by considering the date of birth of every individual and the date of the medical examination of each cohort. The date of birth was fully registered only for males born in 1846 and 1859-90.
Even if all individuals of the same cohort had to attend the medical examination at the same time, within each cohort age varied in accordance to the different dates of birth of conscripts. For example, a young male born in January would have been, at the time or measurement, nearly a year older than one born in December. The effects that these differences had on stature can be observed in figure 4, which shows the trends in mean heights of males born in these two months. To avoid us-ing incomplete records, we only present data of cohorts 1859-90.
The figure evidences that, apart from a few exceptions, individuals born in January (older conscripts) were, on average, taller than those born in December (younger conscripts).
Figure 5, instead, shows the differences in age observed between cohorts. The values of males born in 1847-58 were obtained considering data for a small por-tion of conscripts, particularly those for whom we were able to obtain the date of birth by other means (either by observing military registers of successive years if they had attended more than one examination or by recurring to databases con-taining different types of information).
4 Many of these repeated measurements evidenced an increase in height, many others did not show any variation, while some evidenced a drop. We know that height is subject to many daily changes. It is highest following the night rest, therefore after a person has spent various consecutive hours laying down, while it is minimum in the evening, after having spent several hours standing. These variations are caused by the compressing effect of the force of gravity, which therefore re-duces the thickness of the loops between vertebrates. This phenomenon partly explains why some individuals show drops in their heights from one medical examination to the next.
To select which values to consider as outliers, we have calculated the growth of each individual between the two examinations, and we have determined that values of growth external to the 5th and 95th percentiles (respectively -1 and 4 cm) should be considered as anomalous, since they provably did not represent real variations in height but the inaccurateness of the information con-tained in either of the two military registers. Individuals who presented an anomalous value were excluded from all the analyses.
163.5 164.5 165.5 166.5 167.5 168.5 169.5 1859 1861 1863 1865 1867 1869 1871 1873 1875 1877 1879 1881 1883 1885 1887 1889 Cohort M ea n hei ght
Conscripts born in January Conscripts born in December
Figure 4 – Trend in mean height of conscripts born in January and in December.
165.0 165.5 166.0 166.5 167.0 167.5 18 46 18 48 18 50 18 52 18 54 18 56 18 58 18 60 18 62 18 64 18 66 18 68 18 70 18 72 18 74 18 76 18 78 18 80 18 82 18 84 18 86 18 88 18 90 Cohort Me an h ei gh t 19.0 19.5 20.0 20.5 21.0 21.5 Me an a ge Mean height Mean age
Figure 5 – Trend in mean height and mean age at measurement5.
The large fluctuations in age evidenced in the figure are due to two reasons. Firstly, the period in which the medical examination was held was not constant. For example, cohort 1846 was visited in October, while males born in 1890 were examined in February. Secondly, the age at which individuals were called for con-scription varied throughout time.
5 Age is not indicated for cohort 1853, since the date of birth of these conscripts was never re-corded.
It is also possible to observe that mean age was significantly higher for cohorts 1846-50, and for this group of individuals mean height was also greater. Differ-ences in age between cohorts are, therefore, very influential in the results ob-tained.
The fact that, as shown in figure 4, individuals were still growing when they were measured, combined with the fluctuations in age observed in figure 5, we can state that it is necessary to adopt a procedure to correct for age differences before reaching any conclusions from trends in heights.
4.3. The problem of missing data
Missing data is a difficulty widely faced in research. Analyses that employ these sources may be biased, especially if missing data does not occur completely at random. In fact, subjects with missing data are not necessarily the same as those with complete information, and these differences may be due both to known and unknown factors (Rubin, 1987).
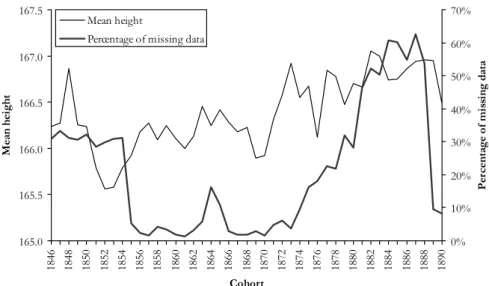
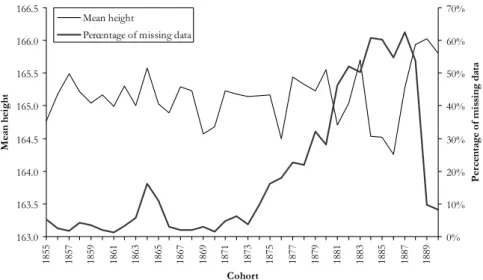
When studying the trend of average heights, not only is it necessary to observe at which age individuals attended the examination, but we also have to consider whether these measurements actually represent the population as a whole. Even if the universality of conscription represented an advantage for Italy in terms of its military records, problems of missing data still exist. Figure 6 evidences that, in some cohorts, a large number of individuals had not been measured.
165.0 165.5 166.0 166.5 167.0 167.5 1846 1848 1850 1852 1854 1856 1858 1860 1862 1864 1866 1868 1870 1872 1874 1876 1878 1880 1882 1884 1886 1888 1890 Cohort M ean he ig ht 0% 10% 20% 30% 40% 50% 60% 70% P er ce nt ag e o f m is si ng dat a Mean height
Percentage of missing data
Figure 6 – Trend in mean height and percentage of missing data.
It is therefore important, to determine which individuals were not measured and whether their heights might have been significantly different from the rest of the population.
Height measurements were not always missing for the same reasons, and this in part explains the large fluctuations observed in the percentages of missing data (figure 6). In particular, two different groups of cohorts can be distinguished: those born in 1846-54 and in 1855-90.
Many conscripts amongst the first of these groups were not measured because they had been exempted from the military service. Exemptions were given, for example, to individuals who were orphans, the only son, the first-born child of a widowed mother, or to those who had a brother that was doing the military ser-vice at the time or who had died in the army. Starting from cohort 1855, the pro-cedure changed, and all conscripts therefore had to attend the medical examina-tion in the same manner. Exempexamina-tions could only be requested afterwards. For exempted males born in 1855-90 height measurements are therefore available.
In subsequent years, migration flows, which were particularly important in the Alpine region of Friuli, were the main cause of missing data6. The economy of
this area was, in fact, not very strong and the only resource available in excess was population. Some migrants left the country definitely while others seasonally. This second flow mainly concerned certain members of the population: construc-tion and forestry workers (who left in spring and returned in late autumn) and also textile workers and house-servants (who were away from autumn until spring). Seasonal migrants were primarily directed to Habsburg Empire and Germany (Renzulli, 1978).
Individuals who had not regularized their military position were not allowed to exit the country. For this reason, many conscripts who intended to migrate re-quired their enrolment to the military service before the examination date. Young males who had already left the country were also allowed to either send a family member to solve the bureaucratic procedures to require the enrolment or to pre-sent themselves to an Italian embassy or consulate in their country of residence instead of returning to Italy for their medical examination (Ilari, 1999). In each of these cases, for most individuals only identifying information (name and last name and date of birth) was registered. Height measurements are, therefore, not available for these young males.
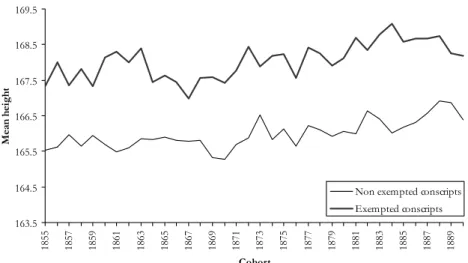
It is important to consider whether heights of unmeasured conscripts might have differed from those of measured individuals. Various studies have demon-strated that, on average, first-born males have smaller heights than younger sib-lings (Hermanussen et al., 1988; Al-Omair, 1991). When considering missing data of cohorts 1846-54, we should point out that since the proportion of first-borns was lower amongst exempted conscripts, this group of individuals was probably taller, on average, than the rest of the population. Figure 7 confirms this hypothe-sis. In fact, it shows that mean heights of individuals born in the years 1855-90 were higher for exempted males than for non-exempted conscripts.
6 Some individuals were not measured because they were draft evaders. It is possible to hypothe-sise, however, that many of them were not informed about conscription laws since they had mi-grated at a very young age and, therefore, they probably ignored that conscription was a require-ment for all males (Arcaleni, 1998).
163.5 164.5 165.5 166.5 167.5 168.5 169.5 1855 1857 1859 1861 1863 1865 1867 1869 1871 1873 1875 1877 1879 1881 1883 1885 1887 1889 Cohort M ean he ig ht
Non exempted conscripts Exempted conscripts
Figure 7 – Trend in mean height of exempted and non-exempted conscripts.
With regards to migration, the question to pose is which types of individuals were involved in these flows, and what their heights equalled to. Some studies (Arcaleni, 1998) have assumed that migrants were the most robust members of the population7. We can observe whether this was also true for Friuli by looking
at data of cohorts 1889-90, since only for migrants born in these years height was registered8. Figure 6 had, in fact, shown a drop in the percentages of missing
measurements for these cohorts. A close look at the data revealed that different type of individuals migrated from each district. Furthermore, in some cases, con-scripts who migrated were, on average, taller than those who did not, while in other districts the opposite situation was observed. These variations could have been due to differences in the labour specialization of each area and therefore in the type of economy.
The implications that missing data had on mean heights were strongest in the District of Tolmezzo. Figure 8 evidences that cohorts 1882-87 had very low mean stature and very high percentages of missing data (more than 50%) and, on the
7 Danubio et al. (2005) demonstrated that southern Italian men who had emigrated to the USA between 1908-28 and 1960-70 were taller than southern Italian recruits. These authors have stated that, since these migrants were mostly unskilled workers, these differences were probably due to the lack of accurateness of self-reported male heights. Even if misreporting had occurred, however, height differences were probably also due to the higher likelihood of healthier members of the population to migrate.
8 Changes in registration of data could have resulted from various reasons. One might have been the fact that the examinations for the cohorts 1889 and 1890 were anticipated. In fact, they took place, respectively, at the beginning of March and February, therefore before the spring departure of many seasonal migrants. Many of these individuals might have therefore been able to attend the examination before leaving the country. The drop in the percentage of unmeasured heights could have also resulted from the introduction of new conscription laws, which have changed how the number of conscripts that had to be enrolled in the army was decided. This might have represented an incentive to record measurements for all young males.
contrary, conscripts born in 1888-90 had the highest average heights, while the percentages of missing data were very low (less than 10%). It can therefore be concluded that migrants of Tolmezzo were probably the taller members of the population. 163.0 163.5 164.0 164.5 165.0 165.5 166.0 166.5 18 55 18 57 18 59 18 61 18 63 18 65 18 67 18 69 18 71 18 73 18 75 18 77 18 79 18 81 18 83 18 85 18 87 18 89 Cohort Me an h ei gh t 0% 10% 20% 30% 40% 50% 60% 70% Per cen ta ge of m is si ng da ta Mean height
Percentage of missing data
Figure 8 – Trend in mean height and percentage of missing data, district of Tolmezzo.
Taking these aspects into consideration, it is possible to state that the values of mean heights presented earlier for cohorts 1846-54 and 1855-90 are biased. Stat-ures of non-measured conscripts were, in fact, significantly different to those of individuals who were measured and, therefore, the trends of average height do not effectively represent the population as a whole. In order to carry out a correct analysis it is necessary to try to estimate missing data.
5. MODEL TO SOLVE FOR DIFFERENCES IN AGE AT MEASUREMENT
Having identified the different problems that the data presents, it is now possible to describe the solutions that we have adopted. To correct for age, we decided to reconstruct the trend in heights by standardizing these measurements, centring them at the age of 20. Some elements induced us to choose this age9. The first is
9 A recent study has identified three different definitions of final height (Kato et al., 1998). The first is based on chronological age. The second refers to the stature after a year with an increment lower than a particular level; this is, for example, the definition adopted by Tanner (1989). The third refers to greatest height reached by the individual. In our methodology, we chose to follow the first definition, which ISTAT had adopted as well. This allowed us to consider dietary and health disor-ders which could have taken place during adolescence. It was, in fact, a lot more common in the past than today that a person could have been better nourished during adulthood than during de-velopment ages. This is, for example, the case of American slaves (Steckel, 1986).
tradition, in other words to follow what was done by ISTAT (Costanzo, 1948;
Ar-caleni 2006). This allows us to easily make comparisons and to extract conclusions. Secondly, 20 is also the age closest to the moment in which the majority of con-scripts were effectively measured. Using this age, therefore, we can maximally limit the error that is inevitably incurred when carrying out estimates.
We concluded that, instead of using the growth measurements adopted by Co-stanzo, more accurate values could be obtained if we employed a growth model calculated directly from our data and if we reconstructed the height of each con-script individually instead of only considering population mean values. This al-lows us to account for the specific characteristics of each young male.
As mentioned earlier, data of conscripts visited more than once could be used to observe growth10. We have repeated measurements for 8863 young males,
therefore for around 10% of all the individuals visited11. However, since we do
not have repeated height measurements for the whole development stage, it is not possible to construct a true growth curve, but, instead, we can only develop a model that shows variations in height between two successive moments. In our data, these moments are both near to the point when growth culminates.
Before constructing a growth model using this data, we should once again point out that individuals who were measured more than once represent a spe-cific part of the population. These conscripts were, in fact, affected by health problems or by psycho-physical deficiencies. Even if these problems were not considered very severe nor unsolvable (otherwise these young males would have been directly rejected at their first examination), the growth experienced by these individuals cannot correctly describe the growth of the population as a whole.
To better understand illnesses and in particular their effects on height and growth, a descriptive analysis was carried out. Pathologies were first classified into groups, according to the typology or to the body part they affected and also to the effects they had on growth. To do so we compared mean heights of con-scripts declared able or rejected due to the different illnesses, we constructed pre-liminary regression models and we also referred to information available in litera-ture (Tanner, 1989).
Taking into account these results we have specified a group of pathologies which don’t influence growth, for example problems in the eyes, hearing prob-lems, scars, stutter, etc. We have also defined three categories of illnesses which may influence growth: anaemia, problems in the thyroid gland12 and general
10 Even if some individuals were measured more than two times, we have decided to only use data of growth relative to the variations between the first and the second examination. A conscript could be declared temporarily unfit for a maximum of two consecutive times. In the third examina-tion, if he was found to be unsuitable, he was reformed. We have actually found, however, that some of the individuals present in our database have been visited more than three times.
11 In some cases it was evident that variations in height were only caused by the different usage of decimals when measurements were obtained in the two examinations (in most cases values were rounded to the nearest half centimetre, but in some cases only whole numbers were used). In these situations we have assigned value zero for the increment (or decrement) in stature.
12 A specific example of the consequences of ‘goitre’, particularly diffused in the alpine area of Friuli, can be found in Tanner (1989).
physical disharmony (extreme weakness or slimness)13.
The classification of illnesses was a very important stage of the analyses, since it allowed us to observe the growth of different types of conscripts. In fact, apart from the 8562 young males considered in this section, two further groups can be identified: conscripts declared able for the military service and those who were rejected definitively. We have assumed that the increments in height experienced by individuals affected by illnesses considered non-influential to growth can be similar to the growth encountered by males declared able in their first examina-tion, in other words ‘healthy’ conscripts. With regards to rejected young males, we have observed the reason that led to this rejection and we have assumed that they their growth pattern was probably equivalent to individuals who were de-clared temporarily unfit for the same physical or psychical problems.
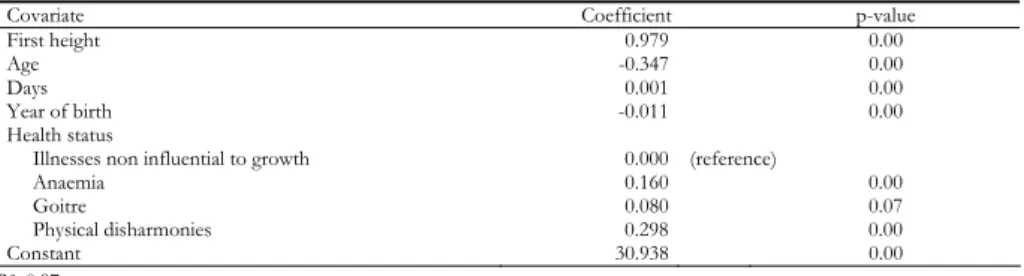
Considering these factors we have constructed a model to calculate the height of each individual at the age of 20, taking into account the information registered during the medical examination (in particular the first measurement of stature). Bearing in mind the factors that influence growth, the covariates included in the model were age at the first examination, the number of days elapsed between the two measurements, the year of birth and the health status of the individual14.
Two reasons determined the importance of considering the age at which each individual was measured. Firstly, as stated earlier, age varied amongst conscripts and, secondly, the amount of growth experienced by each individual is not the same throughout the entire development process. In particular, during the final stage of this process, more growth is experience at younger ages than it is at older ages.
The amount of time elapsed between the two measurements was also ac-counted for since the medical examination did not always take place at the same time of the year. Therefore, an examination was not necessarily carried out 365 days after the previous one and, consequently, for some individuals growth was observed through longer periods than for others.
The year of birth was considered in order to account for the secular trend. Ear-lier cohorts might have, in fact experienced, at similar ages, higher growth than conscripts born in later years.
Health status was included in models using a categorical variable: illnesses con-sidered non influential to growth (reference), anaemia, goitre and physical
13 It is important to note that some of the pathologies identified (for example bone or respira-tory problems, oedema, tuberculosis, tumours, pellagra, hernia, malaria, epilepsy, problems in the lower limbs or feet), might have influenced growth or height measurements. However, in the re-gression models constructed these illnesses did not show significant differences to the non-influential to growth category. The lack of significant results, however, might have only been due to the low numerosity of these individuals (272 in total). These pathologies were therefore grouped together with the non-influential category. Future improvements to the studies can be made if more data is obtained, therefore allowing to consider the effect of these illnesses separately.
14 Since height is determined by a very complex interaction between environmental and genetic factors that takes place throughout the entire growth period of an individual (Tanner, 1989), many other factors (for example last names, place of residence, occupation, etc.) could have been consid-ered in the model. We have, however, retained this unnecessary, since the effects of these factors were already accounted for in the measurement of the first height of each individual.
harmonies. If a young was affected by more than one pathology, the one with the strongest effect on growth was taken into account.
A regression model for truncated data was adopted15. In fact, conscripts whose
height did not exceed the minimum required levels were reformed at their first examination. As an obvious consequence, the lack of repeated measurements of their stature determined a left tail truncation in the distribution of heights ob-tained during the second examination16.
The following model was used
2 1 2 1 3 4 5 6
Height =β +β Height +β Age+β Days+β YearOfBirth+β HealthStatus+ ε
(1) and the coefficients obtained were:
TABLE 1 Model coefficients
Covariate Coefficient p-value
First height 0.979 0.00
Age -0.347 0.00
Days 0.001 0.00
Year of birth -0.011 0.00
Health status
Illnesses non influential to growth 0.000 (reference)
Anaemia 0.160 0.00
Goitre 0.080 0.07
Physical disharmonies 0.298 0.00
Constant 30.938 0.00
R2: 0.97
Before employing these results, a note should be made. The data used to ob-tain the coefficients shown in table 1 regarded increments in heights experienced in periods of nearly a year (from one medical examination to the next). Coeffi-cients can, therefore, be inaccurate when measuring growth over very short peri-ods (small fractions of a year). The height at age 20 of each conscript was there-fore obtained by first calculating how much he would have grown in 365 days and by later considering a proportion of this value by taking into account the number of days elapsed between the medical examination and the 20th birthday of
the young male.
When measuring growth for each conscript, the appropriate coefficients were used. In other words we considered whether each young male was healthy or whether he had been rejected either temporarily or definitively because he was affected by a particular illness (anaemia, goitre, physical disharmonies, pathologies non influential to growth).
15 Truncated data is that where, for a certain value c of y, the exact value of y is known for all cases where y>c and where explicative variables are available only for observations where the exact value of y is known (Breen, 1996).
16 An anomalous concentration was observed in height values comprised between 154 and 156 cm, thus near the minimum stature required for acceptance to the army. To improve the accurate-ness of the analysis and to avoid using data which might have been rounded towards minimum lev-els, when constructing the model we have only considered heights higher than or equal to 157 cm.
6. ESTIMATION OF MISSING DATA
Up to this point, thanks to the data that we have available, we have treated the problem of growth of individuals. We are now able to calculate the height of all conscripts at a precise age. Now we must analyse the statures of a particular cate-gory of individuals, more precisely of those who were not examined and who were therefore not measured, either because they did not present themselves or because they were exempted.
To solve the problem of missing data, we have estimated measurements using Multiple Imputation (Rubin, 1987; Royston, 2004; 2005a; 2005b)17. With this
technique, values are imputed by obtaining means or draws from a predictive dis-tribution of missing data, created using the observed information. Two or more values are drawn from this distribution to replace missing data, thus producing m
datasets, each containing different imputed values for each datum. Inferences that combine these datasets can be very effective, and they can reflect three aspects: uncertainty derived from non-response, sampling variability that results from missing values, uncertainty about the correct model used to estimate missing data.
Since heights were not always missing for the same reason and since the in-formation available in military registers was not always the same, the data was di-vided in two parts before carrying out estimates. The groups of cohorts consid-ered were 1846-58 and 1859-90. Occupation was, in fact, only recorded for males born on or after 1859.
When estimating heights, we chose which information to include in models by taking into account the aspects described earlier, more precisely, the factors that in-fluence growth or those that determined differences between statures of measured and unmeasured conscripts. The covariates considered were age, year of birth, health status and indicators of whether males resided abroad and of whether they had been exempted. For cohorts 1846-58 district of residence was also taken into account. Instead, for conscripts born in the years 1859-90 the estimation procedure was run separately for each district, since each area had shown important differ-ences in migration flows and, most importantly, in labour specialization. Occupa-tion was, in fact, also included in the models for this second group of individuals.
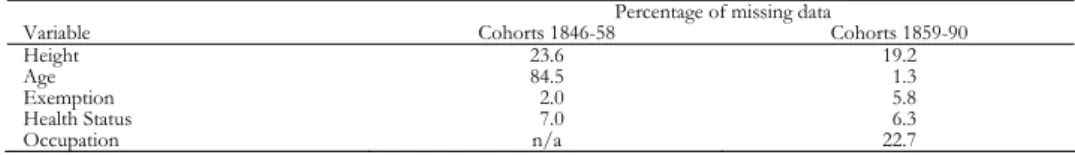
It should be noted, however, that some of these covariates also presented missing data, and that therefore they had to be estimated as well. The advantage of Multiple Imputation is that, if models are properly set up, different variables can be estimated through the same procedure. Table 2 shows the variables which presented missing data and the respective percentages for each group of cohorts.
TABLE 2 Patterns of missing data
Percentage of missing data
Variable Cohorts 1846-58 Cohorts 1859-90
Height 23.6 19.2 Age 84.5 1.3 Exemption 2.0 5.8 Health Status 7.0 6.3 Occupation n/a 22.7
Estimation of age was particularly important for the first group of individuals, since, as mentioned earlier, their date of birth was rarely registered. The proce-dure adopted followed a series of steps. The day of the year in which conscripts were born (comprised between 1 and 365) was first estimated, considering as co-variates district of residence for cohorts 1846-54 and year of birth for cohorts 1855-90. Afterwards, taking into account this value and the year in which individ-ual was born, his complete date of birth was calculated. Lastly, age was obtained using this date and the date of the medical examination.
For cohorts 1846-58, missing data of whether males were exempted was esti-mated considering year of birth, height, and district of residence as covariates. The same model was adopted for cohorts 1859-90, with the exemption, of course, that district was not included since estimates were obtained separately for each area.
To account for health status, the same pathologies described earlier (illnesses non influential to growth, anaemia, goitre, general physical disharmony) were considered. Two further groups of problems were considered: height under 154 cm, and other illnesses which can affect growth (for example bone problems, tu-berculosis, tumours)18. Dummy variables were used to account for these six
groups of physical/psychical defects.
For exempted males, missing health status data had to be estimated only for those born in the years 1846-47. In fact, medical examinations of successive co-horts followed a law19 that was passed at the time, which stated that a conscript
who had the right to be exempted but who also believed to have physical defects which rendered him unable to the military service could first ask to be reformed, and if this request was denied he could then request to be exempted. The exami-nation of individuals born in the years 1846-47 took place before this law was passed, meaning that it was possible that a non negligible number of unhealthy members of these cohorts had asked to be exempted without being visited. Esti-mates of whether these individuals would have been declared able or rejected if they would have been visited had to therefore be obtained. The covariates con-sidered in the models were district of residence and a variable representing either the percentage of conscripts of the relative cohort declared able (for young males born after 1847, when the percentages of rejected males probably represented re-ality) or the mean percentage of able conscripts of all cohorts (for young males born in the years 1846-47, where the percentages of rejected males were lower than expected). Successively, an illness was also estimated for individuals who were considered rejected after this procedure. The covariates considered in this case were year of observation, district of residence and height.
Data of individuals born in the years 1889-90, where information was nearly
18 When constructing the growth model, as mentioned earlier, the category of “other illnesses which might affect growth” was not taken into account, since the number of observations was very low and therefore significant effects were not observed. In this section of the analysis, however, the entire database was used, and not just the individuals who were measured more than once, meaning that the number of conscripts affected by these illnesses was much higher. It was therefore impor-tant to consider this category separately.
complete, revealed that not all migrants were healthy. The same was probably also true for migrants of other cohorts. Health status data was therefore esti-mated for these individuals, using the same procedure adopted for exempted males. The able/rejected variable was estimated based on occupation, an indica-tor of whether the young male resided abroad, and a variable representing either the percentage of conscripts of the relative cohort declared able (for individuals born in the years 1859-68 or in the years 1889-90, period in which percentages of missing data were low) or the mean percentage of able conscripts of all cohorts (for young males born in the years 1869-88, where the percentages of missing data were highest). For rejected males an illness was estimated considering as co-variates year of observation and height.
Where data was available, it was also important to consider occupation when estimating heights. The intergenerational occupational correlation was, in fact, high, implying that most individuals were probably specialized in the same type of labour as their fathers. Occupation of conscripts can therefore serve as a proxy-variable to measure the socio-economic conditions experienced during growth.
We were able to observe that the labour specialization of cohorts 1859-70 and 1871-90 differed. To estimate missing data, separate procedures were therefore adopted. For the first group of cohorts, the covariates included in models were year of observation, height, and a variable that indicated whether the conscript resided abroad. For the second group, a more complicated estimation methodol-ogy was used since the percentage of missing data was much higher. We first con-structed a three level categorical variable to indicate whether the individual was involved in one of the district’s two most diffused occupations, or in the group of “other occupations”. This allowed us to calculate an expected value of the unob-served data. Given that the distribution of labour of migrants was rather different from that of non-migrants, estimates could, in fact, not just be based on the in-formation that was effectively registered, since it only represented individuals who remained in the territory. Where data was missing, the three level categorical variable was estimated considering height, an indicator of whether the conscript resided abroad, and a variable which stated the period of reference. This last fac-tor allowed us to estimate missing data of cohorts 1871-88 using the same distri-bution of labour observed for conscripts of cohorts 1889-90. In fact, we had as-sumed that the labour specialization of migrants born before 1889 was probably similar to that observed for individuals born in 1889-90. Using the values ob-tained for the three level categorical variable, as well as height and year of refer-ence, occupation was estimated for cohorts 1871-90.
7. RESULTS
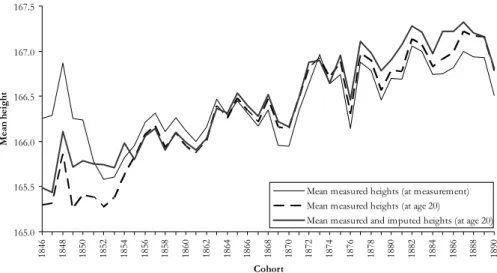
Having estimated missing height measurements, we standardized each of these values at the age of 20, using the model previously described. Figure 9 shows three different trends: mean measured heights (first medical examination only), mean measured heights standardized at the age of 20, and mean measured and imputed heights standardized at the age of 20.
165.0 165.5 166.0 166.5 167.0 167.5 18 46 18 48 18 50 18 52 18 54 18 56 18 58 18 60 18 62 18 64 18 66 18 68 18 70 18 72 18 74 18 76 18 78 18 80 18 82 18 84 18 86 18 88 18 90 Cohort M ea n he ig ht
Mean measured heights (at measurement) Mean measured heights (at age 20)
Mean measured and imputed heights (at age 20)
Figure 9 – Trend in mean measured heights (at measurement and at age 20) and in mean measured and imputed heights (at age 20).
The figure shows that when both measured and imputed heights are consid-ered, a much clearer trend is observed. There are two advantages in using the newly constructed values: mean heights can be compared over time, since they correspond to measurements at the same point in the life of each conscript, and they also represent the male population as a whole, since height values were as-signed to all its members.
When comparing the original with the reconstructed trend, the widest differ-ences can be seen for the first and the last groups of cohorts. In both cases, these gaps are due to the combination of the two effects analysed. These two groups of cohorts, in fact, evidenced the highest differences between age at measurement and age 20 and also the greatest percentages of missing data.
The importance of correcting both for age and for missing measurements can also be seen if we compare the conclusions that can be reached from each trend. When considering raw data, a 0.25 cm increase in heights is observed between cohorts 1846 and 1890. The increase is, instead, much higher (1.33 cm) when measured and imputed standardized heights are taken into account. This second variation is more in line with the increase in stature observed in Italy (Costanzo, 1948; Arcaleni, 1998; 2006). The trends presented by ISTAT had, in fact, evi-denced an increase of about 1.80 cm between cohorts 1854 and 1890. We should, however, point out that for these cohorts average height in Italy was around 163 cm, as opposed with the nearly 166.5 cm observed in Friuli. Shorter individuals experience, at the same age, higher average growth than taller individuals, which partly explains why height increase in the whole of Italy was greater than in Friuli. To finalize the interpretations of the results obtained it is also important to ob-serve territorial variations. We had, in fact, mentioned earlier that the aspects which characterised migration flows varied within territories and that there were
also differences in the labour specialization of each area. We can distinguish four particular territories: the alpine and pre-alpine area (districts of Ampezzo, Moggio and Tolmezzo), which is near the present day border with Austria; the oriental mountain and piedmountain area (districts of Cividale and San Pietro), which to-day confines with Slovenia; the hillside area (districts of Gemona and Latisana) and the low planes area (district of Latisana).
Figure 10 shows three year moving averages of mean measured heights and mean measured and imputed heights at age twenty for these four territories. The alpine and pre-alpine area evidences the most extreme differences between the two trends. When only raw data is considered, the trends in heights is more or less negative, showing, a 0.33 cm decrease between the average height of the first three cohorts and the value for the last three cohorts. If, instead, the recon-structed heights are taken into account, the trend is positive, and it evidences an increase of 1.17 cm between the first and the last value.
If we compare, for each cohort, the original with the reconstructed mean heights, the largest difference observed is of 1.15 cm. Height corrections are therefore greater for the alpine and pre-alpine area than they are for Friuli as a whole, where the highest difference observed was 0.85 cm. These disparate re-sults can be explained by the fact that migration flows were highest in this terri-tory as well as in the hillside area. Less height correction was, instead, observed in the oriental mountain and piedmountain area and in the low planes area, where the percentages of missing data were much lower.
Figure 10 – Three year moving average of mean height by territory.
Mean measured heights (at measurement) Mean measured and imputed heights (at age 20)
Alpine and pre-alpine area
164.5 165.5 166.5 167.5 168.5 18 46 18 49 18 52 18 55 18 58 18 61 18 64 18 67 18 70 18 73 18 76 18 79 18 82 18 85 18 88
Oriental mountain and piedmountain area
164.5 165.5 166.5 167.5 168.5 18 46 18 49 18 52 18 55 18 58 18 61 18 64 18 67 18 70 18 73 18 76 18 79 18 82 18 85 18 88 Hillside area 164.5 165.5 166.5 167.5 168.5 18 46 18 49 18 52 18 55 18 58 18 61 18 64 18 67 18 70 18 73 18 76 18 79 18 82 18 85 18 88
Low planes area
164.5 165.5 166.5 167.5 168.5 18 46 18 49 18 52 18 55 18 58 18 61 18 64 18 67 18 70 18 73 18 76 18 79 18 82 18 85 18 88
8. CONCLUSIONS
This article was aimed at presenting the trend of mean heights in Friuli. After introductory paragraphs on the literature and the sources, we showed the first re-sults, evidencing the major problems encountered when raw data obtained from military records is used. With the aid of a series of figures, we described the ef-fects of three types of problems: differences in the information contained in mili-tary registers, differences in the age at which individuals were measured, and missing data.
Each year’s military register contained information of individuals who were at-tending their first as well as their second or third medical examination. We were able to observe that the mean heights of these groups were different, predomi-nantly due to two factors. Firstly, conscripts who were re-examined represented a selected part of the population. More precisely, they were not completely healthy and this is why they had been asked to return for a further medical visit. Sec-ondly, as an obvious consequence, these individuals were older. When calculating the average height of each cohort, we therefore chose to only use data relating to the first examination of each conscript. Repeated height measurements were, however, employed for other purposes, in particular for the study of growth.
A second problem evidenced was that conscripts were not measured at the same age. We were, in fact, able to observe differences both within each cohort, as a result of variations in the dates of birth, and also between cohorts, since medical examinations did not always take place at the same time of the year and also since not all cohorts were called for conscription ad the same age. To correct for these differences, we constructed a growth model using data of individuals for whom repeated measurements were available. Particular attention was posed, however, on the health status of these conscripts, evidencing illnesses which might have influenced growth. A classification of the reasons why these young males were asked to return to the medical examination of successive years al-lowed us to account for the different types of individuals. In fact, we needed to describe the growth of males who were healthy as well as those who were af-fected by particular physical/psychical problems. The model constructed permit-ted us to standardize the height of each individual at the age of 20, taking into consideration each young male’s characteristics.
The third and last major problem evidenced was missing data. For cohorts 1846-54, a large portion of conscripts were not measured because they had been exempted from the military service. Instead, for cohorts 1855-90, the main reason for missing measurements was migration. The lack of data for these groups im-posed biases in the calculations the population’s mean height, since both ex-empted males and migrants were, on average, taller than the rest of the popula-tion. We therefore chose to estimate this data, by considering each conscript’s characteristics. However, since many of the variables taken into account in this procedure also presented missing data, we also had to estimate them. For this reason, we employed Multiple Imputation techniques.
at the age of 20 using the growth model, we were able to reconstruct the trend of mean heights. This new trend was a lot clearer than the original one. Further-more, comparisons between original and reconstructed values permitted us to ob-serve that the conclusions reached when raw data was used were not always cor-rect.
The results obtained in this paper bring to light some reflections which must be made when using the trend of historical Italian heights presented by ISTAT.
Dipartimento di Economia MARCOBRESCHI
Università di Sassari
Dipartimento di Statistica ALESSIOFORNASIN
Università di Udine
Department of Economic History LUCIANAQUARANTA
University of Lund
REFERENCES
E. ARCALENI (1998), La statura dei coscritti italiani delle generazioni 1854-1976, “Bollettino di
Demografia Storica”, 29, pp. 23-59.
E. ARCALENI (2006), Secular trend and regional differences in the stature of Italians, 1854-1980,
“Economics and Human Biology”, 4, pp. 24-38.
B. A’HEARN(2004),A restricted maximum likelihood estimator for truncated height samples,
“Eco-nomics and Human Biology”, 2, pp. 5-19.
B. A’HEARN, J. KOMLOS(2003), Improvements in Maximum Likelihood Estimators of Truncated
Nor-mal Samples with Prior Knowledge of σ: A Simulation Based Study with Application to Historical Height Samples, Discussion paper 2003-08, Department of Economics, University of
Munich.
A.O. AL-OMAIR(1991), Birth order, socioeconomic status and birth height of Saudi infants, “Journal of the Royal Society of Health”, 111, pp. 221-223.
B. BOGIN(1999), Patterns of Human Growth, Cambridge: Cambridge University Press.
R. BREEN(1996), Regression Models: Censored, Sample Selected or Truncated Data, Sage, Thousand Oaks Ca.
H.J. BRINKMAN, J.W. DRUKKER, B. SLOT (1988), Height and income: a new method for the estimation of
historical national account series, “Explorations in Economic History”, 25, pp. 227-264.
T.J. COLE(2003), The secular trend in human physical growth: a biological view, “Economics and human biology”, 1, pp. 161-168.
S. COLL(1998), The Relationship between Human Physical Stature and Gdp (Some Experiments with
European Time Series), in J. KOMLOS, J. BATEN(eds.), The Biological Standard of Living in
Com-parative Perspective, Franz Steiner, Stuttgart, pp. 384-407.
A. COSTANZO (1948), La statura degli italiani ventenni nati dal 1854 al 1920, “Annali di Statis-tica”, Serie VII, 2, pp. 59-123.
H. DE BEER (2004), Observations on the history of Dutch physical stature from the late-Middle Ages to
the present, “Economics and human biology”, 2, pp. 45-55.
G. DI CAPORIACCO(1967-69), Storia e statistica dell’emigrazione dal Friuli e dalla Carnia, Edizioni del Friuli Nuovo, Udine.
R. FLOUD, K. WACHTER, A. GREGORY (1990), Height Health and History. Nutritional Status in the
A. FORNASIN, L. QUARANTA (2006), La statura degli italiani nati dal 1854 al 1890. Prime ipotesi per
la costruzione di una nuova serie storica, Working Paper N.8, Dipartimento di Scienze Stati-
stiche dell’Università degli Studi di Udine.
M. HERMANUSSEN, B. HERMANUSSEN, J. BURMEISTER (1988), The association between birth order and
adult stature, “Annals of Human Biology”, 15, pp. 161-165.
B. HULANICKA, K. KOTLARZ (1991), The final phase growth in height, “Annals of Human Biol-ogy”, 10, pp. 429-434.
V. ILARI(1990), Storia del servizio militare in Italia, vol. II, La «Nazione armata» (1871-1918), Centro militare di studi strategici, Roma.
ISTAT(1958), Sommario di statistiche storiche italiane 1861-1955, Roma.
S. KATO, K. ASHIZAVA, K. SATOH (1998), An examination of the definition ‘final eight’ for practical use, “Annals of Human Biology”, 25, pp. 263-270.
J. KOMLOS (2004), How to (and how not to) analyse deficient height samples, “Historical Methods”, 37, pp. 160-173.
J. KOMLOS, J.H. KIM(1990), Estimating trends in historical heights, “Historical Methods”, 23, pp. 116-120.
C. LAMIONI(2002), Gli uffici di leva dall’Unità d’Italia. Le istituzioni e la documentazione all’Archi-
vio di Stato di Firenze, “Popolazione e storia”, 2, pp. 127-153.
R. LIVI(1896), Antropometria militare, parte 1, Dati antropologici ed etnologici; Atlante della geografia
antropologica d’Italia, Giornale medico del Regio Esercito, Roma.
R. LIVI (1905), Antropometria militare, parte 2, Dati demografici e biologici, Giornale medico del Regio Esercito, Roma.
E. PH. MACKEPRANG(1907-1911), De Værnepligtiges Legemshøjde i Danmark, “Meddelelser om Danmarks Antropologi”, 1, pp. 13-68.
L. QUARANTA (2007), A case study of missing historical heights in Friuli (Italy): Estimation using
Mul-tiple Imputation, Working Paper N.1, Dipartimento di Scienze Statistiche dell’Università
degli Studi di Udine.
G. ROCHAT, G. MASSOBRIO (1978), Breve storia dell’esercito italiano dal 1861 al 1943, Einaudi, Torino.
D. B. RUBIN (1987), Multiple Imputation for Non-response in Surveys, John Wiley & Sons, New York.
P. ROYSTON (2004), Multiple imputation of missing values, “Stata Journal”, 4, pp. 227-241.
P. ROYSTON (2005a), Multiple imputation of missing values: update, “Stata Journal”, 5, pp. 188-201.
P. ROYSTON (2005b), Multiple imputation of missing values: Update of ice, “Stata Journal”, 5, pp. 527-536.
R. STECKEL(1983), Height and per capita income, “Historical Methods”, 16, pp. 1-7.
R. STECKEL(1986), A Peculiar Population: The Nutrition, Health and Mortality of American Slaves
from Childhood to Maturity, “The Journal of Economic History”, 46, 3, pp. 721-742.
J.M. TANNER (1989), Foetus into Man. Physical Growth from Conception to Maturity, Harvard Uni-versity Press, Cambridge Ma.
K.W. WACHTER, J. TRUSSELL(1982), Estimating historical heights, “Journal of the American Sta-tistical Association”, 77, pp. 279-93.
RIASSUNTO
Le stature dei maschi ventenni del Friuli nati tra il 1846 e il 1890
L’obiettivo dell’articolo è ricostruire la serie storica delle stature dei coscritti delle gene-razioni 1846-1890 nati nella provincia del Friuli. Il lavoro è dedicato ad individuare i pro-blemi che sono presenti nella documentazione relativa alle liste di estrazione e a proporre delle soluzioni che li possano almeno in parte correggere. Un interesse particolare è posto nell’evidenziare l’alta importanza dell’utilizzo di misurazioni omogenee e nell’introdurre alcune tecniche che hanno permesso di rendere uniformi le altezze e quindi anche le comparazioni nel tempo. I risultati mettono in luce alcuni possibili punti deboli delle serie storiche delle statue relative all’Italia nel suo complesso ad oggi esistenti.
SUMMARY
Heights of twenty years old males of Friuli (Italy) born between 1846 and 1890
The aim of this article is to reconstruct the historical trend of heights of conscripts born in the province of Friuli in the years 1846-90. This work is dedicated to identifying the problems encountered when using enrolment lists and to proposing solutions which can, at least in part, correct these problems. Particular interest is posed in evidencing the very high importance of using homogeneous measurements and in introducing some techniques which have allowed us to render statures uniform and therefore also compara-ble over time. The results obtained bring to light some possicompara-ble weak points of the series of Italian historical heights which has been used up to date.