Università Politecnica delle Marche
Corso di Dottorato di Ricerca in Ingegneria Civile, Ambientale, Edile e Architettura Curriculum in Ingegneria Civile, Ambientale, Edile e Architettura
XVIII edition - new series
---
Dynamic testing for the characterisation
of bituminous interlayers
PhD Dissertation of:
Davide Ragni
Advisor:
Prof. Francesco Canestrari
Co-Advisor:
Prof. Andrea Graziani
Curriculum Supervisor:
Prof. Francesco Fatone
Università Politecnica delle Marche
Dipartimento di Ingegneria Civile, Edile e Architettura
To my family
“…It does not matter how slowly you go
so long as you do not stop
…”
Confucius
“…The only way to do great work is to love what you do…”
Steve Jobs
Acknowledgements
First, I would like to express my deepest appreciation to my Advisor, Professor Francesco Canestrari, and Co-Advisor, Professor Andrea Graziani, for being invaluable reference points for my research work. Without their support, this research could not have been possible.
A special mention to Professor Christophe Petit for all the invaluable support given me during my stay in France. It was a unique occasion to grow up as a researcher and to work with interesting and brilliant people. And thanks to him, I realised one of my dreams: flying. A grateful thank to Professor Y. Richard Kim for all the invaluable support given me during my stay in the US. It was extraordinary cooperation and unrepeatable occasion to meet new, interesting and motivating people. One name above all is Nithin Sudarsanan, a young researcher and friend of great value, who has always been present and very supportive for my research and beyond.
A heartfelt thank is dedicated to the entire research group of the department ICEA-Infrastructure area (professors, researchers, PhD students and technicians) for all their help. Other fundamental people have made my PhD years an unrepayable experience and deserve a special mention.
My sincere appreciation goes to Arianna Stimilli for being an inspiration and a role model to pursue. A remarkable researcher and, especially, an even more marvellous person. And a true and irreplaceable friend. Always patient, always ready to listen to my questions and complaints. I will always be grateful to her.
Endless thanks go to my colleagues and friends Giorgia Mazzoni, Chiara Mignini, Emiliano Prosperi and Simone Raschia for always encouraging me to move forward during this journey. Thank for understanding me and cheering me to be able to meet the deadlines. If I am less procrastinating today (i.e., no longer a “Cunctator”), it is thanks to them.
Special thoughts go to Cristian De Angelis, Daniele Ragni, Martina Cingolani, Claudia Castaldo, Hedi Bennouri, and Fernando do Couto Rosa Almeida for having been close to me during these years. Their closeness and friendship give me the balance I need. No words can express my affection for them.
Finally, I am deeply grateful to my family for their continuous love, inspiration and support in all my endeavours. I am the way I am thanks to them.
Abstract
The traffic loading on pavement structures includes both vertical and horizontal stresses (normal and tangent to the pavement surface). The latter become critical in regions that are prone to frequent braking, cornering or on steep grades. Since bituminous pavement is a multilayer structure, the existence of a poor interlayer bonding between bituminous layers could adversely affect the pavement performance and serviceability. Hence, a proper evaluation of the interlayer bonding has the utmost importance in pavement performance. The evaluation of interlayer bonding in bituminous pavements is typically carried out by measuring the interlayer shear strength (ISS) at failure using static laboratory tests. A significant improvement of the current testing approach is the development of dynamic testing devices, which could simulate the field conditions more realistically since the traffic loads applied to the pavement are dynamic. In this context, this PhD thesis describes the experimental activities carried out at Università Politecnica delle Marche, North Carolina State University and University of Limoges within the Task Group 3 “Pavement multilayer system” of the RILEM TC 272-PIM. The activities focused on the design and development of a new testing device for performing dynamic interlayer bond testing at Università Politecnica delle Marche along with carrying out dynamic bond testing using other existing devices. The interlayer behaviour has been investigated through both direct shear and torque tests on double-layered specimens extracted from laboratory compacted slabs prepared using a single bituminous mixture. The stimulating results presented in this thesis, reported both in terms of stiffness and cumulative damage, showed that dynamic bond testing can successfully be used to evaluate the bituminous interlayer performance and can provide a noticeable help for defining the service life of the pavement sections realistically compared to the static bond tests.
iv
Sommario
Il carico di traffico trasferito sulle pavimentazioni stradali include sia sollecitazioni verticali che orizzontali. Queste ultime diventano particolarmente critiche nelle zone soggette a frequenti frenate, in curva o con pendenze elevate. Poiché la pavimentazione stradale è una struttura multistrato, l'esistenza di uno scarso collegamento all’interfaccia tra gli strati bituminosi potrebbe influire negativamente sulle prestazioni e funzionalità della pavimentazione. Pertanto, una corretta valutazione del grado di collegamento tra gli strati è di fondamentale importanza. Finora, tale valutazione viene effettuata misurando la resistenza a taglio dell'interfaccia utilizzando prove di laboratorio statiche. Un miglioramento significativo dell'attuale approccio di prova è lo sviluppo di dispositivi dinamici, che potrebbero simulare in modo più realistico le condizioni in sito. La presente Tesi di dottorato descrive le attività sperimentali svolte presso l'Università Politecnica delle Marche, la North Carolina State University e l'University of Limoges nell'ambito del Task Group 3 "Pavement multilayer system" del RILEM TC 272-PIM. Le attività si sono concentrate sulla progettazione e lo sviluppo di un nuovo dispositivo di prova per l'esecuzione di prove dinamiche all’interfaccia presso l'Università Politecnica delle Marche e sull’esecuzione di prove dinamiche con altri dispositivi esistenti. Il comportamento a taglio delle interfacce è stato studiato sia con prove di taglio diretto che di torsione su campioni carotati da lastre bistrato compattate in laboratorio e preparate con un'unica miscela bituminosa. I risultati presentati in questa tesi, sia in termini di rigidità che di danno cumulativo, hanno dimostrato che le prove di taglio dinamico possono essere utilizzate con successo per valutare le prestazioni delle interfacce bituminose e fornire un notevole aiuto per definire la vita utile delle pavimentazioni in modo più realistico rispetto alle prove di taglio statico.
Contents
Acknowledgements ... i
Abstract ... iii
Sommario ... iv
Contents ... v
List of Figures... x
List of Tables ... xix
Introduction ... 1
Chapter 1 ... 3
Background and research description ... 3
1.1 Outline of the dissertation ... 5
Problem statement ... 7
Chapter 2 ... 9
Literature review ... 9
2.1 Bituminous pavement ... 9
2.2 Interlayer bonding ... 11
2.2.1 Importance of a good interlayer bonding ... 11
2.2.2 Theoretical and modelling investigation on interlayer bonding ... 13
2.2.3 Factors affecting interlayer bonding ... 19
Type of materials ... 20
Construction characteristics ... 20
Loading/environmental aspects ... 21
2.3 Methods for measuring the interlayer bonding level ... 22
2.3.1 Static bond testing ... 23
2.3.2 Dynamic (cyclic) bond testing ... 25
vi
New dynamic testing equipment ... 39
3.1 Introduction ... 39
3.2 Concept development ... 39
3.3 Prototype construction ... 41
3.4 Prototype checking and modification ... 42
3.5 Dynamic testing equipment: Cyclic-ASTRA ... 46
Chapter 4. ... 48
RILEM interlaboratory test ... 48
4.1 General overview ... 48
4.2 Background of RILEM interlaboratory test ... 48
4.3 Participating laboratories ... 49
4.4 RILEM interlaboratory test: slab sample ... 50
4.4.1 Asphalt concrete ... 50
4.4.2 Slabs preparation and properties ... 52
Chapter 5. ... 58
Experimental investigation with Cyclic-ASTRA ... 58
5.1 Introduction ... 58
5.2 Materials and sample preparation ... 58
5.3 Testing device and program ... 62
5.3.1 ASTRA test ... 62
5.3.2 Leutner test ... 63
5.3.3 Cyclic-ASTRA test ... 66
5.3.4 Experimental program ... 67
5.4 Result and analysis ... 69
5.4.1 Static test ... 69
5.4.2 Cyclic-Leutner test ... 70
5.5 Conclusions ... 78
Chapter 6. ... 79
Experimental investigation with Cyclic-MAST ... 79
6.1 Introduction ... 79
6.2 Specimen preparation ... 79
6.3 Testing device and program ... 83
6.3.1 Modified Advanced Shear Tester (MAST) ... 83
6.3.2 Digital image correlation (DIC) technique ... 86
6.3.3 Cyclic-MAST test ... 88
6.4 Result and analysis ... 94
6.4.1 Displacement amplitude sweep (DAS) test ... 94
6.4.2 Constant displacement amplitude cyclic (CDAC) test... 98
6.5 Conclusions ... 101
Chapter 7. ... 103
Experimental investigation with shear-torque fatigue test ... 103
7.1 Introduction ... 103
7.2 Specimen preparation ... 103
7.3 Cyclic torque test ... 105
7.3.1 Shear-torque fatigue test ... 106
7.3.2 Shear-torque fatigue test analysis ... 108
Chapter 8. ... 112
Experimental investigation with shear-torque fatigue test ... 112
Part A ... 112
8.1 Introduction ... 112
8.2 Literature review on acoustic emission ... 112
8.3 Material and testing methods ... 117
viii
8.3.2 Shear-torque fatigue test ... 117
8.3.3 Acoustic emission technique... 118
8.4 Result and discussion ... 121
8.4.1 Mechanical analysis ... 121
8.4.2 Acoustic Analysis: 3D AE-localisation ... 123
8.4.3 Comparison between mechanical and AE results ... 128
8.5 Conclusions and perspectives ... 130
Chapter 9. ... 132
Experimental investigation with shear-torque fatigue test ... 132
Part B ... 132
9.1 Introduction ... 132
9.2 Modelling of interlayer behaviour during shear-torque fatigue tests ... 132
9.3 Experimental program ... 135
9.3.1 Specimens ... 135
9.3.2 Experimental investigation ... 135
9.4 Preliminary validation of the model ... 136
9.5 Interlayer shear fatigue law ... 141
9.5.1 Fatigue failure criterion... 141
9.5.2 Fatigue curve ... 143
9.6 Conclusions ... 146
Chapter 10. ... 147
Experimental investigation with shear-torque fatigue test ... 147
Part C ... 147
10.1 Introduction ... 147
10.2 General overview ... 147
10.3 Experimental program ... 154
10.3.2 Trial section ... 155
10.3.3 Testing program and procedure ... 158
10.4 Result and discussion ... 163
10.5 Conclusions ... 169
Summary of the overall experimental study ... 171
Chapter 11. ... 173
Concluding remarks ... 173
Lists of 3-years PhD publications ... 177
x
List of Figures
Figure 1.1. Research program flowchart. ... 5
Figure 2.1. Scheme of rigid (left) and flexible (right) pavement. ... 9
Figure 2.2. Scheme of the flexible pavement layers. ... 10
Figure 2.3. Redistribution of stresses in a multilayer system due to the loss of
bonding between the layers (Raab et al., 2009). ... 11
Figure 2.4. Slippage cracking. ... 12
Figure 2.5. Delamination. ... 13
Figure 2.6. Fatigue cracking. ... 13
Figure 2.7. Stress components induced by traffic loading (Wu et al., 2017).... 14
Figure 2.8. Shear stress distribution in 3D space for thin pavement during
braking condition (Cho et al., 2017a). ... 15
Figure 2.9. (a) Pavement ABAQUS model and (b) maximum shear stresses for
accelerating, steady rolling, and decelerating (Hu et al., 2017). ... 16
Figure 2.10. Scheme of the four-layer pavement studied by Romain (Uzan et
al., 1978). ... 17
Figure 2.11. Scheme of the pavement studied by Uzan et al. (1978)... 18
Figure 2.12. Distribution of strain vs depth (Uzan et al., 1978). ... 18
Figure 2.13. Mechanisms of interlayer bonding failure (Sudarsanan et al.,
2015). ... 22
Figure 2.14. Working scheme of different test methods for the interlayer
bonding measurement (Canestrari et al., 2013). ... 23
Figure 2.15. Load
– deformation curve for the shear test. ... 24
Figure 2.16. Virginia Shear Fatigue device: (a) schematic view and (b) picture.
... 26
Figure 2.17. Dynamic Shear Box device: (a) working scheme and (b) position
of LVDTs. ... 26
Figure 2.19. Schematic diagram of the Double Shear Test (DST) device. ... 28
Figure 2.20. Schematic presentation and picture of the Double Shear Test
(DST) device. ... 29
Figure 2.21. CTIB device: (a) schematic representation and (b) picture of the
device. ... 30
Figure 2.22. Schematic diagram of the Automatic Torque Bond test. ... 30
Figure 2.23. SISTM: a) working scheme and b) device. ... 31
Figure 2.24. SHSTM: a) working scheme and b) device. ... 32
Figure 2.25. Configuration of Shear Fatigue Test apparatus. ... 32
Figure 2.26. Interlaminar Shear Fatigue Tester: (a) schematic diagram and (b)
picture. ... 33
Figure 2.27. Advanced Shear Tester (AST): (a) schematic view and (b) picture.
... 34
Figure 2.28. Double Shear Tester (DST): (a) schematic view and (b) picture. 35
Figure 2.29. Modified Advanced Shear Tester (MAST): (a) schematic view
and (b) picture. ... 35
Figure 2.30. Direct Shear Fatigue device set up. ... 36
Figure 2.31. 2T3C Hollow Cylinder Apparatus. ... 37
Figure 3.1. Concept scheme of the Cyclic-ASTRA device: assembled view. ... 40
Figure 3.2. Concept scheme of the Cyclic-ASTRA device: exploded view. ... 40
Figure 3.3. Prototype view. ... 41
Figure 3.4. Leutner shear device. ... 42
Figure 3.5. Cyclic-Leutner test. ... 42
Figure 3.6. Evolution of K during the test at 20 °C, 5 Hz and 0.14 MPa. ... 44
Figure 3.7. Evolution of displacement during the test at 20 °C, 5 Hz and 0.14
MPa. ... 44
Figure 3.8. Test output of the prototype. ... 45
Figure 3.9. ASTRA device. ... 46
xii
Figure 4.1. Participating laboratories. ... 50
Figure 4.2. Grading curve of aggregates. ... 51
Figure 4.3. Roller compactor mould for the preparation of the bituminous
slabs (left) with the collar for the containment of the not yet compacted
material (right). ... 52
Figure 4.4. Roller compactor. ... 53
Figure 4.5. Roller compactor working scheme. ... 53
Figure 4.6. (a) Guide for adjusting the height of the slabs and (b) panel
control. ... 54
Figure 4.7. Double-layered slab geometry. ... 54
Figure 4.8. RILEM double-layered slabs (three slabs are missing in the
image). ... 55
Figure 4.9. Cored double-layered cylindrical specimens. ... 55
Figure 4.10. Slab packing. ... 57
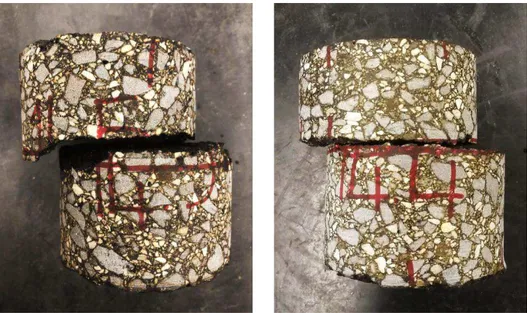
Figure 5.1. Slab (a) before and (b) after the coring procedure. ... 59
Figure 5.2. (a) Tack coat application; (b) specimen code according to the
coring position. ... 60
Figure 5.3. Scheme concept of ASTRA device. ... 63
Figure 5.4. (a) Half-boxes, steel adaptors and shims; (b) specimen inside the
half-boxes. ... 63
Figure 5.5. Scheme concept of Leutner device. ... 64
Figure 5.6. Leutner shear device: (a) inside the loading frame; (b) scheme of
the side view; (c) scheme of cross-section normal to the shear plane. ... 65
Figure 5.7. Leutner test result for the single specimen. ... 66
Figure 5.8. (a) Cyclic-Leutner test and (b) Cyclic-ASTRA test. ... 67
Figure 5.9. Experimental program. ... 68
Figure 5.10. Average interlayer shear strength (ISS) from two static shear
tests (error bars represent the standard deviation). ... 69
Figure 5.12. Displacement at the layer interface during the Cyclic-Leutner
test. ... 70
Figure 5.13. Interlayer shear fatigue curves obtained from Cyclic-Leutner test
(T = 20 °C). ... 71
Figure 5.14. Shear load and deformation measured with the Cyclic-ASTRA
testing device. ... 72
Figure 5.15. Displacement at the layer interface during the Cyclic-ASTRA test
at 10 °C, 5 Hz and 0.42 MPa. ... 73
Figure 5.16. Effect of temperature and loading amplitude on the displacement
at the layer interface during the Cyclic-ASTRA test. ... 74
Figure 5.17. Effect of interface type on the displacement at the layer interface
during the Cyclic-ASTRA test at 20 °C, 5 Hz and 0.42 MPa. ... 75
Figure 5.18. Interlayer shear fatigue curves of UN specimens obtained from
Cyclic-ASTRA test (T = 10 °C and 20 °C). ... 76
Figure 5.19. Interlayer shear fatigue curves of UN and TC specimens obtained
from Cyclic-ASTRA test (T = 20 °C). ... 77
Figure 5.20. Failure mechanisms of the specimens cored at the centre (left)
and border (right) of the slab. ... 77
Figure 6.1. Coring procedure. ... 80
Figure 6.2. (a) Cutting procedure and (b) scheme of specimen cutting. ... 81
Figure 6.3. (a) CoreDry device and (b) specimen inside the CoreDry device. . 81
Figure 6.4. (a) CoreLok device and (b) sealed specimen. ... 82
Figure 6.5. MAST device. ... 84
Figure 6.6. MAST shoe and gluing jig... 84
Figure 6.7. Gluing procedure of MAST specimen. ... 85
Figure 6.8. (a) Loading specimen into the MAST and (b) specimen mounted
into the MAST setup. ... 85
Figure 6.9. Speckled paper and DIC matching process (Safavizadeh and Kim,
2017). ... 87
Figure 6.10. (a) DIC camera and light setup, (b) MAST with DIC lighting, (c)
image taken using Vic-Snap. ... 88
xiv
Figure 6.11. MAST installed in the MTS machine. ... 89
Figure 6.12. Cyclic-MAST test sequence. ... 90
Figure 6.13. Test protocol for DAS test... 90
Figure 6.14. Testing scheme based on specimen coring position. ... 92
Figure 6.15. Typical input and response for displacement and force versus
time. ... 93
Figure 6.16. Identification of
𝑵𝟓𝟎. ... 94
Figure 6.17. Evolution of the force amplitude and actuator displacement
amplitude as a function of the number of cycles in the DAS test at 20 °C. ... 95
Figure 6.18. Evolution of the interlayer shear stiffness and actuator
displacement amplitude as a function of the number of cycles in the DAS test
at 20 °C... 95
Figure 6.19. Evolution of the interlayer shear stiffness and DIC displacement
amplitude as a function of the number of cycles in the DAS test at 20 °C. ... 96
Figure 6.20. Evolution of actuator displacement amplitude and DIC
displacement amplitude as a function of the number of cycles in the DAS test
at 20 °C... 97
Figure 6.21. Evolution of interlayer shear stiffness as a function of the number
of cycles in the CDAC test at 20 °C for specimens cored from slab 12. ... 98
Figure 6.22. Evolution of interlayer shear stiffness as a function of the number
of cycles in the CDAC test at 20 °C for specimens cored from slab 15. ... 99
Figure 6.23. Comparison of interlayer shear stiffness as a function of the
number of cycles in the CDAC test at 20 °C for specimens cored from slab 12
and slab 15. ... 99
Figure 6.24. Failed specimens after the CDAC test. ... 100
Figure 6.25. Interlayer shear fatigue curve obtained from CDAC tests. ... 101
Figure 7.1. Slab coring procedure: (a) specimen identification and (b) cored
cylindrical specimens. ... 104
Figure 7.2. Sawed and trimmed cylindrical specimens of slabs 5 and 7. ... 104
Figure 7.3. Scheme of the sample deformation during shear (Uzan et al., 1978).
... 106
Figure 7.4. Working scheme of shear-torque fatigue test. ... 107
Figure 7.5. Picture of the specimen inside the temperature-controlled
chamber. ... 107
Figure 7.6. Schematic representation of the test: (a) identification of the
coordinate reference system and (b) set of recorded data. ... 108
Figure 7.7. Schematic view of the (a) sample and (b) its section A-A subjected
to shear-torque fatigue load. ... 109
Figure 7.8. Evolution of the norm of the complex shear modulus |G*| as a
function of the number of cycles. ... 111
Figure 8.1. Acoustic emission (AE) technique. ... 113
Figure 8.2. Parameters of a typical AE signal (Grosse and Ohtsu, 2008). ... 113
Figure 8.3. (a) Uniaxial tensile cyclic test and AE testing set up; (b)
accumulative AE energy and vertical strains versus time (Seo and Kim, 2008).
... 114
Figure 8.4. (a) Indirect tension strength test and AE testing set up; (b) typical
plot for AE event and load with loading line displacement (Li and
Marasteanu, 2010). ... 115
Figure 8.5. (a) Specimen instrumented with AE sensors; (b) evolution in
stiffness modulus and number of events during the test (Diakhaté et al., 2012).
... 116
Figure 8.6 Specimen identification. ... 117
Figure 8.7. Sections of the cylindrical specimen and piezoelectric transducers
location: (a) vertical and (b) horizontal. ... 119
Figure 8.8. AC specimen instrumented with acoustic emission sensors and
pre-amplifiers. ... 119
Figure 8.9. Calibration of the AE-location with the PLB test: (a) square mesh
of 25 mm overlaid on the fractured surface and (b) PLB test results. ... 120
Figure 8.10. Evolution of |G*|n in shear-torque fatigue test at 10 Hz and 20 °C
and classical fatigue failure criterion. ... 122
Figure 8.11. Cumulated location of AE events for specimen 5.5: (a) X-Z plane,
and (b) Y-Z plane. ... 123
xvi
Figure 8.12. Cumulated location of AE events for specimen 5.2: (a) X-Z plane,
and (b) Y-Z plane. ... 124
Figure 8.13. EA events frequency distribution along Z position for specimen
5.5. ... 124
Figure 8.14. EA events frequency distribution along Z position for specimen
5.2. ... 125
Figure 8.15. Normal Q-Q plot of AE events along Z position for specimen 5.5
and specimen 5.2. ... 126
Figure 8.16. Location of AE events on the X-Y plane: (a) specimen 5.5 and (b)
specimen 5.2. ... 127
Figure 8.17. EA events density on the X-Y plane as a function of the distance
from the centre of the specimen (R) for specimen 5.5 and specimen 5.2. ... 127
Figure 8.18. EA events polar frequency distribution on the X-Y plane for
specimen 5.5 and specimen 5.2... 128
Figure 8.19. Evolution of the cumulative number of AE events and of |G*|n
during the shear-torque fatigue test for specimen 5.5. ... 129
Figure 8.20. Evolution of the cumulative number of AE events and of |G*|n
during the shear-torque fatigue test for specimen 5.2. ... 130
Figure 9.1. (a) Cross-section of a double-layered specimen and (b) plane
representation of the shear strain interpretation. ... 133
Figure 9.2. Evolution of the complex shear modulus |G*| for specimens 0_2_80
and 7_4_80
bulkduring the shear-torque fatigue test. ... 137
Figure 9.3. Evolution of the normalised complex shear modulus |G*|n for
specimens 0_2_80 and 7_4_80 during the shear-torque fatigue test. ... 139
Figure 9.4. Evolution of |G*|
bulkand |G
i*
| for specimen 7_4_80
bulkduring the
shear-torque fatigue test. ... 140
Figure 9.5. Evolution of
𝜸
bulkand
𝜸
ifor specimen 7_4_80
bulkduring the
shear-torque fatigue test. ... 141
Figure 9.6. Evolution of the normalised complex shear modulus |G*|n during
the shear-torque fatigue test and fatigue failure criterion: a) 5_1_100; b)
5_5_85; c) 7_2_85; d) 7_3_75. ... 142
Figure 9.7. Interlayer shear fatigue curve in terms of the amplitude of the
applied shear stress as a function of the number of cycles to failure. ... 143
Figure 9.8. Failure mechanisms of the specimens at the border of the slab. . 144
Figure 9.9. Interlayer shear fatigue curve of the border specimens in terms of
the amplitude of the applied shear stress as a function of the number of cycles
to failure. ... 145
Figure 10.1. Asphalt overlay. ... 148
Figure 10.2. Use of reinforcements in mitigation of reflective cracking in
asphalt overlays: a) roadway designed without reinforcements, b) roadway
designed with reinforcements (Zornberg, 2017). ... 149
Figure 10.3. Different geosynthetics for road pavements: a) geotextile, b)
geomembrane, c) geogrid, d) geocomposite. ... 150
Figure 10.4. Waterproofing action: a) roadway designed without
geocomposite, b) roadway designed with geocomposite (Zornberg, 2017). ... 150
Figure 10.5. Variation of crack height with the number of load cycles (Brown
et al., 2001). ... 152
Figure 10.6. Application of the reinforcement system on a new (left) or milled
(right) surface. ... 153
Figure 10.7. Detail of the installed geosynthetics: (a) carbon fibre geogrid CF
and (b) glass fibre geogrid FG. ... 155
Figure 10.8. Scheme of the trial section. ... 155
Figure 10.9. Installation of carbon fibre geogrid (CF). ... 156
Figure 10.10. Installation of glass fibre geogrid (FG). ... 157
Figure 10.11. Completed full-scale trial section. ... 157
Figure 10.12. Cross-section of the full-scale trial section. ... 158
Figure 10.13. Field cored specimens. ... 158
Figure 10.14. Rectification of the specimen: (a) cutting and (b) lapping. ... 159
Figure 10.15. Definition of failure using the material modulus approach. .... 162
Figure 10.16. Definition of failure using Reese’s approach... 162
xviii
Figure 10.17. Failure mechanism of reinforced specimens in a shear-torque
fatigue test. ... 163
Figure 10.18. Evolution of normalised norm of complex shear modulus |G*|n
and phase angle
𝝋 of specimen FG_7 during shear-torque fatigue test at 10 Hz
and 10 °C. ... 164
Figure 10.19. Interlayer shear fatigue curves for UN interface type at 20 °C.
... 165
Figure 10.20. Interlayer shear fatigue curves for CF interface type at 20 °C.
... 165
Figure 10.21. Interlayer shear fatigue curves for FG interface type at 20 °C.
... 166
Figure 10.22. Interlayer shear fatigue curves for FG interface type at 10 °C.
... 166
Figure 10.23. Interlayer shear fatigue curves for all interface types... 169
List of Tables
Table 2.1. List of dynamic bond testing devices. ... 38
Table 4.1. Participating laboratories ed equipment... 49
Table 4.2. Aggregates characterisation. ... 51
Table 4.3. Basic characteristics of the SBS polymer modified binder. ... 52
Table 4.4. Properties of the slabs. ... 56
Table 4.5. Slabs tested by the participating laboratories. ... 56
Table 5.1. Main properties of the tack coat. ... 60
Table 5.2. Main properties of the specimens. ... 61
Table 5.3. Experimental program. ... 68
Table 5.4. Interlayer shear stiffness (K) values. ... 72
Table 6.1. Final properties of the specimens. ... 82
Table 6.2. Test protocol for DAS test. ... 91
Table 6.3. Displacement amplitude input for CDAC test. ... 97
Table 7.1. Final properties of the specimens. ... 105
Table 8.1. Final properties of the specimen 5.2 and specimen 5.5. ... 117
Table 8.2. Average and standard deviation of the AE-locations. ... 121
Table 9.1. Experimental program. ... 136
Table 10.1. Characteristics of the geosynthetics... 154
Table 10.2. Final properties of the specimens. ... 159
Table 10.3. Experimental program. ... 160
Table 10.4. Parameters and for all interface types according to Eq. (10.7).
... 167
Chapter 1
Background and research description
The development of smart, green and integrated transport is one of the currently societal challenges. Specifically, this challenge aims the boost the competitiveness of the transport industries and achieve a transport system that is resource-efficient, climate-and-environmentally friendly, safe and seamless for the benefit of all citizens, the economy and society.
Moreover, in the current economic situation, National Road Authorities are under increasing pressure to build and maintain their road network with reducing budgets. It is therefore essential that the maximum use is made of innovation, both in the roads sector and transferred from other sectors to assist in the management of the network.
In the field of bituminous materials and pavements, many innovative technologies are under development in laboratories around the world. Since more than 30 years, a relevant part of these innovations has been developed within the framework of RILEM, the International Union of Laboratories and Experts in Construction Materials, Systems and Structures.
Bituminous pavements are composed of several layers with different materials. The mechanical behaviour of the whole multilayer structure depends not only on the material properties of each layer but also on the properties of the interlayer bonding between the layers. In fact, the interlayer between two layers should guarantee an adequate and durable bond in order to be able to transfer stresses induced by the traffic loads through the layers. In the case of interlayer debonding, this stress transfer is not possible, and the multilayer structure does not act as a composite system anymore. Debonding seriously affects pavement performance and could lead to premature failure even though the properties of the single layers, in terms of stiffness modulus, permanent deformation resistance and fatigue properties, are appropriate. In this sense, the performance of the pavement structures is directly influenced by the interlayer bonding conditions between layers. Hence, the correct evaluation of the properties of bituminous interlayers is a very important issue in pavement engineering.
Several test devices have been proposed to experimentally evaluate the behaviour of bituminous interlayers. To date, interlayer bonding in bituminous pavements is usually assessed by measuring the interlayer shear strength (ISS) of double-layered specimens using static test working with monotonic load/displacement application. Static laboratory tests have developed and standardised (European Pre-Standard prEN 12697 Bituminous mixture – Test methods for hot mix asphalt – Part 48: Interlayer bonding). It worth to underline that these static test devices lead to failure of the specimen following stress paths very different from those occurring in an actual pavement. In fact, the repetitive loading applied by vehicles is
4
considerably lower than the interlayer resistance at the first application measured by a monotonic test.
For this reason, a significant improvement of the current testing approach is the development of dynamic bond testing devices, which better simulate the actual traffic loads. The dynamic/cyclic approach should lead to more reliable performance parameters and help to understand the true bonding at the interlayer in terms of dynamic shear stiffness for better predicting the overall bearing capacity of multilayer pavements. Moreover, also the fatigue resistance at the interlayer could be investigated to start giving a term of comparison with classic fatigue approaches based on tensile stress/strain.
Given this background, the main goal of this PhD thesis was to develop a methodology for the experimental characterisation of the dynamic shear performance of bituminous interlayers. This objective was tackled by the design and construction of new testing equipment able to test bituminous mixtures. The new testing device, then called Cyclic-ASTRA, was designed and constructed in the framework of the strategic research project “Advanced dynamic characterisation of interfaces in multilayer structural systems” coordinated by Prof. Andrea Graziani, Associate Professor in Road, Railway and Airport Engineering at the Department of Civil and Building Engineering and Architecture (DICEA) of Università Politecnica delle Marche.
Moreover, this PhD project was developed in the framework of the Task Group 3 (TG 3), “Pavement multilayer systems” of RILEM Technical Committee (TC) “Phase and Inter-phase behaviour of bituminous Materials” (PIM) coordinated by Università Politecnica delle Marche and in particular by Prof. Francesco Canestrari, Full Professor in Road, Railway and Airport Engineering at the Department of Civil and Building Engineering and Architecture (DICEA) of Università Politecnica delle Marche. The activity of TG3 focused on performance assessment of multilayer bituminous pavements at the structural level. In particular, an advanced experimental methodology based on dynamic shear testing analysis of multilayer structural systems was studied. To this aim, TC 272-PIM/TG3 decided to organise an interlaboratory test aimed at comparing different existing or prototype equipment currently employed to obtain the dynamic shear characterisation of multilayer bituminous systems. It is worth to underline that the project is still ongoing.
Most of the research activities described in this PhD thesis were carried out in the Department of Civil and Building Engineering and Architecture of Università Politecnica delle Marche. Part of the research activities were also carried out in cooperation with the Department of Civil, Construction, and Environmental Engineering of North Carolina State University (Raleigh, USA) and the Laboratoire de Génie Civil, Diagnostic et Durabilité (GC2D) of University of Limoges (Egletons, France) which provided their own equipment and testing protocols to perform dynamic bond tests. The main objectives and activities are briefly summarised in the following section.
1.1 Outline of the dissertation
To achieve the objectives above-mentioned, the research activities have been planned and structured as shown in the scheme of Figure 1.1.
Prior to performing the experimental activities, an extensive literature review was conducted, especially focused on dynamic testing devices and procedure. It allowed assessing the current state-of-the-art on the main existing equipment developed to perform dynamic interlayer bond testing in order to improve the current state of knowledge and give the possibilities for further extend research. Subsequently, the new testing device for performing dynamic bond testing was designed, constructed and checked at Università Politecnica delle Marche. Afterwards, the interlaboratory test on “Dynamic Interlayer Shear Testing” promoted by Task Group 3 “Pavement Multilayer System” of RILEM Technical Committee 272-PIM “Phase and Inter-phase behaviour of bituminous Materials” is presented. Finally, experimental laboratory activities were carried out within the RILEM interlaboratory test by performing dynamic tests using three different devices (Cyclic-ASTRA, Cyclic-MAST, shear-torque fatigue test) respectively at Università Politecnica delle Marche (UNIVPM), at North Carolina State University (NCSU) and at University of Limoges (UNILIM). Additional experimentation was carried out at the University of Limoges with the aim to perform cyclic tests on reinforced specimens cored from a trial section.
This PhD dissertation is composed of several chapters, whose contents deal with the topics above-mentioned.
Figure 1.1. Research program flowchart.
Design and develop dynamic testing equipment
Cyclic-ASTRA
Organisation
RILEM interlaboratory test
Experimental investigation
Cyclic-MAST test
Experimental investigation
Cyclic-ASTRA test
Experimental investigation
shear-torque fatigue test
Trial section w/ and w/o
Chapter 2
Literature review
2.1 Bituminous pavement
Road pavement is a complex system because involves multiple layers of different materials that are subjected to repetitive or fluctuating irregular traffic loads as well as environmental condition variations. The traffic loads on the road pavement include both vertical stresses (normal to the pavement surface), and horizontal stresses (tangent to the pavement surface). A traditional distinction, which is becoming scarcely used in modern times, divides road pavements into flexible and rigid; the essential difference between the two types lies in the way in which they distribute the load on the laying surface. In rigid pavements, due to the high modulus of elasticity of the constituent material, the majority of the stresses are supported by the pavement itself, which in this case is composed of cement concrete or reinforced concrete slabs; for this type of pavement, small variations in the bearing capacity on the laying surface have little influence on the structural behaviour and the state of stress. On the contrary, a flexible pavement, generally consisting of a series of layers of increasing quality towards the surface layer, ensures the distribution of the load to the laying surface through the stratified system rather than absorbing the stresses through bending efforts. Using simple words, a flexible pavement can be defined as a pavement comprising of a mixture of aggregates and bitumen, heated and mixed properly and then laid and compacted on a granular layer. The introduction of a cement-treated base course, which has fairly high stiffness, between the layers of a flexible pavement can result in an overall behaviour which, in a sense, is close to that of a rigid pavement; such pavement is defined as semi-rigid. Figure 2.1 presents an example of the load distribution expected for the rigid and flexible pavement. The rigid pavement usually used in airfield constructions, in industrial areas, or in road pavements subjected to particularly heavy load traffic. Flexible pavements are the most commonly adopted and in the following sections will be referred to only this type of road pavement.
Figure 2.1. Scheme of rigid (left) and flexible (right) pavement.
LOAD
Rigid pavement Flexible pavement
LOAD
Subgrade Subgrade
10
The flexible pavement (Figure 2.2) is usually composed of the following layers: − wearing course;
− binder course; − base course; − subbase course; − subgrade course.
The wearing and the binder courses are composed of a mixture of various selected aggregates bound together with bituminous binders. The wearing course has a higher bitumen content and smaller thickness compared to the binder course. These layers are directly subjected to the vertical and horizontal loads, permanently transferred by traffic, and the abrasive action of vehicle tires. The layer in contact with traffic loads must provide specific characteristics such as friction, smoothness, noise control, rut resistance and drainage. The base course serves as the principal structural component of the flexible pavement and distributes the imposed load to the subbase course. The base layer is usually composed of hot mix asphalt, either with plain bitumen or with modified bitumen. Subbase course has the primary function of structural support. The material requirements for the subbase are not as strict as those for the base course since the subbase is subjected to lower load stresses. The subgrade is the most superficial layer of the soil and has the function of absorbing and distributing the loads, avoiding their concentration in a single point, which is the primary cause of potential local subsidence and cracking.
Normally, materials and thicknesses of flexible pavement layers are selected by the road management agencies taking into account the economic availability, the traffic loads and composition, service life and climatic conditions that the pavement undergoes during its service life. The design depends also on adequate knowledge of material properties (aggregate and bituminous) and interlayer characteristics. Despite the availability of numerous studies on bituminous pavements, there is still a lack of sufficient knowledge about the interlayer mechanical performances.
2.2 Interlayer bonding
2.2.1 Importance of a good interlayer bonding
The interlayer bonding is generated by the interlocking of the aggregate particles at the interface, the friction between the surfaces of the two bituminous layers and the adhesion between the asphalt binder of the two layers. The role of the interlayer bonding is to prevent relative movements between the layers in contact allowing the transfer normal and horizontal stress from the surface to the lower layers of the pavement. The importance of the interlayer bonding has increased significantly in recent years due to the increased loads on roads.
Nowadays, it is widely recognised that interlayer bonding conditions between bituminous layers directly influence the overall pavement performance. Indeed, a proper interlayer bonding is fundamental for transferring normal and shear stresses throughout bituminous layers, providing to the pavement structure the intended load-bearing capacity. On the contrary, in the case of poor bonding, the loads cannot be transferred throw the layers because the pavement can no act as a monolithic structure, and this fact causes a high concentration of load stress on the upper layers (Figure 2.3).
Figure 2.3. Redistribution of stresses in a multilayer system due to the loss of bonding
between the layers (Raab et al., 2009).
Poor bonding between layers has a negative effect on pavement performance especially in braking and turning areas or in steep grades, i.e., in areas where there are high shear stresses (Romanoschi and Metcalf, 2001). The existence of poor interlayer bonding between the upper layers may lead to several distresses, such as slippage cracking, delamination and fatigue cracking (Al Nageim and Al Hakim, 1999; Mohammad et al., 2009; Tozzo et al., 2014a; Uzan et al., 1978) which, in turn, may result in premature pavement failure. Poor interlayer bonding could reduce pavement life to as low as 40% (Romanoschi and Metcalf, 2001). A brief description of these bituminous pavement distress type induced by poor bonding is given below.
12
Slippage cracking is defined as cracking that resembles crescent shapes in the direction of traffic (Figure 2.4). It is produced when braking or turning wheels cause the pavement surface to slide or deform. This distress is a visible indicator of inadequate bonding between wearing and binder layers in bituminous pavements where high horizontal stresses occur. Delamination is an area of pavement surface missing, typically one layer thick (i.e., the thickness of the wearing course), due to the loss of adhesion between the wearing and underlying layers (Figure 2.5). Delamination can propagate more quickly if the water is forced along the interface between two layers by hydrostatic pressures imposed by traffic loads. Fatigue cracking is considered one of the major causes of failure for flexible pavements (Figure 2.6). Fatigue failure is defined as a failure resulting from the repetitive action of traffic loads. But the debonding or loss of bond strength between two bituminous layers may provoke early fatigue cracking reducing the fatigue life of the pavement since the loss of structural integrity accelerate the propagation of cracking (Shahin et al., 1986; Willis and Timm, 2006). West et al. (2005) proved that a 10% decrease in bond strength could result in a 50% reduction in fatigue life. Other study showed that the fatigue life for a fully debonded pavement could decrease drastically and could prompt the need for repairs such as full-depth patches or complete reconstruction (Romanoschi and Metcalf, 2001).
A diagnose of a debonding failure is evident in the case of slippage failure or delamination, but in the case of fatigue cracking, it is not so clear since the cracks generated by a debonding effect could be indistinguishable from other forms of surface cracking generated by other causes (i.e., top-down cracking, bottom-up cracking).
Since the service life of multilayer bituminous pavement strongly depends on the interlayer performance, a correct understanding of the interlayer bonding is necessary to prevent any bond-related problems.
Figure 2.5. Delamination.
Figure 2.6. Fatigue cracking.
2.2.2 Theoretical and modelling investigation on interlayer bonding
Computer-based analysis tools are useful to estimate the stresses and strains of road pavement and predict pavement distresses. Under traffic loading, the road pavement is subjected to a complex stress path. Figure 2.7 shows the distribution of vertical and shear stresses along the pavement depth direction. Unlike vertical stresses, the maximum shear stress value is not at the pavement surface. Using finite element (FE) analysis, Su et al. (2008) showed that shear stress peaks are at around 60 mm below the surface. Analogously, Zou et al. (2013) found out that the maximum shear stress values are between 40 mm and 60 mm below the surface. The values of normal and shear stresses decrease gradually with increasing depth. In particular, the shear stress decreases faster than the vertical stress as the depth increases (Powrie et al., 2007) and, therefore, the ratio of shear stress to the vertical stress decreases
14
with increasing depth. Along the traffic direction in a straight section, during a loading cycle, the vertical stress increases from zero to a peak value and then decreases to zero (Cho et al., 2017a). Whereas, in general, the shear stress changes not only in magnitude but also reverses in direction at the same time, leading to the rotation of principal stress axes (Diakhaté et al., 2006; Ishikawa et al., 2011; Liu and Hao, 2011; Tang et al., 2015). The maximum shear stress can be found at the outer tire edges and the level of shear stress depends mainly on surface layer thickness (i.e., a high level of shear stress is generated for very thin layers) (Akhtarhusein et al., 2004; D’Andrea and Tozzo, 2016; Petit et al., 2009). In correspondence to the shear stress peak, the shear stress value is about equal to the vertical stress (Romanoschi and Metcalf, 2001). D’Andrea and Tozzo (2016) showed that shear stress equals or exceeds the normal stress at about 2 cm beyond the wheel edge. However, stress and deformation conditions change during braking or acceleration of vehicles or in cornering sections. For instance, the level of shear stress is 100% more in a curved road section than in a straight section (Petit et al., 2009). Wang et al. (2018), using BISAR software, showed that the maximum shear stress is located at the front tire during vehicle braking. Contrarily, Cho et al. (2017a), using LVECD software, found out that both maximum normal stress and shear stress occur at the centre of the tire under the braking condition (Figure 2.8).
Figure 2.8. Shear stress distribution in 3D space for thin pavement during braking
condition (Cho et al., 2017a).
It should be pointed out that an accurate stress field simulation is very difficult if not impossible since the situations really experienced in-situ is quite variegated and imponderable (Romanoschi and Metcalf, 2001). In the literature, many investigations are based on linear elastic multilayer models that assume loads acting only in vertical direction on the pavement surface (Al Hakim et al., 2000; Al Hakim, 2002; Al Nageim et al., 1996; Al Nageim and Al Hakim, 1999; Brown and Brunton, 1984; Khweir and Fordyce, 2003; Romanoschi and Metcalf, 2003; Uzan et al., 1978). But since the traffic loads on road pavement include both vertical loads (normal to the pavement surface) and shear loads (tangent to the pavement surface), some modelling efforts were carried out adding horizontal loads to normal loads on the pavement surface. These studies showed that the simultaneous application of normal and horizontal loads generate a stress-strain condition more severe in the pavement (Hachiya and Sato, 1997; Romanoschi and Metcalf, 2001; Romanoschi and Metcalf, 2002; Shahin et al., 1987).
In terms of strain distribution, Romanoschi and Metcalf (2001; 2002) stated that when horizontal load act on the top of the pavement structure, the strains, originated in correspondence of the surface, control the pavement life reducing its service period.
In terms of stress distribution, Hachiya and Sato (1997) showed that the shear stress at the uppermost interface becomes larger if horizontal surface forces are considered, increasing its value when the magnitude of horizontal loads increases. Moreover, it has been shown that an increase in layer thickness reduces the interlayer shear stress also since the interface has been moved down.
16
However, it should be pointed out that multilayer elastic analysis may result in erroneous pavement response calculation and performance prediction. In fact, it is unable to capture and predict several important pavements response and distresses (i.e., top-down cracking and permanent deformation) (Ali et al., 2008; Elseifi et al., 2006; Liao and Sargand, 2010; Wang and Al-Qadi, 2009). Nowadays, the use of three-dimensional (3-D) viscoelastic finite element (FE) pavement model allows to better simulate the behaviour of a real pavement system at the interface. Since they allow to characterise the bituminous pavements as viscoelastic materials and allow to consider dynamic traffic loads. In this regard, Hu et al. (2017) simulated dynamic wheel loading conducted three case scenarios (accelerating, steady rolling, and braking traffic) on the pavement using ABAQUS three-dimensional finite element (3-D FE) modelling (Figure 2.9a). They found out that the maximum shear stress occurs during tire braking, as would be theoretically expected (Figure 2.9b), as well as during turning (e.g., tire inclination angle from 0° to 10°). This suggests that intersections and stop-go sections with braking and stopping vehicles are more subjected to shear stresses. Thus, these areas should be designed with more attention to the shear strength characterisation. The same considerations can be carried out in the landing and braking areas of airports (White, 2016). Using a mechanistic analysis, Horak et al. (2009) showed that shear stress during a severe aircraft braking event can be up to 68% of the vertical stress.
(a) (b)
Figure 2.9. (a) Pavement ABAQUS model and (b) maximum shear stresses for
accelerating, steady rolling, and decelerating (Hu et al., 2017).
To understand the role of the interlayer bonding in a multilayer bituminous system, several computational analysis methods have been carried out. The study conducted by Romain (1968) was, perhaps, one of the first examples of evaluation of the interlayer bonding effect in a bituminous pavement. In order to show the effect of bonding on stresses, strains and deflections, Romain considered full bonded and fully slipped interfaces. Figure 2.10 shows the four-layer structure adopted by Romain (1968) as shown by Uzan et al. (1978). They showed that tensile strain increases at the bottom of the layer close to the interface with poor bonding.
Figure 2.10. Scheme of the four-layer pavement studied by Romain (Uzan et al., 1978).
Ten years later, Uzan et al. (1978) proposed a similar study using a four-layer structure model loaded with a uniform pressure distribution p of radius a (Figure 2.11). The interlayer mechanical behaviour was modelled using the assumption that the interface can be described by elastic theory and considered as a thin material with shear modulus and thickness ℎ. The interlayer shear stress 𝜏, generated by traffic loads, causes a relative shear displacement ∆𝜉 between the two layers. The relationship is expressed as follow:
τ = ∙∆𝜉ℎ = ∙ (2.1)
where represents the shear strain of the thin interface material. From Eq. (2.1), it is possible to obtain Goodman’s constitutive law that describes the interface behaviour in multilayer elastic systems, as follows:
τ = 𝐾 ∙ ∆𝜉 (2.2)
where 𝐾 (equal to /ℎ) represents the shear stiffness expressed in MPa/mm or kPa/mm. The parameter 𝐾 was assumed to be a characteristic value to measure the level of interlayer bonding. Uzan et al. (1978) studied different 𝐾-values for the uppermost interface (from 𝐾 = 0 → perfectly smooth, to 𝐾 = ∞ → perfectly rough) of a three-layer system on soft subbase. They found that the most considerable change in stress and strain values at the bottom of the upper layer occurred when 𝐾 varied between 1 and 102 MPa/mm. Moreover, they showed that when the 𝐾-value increases, the strain approaches the value computed for a perfectly rough interface. This increase in 𝐾-value, and thus in interlayer bonding, produces a decrease in the tensile strain at the bottom of each layer and an inversion in the strain sign at the top of the layers (Figure 2.12). When the full-bond between all the pavement layers is assured, the maximum tensile strain is located at the bottom of the pavement. On the contrary,
18
if one or more interfaces are not completely bonded, as usually happens, high tensile strains rise at the slipping interfaces. At the end, when complete debonding is achieved, the slippage at the interface raises until the layers act independently. For modelling purposes, Al Hakim (2002) identified two limiting values for 𝐾, where 𝐾 below 10-2 MPa/mm represents the perfect slippage condition (complete debonding), and 𝐾 above 102 MPa/mm indicates perfect bonding.
Figure 2.11. Scheme of the pavement studied by Uzan et al. (1978).
Successively, many studies showed that pavement service life decreases when a certain level of debonding occurs at the uppermost interface, both with (Hachiya and Sato, 1997; Jaskula and Rys, 2017; Romanoschi and Metcalf, 2001; Shahin et al., 1987) and without (Al Nageim and Al Hakim, 1999; Brown and Brunton, 1984; Khweir and Fordyce, 2003; Kruntcheva et al., 2005; Shahin et al., 1987) horizontal loads.
Also using 3-D FE models (i.e., viscoelastic layered medium and a moving load), recent studies showed that if the interlayer bonding is inadequate, the strains throughout the pavement may increase significantly and,therefore, negatively impact the pavement service life (Chun et al., 2015; Chupin et al., 2010; Hu and Walubita, 2011; Li et al., 2017; You et al., 2018). As regards stress distribution, Wang and Al-Qadi (2010) showed that debonding between layers significantly increases shear stresses inducing to premature failure.
Based on the literature review, flexible pavements are usually considered as an elastic multilayer and most of the pavement models assume two extreme interlayer conditions: full-bond (i.e., no sliding) or no-bond (i.e., sliding or no friction). It is worth noting that these two conditions are not realistic in the field since there is neither complete slipping between the layers nor is the interlayer shear strength close to the bond strength of the adjacent materials. According to Kim et al. (2011), the interlayer bonding conditions of real pavements appear to be at an intermediate level between full-bond and no-bond condition, that is partial-bond. That is, the interlayer bonding is actually partial-bond and depends on the interlocking strength.
While significant efforts have been carried out on this subject, the real understanding of the interlayer stress time history induced by traffic loading in road pavements is not properly captured. To date, most of the flexible pavement design methods still consider full bonded conditions at the interface between layers and the interlayer bonding is not modelled as a failure mechanism (Diakhaté et al., 2011). It is imperative to incorporate the interlayer bonding failure into pavement design methods for improved accuracy.
2.2.3 Factors affecting interlayer bonding
It is well known that interlayer bonding is related to a large number of factors, such as: − type of materials (e.g., mixture type, binder type, aggregate texture);
− construction characteristics (e.g., tack-coat, compaction/voids, contamination, reinforcement);
− loading/environmental aspects (e.g., traffic speed, temperature, ageing process). All these factors should be taken into account during the design process. The following is an overview of the influence of these factors on the interlayer bonding.
20
Type of materials
One of the most influential factors is the type of materials used for pavement construction. Several studies showed that a correct mix design is crucial to achieving a good interlocking at the interface (Canestrari et al., 2005; Jaskula and Rys, 2017; Mohammad et al., 2011; Raab and Partl, 2004; Raab et al., 2012; Sholar, 2004; West et al., 2005). Also, the type of bitumen of the wearing course can affect the interlayer bonding (Nicholas, 1979; Peattie, 1979).
Several studies showed that also surface roughness and texture are influential factors (Ktari et al., 2016a; Ktari et al., 2017). It was demonstrated that a higher strength is obtained for milled surface (Canestrari et al., 2005; Leng et al., 2009; Mohammad et al., 2008; Recasens et al., 2005; Recasens et al., 2006; Santagata et al., 2009; Tashman et al., 2008). Other studies showed that different conditions of lower layer surface roughness affect interlayer shear resistance (Buchanan and Woods, 2004; Sholar, 2004; West et al., 2005).
Construction characteristics
Several investigations (Carr, 2001; Collop and Thom, 2002; Mirò Recasens et al., 2003; Partl and Raab, 1999; Partl and Raab, 2004) showed that the interlayer shear strength of the uppermost interface is strongly influenced by the air void content of the wearing course. In fact, a well compacted upper bituminous layer leads to higher maximum interlayer shear strength. Santagata et al. (2008) argued that a high air void content (8–9%) leads to having a weak interface, but also with a low air void content (such as 4%) is hard to achieve an adequate interlock between the two layers in contact. As regards the base course, some works (Kennedy, 1978; Peattie, 1979) showed that if the base course is composed of specific type of materials (i.e., wet-mix macadam or dry-bound granular material), laid under particular conditions (i.e., inappropriate moisture content), the pavement structure is more subjected to slippage cracking. The low compaction of the lower layers of the pavement can lead to a low stiffness of the layers themselves. This occurrence could generate a weak zone at the interlayer, that gradually results in a material degradation easily vulnerable to water damage that speeds up the loss of cohesion and thus loss of other material (Al Hakim et al., 2000; Jaskula and Rys, 2017; Khweir and Fordyce, 2003; Nicholas, 1979; Peattie, 1979; Sudyka et al., 2018).
The individual bituminous layers of the flexible pavement are usually connected through a tack coat. Tack coat can include straight run bitumen or bitumen emulsion. Bitumen emulsion can be manufactured from conventional or polymer modified bitumen. The tack coat application increases the interlayer bond strength between two layers since promoting the adhesion between the layers in contact (Canestrari and Santagata, 2005; Jaskula, 2014; Tayebali et al., 2004; West et al., 2005). But, Mohammad et al. (2005) showed that the tack coat increases the interlayer bonding strength at 25 °C but the tack coat had no effect or even negative effect on the bond strength at 55 °C. Besides, the application of modified emulsion significantly increases the interlayer bonding strength compared to a tack coat of unmodified
emulsion (Augustin, 1997; Canestrari et al., 2005; Hachiya and Sato, 1997; Mirò Recasens et al., 2003; Mirò Recasens et al., 2005; Rabiot and Morizur, 1996; Struthers and Richardson, 2002) and non-tack-coated interfaces (Augustin, 1997; Canestrari et al., 2005; Struthers and Richardson, 2002). It should be also underlined that the tack coat application rate influences the level of bond strength that could be achieved. A high rate could weaker bond, thus the application rate to apply has to be optimised in order to achieve the optimum bond strength (Buchanan and Woods, 2004; Jaskula and Rys, 2017; Kruntcheva et al., 2006; Leng et al., 2008a; Uzan et al., 1978; West et al, 2005). For instance, the British standard BS 594-2 (2002) provide a tack coat application rate as a function of the bitumen content of the asphalt layers for both new construction and existing pavement. Mohammad et al. (2011) found that the influence of tack coat type and application rate became more relevant in thin pavements and less dominant in thick pavement structures. Bitumen emulsion curing time is another factor that should be taken into consideration (Chen and Huang, 2010; Destrée et al., 2016; Hachiya and Sato, 1997; Hasiba, 2012).
It should be borne in mind that the surface conditions of the underlying layer are also very important because they influence the interface bonding strength. Presence of water and dirt on the existing surface generally resulted in lower shear strength. Thus, it is recommended to apply tack coat on a clean, dry and well-compacted underlying layer.
Several studies showed that the introduction of geosynthetic at the interface usually reduces the interlayer shear resistance (Canestrari et al., 2006; Ferrotti et al., 2011; Pasquini et al., 2013; Ragni et al., 2020).
Nowadays, many researchers are still studying in the laboratory as the application rate of the tack coat affects pavement performance. The issue related to laboratory study is that the various conditions occurring in-situ are difficult to take in concern (humidity rain, wind, contaminated of the interface). Besides, Jaskula (2014) found out that interlayer bond strength between bituminous layers also depends on the laboratory compaction technique, as well as the compaction effort. The highest bond strengths were obtained for gyratory compaction and the lowest ones for compaction with a static roller.
Loading/environmental aspects
Laboratory studies that varied the normal pressure applied to a sample (Uzan et al., 1978; West et al., 2005) have all concluded that as normal pressure increases the interlayer bond strength increases. This implies that although a heavier load is more likely to produce higher horizontal stresses making slippage failure more likely, it is also likely to provide higher normal stress, which increases resistance to slippage failure.
As it is well known, the temperature is also an important influence parameter. The increased or decreased temperature would change the characteristic of asphalt concrete as well as interlayer bonding. Laboratory studies (Canestrari and Santagata, 2005; Deysarkar and Tandon, 2005; Leng et al., 2009; Sholar, 2004; West et al., 2005) showed that increasing the temperature leads to decrease on the interlayer shear strength for any interface treatment