DISA W
OR
KING
P
APER
DISA
Dipartimento di Informatica
e Studi Aziendali
2008/10
E-inclusion in Finland and Italy
in the light of statistical data
Franck Tétard, Nicola Villa, Joanna Carlsson,
Milena Casagranda, Erkki Patokorpi, Sara Tomasini
DISA
Dipartimento di Informatica
e Studi Aziendali
A bank covenants pricing model
Flavio Bazzana
DISA W
OR
KING
P
APER
2008/10
E-inclusion in Finland and Italy
in the light of statistical data
Franck Tétard, Nicola Villa, Joanna Carlsson,
Milena Casagranda, Erkki Patokorpi, Sara Tomasini
DISA Working Papers
The series of DISA Working Papers is published by the Department of Computer and Management Sciences (Dipartimento di Informatica e Studi Aziendali DISA) of the University of Trento, Italy.
Editor
Ricardo Alberto MARQUES PEREIRA ricalb.marper@unitn.it
Managing editor
Roberto GABRIELE roberto.gabriele@unitn.it
Associate editors
Flavio BAZZANA fl avio.bazzana@unitn.it Finance
Michele BERTONI michele.bertoni@unitn.it Financial and management accounting Pier Franco CAMUSSONE pierfranco.camussone@unitn.it Management information systems Luigi COLAZZO luigi.colazzo@unitn.it Computer Science
Michele FEDRIZZI michele.fedrizzi@unitn.it Mathematics Andrea FRANCESCONI andrea.francesconi@unitn.it Public Management Loris GAIO loris.gaio@unitn.it Business Economics
Umberto MARTINI umberto.martini@unitn.it Tourism management and marketing Pier Luigi NOVI INVERARDI pierluigi.noviinverardi@unitn.it Statistics
Marco ZAMARIAN marco.zamarian@unitn.it Organization theory
Technical offi cer
Paolo FURLANI paolo.furlani@unitn.it
Guidelines for authors
Papers may be written in English or Italian but authors should provide title, abstract, and keywords in both languages. Manuscripts should be submitted (in pdf format) by the corresponding author to the appropriate Associate Editor, who will ask a member of DISA for a short written review within two weeks. The revised version of the manuscript, together with the author's response to the reviewer, should again be sent to the Associate Editor for his consideration. Finally the Associate Editor sends all the material (original and fi nal version, review and response, plus his own recommendation) to the Editor, who authorizes the publication and assigns it a serial number.
The Managing Editor and the Technical Offi cer ensure that all published papers are uploaded in the international RepEc public-action database. On the other hand, it is up to the corresponding author to make direct contact with the Departmental Secretary regarding the offprint order and the research fund which it should refer to.
Ricardo Alberto MARQUES PEREIRA
Dipartimento di Informatica e Studi Aziendali Università degli Studi di Trento
Via Inama 5, TN 38100 Trento ITALIA
Tel +39-0461-882147 Fax +39-0461-882124 E-mail: ricalb.marper@unitn.it
E-inclusion in Finland and Italy in the light of statistical data
Franck Tétard
1, Nicola Villa
2,
Joanna Carlsson
1, Milena Casagranda
2, Erkki Patokorpi
1,
Sara Tomasini
21
IAMSR – Institute for Advanced Management System Research Åbo Akademi University, Joukahainengatan 3-5 A, Åbo (Finland)
{ftetard, jcarlsso, erkki.patokorpi}@abo.fi
2
Laboratory of Maieutics
University of Trento, via Inama 5, Trento (Italy) email: {milena.casagranda, sara.tomasini, nicola.villa}@unitn.it
Abstract: When young people drop out of school they are in great danger of being
marginalized in society. Immigrants are another group of people who for several reasons often find it difficult to become integrated into their new home country. In both cases some less formal way of learning might help these groups avoid social exclusion. Well thought-out development and application of new advanced technologies would be likely to level the way for continued education, communication and democratic participation in society. The term e-inclusion refers to these electronic means and how they could be applied to hindering social exclusion. This study compares the situation of school drop-outs and immigrants in Finland and Italy in the light of statistical data. It paves the way for a European research and development project whose aim is to study problems of e-inclusion in Finland and Italy empirically as well as develop technological and pedagogical solutions to them.
Keywords: mobile learning, e-inclusion, disadvantage groups, immigrants, drop outs
1. Introduction
The objective of this report is to present and compare statistical data about two focus groups (school drop-outs and young immigrants) in the South-western region of Finland (Varsinais-Suomi) and the region of Trentino in Italy. The report also presents a preliminary understanding of the motivations and problems encountered by these groups in terms of inclusion in society. This report is part of the first step of a research programme focusing on finding solutions to problems of e-inclusion.
The project, which will take place in cooperation between the University of Trento (Italy) - Faculty of Economics and the Åbo Akademi of Turku (Finland) - IAMSR, aims to understand the informative and training needs of the two groups; the final objective is to develop a series of services available through mobile applications.
In particular, the Faculty of Economics of the University of Trento in cooperation with the Laboratory of
Maieutics some years ago has developed an e-learning application, named On Line Communities. The
core of the application is composed by some abstract entities, i.e., Virtual Communities as aggregation of People to which some communication services are available in order to obtain certain objectives. On Line Communities had been experienced with a limited number of users since 2003, and was finally released early in 2005; At present the system has more than 1400 active communities, 8500 users and about 1.5 million unique accesses since November 2005. In this moment the platform is in a complete reengineering, and soon will be able to offer a series of new mobile services accessible through mobile applications (cellular phone, PDA, etc.); the project is developed in collaboration with the IAMSR center of Turku, and it will finish at the end of 2008.
First of all we will carry out a series of interviews with the aim to understand the needs of the groups involved in the exploratory research. Secondly we will start a further study according to the results we
will obtain from the first qualitative research. This study will be design to explore the possibility of making an intervention with the use of mobile services and it will eventually extends to a more significant group of people using a quantitative tool.
The work is structured as follows; in the first part we will introduce the first focus group and the most significant data of Trentino and Varsinais-Suomi, making a comparison between the two different situations. In the second part we will consider the second focus group, the young immigrants, through the scheme already described in the previous section.
1.1 Method and data collection
The report presents statistical data about the two focus groups in Finland and in Italy: in particular, data about the regions of Varsinais-Suomi and Trentino are presented and compared. Data about the focus groups in Finland have been gathered mainly from Statistics Finland (www.stat.fi). Data about the focus groups in Italy have been gathered from the website of Autonomous Province of Trento.
2. School drop-outs
2.1 School drop-outs in Finland
The Finnish education system is depicted schematically below (Figure 1):
Figure 1. The Finnish education system
Compulsory schooling covers the so-called comprehensive school, where the pupils are 7-15 years old. In Finland, the general attitude is to want to continue studying after comprehensive school; only 2.8% of 15-year olds do not want to pursue further studies (OECD preliminary statistics 2007, in Ministry of Education, 2007). According to the Finnish Ministry of Education report (2007, p. 2), in 2005, 63 417 students obtained the comprehensive school leaving certificate and 353 students failed to complete the comprehensive school (0.56%). Approximately 3000 young people per year are left outside of the public education system in Finland. What are these people doing? Some will start working or attend folk high school or have a sabbatical, etc. The number of drop-outs from the comprehensive school is thus less than
one percent. And even the students continuing their studies in the upper secondary school have a high likelihood of finishing their studies; approximately 90% of all upper secondary school students are likely to graduate. The situation in vocational education is somewhat worse; approximately 70% of all vocational education students are likely to receive their qualifications. In other words, more than every fourth vocational education student will discontinue their studies (Ministry of Education, 2007).
The statistics below [1] presents the main activities of 15-24-year olds in absolute numbers.
Table 1. Main activity of 15-24 years old at the end of year 2005
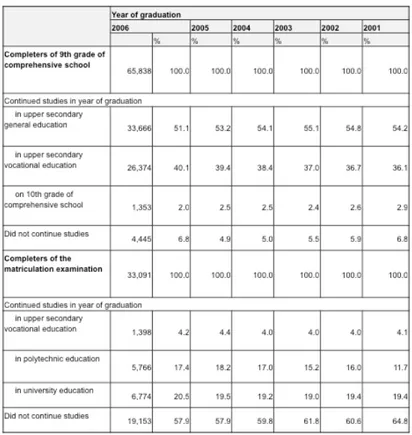
According to Statistics Finland [2], 93,2% of completers of 9th grade of comprehensive school and 42% of passers of matriculation examination in 2006 continued their studies in the same year. Completers of comprehensive school numbered roughly 65,800, which is a good 2 000 up from the year before. One-half of them (60% of women and 43% of men) went on to study in upper secondary general school. 40% (31% of women and 49% of men) went on to attend upper secondary level vocational education while 2% went on to the 10th grade. Vocational education has grown more popular in recent years while upper secondary general school education has lost some of its popularity. 7% of the completers of comprehensive school did not continue studying. The proportion of those who remained outside further studies grew by two percentage points from the year before.
Table 2. Completers of curriculum-based education
According to Statistics Finland [3], completers of curriculum-based vocational education (see Table 2) provided by educational institutions numbered 31 100 in 2006. The number was 0.5% lower than in the previous year. 52% of the qualifiers were men. The largest number, or 39%, of the qualifications were attained in the field of technology and transport. The next largest numbers were attained in the fields of welfare, health and physical exercise (15%) tourism, catering and economics (14%) and business economics and administration (11%). The shares of other fields of education were below 10%.
According to Statistics Finland [4], the number of students in curriculum-based vocational education provided by educational institutions was 125 700 in 2006. New students numbered 49 000. The numbers of both students and new students were one per cent higher than one year previously. 54% of students were men. A total of two thirds of the students were studying in the fields of technology and transport (41%), welfare and health (14%) and tourism, catering and economics (13%).
According to Statistics Finland [5], 54 900 students attended apprenticeship training leading to a qualification during the calendar year 2006. The number of students was 6% up from the previous year. 40% of the students attended training for an initial vocational qualification, 34% for a further vocational qualification and 26% for specialist vocational qualification. The shares of men and women among the students were almost equal. New students numbered 21 800. Of the students, 11 000 completed an entire qualification. Of the completed qualifications, 30% were initial vocational qualifications, 39% were further vocational qualifications and 31% specialist vocational qualifications. 55% of the completers of a qualification were women.
The figure below shows the drop-out rate in upper secondary general education, vocational, polytechnic and university education from 2000 to 2006. While drop-out rate has decreased in vocational education, there has been an increase in drop-out rates in all other types of education for the recent years.
Figure 2: Discontinuation of education in upper secondary general, vocational, polytechnic and
university education in the academic years from 2000/2001 to 2006/2005
Special education in comprehensive schools has also increased steadily over the last 12 years (see Figure 2). While students at comprehensive school are not the focus of our research, it is interesting to note that pupils in need of special education today are potential drop-outs tomorrow. It is of course a good thing that problems are tackled as early as in the comprehensive school, but it should also be a concern because of the increasing trend.
Figure 3: Shares of pupils (in percentage) transferred to special education and receiving part-time special
2.2 School drop-outs in Italy
Figure 4: The Italian education system
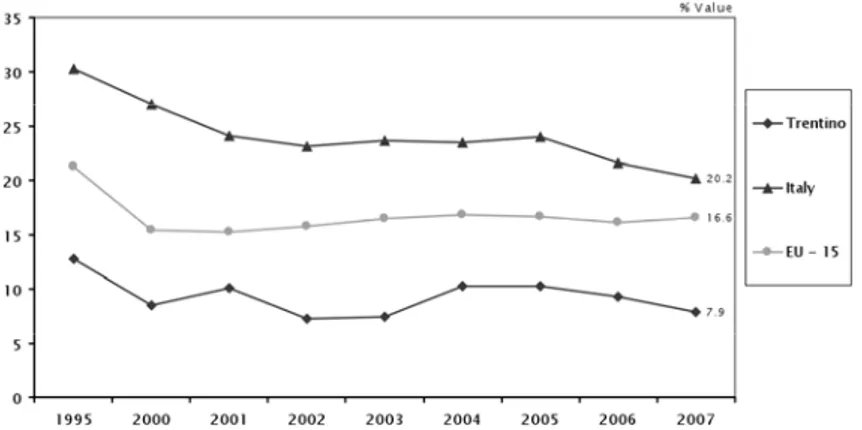
Figure 5: School rates for students between 14-18
As figure 5 shows, the school rate level in the Trentino region is quite high (above the EU and Italy level). This number has been steady since 2004/2005. The drop-out rate of underaged students in the Trentino region is 2.6% (youth between 14 and 18) [6].
According to our data, 92% of students conclude the school cycle, but the internal path is not linear; and the most critical point is in the first year of high school: 12.4% fail, and part of the students decides to move to vocational school. Every year there are about 500 young people that leave school in the Trentino region; they are without a degree and have a high risk of being socially marginalized.
Figure 6 and 7 show a comparison of unemployment figures between Italy and the region of Trentino. The data indicate that the unemployment of young people is low, compared to the national level (and to the EU-level). Our sources also indicate that the youth unemployment index in Trentino is not structural: it is not connected to the difficulty to find a job, but is related to temporary work contracts (% higher than the national average) [7]. Looking for a first job (or a new job) takes in average less than one month [8]
5.6 26.6 0 5 10 15 20 25 30 35 1995 2000 2001 2002 2003 2004 2005 2006 2007 % Value Trentino Italy
Figure 6: people looking for first job (based on the workforce aged 15-24)
Figure 7: Youth unemployment rate (15-24 years old)
2.3 Comparison
In 2005, approximately 14 000 youngsters in Finland had not continued their studies after comprehensive school and their current activities were unknown. In 2006, 93% of completers of 9th grade of
comprehensive school in Finland continued their studies, the corresponding figure for Italy is also 92.6%.
In the academic year 2005/2006, 6% of students in Finland attending education leading to a qualification or degree discontinued their studies (In Trentino the percentage is 2.6%). In 2006, 7% of completers of the 9th grade at comprehensive school in Finland did not continue their studies. The need for special education (in Finland) has increased every year; boys outnumber girls in difficulties (in Trentino 458 boys and 176 girls).
3. Immigrants
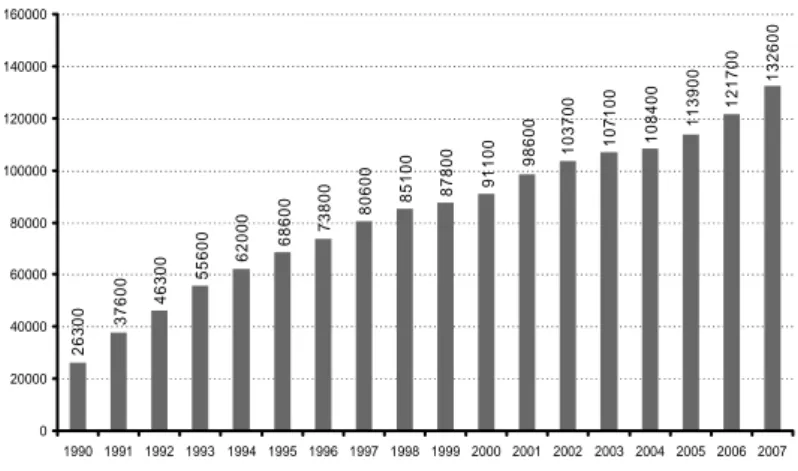
3.1 Immigrants in Finland
132600 121700 113900 108400 107100 103700 98600 91100 87800 85100 80600 73800 68600 62000 55600 46300 37600 26300 0 20000 40000 60000 80000 100000 120000 140000 160000 1990 1991 1992 1993 1994 1995 1996 1997 1998 1999 2000 2001 2002 2003 2004 2005 2006 2007
Figure 8: Foreign Citizens in Finland 1990–2007
The main groups of foreign citizens in Finland are Russians and Estonians. The same groups are largely represented in the Varsinais-Suomi region, even for the category of 15-24 years old (see Figures 9, 10 and 11 below). 26200 20000 8400 4800 3900 3500 3300 3200 3200 3000 0 5000 10000 15000 20000 25000 30000
Russia Estonia Sweden Somalia China Thailand Germany Turkey United Kingdom
Iraq
Figure 9: Foreign Citizens in Finland (the top ten in 2007)
Figure 11. Younger immigrants (15-24 years old) in the Varsinais-Suomi region
3.2 Immigrants in Italy
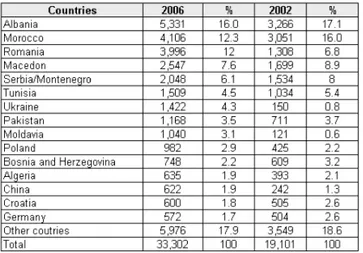
The estimated number of immigrants in the Trentino region is 33 000, representing about 6.6% of the total population. These immigrants are from Albania (16% of total immigrants), Morocco (12.3%), Romania (12%) (see Figure 11). Young people under 18 represent ¼ of immigrants (24,9%, see Figure 12). Second generation and “generation 1.5” represent one third of immigrants (in some groups of immigrants) [9].
Table 3: Immigrant residents in Trentino.
Table 4: Immigrants in Trentino by age group
Table 5: Immigrants by age group and nationality
3.3 Comparison
The total number of immigrants in the Varsinais-Suomi region is 12 292 (2.7% of total population), they are 33 000 in the Trentino region (6.6% of the total population).
Immigrants in Finland are from Russia, Estonia, Balkan, Sweden, and Iran, mainly; in Trentino, Albania, Marocco, and Romania.
The share of young immigrants (under 18-19) in the Varsinais-Suomi region is 6.4 %; in Trentino, it is 25 %.
Conclusion and the next steps
The work was concentrated on a comparative analysis between two focus groups, the drop outs and the young immigrants, in the context of Trentino and Varsinais‐Suomi regions.
The next steps, that will be conducted by the two working groups (Italian and Finnish), will be: • Develop a interview’s track to investigate the training and informational needs of two groups; • Interviews twenty individuals for each focus group (drop outs and young immigrants);
• Analyze the collected data, making a comparison between the results collected in Italy and Finland.
References
[1] Statistics Finland (2007a). Tilastoista syrjätyneitä nuoria on noin 14 000. Tieto ja trendit
2/2007. Retrieved on April 29, 2008 from
http://www.tilastokeskus.fi/artikkelit/2007/art_2007-11-07_002.html
[2] Statistics Finland (2007b). Ninety-three per cent of completers of 9th grade of comprehensive
school and 42 per cent of passers of matriculation examination in 2006 continued studies in the same year. Retrieved on April 29, 2008 from
http://www.tilastokeskus.fi/til/khak/2006/khak_2006_2008-01-17_tie_001_en.html
[3] Statistics Finland (2007c). Completers of curriculum-based basic vocational education
numbered 31,100 in 2006 . Retrieved on April 29, 2008 from
http://www.tilastokeskus.fi/til/aop/2006/aop_2006_2007-08-29_tie_002_en.html
[4] Statistics Finland (2007d). Students in curriculum-based basic vocational education numbered
125,700 in 2006. Retrieved on April 29, 2008 from
http://www.tilastokeskus.fi/til/aop/2006/aop_2006_2007-06-15_tie_001_en.html
[5] Statistics Finland (2007e). Students in apprenticeship training number 54,600 in 2006. Retrieved on April 29, 2008 from http://www.tilastokeskus.fi/til/aop/2006/aop_2006_2007-11-01_tie_004_en.html
[6] Iprase (2007). Giovani in Trentino 2007 Analisi e letture della condizione giovanile, V.
[7] Statistics from Autonomous Province of Trento (2006), Osservatorio permanente per
l’economia, il lavoro e per la valutazione della domanda sociale su dati “Indagine sulla disoccupazione giovanile in Trentino 2006. Retrieved on September 8, 2008 from
http://www.osservatoriodeltrentino.it/pubblicazioni-eventi/index.dhtml?y=2006
[8] Statistics from Autonomous Province of Trento (2008), Osservatorio permanente per
l’economia, il lavoro e per la valutazione della domanda sociale su dati, Retrieved on
September 8, 2008 from http://www.osservatoriodeltrentino.it/indicatori/
[9] Statistics from Autonomous Province of Trento (2007), L’immigrazione in Trentino, M.
Ambrosini, P. Boccagni, S. Piovesan, Retrieved on September 8, 2008 from http://www.cinformi.it/news/112007/05rap1.htm