A comparative risk assessment of burden of disease and injury
attributable to 67 risk factors and risk factor clusters in 21
regions, 1990–2010: a systematic analysis for the Global Burden
of Disease Study 2010
A full list of authors and affiliations appears at the end of the article.
Summary
Background—Quantification of the disease burden caused by different risks informs prevention by providing an account of health loss different to that provided by a disease-by-disease analysis. No complete revision of global disease burden caused by risk factors has been done since a comparative risk assessment in 2000, and no previous analysis has assessed changes in burden attributable to risk factors over time.
Methods—We estimated deaths and disability-adjusted life years (DALYs; sum of years lived with disability [YLD] and years of life lost [YLL]) attributable to the independent effects of 67 risk factors and clusters of risk factors for 21 regions in 1990 and 2010. We estimated exposure distributions for each year, region, sex, and age group, and relative risks per unit of exposure by systematically reviewing and synthesising published and unpublished data. We used these estimates, together with estimates of cause-specific deaths and DALYs from the Global Burden of Disease Study 2010, to calculate the burden attributable to each risk factor exposure compared with the theoretical-minimum-risk exposure. We incorporated uncertainty in disease burden, relative risks, and exposures into our estimates of attributable burden.
Findings—In 2010, the three leading risk factors for global disease burden were high blood pressure (7·0% [95% uncertainty interval 6·2–7·7] of global DALYs), tobacco smoking including second-hand smoke (6·3% [5·5–7·0]), and alcohol use (5·5% [5·0–5·9]). In 1990, the leading risks were childhood underweight (7·9% [6·8–9·4]), household air pollution from solid fuels (HAP; 7·0% [5·6–8·3]), and tobacco smoking including second-hand smoke (6·1% [5·4–6·8]). Dietary risk factors and physical inactivity collectively accounted for 10·0% (95% UI 9·2–10·8) of global DALYs in 2010, with the most prominent dietary risks being diets low in fruits and those high in sodium. Several risks that primarily affect childhood communicable diseases, including
unimproved water and sanitation and childhood micronutrient deficiencies, fell in rank between
‡Correspondence to: Dr Stephen S Lim, Institute for, Health Metrics and Evaluation, 2301 Fifth Ave, Suite 600, Seattle, WA 98121,
USA, [email protected]. *Author listed alphabetically †Joint senior authors Contributors
CJLM, SSL, and ME wrote the first draft. SSL, TV, AF, GD, KS, ADL, CJLM, and ME revised the report. ME, CJLM, and ADL designed the study and provided overall guidance. SSL, EC, GF, CA, ESa, KA, REE, and LCR did comparative analyses of risk
NIH Public Access
Author Manuscript
Lancet. Author manuscript; available in PMC 2014 September 05.
Published in final edited form as:
Lancet. 2012 December 15; 380(9859): 2224–2260. doi:10.1016/S0140-6736(12)61766-8.
NIH-PA Author Manuscript
NIH-PA Author Manuscript
1990 and 2010, with unimproved water we and sanitation accounting for 0·9% (0·4–1·6) of global DALYs in 2010. However, in most of sub-Saharan Africa childhood underweight, HAP, and non-exclusive and discontinued breastfeeding were the leading risks in 2010, while HAP was the leading risk in south Asia. The leading risk factor in Eastern Europe, most of Latin America, and southern sub-Saharan Africa in 2010 was alcohol use; in most of Asia, North Africa and Middle East, and central Europe it was high blood pressure. Despite declines, tobacco smoking including second-hand smoke remained the leading risk in high-income north America and western Europe. High body-mass index has increased globally and it is the leading risk in Australasia and southern Latin America, and also ranks high in other high-income regions, North Africa and Middle East, and Oceania.
Interpretation—Worldwide, the contribution of different risk factors to disease burden has changed substantially, with a shift away from risks for communicable diseases in children towards those for non-communicable diseases in adults. These changes are related to the ageing
population, decreased mortality among children younger than 5 years, changes in cause-of-death composition, and changes in risk factor exposures. New evidence has led to changes in the magnitude of key risks including unimproved water and sanitation, vitamin A and zinc deficiencies, and ambient particulate matter pollution. The extent to which the epidemiological shift has occurred and what the leading risks currently are varies greatly across regions. In much of sub-Saharan Africa, the leading risks are still those associated with poverty and those that affect children.
Funding—Bill & Melinda Gates Foundation.
Introduction
Measurement of the burden of diseases and injuries is a crucial input into health policy. Equally as important, is a comparative assessment of the contribution of potentially modifiable risk factors for these diseases and injuries. The attribution of disease burden to various risk factors provides a different account compared with disease-by-disease analysis of the key drivers of patterns and trends in health. It is essential for informing prevention of disease and injury.
Understanding the contribution of risk factors to disease burden has motivated several comparative studies in the past few decades. The seminal work of Doll and Peto1 provided a comparative assessment of the importance of different exposures, particularly tobacco smoking, in causing cancer. Peto and colleagues2 subsequently estimated the effects of tobacco smoking on mortality in developed countries since 1950. Although these risk factor-specific or cause-factor-specific analyses are useful for policy, a more comprehensive global assessment of burden of disease attributable to risk factors can strengthen the basis for action to reduce disease burden and promote health. The Global Burden of Disease Study (GBD) 1990 provided the first global and regional comparative assessment of mortality and disability adjusted life-years (DALYs) attributable to ten major risk factors.3 However, different epidemiological traditions for different risks limited the comparability of the results. Subsequently, Murray and Lopez4 proposed a framework for global comparative risk assessment, which laid the basis for assessment of 26 risks in 2000.5–7 Since this work, WHO has provided estimates for some risks by the same methods but with updated
NIH-PA Author Manuscript
NIH-PA Author Manuscript
exposures and some updates of the effect sizes for each risk.8 Analyses have also been done for specific clusters of diseases, like cancers,9 or clusters of risk factors, like maternal and child under-nutrition.10 National comparative risk assessments (including in Australia, Iran, Japan, Mexico, South Africa, Thailand, USA, and Vietnam) have also been undertaken with similar approaches.11–16
GBD 2010 provides an opportunity to re-assess the evidence for exposure and effect sizes of risks for a broad set of risk factors by use of a common framework and methods.
Particularly, since this work was done in parallel with a complete re-assessment of the burden of diseases and injuries in 1990 and 2010, for the first time changes in burden of disease attributable to different risk factors can be analysed over time with comparable methods. Since uncertainty has been estimated for each disease or injury outcome,17,18 the comparative risk assessment for GBD 2010 has also enabled us to incorporate uncertainty into the final estimates. We describe the general approach and high-level findings for comparison of the importance of 67 risk factors and clusters of risk factors, globally and for 21 regions of the world, over the past two decades.
Methods
OverviewThe basic approach for the GBD 2010 comparative risk assessment is to calculate the proportion of deaths or disease burden caused by specific risk factors—eg, ischaemic heart disease caused by increased blood pressure—holding other independent factors unchanged. These calculations were done for 20 age groups, both sexes, and 187 countries and for 1990, 2005 (results for 2005 not shown, available from authors on request), and 2010. We present aggregated results for 21 regions.
Table 1 shows the included risk factors and their organisation into a hierarchy with three levels. Level 1 risks are clusters of risk factors that are related by mechanism, biology, or potential policy intervention. Most risks are presented at level 2. For occupational
carcinogens, a third level is included to provide additional detail about specific carcinogens. For suboptimal breastfeeding we also include a third level to distinguish between
nonexclusive breastfeeding during the first 6 months and discontinued breastfeeding from 6 to 23 months.
We calculated burden attributable to all (67) risk factors and clusters of risk factors except for physiological risks and air pollution. These two clusters present analytical challenges for computation of the aggregate burden. For example, the effects of high body-mass index are partly mediated through high blood pressure, high total cholesterol, and high fasting plasma glucose, and household air pollution from solid fuels (wood, crop, residues, animal dung, charcoal, and coal) contributes to ambient particulate matter pollution.
We ranked results for 43 risk factors and clusters of risk factors, grouping together occupational carcinogens, non-exclusive and discontinued breastfeeding, and tobacco smoking with second-hand smoke on the basis of common exposure sources.
NIH-PA Author Manuscript
NIH-PA Author Manuscript
Our estimation of disease burden attributable to a risk factor had five steps: 1) selection of risk–outcome pairs to be included in the analysis based on criteria about causal associations; 2) estimation of distributions of exposure to each risk factor in the population; 3) estimation of etiological effect sizes, often relative risk per unit of exposure for each risk–outcome pair; 4) choice of an alternative (counterfactual) exposure distribution to which the current exposure distribution is compared. We selected an optimum exposure distribution, termed the theoretical-minimum-risk exposure distribution for this purpose; and 5) computation of burden attributable to each risk factor, including uncertainty from all sources. Further details about the data and methods used for specific risk factors are available on request.
Selection of risk–outcome pairs
The inclusion criteria for each risk–outcome pair that we applied were: 1) the likely importance of a risk factor to disease burden or policy based on previous work; 2)
availability of sufficient data and methods to enable estimation of exposure distributions by country for at least one of the study periods (1990 and 2010); 3) sufficient evidence for causal effects based on high-quality epidemiological studies in which the findings were unlikely to be caused by bias or chance, analogous to the criteria used for assessment of carcinogens with con vincing or probable evidence (panel). Sufficient data to estimate outcome-specific etiological effect sizes per unit of exposure were also needed; and 4) evidence to support generalisability of effect sizes to populations other than those included in the available epidemiological studies or satisfactory models for extrapolating them. Table 1 shows the risk–outcome pairs that were included in the final analysis, on the basis of these criteria.
Distribution of exposure to each risk factor
For most risk factors, a systematic search was done to identify published and, when possible, unpublished data sources to estimate risk factor exposure distributions in 1990 and 2010. Strategies to identify data sources included searching survey databases such as the WHO Global Database on Child Growth and Malnutrition, searching general citation databases such as Google Scholar and PubMed, manual searching of reference lists of articles and conference abstracts, and contacting experts in the relevant fields. Data sources included censuses, health examination and nutrition surveys, and community-based epidemiological studies.
Because data for risk factor exposure are often incomplete or missing for many populations, models were used to generate a complete set of current exposure distributions for risk factors for each country and for both years, including uncertainty. Table 1 shows for each risk factor the main sources of data and the modelling approach used for estimation of present risk factor exposure distributions. Briefly, risk factor models were designed to use available data and information for exposures in countries, for several years, and for different age groups to generate estimates for all countries, for both years, and for all relevant age groups. Estimation of exposure was done with statistical models that used predictors such as time, geography, and other variables that were relevant to the exposure of interest— eg, income per person.
NIH-PA Author Manuscript
NIH-PA Author Manuscript
For each risk factor, we tested a wide array of covariates for prediction of exposure distributions, drawing from covariates included in databases created or collated at the Institute for Health Metrics and Evaluation for GBD 2010. If relevant, the model also included age. Finally, each analysis accounted for important study characteristics such as national versus subnational representativeness, and the measures and instruments used for measuring exposure.
In addition to this general approach, specific methods were used for some risk factors. For tobacco including second-hand smoke, much scientific literature exists about alternative methods to estimate cumulative exposure, based on the premise that present prevalence and consumption data do not take into account likely variations in duration and intensity of smoking. In this case, we used the method of Peto and Lopez,2 which uses lung cancer mortality as a marker (ie, smoking impact ratio) of cumulative population exposure to smoking for cancers and chronic respiratory disease. We used epidemiological data to estimate lung cancer mortality in non-smokers separately for China, other countries in the high-income Asia Pacific region, and all remaining countries.119,120 For all other outcomes, we used 10-year lagged tobacco smoking prevalence. We also applied an approach
analogous to the smoking impact ratio for occupational exposure to asbestos, for which we used mesothelioma mortality, separately estimated, as a marker of asbestos exposure. For ambient particulate matter pollution, two complete, high resolution estimates exist of the concentration of particulate matter smaller than 2·5 µm in aerodynamic diameter (PM2·5) in ambient air: TM5 estimates—based on a nested three-dimensional global atmospheric chemistry transport model—which simulates both particulate matter and ozone at a high spatial resolution;22,23,121 and satellite-based estimates, which are based on satellite observations of aerosol optical depth, a measure of light extinction by aerosols in the total atmospheric column.25 TM5 and satellite-based estimates of PM2·5, measured in µg/m3, were averaged at a 0·1° × 0·1° grid cell resolution (equivalent to roughly 11 km × 11 km at the equator) and linked to available measures of PM2·5 from ground-based monitors. We used a regression model with the average of TM5 and satellite-based estimates as the predictor to estimate ground-based PM2·5 for all grid cells.26 For ozone, we relied solely on the TM5 model.
Few population-based surveys have measured zinc deficiency based on serum zinc concentration;122 however, intervention trials show a benefit of zinc supplementation for reduction of diarrhoea and lower respiratory infections in populations that have high zinc deficiency.10 Because of the paucity of data for serum zinc concentrations, we measured zinc deficiency at the population level on the basis of dietary sources of zinc, expanding on previous work of the International Zinc Nutrition Consultative Group.123 This approach uses national food balance sheets produced by the UN Food and Agriculture Organization to estimate a country-specific mean fractional absorption of zinc. The estimated mean daily per person amount of absorbable zinc in the food supply was compared with the mean
physiological requirements of the population to calculate the percentage of the population with inadequate zinc intake.
NIH-PA Author Manuscript
NIH-PA Author Manuscript
Effects of risk factors on disease outcomes
Table 1 shows the sources of effect sizes per unit of exposure for each risk factor. Some effect sizes were based on meta-analyses of epidemiological studies. For several risk factors without recent systematic reviews or for which evidence had not recently been synthesised, new meta-analyses were done as part of GBD 2010. We used effect sizes that had been adjusted for measured confounders but not for factors along the causal pathway. For example, effect sizes for body-mass index were not adjusted for blood pressure. For some risk–outcome pairs, evidence is only available for the relative risk (RR) of morbidity or mortality. In these cases, we assumed that the reported RR would apply equally to morbidity or mortality, unless evidence suggested a differential effect. For example, studies of ambient particulate matter pollution suggest a smaller effect on incidence of cardio vascular and respiratory disease than on mortality;124–126 the published work on consumption of seafood omega-3 fatty acids suggests an effect on ischaemic heart disease mortality but not on incidence of ischaemic heart disease.90
Evidence for the RR of diarrhoea from unimproved water and sanitation is complicated by the complexity of available epidemiological studies, since the comparison groups varied greatly between studies. The comparison group used varied widely. For example, some studies compare an improved water source (eg, piped water) with an unimproved water source (eg, river water); in other studies the comparison is between two different types of improved water source (eg, piped water vs a protected well). Furthermore, studies often examine a combination of water, sanitation, and hygiene interventions. Previous reviews have yielded conflicting results about the magnitude of the effect sizes.127–131
We re-examined the epidemiological evidence for the effects of water and sanitation by reviewing the relation between water, sanitation and hygiene, and diarrhoea, starting with previous reviews.128–131 We did a meta-regression of 119 studies that was designed to adjust for intervention and baseline group characteristics. First, we compared indicator variables for each of the intervention components (improved sanitation, hygiene, point-of-use water treatment, source water treatment, and piped water) with a reference category (improved water source). Second, we also included indicator variables for the baseline characteristics—ie, whether the baseline was an unimproved or improved water source or sanitation—as covariates to account for the heterogeneous control groups. Our analysis showed a significant effect of both improved water and improved sanitation compared with unimproved water and sanitation; we did not note a significantly greater effect of piped water or point-of-use or source water treatment compared with improved water.
Particulate matter smaller than 2·5 µm is a common useful indicator of the risk associated with exposure to a mixture of pollutants from diverse sources and in different environments, including ambient particulate matter pollution from transportation, wind-blown dust, burning of bio mass, and industrial sources; second-hand smoke; burning of biomass and coal for household energy; and active smoking.132,133 However, existing studies cover only small concentration ranges—for example, ambient particulate matter pollution studies have been restricted to yearly average concentrations of particulate matter smaller than 2·5 µm of roughly 5 µg/m3 to 30 µg/m3,134–137 but much higher concentrations of ambient particulate
NIH-PA Author Manuscript
NIH-PA Author Manuscript
matter have been recorded in polluted cities in Asia and elsewhere. The relation between concentration of small particulate matter and risk of disease is probably non-linear.132,133 To inform estimates of risk across the full range of concentrations, we used the approach of Pope and colleagues132 and integrated epidemiological evidence for the hazardous effects of particulate matter at different concentrations from different sources and environments. Methods for estimation of the integrated exposure– response curves for each cause are described elsewhere.138 Briefly, we compiled study-level estimates of the RR of mortality associated with any or all of ambient air pollution, second-hand smoke, household air pollution, and active smoking for the following outcomes: ischaemic heart disease, stroke, lung cancer, chronic obstructive pulmonary disease, and acute lower respiratory tract infection in children. We evaluated several non-linear functions with up to three parameters for fitting the integrated exposure– response relation and assessed them by calculation of the root mean squared error. An exponential decay with a power of concentration was the functional form that provided the best fit for all five outcomes. The integrated exposure– response curve was then used to generate effect sizes specific to the amount of ambient particulate matter smaller than 2·5 µm for each population. For ischaemic heart disease and stroke, evidence shows that household air pollution affects intermediate outcomes, such as blood pressure,139 but not clinical events. For acute lower respiratory tract infection, the integrated exposure– response curve enabled us to extrapolate beyond the partial exposure– response measured in the RESPIRE trial.140 For effects of household air pollution on chronic obstructive pulmonary disease and lung cancer we use the effect size based on new systematic reviews and meta-analyses.
Several dietary factors affect ischaemic heart disease and stroke, including consumption of fruits, vegetables, nuts and seeds, whole grains, processed meat, polyunsaturated fats, and seafood omega-3 fatty acids.81,83,85,87,90–92,141,142 We updated earlier systematic reviews and meta-analyses for fruits, vegetables, and seafood omega-3 fatty acids, which included both observational and intervention studies if available. A systematic review143 of randomised clinical trials of supplementation with seafood omega-3 fatty acids reported non-significant effects on several outcomes, and a significant effect for mortality from ischaemic heart disease—the primary outcome in GBD 2010. In view of this finding, we tested whether a significant difference exists between the randomised clinical trials of seafood omega-3 fatty acid supplementation and observational studies of seafood-omega 3 fatty acid intake. The effect of seafood omega-3 fatty acids tended to be lower in
randomised controlled trials than in observational studies, however, this difference was not statistically significant (p=0·057). Therefore, we used the effect size based on the
combination of randomised clinical trials and observational studies but also did a sensitivity analysis with the effect size based on randomised clinical trials.
Estimates of the RR associated with dietary risk factors are based largely on observational studies that control for age, sex, and other cardiovascular risk factors. However, some early observational studies do not fully control for other dietary components. Protective dietary risk factors such as consumption of fruits, vegetables, and whole grains, tend to be positively correlated with each other and negatively correlated with harmful dietary risk factors such as consumption of processed meat. Therefore, RRs estimated for single risk factors in
NIH-PA Author Manuscript
NIH-PA Author Manuscript
observational studies could overestimate the protective or harmful effect of that risk factor. In effect, the partially adjusted RR will include some of the effects associated with other correlated diet components, particularly since the exposure measure for dietary risk factors is energy adjusted to a standard calorie intake.
To examine this issue, we did further empirical assessments using studies of dietary patterns and randomised controlled feeding studies. Studies of dietary patterns144–148 have estimated the effects of beneficial diets (prudent or Mediterranean diets) and harmful diets (western diets); these studies capture the overall effects of differences in dietary components. For example, a prudent diet has lots of fruits, vegetables, fish, and whole grains. For each of the dietary pattern studies we computed the estimated RR for dietary pattern groups with the RRs from the meta-analyses of single dietary risk factors, the reported differences in dietary intake, and assuming a multiplicative relation between RRs for individual components. Results of this internal validation study show that overall, estimation of the effect of dietary pattern based on the RRs reported for single risk factors was much the same as the effect reported in the study; across four large cohort studies of seven dietary patterns the average ratio for the estimated RR reduction compared with the measured RR reduction was 0·98. In addition to the dietary pattern studies, we also investigated the evidence for the effects of dietary risk factors from randomised controlled feeding studies, such as DASH149 and OmniHeart,150 which measured the effect of dietary changes on blood pressure and LDL cholesterol. We used meta-regression to estimate the pooled effect of fruits, vegetables, nuts and seeds, whole grains, fish, and dietary fibre on systolic blood pressure and LDL
cholesterol, based on all randomised controlled feeding studies (six treatment groups from three studies for blood pressure and six treatment groups from two studies for cholesterol). When translated into an effect using the RRs of blood pressure and cholesterol for ischaemic heart disease, the average ratio of the estimated to measured RR reduction was 1·07 for all components and 0·85 when excluding fish, which has mechanisms additional to lowering blood pressure and cholesterol.151 These two supplementary analyses suggest that the RRs estimated in the meta-analyses of single dietary risk factors are unlikely to be significantly biased because of residual confounding due to other diet components.
Pooled epidemiological studies of cardiovascular disease risks show that the RR decreases with age, and that the inverse age association is roughly log-linear. Based on a pooled analysis of several risk factors (high blood pressure, high fasting plasma glucose, high total cholesterol, and tobacco smoking), the age at which the RR reaches 1 is often between 100 and 120 years. We therefore estimated age-specific RRs for all cardiovascular risk factors by meta-regression of available data with logRR as the dependent variable and median age at event as the independent variable with an age intercept (RR=1) at age 110 years. Uncertainty in the RR was generated by simulation analyses.152
The causal association between a risk factor and a disease outcome is often informed by a wider body of evidence than epidemiological studies of RRs for specific measures of exposure, especially when disease-specific and age-specific RRs are needed. For example, although smoking is an established cause of cardiovascular diseases, when cohorts are analysed in fine age groups, the 95% CI for the effect of smoking on stroke spans 1·0 in
NIH-PA Author Manuscript
NIH-PA Author Manuscript
several age groups.38 Similarly, randomised trials of zinc supplementation were designed to detect effects on total mortality.36,153 Re-analysis of the same trials for disease-specific outcomes, which is necessary to extrapo late effects to populations with different causes of death, reduced their statistical power and gave 95% CIs that spanned 1·0. To use the broad evidence while accounting for the uncertainty of the subgroup RRs, we included in the uncertainty analysis all draws of the RR distribution, including those that show a protective effect as long as the overall relation for the risk factor across all ages is significant. In other cases, if there are different degrees of exposure for a risk factor, in some exposure categories the RR might not be significant. We have included draws from these posterior distributions if the mean values show a dose–response relation. To fairly represent the extent of our epidemiological knowledge, we have included in the uncertainty analysis draws from the posterior distribution for those exposure categories that show a protective effect.
Theoretical-minimum-risk exposure distributions for counterfactual comparison
In the comparative risk assessment framework, disease burden attributable to risk factors is calculated with reference to an alternative (counterfactual) distribution of exposure; in GBD 2010, we used an optimal exposure distribution (in terms of effect on population health), termed the theoretical-minimum-risk exposure distribution. For several risk factors, such as tobacco smoking, the choice of theoretical-minimum-risk exposure distribution is clear—ie, 100% of the population being lifelong non-smokers. However, for many of the other risk factors zero exposure is not possible (eg, blood pressure), or the lowest amount of exposure that is still beneficial is not yet established. In these cases the theoretical-minimum-risk exposure distribution was informed by two considerations: the availability of convincing evidence from epidemiological studies that support a continuous reduction in risk of disease to the chosen distribution; and a distribution that is theoretically possible at the population level (table 1).
For some risk factors, new evidence has resulted in a revision of the theoretical-minimum-risk exposure distribution compared to the previous comparative theoretical-minimum-risk assessment. For example, the previous distribution for systolic blood pressure was a mean of 115 mm Hg (SD 6).6 However, subsequent randomised trials154 of blood pressure-lowering medication suggest that the benefits of lowering blood pressure could continue to 110 mm Hg or lower. On this basis, we changed the theoretical-minimum-risk exposure distribution to a mean of 110–115 mm Hg (SD 6). For other exposures, the distribution was increased because of data from new epidemiological studies75— eg, for mean body-mass index we used 21–23 kg/m2, compared with 21 kg/m2 used previously.
For ambient particulate matter pollution, we did a sensitivity analysis with an alternative theoretical-minimum-risk exposure distribution that included the effect of regional dust particulate matter. We did so because although particulate exposure from dust could theoretically be reduced, it would probably be prohibitively expensive and could only be done over a very long period. This factor is particularly relevant in areas with high amounts of dust—eg, deserts. Dusty grid cells were identified as those with an ambient air
concentration of PM2·5 of 36 µg/m3 or more and where the dust fraction from the TM5 chemical transport model was 50% or more.
NIH-PA Author Manuscript
NIH-PA Author Manuscript
Mortality and disease burden attributable to individual and clusters of risk factors
We calculated the burden attributable to risk factors with continuous exposure by comparing the present distribution of exposure to the theoretical-minimum-risk exposure distribution for each age group, sex, year (1990 and 2010), and cause according to the following formula:
Where PAF is the population attributable fraction (burden attributable to risk factor), RR(×) is the RR at exposure level ×, P1(×) is the (measured or estimated) population distribution of exposure, P2(×) is the counterfactual distribution of exposure (ie, the theoretical-minimum-risk exposure distribution), and m the maxi mum exposure level.4
Burden attributable to categorical exposures was calculated by comparing exposure categories to a reference category for each age, sex, year, and cause according to the following formula:
Where RRi is the RR for exposure category i, Pi is the fraction of the population in exposure category i, and n is the number of exposure categories.4
We calculated the burden attributable to clusters of risk factors by computing the combined population attributable fraction for risk factors for each age, sex, year, and cause according to the following formula:
Where r is each individual risk factor, and R is the number of risk factors. This approach assumes that risk factors are independent—ie, it does not account for mediation, exposure correlation, or effect size modification that might exist between risk factors in a cluster.155 To represent uncertainty in the estimates we used simulation analysis to take 1000 draws from the posterior distribution of exposure, RR, and each relevant outcome for each age, sex, country, year. We accounted for the correlation structure of uncertainty (ie, whether exposure in a country, age group, and sex is high or low might be related to whether it is high or low in other subgroups) by use of the same draw of exposure across different outcomes and the same draw of RR across country, age, and sex subgroups when the RR does not vary by country, age, or sex. We otherwise assumed that the uncertainties in exposure, RR, and underlying burden attributable to the outcome were independent.
NIH-PA Author Manuscript
NIH-PA Author Manuscript
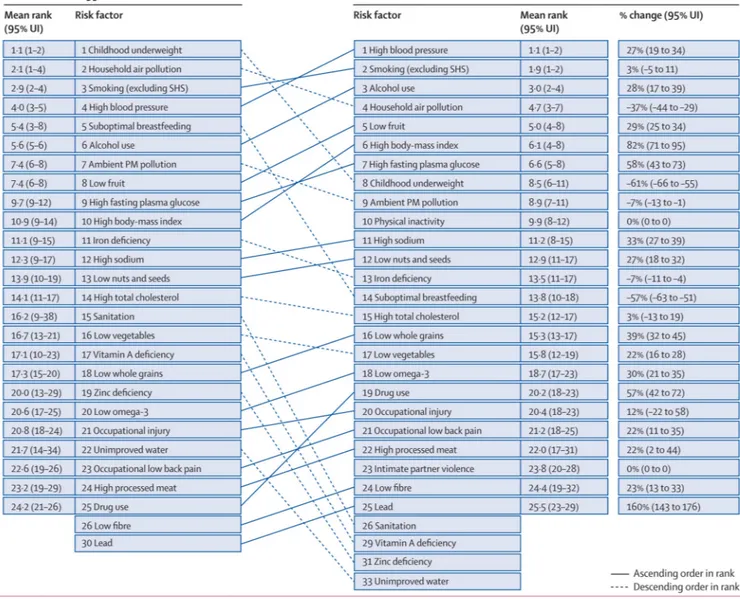
We computed the mean deaths and DALYs attributable to each risk factor and risk factor cluster from the 1000 draws. The 95% uncertainty intervals (95% UI) were calculated as the 2·5th and 97·5th percentiles of the 1000 draws. We also computed the mean rank and 95% UI for the 43 risk factors included in the ranking list. The mean of the ranks for a risk factor was not necessarily equivalent to the rank of the mean deaths or mean DALYs attributable to the risk factor.
Role of the funding source
The sponsor of the study had no role in study design, data collection, data analysis, data interpretation, or writing of the report. The corresponding author had full access to all the data in the study and had final responsibility for the decision to submit for publication.
Results
Quantification of risk factors in this analysis represents the effects of each individual risk factor, holding all other independent factors constant. The effects of multiple risk factors are not a simple addition of the individual effects and are often smaller than their sums,156 especially for cardiovascular diseases, which are affected by several risk factors (eg, table 2). The sum of the individual effects of just the metabolic risk factors at the global level is 121% and the summation of all the risks is greater than 400%.
We estimated global attributable mortality and DALYs with uncertainty for 1990, and 2010, for each of the 67 risk factors and clusters of risk factors (table 3, 4). The appendix shows full results by region, year, age, and sex for attributable deaths and DALYs. Because of the interest in the combined effects of multiple risk factors, we have approximated the joint effects of clusters of risk factors assuming that risk factors included in each cluster are independent. However, risk factors included in a cluster are not necessarily independent; for example, a substantial part of the burden attributable to high body-mass index is mediated through high blood pressure and high fasting plasma glucose. Others act together and risk factor exposures might be correlated at the individual level,155 especially household air pollution and ambient particulate matter pollution, which might have common sources. For these reasons we have not computed the joint effects for physiological risk factors or air pollution. However, the combined effects of physiological risk factors are probably large, with high blood pressure the leading single risk factor globally, accounting for 9·4 million (95% UI 8·6 million to 10·1 million) deaths and 7·0% (6·2–7·7) of global DALYs in 2010, followed by high body-mass index (3·4 million [2·8 million to 4·0 million deaths] and 3·8% [3·1–4·4] of global DALYs in 2010), high fasting plasma glucose (3·4 million [2·9 million to 3·7 million] deaths and 3·6% [3·1–4·0] of DALYs), high total cholesterol (2·0 million [1·6 million to 2·5 million] deaths and 1·6% [1·3–2·0] of DALYs), and low bone mineral density (0·2 million [0·1 million to 0·2 million] deaths and 0·21% [0·17–0·25] of DALYs).
The joint effects of air pollution are also likely to be large. Household air pollution from solid fuels accounted for 3·5 million (2·7 million to 4·4 million) deaths and 4·5% (3·4–5·3) of global DALYs in 2010 and ambient particulate matter pollution accounted for 3·1 million (2·7 million to 3·5 million) deaths and 3·1% (2·7–3·4) of global DALYs. For ambient
NIH-PA Author Manuscript
NIH-PA Author Manuscript
particulate matter pollution, we also did a post-hoc sensitivity analysis excluding the effects of dust, which had a small effect worldwide—attributable global DALYs decreased by 2% —but large effects in north Africa and Middle East. Household air pollution is an important contributor to ambient particulate matter pollution; we estimate that it accounted for 16% of the worldwide burden from ambient particulate matter pollution in 2010. The effects of ambient ozone pollution, which increases the risk of chronic obstructive pulmonary disease, were smaller than those of household air pollution from solid fuels or ambient particulate matter pollution (0·2 million [0·1 million to 0·3 million] deaths and 0·1% [0·03–0·2] of global DALYs in 2010).
For other clusters of risk factors for which we approximated the joint effects assuming independence, dietary risk factors and physical inactivity were responsible for the largest disease burden: 10·0% (9·2–10·8) of global DALYs in 2010. Of the individual dietary risk factors, the largest attributable burden in 2010 was associated with diets low in fruits (4·9 million [3·8 million to 5·9 million] deaths and 4·2% [3·3–5·0] of global DALYs), followed by diets high in sodium (4·0 million [3·4 million to 4·6 million]; 2·5% [1·7–3·3]), low in nuts and seeds (2·5 million [1·6 million to 3·2 million]; 2·1% [1·3–2·7]), low in whole grains (1·7 million [1·3 million to 2·1 million]; 1·6% [1·3–1·9]), low in vegetables (1·8 million [1·2 million to 2·3 million]; 1·5% [1·0–2·1]), and low in seafood omega-3 fatty acids (1·4 million [1·0 million to 1·8 million]; 1·1% [0·8–1·5]). Our sensitivity analysis of omega-3 fatty acids using relative risks from randomised trials reduced the attributable burden by more than half, to 0·6 million (–0·6 million to 1·7 million) deaths, and 0·5% (−0·5 to 1·4) of global DALYs in 2010. Physical inactivity and low physical activity accounted for 3·2 million (2·7 million to 3·7 million) deaths, and 2·8% (2·4–3·2) of DALYs in 2010.
Child and maternal undernutrition was responsible for the next largest attributable burden of the risk factor clusters (1·4 million [1·2 million to 1·7 million] deaths; 6·7% [5·7–7·7] of global DALYs in 2010), with childhood underweight the largest individual contributor (0·9 million [0·7 million to 1·0 million]; 3·1% [2·6–3·7]), followed by iron deficiency (0·1 million [0·09 million to 0·14 million]; 1·9% [1·4–2·6]), and suboptimal breast feeding (0·5 million [0·3 million to 0·8 million]; 1·9% [1·2–2·7]). Vitamin A and zinc deficiencies amongst children accounted for less than 0·8% of the disease burden.
The burdens of disease attributable to tobacco smoking including second-hand smoke (6·3 million [5·4 million to 7·0 million] deaths and 6·3% [5·5–7·0] of DALYs) as well as alcohol and drug use (5·0 million [4·7 million to 5·3 million] deaths and 6·5% [6·0–7·0] of DALYs) were substantial in 2010. These burdens are mainly driven by active smoking, which accounts for 87% of the combined burden with second-hand smoke, and alcohol use which accounted for 4·9 million (4·5 million to 5·2 million) deaths and 5·5% (5·0–5·9) of global DALYs in 2010. Of the remaining risk factor clusters, occupational risk factors accounted for 0·9 million (0·7 million to 1·1 million) deaths and 2·5% (2·0–3·0) of global DALYs in 2010, followed by sexual abuse and violence (0·2 million [0·1 million to 0·3 million] deaths and 0·9% [0·7–1·2] DALYs), unimproved water and sanitation, (0·3 million [0 to 0·6 million] deaths and 0·9% [0·04–1·6] DALYs), and other environmental risks (0·7 million [0·6 million to 0·9 million] deaths and 0·6% [0·5–0·8] DALYs).
NIH-PA Author Manuscript
NIH-PA Author Manuscript
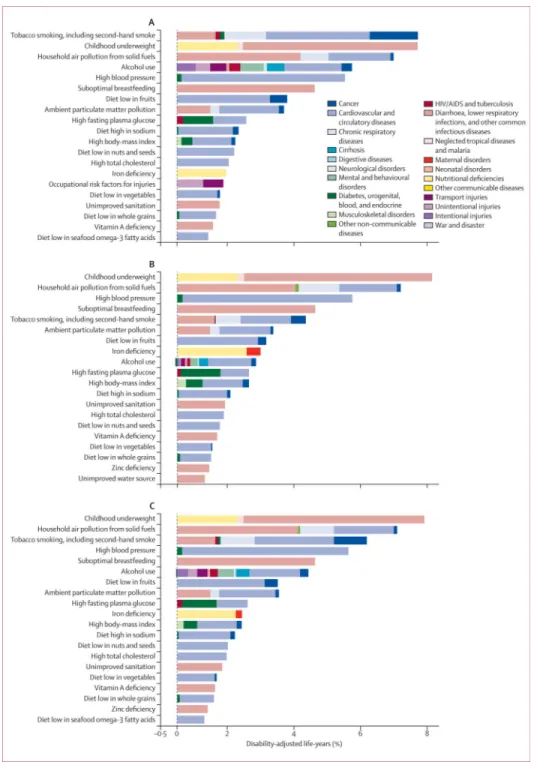
The rest of the results section refers to the 43 risk factors and clusters of risk factors in the rank list. The predominance of non-communicable disease risks in 2010 highlights the global epidemiological transition that has occurred since 1990 (figures 1, 2, 3). In 1990, the leading risks were childhood underweight (7·9% [6·8–9·4] of global DALYs), household air pollution from solid fuels (7·0% [5·6–8·3]), and tobacco smoking including second-hand smoke (6·1% [5·4–6·8]), high blood pressure (5·5% [4·9–6·0]), and suboptimal breast feeding (4·4% [2·8–6·1]). With the exception of house hold air pollution, which is a significant contributor to childhood lower respiratory tract infections, the five leading risk factors in 2010 (high blood pressure, tobacco smoking including secondhand smoke, alcohol use, household air pollution, and diets low in fruits) are mainly causes of adult chronic disease, especially cardio vascular diseases and cancers (figures 1, 2). The burden of disease attributable to other chronic disease risk factors also increased substantially between 1990 and 2010; for example, the global disease burden attributable to high body-mass index increased from 52 million to 94 million DALYs and that of high fasting plasma glucose increased from 56 million to 89 million DALYs over this period.
The rise in global disease burden attributable to chronic disease risk factors has been accompanied by a decrease in the relative importance of risk factors that largely or
exclusively cause communicable diseases in children. The global disease burden attributable to childhood underweight halved between 1990 (7·9% [6·8–9·4] of global DALYs) and 2010 (3·1% [2·6–3·7]; table 3). Although the fraction of disease burden attributable to iron deficiency fell relatively little, suboptimal breastfeeding, unimproved water, unimproved sanitation, vitamin A deficiency, and zinc deficiency all decreased substantially between 1990, and 2010.
The transition from childhood communicable to non-communicable disease burden is also exemplified by the fall in DALYs caused by household air pollution from solid fuels (despite the rise in its effects on cardiovascular diseases). Although the burden attributable to ambient particulate matter pollution has largely remained unchanged (3·2% [2·8–3·7] of global DALYs in 1990 vs 3·0% [2·6–3·4] in 2010), the contribution of lower respiratory tract infections had fallen sharply by 2010, with chronic diseases of adults being the dominant health outcome caused by this exposure.
Figure 4 shows the 95% uncertainty interval in global DALYs attributable to each risk factor and the overall rank for each risk factor. The uncertainty intervals for many risk factors overlap, especially those not in the top five. Unimproved water, unimproved sanitation, vitamin A deficiency, and zinc deficiency have large uncertainty, which reflects the substantial uncertainty in the estimates of etiological effect sizes for these risks.
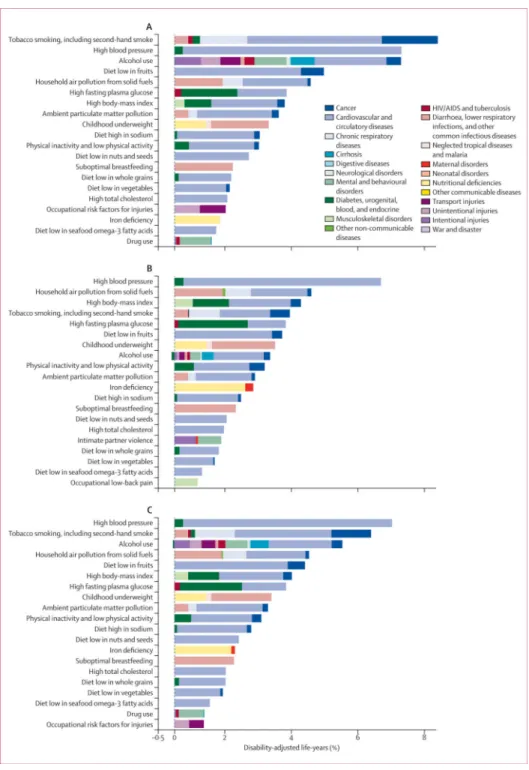
Some risks were quantified for women only—for example, intimate partner violence, which accounted for 1·5% (1·0—2·1) of DALYs among women in 2010. Important differences between men and women also exist for disease burden attributable to other risk factors, most notably, for tobacco smoking including secondhand smoke and alcohol use (figures 1, 2). These risks cause substantially lower burden in women than in men, because women drink less and in less harmful ways than do men, and fewer smoke or have smoked for a shorter time than have men in most regions.157 In 2010, tobacco smoking including second-hand
NIH-PA Author Manuscript
NIH-PA Author Manuscript
smoke accounted for 8·4% of worldwide disease burden among men (the leading risk factor) compared with 3·7% among women (fourth highest risk factor). For alcohol use, these sex differences were similarly sub stantial: 7·4% (third) versus 3·0% (eighth). The effect of occupational risk factors on population health also differed between sexes—for example, the fraction of disease burden attributable to occupational risk factors for injuries was 18·5 times higher for men than for women in 2010 (20 175 000 DALYs for men vs 1 090 000 for women). Dietary risk factors had broadly similar effects for men and women with the exception of diet low in fruits, for which the fraction of disease burden attributable was 1·5 times larger for men than for women in 2010 (47 979 000 DALYs for men vs 32 474 000 for women). This effect is caused by lower fruit consumption and a larger disease burden from cardiovascular disease in men.
Further disaggregation of mortality and disease burden attributable to risk factors reveals several patterns by age group (appendix). Among children younger than 5 years, childhood underweight was the leading risk factor worldwide in 2010 (12·4% [10·4–14·7] of global DALYs), followed by non-exclusive or discontinued breast feeding (7·6% [4·8–10·9]) and household air pollu tion from solid fuels (6·3% [4·4–8·1]). Vitamin A and zinc deficiencies, unimproved sanitation, and unimproved water each accounted for less than 2% of disease burden in children younger than 5 years.
For people aged 15–49 years, the leading risk factor worldwide was alcohol use, followed by tobacco smoking including second-hand smoke, high blood pressure, high body-mass index, diet low in fruits, drug use, and occupational risk factors for injuries. Risk factor rankings in this age group stayed broadly similar between 1990, and 2010, with the exception of iron deficiency, which dropped from the fourth leading risk factor in 1990, to ninth in 2010.
High blood pressure, tobacco smoking including second-hand smoke, alcohol use, and diet low in fruits were all in the top five risk factors for adults aged 50–69 years and adults older than 70 years, in both 1990, and 2010, accounting for a large proportion of disease burden in both age groups. Globally, high blood pressure accounted for more than 20% of all health loss in adults aged 70 years and older in 2010, and around 15% in those aged 50–69 years. Tobacco smoking including secondhand smoke accounted for more than 10% of global disease burden in each of these age groups in 2010.
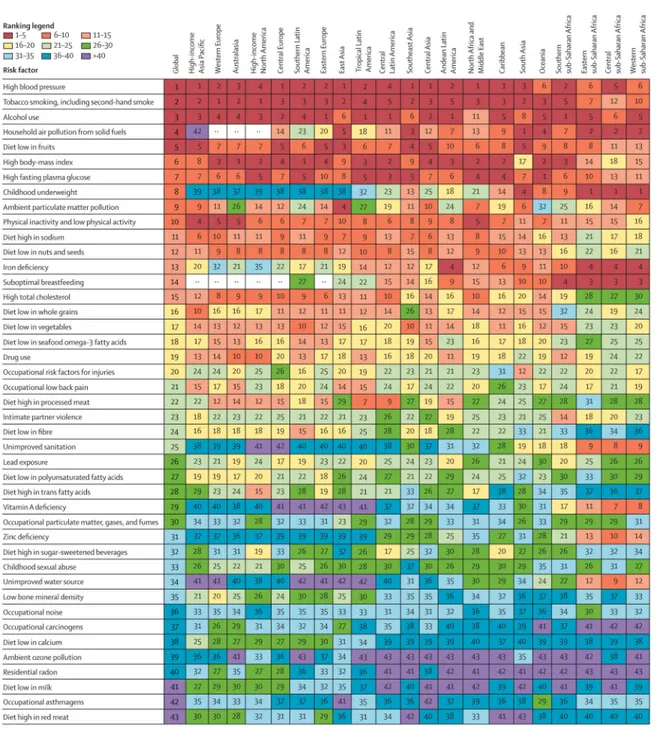
In all 21 regions, and worldwide, a shift has occurred, from risk factors for childhood communicable disease to risk factors for non-communicable disease. The size of this shift and which risk factors account for the largest burden varies highly between regions (figure 5, appendix).
In central, eastern, and western sub-Saharan Africa, the share of disease burden attributable to childhood underweight, household air pollution from solid fuels, and suboptimal
breastfeeding has fallen sub stantially. However, these risk factors continue to be the leading three causes of disease burden in 2010. The disease burden attributable to risk factors for childhood communicable diseases, such as micronutrient deficiencies and unimproved water and sanitation, has decreased, both as a proportion of total disease burden and in their rank
NIH-PA Author Manuscript
NIH-PA Author Manuscript
order: risk factors for some non-communicable diseases and injury accounted for a larger disease burden in 2010. The most notable of these factors were alcohol use and high blood pressure (appendix).
Compared with other regions of sub-Saharan Africa, southern sub-Saharan Africa had a more mixed pattern of risk factor burden in 1990 (appendix). In 2010, alcohol use was the leading risk factor in southern sub-Saharan Africa, followed by high blood pressure and high bodymass index (figure 6). In addition to high exposure to harmful alcohol use, the effects of alcohol were particularly large because it increases the risk of road traffic and other unintentional and intentional injuries, as well as of tuberculosis,47 all of which are large causes of disease and injury burden in this region.
In south Asia, the rise of risk factors for non-communicable diseases is shown by the substantial increase in the burden attributable to tobacco smoking including second-hand smoke, high blood pressure and other metabolic risk factors, dietary risk factors, and alcohol use. However, household air pollution from solid fuels was, despite decreases, the leading risk factor in 2010. Childhood underweight was still the fourth leading risk factor in 2010, despite its share of disease burden having more than halved from 11·9% [95% UI 10·1–14·4] of DALYs in 1990, to 4·0% [3·2–4·9] in 2010. Other risk factors for communicable disease, such as suboptimal breastfeeding and micronutrient deficiencies, fell sub stantially in the region as child mortality decreased.
In southeast, east, and central Asia, the epidemiological transition was already well advanced in 1990, and by 2010, high blood pressure (which is commonly associated with diets high in sodium as a prominent underlying cause94,158), tobacco smoking including second-hand smoke, and diets low in fruits were all among the five leading risk factors in these regions. The disease burden attributable to childhood underweight and sub optimal breastfeeding had been largely eliminated in east Asia by 2010, although they remain important in southeast Asia. In these three regions, despite decreases, household air pollution from solid fuels was still a leading risk factor in 2010, ranked third in south-east Asia, sixth in east Asia, and 12th in central Asia. Ambient particulate matter pollution accounted for a larger disease burden than did household air pollution in central and east Asia in 2010, although household solid fuels is an important source of ambient particulate matter pollution in these regions.
The North Africa and Middle East region also had a large shift from risk factors for communicable to non-communicable diseases. In 2010, risk factors for noncommunicable disease almost exclusively dominated the region’s causes of loss of health, with high blood pressure and high body-mass index each accounting for roughly 8% of disease burden, followed by tobacco smoking including second-hand smoke, high fasting plasma glucose, and physical inactivity or low physical activity. Ambient particulate matter pollution (seventh leading risk factor) is a notable cause of disease burden in this region, caused by a combination of polluted cities and dust from the Sahara desert.
Alcohol use was an important cause of disease burden in most of Latin America. It was ranked first in central Latin America, fourth in tropical Latin America, and sixth in Andean
NIH-PA Author Manuscript
NIH-PA Author Manuscript
Latin America in 1990, and first in all these regions in 2010. Risk factors for childhood communicable disease had been largely replaced by those causing non-communicable diseases in these regions by 2010, although household air pollution from solid fuels was still an important risk factor in Andean Latin America in 2010.
One of the most notable findings was the effect of alcohol use in Eastern Europe, where it accounts for almost a quarter of total disease burden. Other risk factors, such as high blood pressure, tobacco smoking including second-hand smoke, high body-mass index, and dietary risks, also feature prominently, underscoring the large underlying burden of cardiovascular disease in the region.
In North America, Australasia, southern Latin America, and western Europe, the share of disease burden attributable to tobacco smoking including second-hand smoke has fallen slightly; it has stayed almost constant in central Europe and high-income Asia Pacific. Tobacco smoking including second-hand smoke was still the leading risk factor in 2010 in North America and western Europe. Important decreases in disease burden are evident for high blood pressure and total cholesterol in North America, Australasia, and western Europe. High blood pressure is a leading risk for health in high-income Asia Pacific (accounting for 8·5% [95% UI 7·1–10·1] of disease burden) and central Europe (18·9% [16·8–20·8]); evidence from individual-level trials of salt and blood pressure and from cross-population studies indicates that this result is likely to be driven partly by high salt
consumption in these regions.94,158 Falls in disease burden attributable to tobacco smoking including second-hand smoke, high blood pressure, and high total cholesterol in high-income regions have been partly offset by the increasing burden caused by high body-mass index. In southern Latin America, high body-mass index accounted for almost 10% of overall disease burden in 2010, and is the leading risk factor in southern Latin America and Australasia.
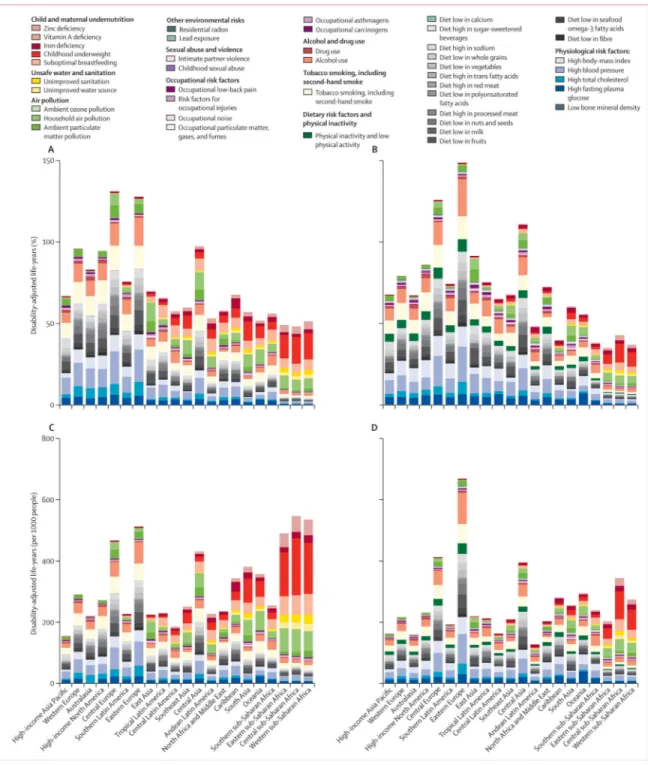
Figure 6 summarises these regional patterns, in relation to the proportion of regional burden and attributable DALYs per 1000 people. Regions in figure 6 are ordered by mean age of death, a marker of the epidemiological transition. Figure 6 shows the clear transition away from risk factors for childhood communicable disease towards risk factors for
non-communicable disease, with increasing mean age at death. This change is apparent from the decrease in burden of disease attributable to undernutrition and unimproved water and sanitation, with increased mean age at death, especially when the effect of risks is assessed by DALYs per 1000 people (figure 6C, D). A clear general shift occurs towards a larger proportion of overall burden arising from risk factors for non-communicable diseases, particularly metabolic risks and dietary risk factors (figure 6A, B). However, the absolute burden of risk factors for non-communicable disease does not increase with increasing mean age at death. Rather, its magnitude is lower in high-income regions than in sub-Saharan Africa and south Asia (figure 6C, D), showing the double burden of communicable and non-communicable disease in regions early in the epidemiological transition.
Some risk factors deviated from the pattern of the proportional burden (percent of region-specifc DALYs attributable to a risk factor) being closely associated with epidemiological and demographic transition (shift from communicable to non-communicable disease with
NIH-PA Author Manuscript
NIH-PA Author Manuscript
increasing mean age of death). The proportion of DALYs attributable to tobacco smoking including second-hand smoke was largest in North America—where smoking among women has generally been prevalent for a long time—and central and eastern Europe. Central and eastern Europe and central Asia also had the largest proportion of disease burden attributable to risk factors with large effects on cardiovascular diseases, which are disproportionately high in these regions. Exposure to particulate matter from household and ambient sources had the most varied pattern with respect to the epidemiological transition, partly because of the heterogeneous pattern of exposure and the effects on both children and adult causes of ill health. Household air pollution from solid fuels accounted for a large proportion of disease burden in central, eastern, and western sub-Saharan Africa and it is a leading risk factor in some Asian regions and Oceania. In central and east Asia in 2010, ambient particulate matter pollution surpassed household air pollution in terms of its burden.
Discussion
The results of GBD 2010 suggest that the contributions of risk factors to regional and global burden of diseases and injuries has shifted substantially between 1990, and 2010, from risk factors that mainly cause communicable diseases in children to risk factors that mainly cause non-communicable diseases in adults. The proportion of overall disease burden attributable to childhood underweight— the leading risk factor worldwide in 1990—had more than halved by 2010, making childhood underweight the eighth risk worldwide, behind six behavioural and physiological risks, and household air pollution from solid fuels. Other risks for child mortality, such as nonexclusive and discontinued breastfeeding, micronutrient deficiencies, and unimproved water and sanitation, have also fallen. However, child and maternal undernutrition risks collectively still account for almost 7% of disease burden in 2010, with unimproved water and sanitation accounting for almost 1%. Of the non-communicable disease risks, high blood pressure, high body-mass index, high fasting plasma glucose, alcohol use, and dietary risks have increased in relative importance. This overall shift has arisen from a combintion of the ageing population, substantial achievements in lowering mortality of children aged younger than 5 years, and changes in risk factor exposure.
These broad global patterns mask enormous regional variation in risks to health. In sub-Saharan Africa, risks such as childhood underweight, household air pollution from solid fuels, and suboptimal breastfeeding continue to cause a disproportionate amount of health burden, despite decreasing. The shift to risk factors for non-communicable disease was clear in east Asia, North Africa and Middle East, and Latin America. This regional heterogeneity underestimates even greater differences in exposure to, and health effects of, risk factors in national and subnational populations. These differences should be further elucidated in country-specific analyses using the framework and methods reported here.
Our analysis shows the large burden of disease attributable to primary and secondary tobacco smoking and to particulate matter pollution in household and ambient environments. The magnitude of disease burden from particulate matter is substantially higher than
estimated in previous comparative risk assessment analyses. For example, ambient particulate matter pollution was estimated in the previous comparative risk assessment7 to
NIH-PA Author Manuscript
NIH-PA Author Manuscript
account for 0·4% of DALYs in 2000 compared with 3·1% in GBD 2010 based on interpolating our 1990 and 2005 results; for household air pollution from solid fuels the comparison is 2·7% in the previous comparative risk assessment versus 5·3% based on GBD 2010.
Several reasons could account for this difference. First, accumulation of evidence from epidemiological studies about diseases caused by particulate matter, and the use of an integrated exposure–response curve, has led to the inclusion of more outcomes than before. For example, health effects for ischaemic heart disease and stroke were not previously included for household air pollution from solid fuels, and lung cancer was included for coal smoke only. Second, the previous assessment of ambient particulate matter pollution was restricted to medium and large cities. High-resolution satellite data and chemical transport models have enabled us to quantify exposure and burden for all rural and urban populations. Third, the previous assessment of ambient particulate matter pollution did not include additional increments of risk above a concentration of 50 µg/m3 for PM2·5, because of the narrow range of ambient particulate matter pollution levels reported in epidemiological studies. The use of an integrated exposure–response curve enabled us to estimate a continuous risk function across the full range of particulate matter concentrations, which covers the very high concentrations of ambient particulate matter exposure measured in, for example, parts of east Asia.
Our integrated exposure–response curve, however, does not address how different sources of particulate matter interact in terms of effects and overlapping exposures. Studies124,159,160 have reported broadly similar effect sizes for ambient particulate matter by smoking status (never, former, and current smokers). Other evidence161 shows that the effects diminish with increasing exposure for active smoking, a pattern incorporated into our exposure– response curves. We applied the effects of ambient particulate matter to both smokers and non-smokers alike to be consistent with the epidemiological evidence that emphasises
independent effects of ambient particulate matter. The reasons for the independent effects of different sources of particulate matter should be further investigated. They might include different compositions of particulate matter by source, or different time patterns of exposure162—eg, exposure to particulate matter from active smoking is characterised by episodic, high doses whereas exposure to ambient particulate matter is more constant over time.
These limitations aside, the large attributable burden documented in our analysis represents a major shift in our understanding of disease burden arising from particulate matter and emphasises the need to design alternative fuels for household cooking and heating,163 implement more stringent regulation of vehicle and industrial emissions,164–166 reduce agricultural burning or land clearing by fire,167 and curb and reverse deforestation and desertification to reduce ambient particulate matter from dust.168–171 A large share of ambient particulate matter in Asia and sub-Saharan Africa originates from solid fuel.172,173 Therefore the two exposures are related, and alternative cooking and heating fuels would have benefits for people who currently use solid fuels as well as those who do not, but live in the same community.173
NIH-PA Author Manuscript
NIH-PA Author Manuscript
Unimproved water and unimproved sanitation together accounted for 0·9% of DALYs in 2010, compared with 2·1% in 1990. These proportions are substantially smaller than the 6·8% for 1990, and 3·7% for 2000, estimated in previous GBD studies for water, sanitation, and hygiene combined.3,7 The relatively small burden estimated for 2010 is partly related to decreases in diarrhoeal disease mortality since 1990, and partly to differences in the distributions of deaths by underlying cause of death. We have also done an updated meta-analysis of quasi experimental and experimental studies. Historical demographic analyses suggest that the introduction of piped water into cities in the late 19th and early 20th centuries had a large beneficial effect on mortality.174 However, our re-analysis both when restricted to experimental studies and when also including quasi experimental studies did not detect a significantly improved effect of household water connections over improved water sources. Similarly, we did not find a significantly improved effect of water quality
interventions, consistent with the findings reported by Cairncross and colleagues,128 which showed that masked point-of-use water quality interventions did not have a significant effect on self-reported diarrhoea. As a result of this reassessment, we restricted our analysis to improved water and improved sanitation compared with unimproved sources following the MDG definitions. However, the interventions used in previous studies might not have achieved their full efficacy because of the quality of implementation. The real burden from water and sanitation could therefore be underestimated if well-implemented household connect ions and water quality interventions have a larger effect than improved water sources alone, and if the combination of poor water and sanitation has a larger effect than a sample interaction of individual effects. More definitive epidemiological evidence is needed to assess the effects of low quality versus high quality water, household connections versus improved water sources, and exposure based on travel time to water source.175 Also, we could not include an assessment of personal hygiene because of the paucity of national exposure data.
Our findings on the burden of micronutrients are also substantially smaller than those in the previous comparative risk assessment for 2000 and in estimates for 2004 by Black and colleagues10 in The Lancet's Maternal and Child Undernutrition Series. For example, Black and colleagues estimated 668 000 deaths caused by vitamin A deficiency in 2004; we estimated a quarter (168 000 deaths) for 2005; for zinc deficiency, the differences are similarly large (453 000 vs 120 000). These differences stem from many sources. First, the estimates of Black and colleagues were based on 10·3 million child deaths worldwide, itself based on WHO estimates of global child deaths for 2004. This estimate is substantially larger than those reported by UNICEF176 and the Institute for Health Metrics and Evaluation177 at the time of Black and colleagues' publication.
Large differences also exist for cause-specific mortality, especially in relation to diarrhoea and lower respiratory tract infections (which can be affected by both of these risks) versus malaria (which is not).176 The estimates also differ because of differences in the availability and interpretation of epidemiological evidence for disease outcomes and effect sizes. Maternal mortality and malaria as outcomes of vitamin A deficiency were included in the 2000 comparative risk assessment but they were not included in the present report because recent epidemiological evidence did not show a significant effect of supplementation on
NIH-PA Author Manuscript
NIH-PA Author Manuscript
these outcomes. Furthermore, we excluded neonatal vitamin A deficiency since it is the subject of three ongoing randomised trials. The age at which the effects of zinc deficiency begin was increased from birth in the 2000 comparative risk assessment, to 6 months in 2004,10 and to 12 months in the present analysis based on a reassessment of existing and new supplementation trials. Furthermore, we quantified the proportion of the population who are vitamin A or zinc deficient instead of classing whole countries as exposed or non-exposed. The evolving epidemiology of exposure to micronutrient deficiency and the subsequent health effects suggests a need to systematically reconsider most single nutrient supplementation for children in preventive strategies to lower child mortality, as suggested by the 2000 comparative risk assessment and later analyses. 10 Therapeutic zinc
supplementation in health-care settings is feasible, as is iron supplementation during pregnancy.174–179 Our findings support the need for strengthened policy about promotion of optimal breastfeeding practices and nutritional programmes that improve child growth. The estimated number of child deaths caused by underweight has also changed substantially over successive studies: in GBD 1990 it was estimated to be 5·9 million deaths in 1990,180 in the comparative risk assessment study for 2000 as 3·7 million deaths,7 and 1·9 million deaths in 2004.10 In GBD 2010 we estimated 2·3 million deaths for 1990 and 0·9 million deaths for 2010.
The evolution of estimates for deaths caused by childhood under weight is because of improvements in assessment of the population at risk. These improvements come from systematic analysis of the available data on underweight, a major modification of RRs after the change in the WHO standard in 2006, and differences in estimates of total and cause-specific mortality. We have also assessed the burden attributable to childhood wasting and childhood stunting. These analyses produce quite similar findings, for example, worldwide, childhood wasting accounted for 0·7 million deaths in 2010, and childhood stunting for 0·9 million deaths, compared with 0·9 million deaths for childhood under weight (the effects of these risks cannot be added).
The global burden of disease attributable to tobacco smoking including second-hand smoke has changed little, with decreases in high-income regions offset by increases in regions such as south east Asia and, to a lesser extent, east and south Asia. The burden attributable to alcohol use has increased substantially in eastern Europe since 1990, mainly because of a rise in the effects of heavy drinking on cardiovascular diseases.181 The high burden in eastern Europe was also identified in the 2000 comparative risk assessment but the data for patterns of alcohol consumption and their effects were weaker, whereas now they are supported by more surveys and epidemiological studies.182 High blood pressure, high body-mass index, and high fasting plasma glucose are leading risk factors for disease worldwide, with blood pressure having large effects on population health in all regions, including low-income regions in sub-Saharan Africa and south Asia. This finding is consistent with previous comparative risk assessment analyses. The disease burden in south Asia and sub-Saharan Africa, caused by increased blood pressure,70 has increased its absolute and relative importance in risk factor rankings. The large burden of high blood pressure emphasises the importance of implementing both population-wide and high-risk approaches to reduction of blood pressure.183,184 The worldwide increase in body-mass index and blood glucose is of particular concern in view of the absence of effective interventions.62,74 In contrast to these
NIH-PA Author Manuscript
NIH-PA Author Manuscript
risks, the burden of high total cholesterol is lower than that estimated in the 2000
comparative risk assessment, because the effects on ischaemic stroke were negligible at old ages when data from the Asia-Pacific Cohort Studies Collaboration and Prospective Studies Collaboration were pooled,68,185 and because exposure has fallen in high-income
countries.67
A recent study estimated that 5·3 million deaths were attributable to physical inactivity in 2008.186 This number, which has been widely quoted and equated with the number of deaths attributable to tobacco smoking,187 used effect sizes for all-cause mortality obtained from cohorts of adults mainly from North America and Europe and applied these effects to deaths at all ages. This approach not only assumes that the cause distribution is the same in all populations, irrespective of region and age structure, but also extends the effects to people younger than those in the cohort study, including to infants and children. In other words, a proportion of deaths from maternal causes, neonatal causes, and children’s infectious diseases and HIV were attributed to physical inactivity.186 The prevalence of inactivity also included people who had sedentary patterns as well as those in the low (insufficient) activity group. By contrast, our approach—calculating attributable burden by cause and age group, and accounting for exposure in four categories—estimated substantially fewer attributable deaths: 3·2 million (2·7 million to 3·7 million) in 2010, 56% of what we attribute to tobacco smoking when second-hand smoke is excluded. This discrepancy shows the importance of comparable risk factor assessments and the importance of estimation of attributable burden taking into account differences in underlying disease and injury patterns across populations. We have expanded the set of components of diet included from a combined category of fruits and vegetables in the 2000 comparative risk assessment to 15 components in GBD 2010; together these dietary risk factors account for a tenth of global disease burden. Of the dietary risk factors, the aetiological effect sizes for sodium, polyunsaturated fatty acids replacing saturated fatty acids, and seafood omega-3 fatty acids were informed fully (for sodium) or partly by randomised controlled trials. Disease burden attributable to diet high in sodium was a third of that for high blood pressure. The theoretical-minimum-risk exposure distribution was selected on the basis of values reported in randomised trials; studies of populations with low prevalence of cardiovascular disease suggest that benefits are likely to continue to lower levels.158
The large attributable burden for dietary risk factors such as diets low in fruits, vegetables, whole grains, nuts and seeds, and seafood omega-3 fatty acids might surprise some readers. The large burden is caused by both high exposure—eg, low intake of fruits in many regions —and large effect sizes. We did supplementary analyses using information from studies of dietary patterns and randomised controlled feeding studies to examine the robustness of the effect sizes used in GBD 2010. The findings of these supplementary analyses were
consistent with those from the meta-analyses of single risk factors. However, we stress that these results should still be interpreted with caution, particularly because of the debate surrounding the effects of seafood omega-3 fatty acids.143,188 Empirical assessments show that the pooled effect of risks and interventions trends towards a null result over time189,190 and this pattern could apply to seafood omega-3 fatty acids since the earlier, primarily observational effect sizes tended to show a larger effect than did the more recent randomised