and local permeability variations
D. Koehna,*, M.P. Roodb, N. Beaudoina, P. Chunga, P.D. Bonsc, E. Gomez-Rivasd
aSchool of Geographical and Earth Sciences, University of Glasgow, Gregory Building, Lillybank Gardens, G12 8QQ Glasgow, UK
bDepartment of Earth Science and Engineering, Imperial College London, South Kensington Campus, London SW7 2AZ, UK
cDepartment of Geosciences, Eberhard Karls University Tübingen, Wilhelmstrasse 56, 72074 Tübingen, Germany dSchool of Geosciences, Meston Building, King's College, University of Aberdeen, UK
Published in Sedimentary Geology 346 (2016) 60–71 http://dx.doi.org/10.1016/j.sedgeo.2016.10.007 0037-0738
This is an author version of this article. For the final publisher’s version please follow this URL: http://www.sciencedirect.com/science/article/pii/S0037073816301543
Abstract
We modeled the geometrical roughening of bedding-parallel, mainly layer-dominated stylolites in order to understand their structural evolution, to present an advanced classification of stylolite shapes and to relate this classification to chemical compaction and permeability variations at stylolites. Stylolites are rough dissolution seams that develop in sedimentary basins during chemical compaction. In the Zechstein 2 carbonate units, an important lean gas reservoir in the southern Permian Zechstein basin in Germany, stylolites influence local fluid flow, mineral replacement reactions and hence the permeability of the reservoir. Our simulations demonstrate that dominated stylolites can grow in three distinct stages: an initial slow nucleation phase, a fast layer-pinning phase and a final freezing phase if the layer is completely dissolved during growth. Dissolution of the pinning layer and thus destruction of the stylolite's compaction tracking capabilities is a function of the background noise in the rock and the dissolution rate of the layer itself. Low background noise needs a slower dissolving layer for pinning to be successful but produces flatter teeth than higher background noise. We present an advanced classification based on our simulations and separate stylolites into four classes: (1) rectangular layer type, (2) seismogram pinning type, (3) suture/sharp peak type and (4) simple wave-like type. Rectangular layer type stylolites are the most appropriate for chemical compaction estimates because they grow linearly and record most of the actual compaction (up to 40 mm in the Zechstein example). Seismogram pinning type stylolites also provide good tracking capabilities, with the largest teeth tracking most of the compaction. Suture/sharp peak type stylolites grow in a non-linear fashion and thus do not record most of the actual compaction. However, when a non-linear growth law is used, the compaction estimates are similar to those making use of the rectangular layer type stylolites. Simple wave-like stylolites are not useful for compaction estimates, since their growth is highly non- linear with a very low growth exponent. In the case where sealing material is collected at the tooth during dissolution, stylolites can act as barriers for local fluid flow as they intensify sealing capabilities of pinning layers. However, the development of teeth and spikes offsets and thus destroys continuous stylolite seams so that the permeability across the stylolite becomes very heterogeneous and they are no continuous barriers. This behavior is best shown in rectangular layer and seismogram pinning type stylolites that develop efficient fluid barriers at teeth tips but destroy sealing capabilities of layers by offsetting them at the flank, leading to a permeability anisotropy along 2-D stylolite planes. Suture/sharp peak stylolites can create fluid barriers if they collect enough sealing material. However, if the collecting material does not seal or if spikes offset the sealing material the stylolite leaks. We propose that our classification can be used to realistically estimate chemical compaction in reservoirs and gives an indication on how heterogeneous the permeability of stylolites can be.
Keywords: Stylolite Permeability Compaction Classification Zechstein Reservoir
2
1. Introduction
Stylolites are rough or wavy dissolution seams (Fig. 1) that develop during localized intergranular pressure solution (Stockdale, 1922; Dunnington, 1954; Park and Schot, 1968; Merino, 1992; Railsback, 1993; Gratier et al., 2005). They are visible in rocks because the stylolite collects material that dissolves slower than the host rock, and this material often has a dark colour (because it typically contains clay, mica, oxides). Stylolites are very common in rocks that have undergone diagenesis (sedimentary stylolites parallel to bedding) or tectonic strain (tectonic stylolites that are usually at an angle to bedding). Limestones are very prone to be strongly affected by stylolites, which are ubiquitous in most carbonate rock types. However, stylolites can also develop in other rock types such as sandstones, shales or evaporites (Young, 1945; Heald, 1955; Wright and Platt, 1982; Rutter, 1983).
Stylolites are important because (1) they are indicative of the amount of chemical compaction or
shortening that a rock has experienced (at the stylolite, Rispoli, 1981; Petit and Mattauer, 1995); (2) they can be used to calculate overburden or tectonic stress (Schmittbuhl et al., 2004; Renard et al., 2004; Koehn et al., 2007, 2012; Ebner et al., 2009a, 2010a; Laronne Ben-Itzhak et al., 2012; Beaudoin et al., 2016) and (3) they may constitute fluid-flow pathways or barriers and thus affect the permeability distribution of the host rock (Carozzi and Vonbergen, 1987; Alsharhan and Sadd, 2000). Chemical compaction here refers to the dissolution at the stylolite interface, and concomitant material precipitation in pores or is transported out of the system, leading to overall compaction. On the outcrop scale, stylolites are planes that during dissolution collect relatively insoluble material that has different properties than the host rock so that the overall rock becomes anisotropic. The simplest example for this anisotropy is the tendency of stylolite-bearing rocks to break along stylolite planes (Baud et al., 2016). This weakness of the stylolite plane and its tendency to fracture may be enough to enhance fluid flow along the stylolite plane. In addition, accumulation of materials, such as clays, on the stylolite plane may reduce the permeability perpendicular to the stylolite plane (Dunnington, 1967; Nelson, 1981; Koepnick, 1987; Finkel and Wilkinson, 1990; Dutton and Willis, 1998; Alsharhan and Sadd, 2000), although the flanks of teeth may be areas of increased permeability (Carozzi and Vonbergen, 1987; Dawson, 1988; Raynaud and Carrio-Schaffhauser, 1992; Van Geet et al., 2000; Gingras et al., 2002; Harris, 2006). Other studies found no effect of stylolites on a rock's overall permeability (Lind et al., 1994; Heap et al., 2014).
Stylolites are dynamic interfaces with self-affine properties. They are typically rough on the small scale and flat on the large scale (Renard et al., 2004, Schmittbuhl et al., 2004, Ebner et al., 2009a, b, Rolland et al., 2012, 2014). The growth of the roughness is triggered by heterogeneities in the rock, for example impurities that affect dissolution, the grain size distribution or the solubility of different components. Recent research based on analytical and numerical analyses suggests that these heterogeneities may trigger localized dissolution (for example through a chemical effect) and thus lead to the development of the stylolite plane in the first place (Aharonov and Katsman, 2009). The noise that pins the interface (Ebner et al., 2010b) leads to preferred dissolution at mainly one side of the stylolite and thus produces the growth of teeth (Koehn et al., 2007). Noise can be differences in grain size, different mineral grains, fossil particles, porosity, etc. Surface and elastic energies counteract the development of roughness in favor of a flat surface. Surface energy dominates on the small scale (μm) and the stylolite surfaces at this scale are relatively rounded, whereas elastic energy takes over on the large scale (typically several μm to mm) where the stylolites become first rough (Schmittbuhl et al., 2004; Koehn et al., 2012) with pronounced teeth or spikes and then flat again on the m- to tens of m-scale. This scale transition also happens through time. The stylolite roughness initially grows very slowly in the surface-energy dominated, non-linear regime (unless the grain size is very large) with a growth exponent of about 0.5 (Ebner et al., 2009b). Once the growing wavelength of the stylolite has reached a critical scale, the amplitudes start to grow in the elastic energy dominated regime where the roughness grows faster (growth exponent around 0.7 to 0.8; Koehn et al., 2007). Although Koehn et al. (2007) proposed that the growth law can be used to estimate the amount of compaction at a stylolite, the estimate is not very precise, owing to its non-linearity and the fact that the parameters are based on numerical simulations only. However, if a larger object (such as a grain or fossil) pins the stylolite surface, the growth becomes linear and the full stylolite compaction can be determined (Koehn et al., 2012). The following question arises: how to identify the growth dynamics of a specific stylolite in order to be able to estimate its compaction?
3
Fig. 1. Examples of variable stylolite shapes from the Zechstein cores. a) different roughness amplitude stylolite with a
self-affine roughness and multiple wavelengths. b) extremely long teeth with remnants of sedimentary layers at the tips of teeth. Teeth have very straight flanks. c) rectangular stylolite with remnants of layers at stylolite teeth tips. Some veins are visible at teeth flanks.
Table 1. Statistical data of stylolites from two reservoir cores, with quantification of dissolution. Data is shown for cores A and B and as an average of both cores. The first column shows the depth range of recovered core, while the second column displays the effective core length that could be used for the calculation (i.e. discounting gaps and material broken while drilling). The third column shows the number of stylolites followed by the stylolite density (number of stylolites per meter). The next column lists an estimation of average teeth heights using the maximum teeth height per stylolite and the sum of all teeth heights per core. The last two columns summarize quantifications of dissolution (as the percentage of vertical shortening due to rock dissolution associated with the stylolites). The first approach uses just the sum of the teeth height whereas the second approach uses the linearly tracking stylolites and interpolates their dissolution to the non-linear growing ones (see main text for further information).
Core Depth Eff.
length Nb stylo Density (nb/m) Av. max. teeth height Sum teeth
height Dis % lin
Dis % non-lin (av. track 1.43 cm)
A 3908–3966 m 43.07 m 766 18.3 0.17 cm 128 cm 3.01 25.43
B 3897–4019 m 72.62 m 1988 26.3 0.21 cm 447 cm 5.62 39.15
A + B – 115.69 m 2754 22.3 0.19 cm 575 cm 4.32 34.04
Several classifications of stylolite shapes exist (e.g. Park and Schot, 1968; Alsharhan and Sadd, 2000; Vandeginste and John, 2013). The classification of Park and Schot (1968), which is also used by Vandeginste and John (2013) uses up to six different shapes (rectangular up and down, seismograph, wavy, sutured, sharp-peak). It is, however, not always easy to apply and is not consistent with an understanding of the dynamics of stylolite evolution. Alsharhan and Sadd (2000) use a much simpler classification (rectangular or
high-amplitude; solution seams or wave-like; wispy seams or horse-tail), which also incorporates the connectivity of stylolite networks. However, this classification is very general and does not include realistic compaction estimates, because the authors do not separate linear from non-linear amplitude growth (Koehn et al., 2012). Ignoring this may lead to significant under- estimates of the actual chemical compaction at a stylolite. A more sophisticated stylolite classification is needed to achieve realistic estimates of chemical compaction and sealing in stylolite-dominated rocks. Using a variety of stylolites from Zechstein cores from a lean gas field in northern Germany in combination with a large collection of stylolites from a range of field areas around the world, as well as a series of numerical simulations, we present a new classification of stylolites that is coherent with their formation, that allows the separation of non-linear from linear growth and that can be used to estimate the stylolite's influence on rock permeability.
4
Fig. 2. Stylolites influence fluid flux and reactions. a) dissolution holes at stylolite teeth (arrow points core downwards). b)
vein at tooth flank indicating potential fluid flux along teeth flanks, c) SEM picture with light grey representing calcite and darker grey dolomite (the stylolite itself in black). Recrystallization is different on both sides of the stylolite. d) another example with the same settings as c, where the calcitization (de-dolomitization) changes across the stylolite.
2. Natural examples
We studied six reservoir cores of the Zechstein 2 carbonates unit (Ca2), also called Stassfurt carbonate, located at the southern margin of the southern Permian Zechstein basin (Ziegler, 1990; Taylor, 1990). The cores are provided by ExxonMobil Production Germany and their exact location is not provided here due to confidentiality. One of the cores is from 3720 to 3750 m below surface and the other five from 3950 to 4050 m approximately. The Ca2 sediments were deposited on paleosurfaces of the Werra Anhydrite and are sealed by the overlying basal Anhydrite (Sannemann et al., 1978). They represent slope deposits (Strohmenger et al., 1996) and form an important lean gas reservoir. After the initial sedimentation in the Permian, these deposits were subject to fast subsidence in the Mid Triassic (down to 2500 m), slow subsidence at the beginning of the Cretaceous (down to 3800 m), fast subsidence in the Mid Cretaceous reaching the maximum burial depth (at about 4700 m) and an uplift event at the end of the Cretaceous up to 3750–4000 m followed by only minor events up to the present (Bruns et al., 2013). The original limestone units with an initial porosity of up to 42% (Bruns et al., 2013) have first been dolomitized and later on calcitized (dedolomitized) with evidence for several phases of fracturing and fluid fluxes that partly resulted in leaching and fracture healing (by formation of veins and precipitation of ore minerals, for example galena). The studied cores contain abundant sedimentary stylolites of various shapes and a smaller number of tectonic stylolites. The amplitude of the sedimentary stylolites varies by more than an order of magnitude, ranging from small mm-amplitude stylolites to those having teeth taller than 40 mm. Most of the high-amplitude stylolites contain a large amount of dark material at the teeth (Fig. 1a, c; rectangular after the classification of Park and Schot, 1968, whereas the small stylolites show roughness on several scales (Fig. 1c, sutured or sharp peaked after Park and Schot (1968)) with some having larger amplitudes. We studied stylolites in two cores in detail (Table 1) where we report the number of stylolites per meter and used their amplitudes to estimate the degree of chemical compaction. A conservative estimate of the
compaction uses the sum of the maximum amplitudes of all stylolites' teeth as a quantification of vertical dissolution, and relates this number to the studied core length. The results show a relatively low effect of stylolites that only account for 3.0 to 5.6% of core compaction. However, if we use a new calculation method that is explained below, the chemical compaction at the stylolites can be estimated to be in the order of 25 to 39%, almost one order of magnitude more than the conservative estimate.
5
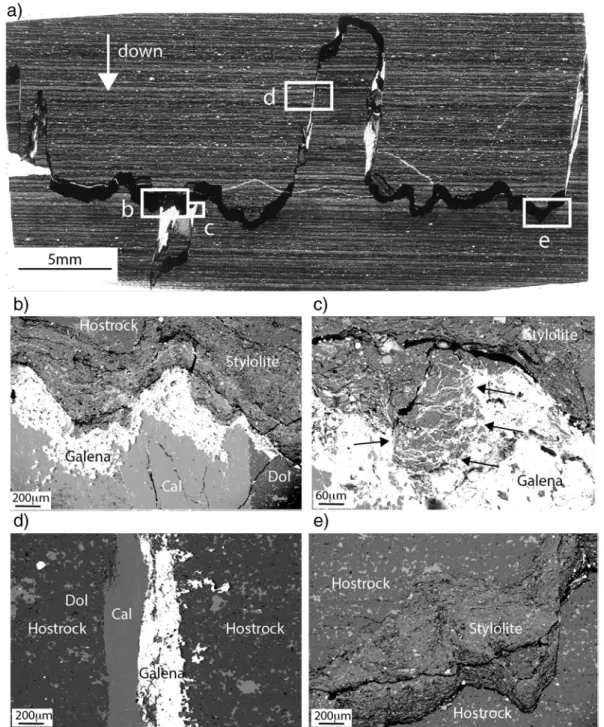
Fig. 3. Precipitation of galena in a stylolite from the Zechstein cores. a) shows an overview of the stylolite with pronounced
teeth and thick dissolution seams. b) below the seams at the end of a tooth flank, precipitation of galena indicates that the fluids cannot breach the stylolite and that the stylolite forms a local barrier. c) detailed view of b) where arrows show how the galena-carrying fluids infiltrate the sealing material but cannot breach it. d) tooth flank with galena indicating that the fluids travel along teeth and the stylolite leaks at the flanks of teeth. e) close up of the stylolite seam with no galena. Cal is calcite and Dol dolomite.
Several factors indicate that the stylolites do influence fluid fluxes (Fig. 2). Dissolution holes that are located at stylolite teeth are probably produced by leaching fluids (Fig. 2a). In this case the stylolite may form local barriers for fluid flow so that the fluids remain longer below teeth and thus have time to produce the holes. The second indicator are veins that are often found on the flanks of stylolite teeth (Fig. 2b). This indicates that the flanks of teeth are potentially dilatant sites that are used as fluid pathways. The stylolites also influence at least the late stage calcitization (de-dolomitization, Fig. 2c, d), where the stylolite itself seems to protect the dolomitized phase and both sides of the stylolite show different amounts of calcitization. A late stage
hydrothermal fluid in the Zechstein cores leads to the precipitation of galena (PbS) in fractures. Fig. 3 shows a stylolite with pronounced teeth and a relatively thick seam. The galena precipitates below the stylolite seam (Fig. 3b) and can only infiltrate the margins of the seam (Fig. 3c). Galena also precipitates in cracks along the teeth flanks and can be found all along these flanks (Fig. 3d). No galena is observed in stylolite seams away
6
from the flanks (Fig. 3e). We argue that this is a striking example of the differential permeability stylolites can exhibit: galena is a tracer for fluid migration at this stylolite and its distribution suggests fluids travelled along the teeth flanks, but were not able to cross the stylolite seam that acted as a local barrier. In summary, the
stylolites show evidence of a pronounced influence on reactions and fluid fluxes through the Stassfurt carbonate at least on the local (stylolite) scale.
3. Numerical model
We use the software “ELLE – Latte” (Koehn et al., 2003; Bons et al., 2008), with a similar setup to the work of Koehn et al. (2006, 2007, 2012) and Ebner et al. (2009b), for the simulations presented here. The model for roughness evolution of stylolites is two-dimensional with dissolution triggered at an initially flat interface. In this contribution, we expand the model from previous work to include stylolites that nucleate and grow in a rock that has layers that dissolve at variable dissolution rates. We then compare the growth of layer-dominated stylolites with previous studies of uniform and bimodal stylolite growth in order to derive a classification of stylolite shapes that can be used for quantitative calculations. As discussed in the introduction, the roughening of stylolites is initiated by pinning material in the host rock, otherwise elastic and surface energies as well as normal stress gradients would keep the surface flat. Pressure-solution cleavages are an example of such flat interfaces in real rocks, where the roughening component is missing. Sedimentary layer boundaries as such are stable and remain flat during dissolution, unless the layers contain additional heterogeneities at a smaller scale. In the model, we initiate layer dissolution within a layer and not at the boundary. Compression in the model is vertical with displacement-controlled deformation assuming a sedimentary overburden. The left- and right-hand boundaries are friction free (Fig. 4). The solid (the stressed rock) is described by a lattice spring model where circular particles of a uniform size are connected to each other by six linear elastic springs that
experience normal and shear forces (Fig. 4; Sachau and Koehn, 2014). The model lattice is triangular with horizontal rows of particles where each second row is offset. The springs are used to calculate the local stress field at a particle and its elastic energy Eel from the strain tensor uik according to (Landau and Lifshitz, 1986)
𝐸𝐸𝑒𝑒𝑒𝑒=12λ1(∑ 𝑢𝑢𝑖𝑖 𝑖𝑖𝑖𝑖)2+λ2∑ 𝑢𝑢𝑖𝑖,𝑘𝑘 𝑖𝑖,𝑘𝑘2 (1)
where λ1 and λ2 are the Lamé constants. Particles that are not connected by springs (for example those at the stylolite interface) experience repulsive forces once they come into contact. Particles along the stylolite interface have a surface energy. The surface energy Es of an interface particle is calculated from the average curvature ρ of the interface (Koehn et al., 2007), according to
𝐸𝐸𝑠𝑠= 𝛾𝛾1𝜌𝜌, (2)
with γ being the interfacial free energy between fluid and solid. For the interface dissolution it is assumed that transport of material is instantaneous and that the pore space is large enough for material to precipitate. Dissolution of particles at the interface is a function of the difference in elastic energy between a stressed and a non-stressed solid, differences in surface energy between a flat and a curved interface (with a convex interface driving dissolution and a concave interface driving precipitation) and differences in normal stress along the whole interface assuming that the fluid is, on average, saturated. Each particle has a given mass, which is used to calculate which particle dissolves fastest during a time step. Only the fastest-dissolving particle is removed from the model, after which the solid is relaxed and the next particle can dissolve. A linear rate law with a given rate constant is used to calculate the dissolution rate Di according to
𝐷𝐷𝑖𝑖 = 𝑘𝑘𝑖𝑖𝑉𝑉𝑠𝑠�1 − 𝑒𝑒𝑒𝑒𝑒𝑒−∆𝜎𝜎𝑛𝑛𝑉𝑉𝑠𝑠−∆𝐸𝐸𝑅𝑅𝑅𝑅 𝑠𝑠−∆𝐸𝐸𝑒𝑒𝑒𝑒�, (3)
with ki being the dissolution rate constant of the particle i, Vs the molecular volume of the solid, R the universal gas constant, T the temperature, and σn the normal stress across the interface (Koehn et al., 2003, 2007, 2012). There are several assumptions in this model. The aim of the modeling is to study the roughness evolution of a single stylolite, so that the initial dissolution does start at a given flat interface. In a real rock this localization of dissolution could happen at the boundary of a sedimentary layer or at several horizontally aligned clay particles in a rock. The kinetics of the model are limited by dissolution, because transport and re-precipitation of dissolved material are not included. This means that the model has no “real” time scale. However, we argue that the roughness evolution is a function of the compaction of the rock as long as (i) material can precipitate in pores or is taken away and (ii) the stylolite has enough time to grow. This is discussed in more detail in
Koehn et al. (2007, 2012). We also note that Eq. (3) contains differences in normal stress as well as differences in elastic and surface energy. In the model presented here, the difference in normal stress across the interface is given as the difference between the normal stress at a given particle and the mean normal stress of the whole
7
interface. This approach assumes that the fluid is saturated with respect to the stressed solid. It turns out that with this approach the magnitudes of the normal stress difference and the Helmholtz free energy difference (elastic and surface energy) are of the same order. Koehn et al. (2007, 2012) compared the scaling of this modeling approach with an analytical solution and data from natural stylolites, and found that the natural scaling can only be reproduced if this approach is taken.
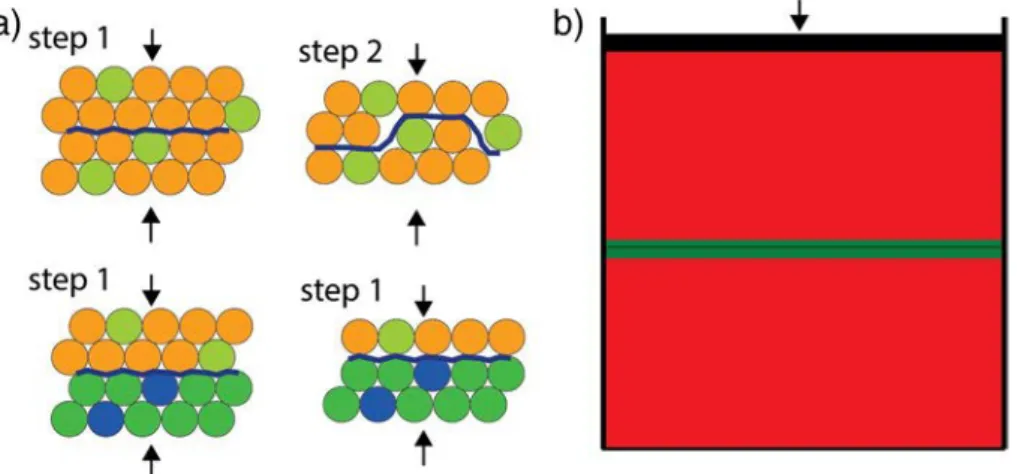
Fig. 4. a) sketch of part of the numerical lattice (round discs) with the initial stylolite interface (blue line). Particles have
different dissolution constants, with the light green particles representing those that dissolve slower. The upper setup produces small-scale roughening and complex dissolution of either particle below or above the interface depending on their dissolution constants. The lower model shows an added layer where all the particles below the stylolite belong to a layer that dissolves slower. Blue particles represent smaller noise in the layer, these dissolve even slower than the rest of the layer. The layer “pins” the interface so that all particles above the stylolite dissolve. b) shows model setup with the layer in the center (in green). The stylolite starts within the layer. (For interpretation of the references to colour in this figure legend, the reader is referred to the web version of this article).
The final input into the model is the representation of heterogeneities in the rock (quenched noise).
Heterogeneities in the model are described by a variation of the dissolution constant in Eq. (3). A variation of this parameter will typically represent different minerals or grains in the original rock. Quenched noise is added to the system in three different ways (Fig. 5a). The smallest noise is set on the particles themselves, so that a given number of particles in the model has a dissolution constant that is a factor x smaller than the overall dissolution constant. This variation represents the presence of different minerals with different dissolution rates in a real rock. A larger-scale noise can be put on “grains” that are inherited from the initial microstructure, where grains consist of a given cluster of particles that have a different dissolution constant than other grains (Koehn et al., 2012). Lastly, whole horizontal layers (for example bedding in a real rock) can have different dissolution constants relative to the rest of the model. We generally apply at least two noises, having a small-scale noise in addition to either larger-scale regions or layers. Noises are overlapping, so that, for example, the grains themselves also contain a smaller scale noise (Figs. 4, 5). Noise is essential for roughening as the system does not develop stylolites without noise.
4. Results
We performed about 100 simulations with mainly layer-dominated stylolite growth. All simulations have a lattice size of 200 particles in the x-dimension (overall lattice has 46,000 particles), last for 30,000 time steps and start with a row of particles taken out in the middle of the model. Parameters of the simulations are: dissolution constant for calcite is 0.0001 mol/(m2 s), the molar volume for calcite is 0.00004 m3/ mol, the temperature is 500 K, the surface free energy is 0.27 J/m2, the Poisson ratio is 0.33 (a numerical necessity), the Young's modulus is 40 GPa and the real physical width of the system is 10 mm (Koehn et al., 2007, 2012). These parameters represent dissolution of an average limestone at the given temperature and its elastic properties. Note that within a range likely for natural rocks, the chosen value for the Young's modulus will have only a negligible effect on the shape and growth of the modeled stylolites presented here.
8
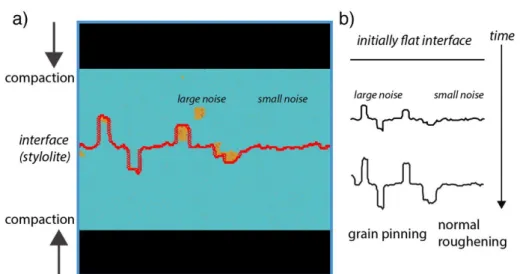
Fig. 5. Simulation run with stylolite in red, lost material of the original box in black (displacement on upper and lower
boundary), background material in blue and slower dissolving small and larger scale noise in orange. Normal small-scale roughening develops on the right hand side with very slow amplitude growth. Larger grains are pinning as soon as they meet the interface and record part of the compaction. The large tooth on the left hand side records half of the dissolution on the stylolite (illustrating that teeth that grow from the median surface always represent only half the dissolution). (For interpretation of the references to colour in this figure legend, the reader is referred to the web version of this article).
4.1. Normal roughening and grain pinning
Normal roughening of stylolites and grain pinning has been discussed in detail in Koehn et al. (2007, 2012) and Ebner et al. (2009b). By pinning we mean that a slower-dissolving particle or particle cluster sits on one side of the interface so that only the other side dissolves. This leads to a relative movement of the pinning point away from the average interface. In our models we push from the upper and lower boundary, so that the average interface remains in the middle of the model. Teeth then grow downwards if pinning particles come from above the interface and they grow upwards if pinning particles meet the interface from below. We give one example of grain pinning and small-scale roughening in order to discuss the differences and similarities with the layer-dominated growth. In this example the background noise on particles is set such that 10% of particles dissolve at a velocity of 80% of the matrix and 5% of the larger grains also dissolve slower (Fig. 5). The roughening behavior of the interface changes completely from small-scale roughening, with only small pinning particles meeting the interface, to larger-scale roughening when a large pinning grain enters the stylolite. Small-scale roughening can be seen on the right hand side in the simulation of Fig. 5a and b, where no larger grain meets the interface. The growth of the roughness amplitude is very low, because pinning is happening from both sides of the interface so that pinning particles meet each other, and elastic and surface energies are also high enough to dissolve single pinning particles. The amplitude of the stylolite on the right hand side does not resemble the dissolution that has happened at the interface. Amplitude growth is strongly non-linear and chemical compaction would be underestimated significantly. On the left hand side larger-grain pinning dominates the stylolite. The length of a tooth depends on the time when the grain reaches the stylolite and how fast the grain itself is dissolving. The tooth on the very left hand side shows almost the full dissolution that is happening at the interface from one side, because the grain met the interface early on and is still pinning. Note, however, that a tooth growing from the median plane of the stylolite can only capture half of the
dissolution. In order to get the full chemical compaction one has to either measure the distance from a downwards tooth to an upwards tooth or use the distance between median surface and the largest tooth and multiply by two.
9
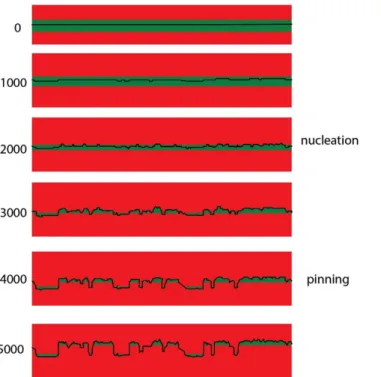
Fig. 6. Illustration of layer pinning. Initially the stylolite starts within the layer and roughens (the layer also needs to be
heterogeneous; nucleation stage). Once the stylolite breaches the layer on one side the layer starts to pin. The slower dissolving material is located at the growing side of the teeth (top of teeth if growing upwards, bottom of teeth if growing downwards). Once the layer pins the growth is linear with respect to the boundary displacement and the teeth track the full compaction of the model system.
4.2. Layer pinning
In order to simulate the growth of layer-induced stylolites that we find in the Zechstein cores, we insert an initially horizontal layer in the model. Its thickness is 6% of the overall box height so that the layer is 0.6 mm thick in real space. Noise in the matrix is set such that 10% of particles dissolve slower by an amount of 80% to 99.9% of the matrix dissolution. The layer itself contains the same particle noise and in addition all particles of the layer dissolve 56% to 80% slower than the matrix. The stylolite starts within the slower dissolving layer (Fig. 6). Due to the lattice configuration the initial interface is not positioned exactly in the middle, but is just above the middle. This means that the stylolite has to dissolve a little bit less of the layer on the upper side. The initial roughening is triggered by the particle noise within the layer and a small wavelength develops while the layer is being dissolved. At some point of increasing wave amplitude, the dissolution surface reaches the matrix either above the layer (at stylolite peaks) or below the layer (at stylolite troughs). A peak means that parts of the layer are still present below the stylolite and a trough means that parts of the layer are still present above the stylolite. Because the initial stylolite seed was not exactly in the middle of the layer, the stylolite reaches the upper edge of the layer earlier and has more layer material below than above itself. This initial roughening stage is very slow, the amplitude growth is non-linear and dissolution will be underestimated if the amplitude height is used as a compaction estimate. We term this initial roughening stage nucleation. The duration of this nucleation stage depends on the thickness of the layer.
10
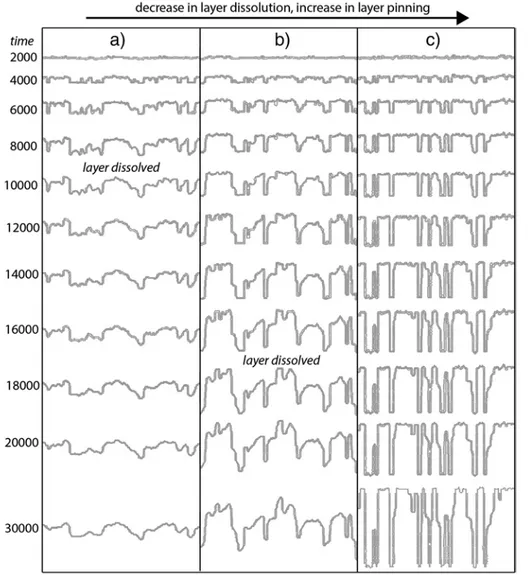
Fig. 7. Evolution of three different simulations with initial layer pinning. Layer pinning increases from left to right hand
side. If the layer dissolves (cases a and b) the stylolite amplitude growth stops and the corners are rounded. If layer pinning continues (c) the teeth can become very spiky and track almost the full compaction (with the exception of the initial non-linear roughening during the nucleation stage in the layer).
Once the stylolite has reached the edge of the layer, the layer is pinning the interface because it dissolves slower than the matrix. This means that all the teeth that reach the matrix above the stylolite will grow relatively upwards and all teeth that reach the matrix below the stylolite will grow downwards. Now the stylolite is recording the full compaction and the growth of teeth is linear and “fast”. The width of the teeth is a function of the initial roughening of the stylolite in the layer and varies from single pinning particles to the largest wavelength that the roughening achieved during the nucleation stage, in our simulations up to about 1/5th of the width of the simulation (2 mm). The width is restricted by the system size (in our case the 200
particle-wide box), so that real systems with a much larger size can develop wider teeth (Fig. 1). The roughness of the teeth themselves depends on the initial particle noise in the system. The teeth are only flat in the simulations if this initial noise is very low (10% of particles dissolve with a dissolution of 99% to 99.9% of the matrix). This suggests that the stylolite in Fig. 1a grows in a rock that does not have much noise on the small scale (few heterogeneities). Pinning of the stylolite produces the typical rectangular stylolites of Park and Schot (1968) with residual material at the teeth. Rectangular upwards has residue below the teeth and rectangular downwards has residue above the teeth. Whether or not a stylolite is dominated by one or the other (upwards or downwards) depends on its initial position relative to the layer.
Once a stylolite reaches the stage where the layer is pinning the interface, the teeth record the chemical compaction history in a linear way and they can become very long (Fig. 1b). However, the pinning layer may also dissolve, even if its dissolution is much slower than that of the matrix. This means that the stylolite will start to lose its pinning capabilities (Fig. 7). Once the layer is gone the stylolite becomes almost stationary with only small changes at the corner of teeth making it rounder (Fig. 7a, b). The roughness growth that is triggered by
11
the background noise (on the particle scale) is very slow and non-linear and cannot change the large amplitude that was produced by the pinning layer. The stylolite has an unusual shape and only records part of the compaction history (Fig. 1b may be an example, large amplitude stylolite).
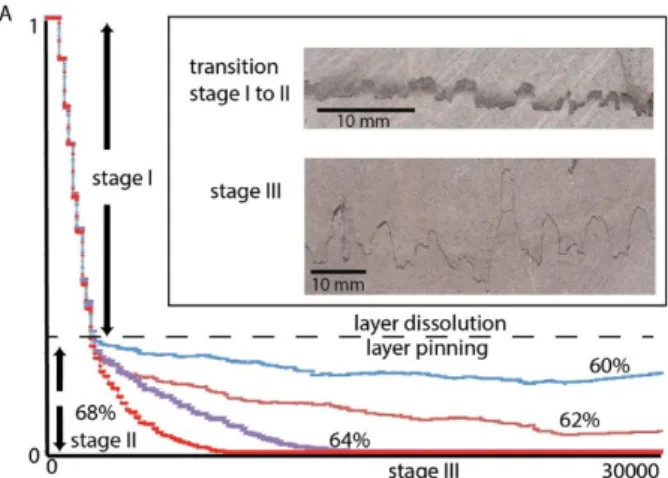
We separate the growth of layer-dominated stylolites into three stages (Fig. 8): stage I represents the nucleation stage where the stylolite roughens within the layer, stage II is the pinning stage when the stylolite records the chemical compaction in a linear way growing fast and stage III is only reached once the layer is fully dissolved and the stylolite becomes stationary. The transition between stages II and III depends on how easily the pinning layer is dissolved. In the four cases shown in the graph of Fig. 8, numbers represent the factor by which the layer dissolves slower than the matrix. At 60% and 62% the layer dissolution is too slow and the stylolites continue growing their teeth and pinning. At 64% the layer dissolves slowly so that only part of the compaction history is recorded. At 68% the layer dissolves fast and the teeth only record about 1/6th of the compaction history. We illustrate the transition between pinning and dissolving layers in the simulations in a graph of matrix noise (noise on the particle scale) versus layer noise (Fig. 9). The graph shows that the layer has to dissolve slower if the matrix noise is low in order for the layer to pin, whereas with a higher background noise the layer dissolution can be less in order for it to pin. The relation is non-linear and indicates that the layer cannot pin if there is no matrix- or particle-scale noise. A transition zone exists where the layer is partly dissolved but still has some pinning teeth. This produces shapes that are similar to the “seismogram” type of Park and Schot (1968), with a median surface that produces “normal” non-linear background roughening and some pronounced teeth. The roughness in these stylolites is developing on two very different scales or amplitudes (Fig. 10). This shape is also similar to stylolites that grow in a rock with bimodal noise, with a particle noise and a noise on the larger scale, for example large grains (Fig. 5) or fossils.
Fig. 8. Plot of the dissolution of the layer area (A) versus model time (t) and two stylolite examples. Curves for four
different stylolites are shown with a variable dissolution constant of the layer, where the layer dissolves with a rate constant of 60% to 68% of the matrix. The dissolution takes place in three distinct stages. Stage I represents the initial roughening of the stylolite within the layer with non-linear growth and loss of layer material. All stylolites behave the same during this stage. Stage II represents the pinning stage with very slow loss of layer material and linear growth. Strongly pinning layer stylolites remain in this stage (layer factor 60% to 62%). If the layer dissolves the stylolite enters stage III and amplitude growth “freezes”. Two natural stylolite examples are given in the inset. The upper stylolite shows layer remnants on the upper and lower sides of teeth with exactly the same geometry as those of the numerical model in Fig. 6. This stylolite is at the transition from the initial nucleation to pinning and fast growth. The lower stylolite in the inset has only very minor remnants of layers at peaks and otherwise shows a relatively round roughness. This stylolite is typical of stage III, where the corners are smoothened but amplitude growth freezes.
12
Fig. 9. Graph showing pinning strength of the matrix versus pinning strength of the layer. Pinning strength is represented by
a linear factor that is multiplied by the dissolution rate of each particle (1 represents 0 pinning strength). For the matrix 10% of particles dissolve a factor x times the dissolution-rate of the matrix. For the layer all particles in the layer dissolve a factor x times the dissolution-rate of the matrix (the layer also contains 10% of particles that dissolve slower than the rest of the layer). The relationship is non-linear where a smaller pinning strength is needed for the layer if the matrix pins more, whereas higher pinning strength is need if the matrix noise is low. A relatively large transition zone exists where seismogram type stylolites can develop that have only partly layer pinning.
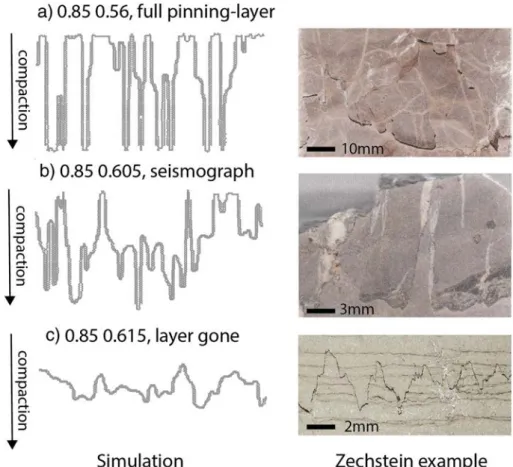
Fig. 10. Three distinct stylolite shapes that develop in the model and their counterparts in the Zechstein cores are shown. The
first number in the headings represents the matrix noise and the second number the layer pinning strength (with 1.0 meaning no pinning). a) Full pinning results in extreme spikes. b) If only parts of the layers survive seismograph stylolites develop. c) Once the layer dissolves completely, the resulting stylolites have an unusual shape and are not growing any more, even if dissolution/compaction continues. The amplitudes cannot grow but the teeth become rounder.
13
5. Discussion
5.1. Classification
Based on our simulations and observations of stylolites in the Zechstein Ca2 cores as well as observations of a large collection of stylolites from a range of field areas around the world, we present a new classification of stylolite shapes (Figs. 11, 12). This classification refines the original one by Park and Schot (1968), does not take interconnection between stylolite into account, and proposes only four types of stylolites: (1) rectangular layer, (2) seismogram pinning, (3) suture/ sharp peak and (4) simple wave-like. Rectangular layer stylolites (type 1) is a sensible class without the addition of facing up or downards. Up or downwards facing varies even within a single stylolite and has no significant meaning. The addition of the term “layer” to the classification of rectangular stylolites is important, because some rectangular-looking stylolites can also develop from normal roughening, and they have different properties than the typical layer dominated ones. In the absence of a recognizable remnant layer, such rectangular-looking stylolites classify as suture and sharp peak type. Seismogram pinning (type 2) implies that the stylolite experiences noise on several very different scales and this is important for compaction estimates. A seismogram pinning stylolite in our classification typically has a median surface with small-scale roughening and one or several large teeth with a pinning source. The
rectangular and seismogram pinning stylolite types were merged in a single class by Alsharhan and Sadd (2000).
Suture and sharp peak (type 3) stylolites should represent one single class, because it is not clear when a stylolite is sutured and when it is sharp peaked. In the simulations the shapes can result from the same noise and hence differentiating them is not useful. This class would incorporate normal growing stylolites (with only small scale noise) as well as layer-growth stylolites where the layer is gone. The latter are hard to distinguish from normal roughening stylolites, and therefore they are both included in one single class. The final type (4) are the simple wave-like stylolites, which are not very common in the Zechstein cores (less than 2% of stylolites) but are frequent in many other carbonate areas. The first two classes, rectangular layer and seismogram pinning typically show signs of pinning grains, fossils or layers. The last two types, suture/sharp peak and simple wave-like do not show evidence of larger scale pinning structures and only sometimes develop straight teeth.
5.2. Compaction
The advantage and purpose of our stylolite classification is that it can be directly used for compaction estimates. Rectangular layer stylolites pin best and grow linearly as a function of chemical compaction along the stylolite. They can be used to get a realistic chemical compaction estimate for rocks (for the stylolite
compaction) and may be representative for dissolution on the other stylolites as well (i.e. those that belong to the other types). Compaction may still be underestimated even when type (1) stylolites are used, because their nucleation stage involves non-linear growth (however, this initial growth stage may be minor). The second class, seismogram pinning type stylolites, typically have a bimodal roughness. Similar to rectangular stylolites the pinning teeth may represent most of the actual compaction. This is especially true if the teeth contain remnants of layers. If the teeth represent fossils or grain pinning, then only part of the compaction is recorded, from the moment the fossil or grain meets the stylolite up to when compaction stops. In these cases the longest teeth give the most reliable estimates of the minimal compaction. Seismogram pinning stylolites often have a median surface. If this surface can be identified, then only one tooth is enough to measure compaction. The amount of compaction on the stylolite is at least two times the distance between the tooth tip and the median surface. The longest tooth will always be the most reliable estimate. The last two classes of stylolites are less suitable for compaction estimates. Class 3, normal suture and sharp peak type stylolites grow non-linearly. Therefore a simple measurement of the roughness amplitude is not representative for the amount of dissolution on the stylolite (Koehn et al., 2007, 2012). However, the compaction A can still be estimated using the scaling law of Koehn et al. (2007) and Ebner et al. (2009b):
𝐴𝐴 = 𝑒𝑒 �𝑤𝑤𝑒𝑒� 1
𝛽𝛽𝑙𝑙, (4)
where l is the grain size, β a growth exponent (0.5 in the small scale regime and up to 0.8 in the large scale regime), x a compaction pre-factor that has a value of around 15 in simulations of Ebner et al. (2009b) and w the mean width of the interface according to
14
𝑤𝑤(𝐿𝐿)= �1𝐿𝐿∑ �ℎ(𝑖𝑖) − ℎ��𝐿𝐿𝑖𝑖=1 2 (5)
with L being the number of points measured along the stylolite, h the height of point i and ℎ� the average height of the interface (larger amplitude stylolites have a higher mean width). For example, in the Zechstein, a small stylolite with a mean width of 1 mm, a grain size of 0.01 mm and a growth exponent of 0.8 does represent 4 to 5 cm of local chemical compaction. In the Zechstein cores this compaction estimate on a small suture or sharp peak stylolite then gives the same order of compaction as the rectangular layer types (up to 4 cm). This may mean that all stylolites have experienced a similar chemical compaction.
We studied two Zechstein cores in detail (Table 1) and measured 2754 stylolites. The vertical compaction or dissolution of the core as a function of stylolites gives a value ranging between 3.0 and 5.6% in the case where only the maximum teeth height of every stylolite is taken into account (with an average of 4.3% for both cores). These values probably strongly underestimate dissolution. If we use all tracking stylolites in these cores (only 2% of stylolites) that belong to type 1 or 2, we derive at a mean linear dissolution of 1.43 cm at these stylolites. Assuming that the other non-linearly growing stylolites show a similar dissolution, the compaction estimates are 25 and 39% for the two cores (with an average of 34% for both cores). If one compares the chemical compaction estimate at stylolites with the initial porosity estimates of the Zechstein carbonates of up to 42% (Bruns et al., 2013), these values indicate that dissolution at stylolites is the
dominant compaction process in these rocks. In addition, these values indicate that material that dissolves at stylolites does not have to leave the system but can fill pore space adjacent to the stylolite plane. However, more tests are needed in order to improve the reliability of these first estimates. Simple wave-like stylolites are the worst for compaction estimates, because they may represent dissolution seams that have not seen much chemical compaction or they grow highly non-linear with a very low growth exponent and are therefore very unreliable.
5.3. Barriers and leaks
Our classification can also help for assessing the anisotropy of permeability across different stylolites. Figs. 2 and 3 illustrate that the stylolites in the studied Zechstein cores do influence fluid flow locally.
The most important ingredient is the collection of sealing material within the stylolite. If the material is not sealing (as was the case in the study of Heap et al., 2014) the stylolites or part of them cannot be local barriers to fluid flow. A recent study (Martín-Martín et al., in press) shows how the same stylolites can potentially act as fluid flow barriers and later on as conduits at different times during the evolution of a basin. In general stylolites can perform three different structural changes to produce or destroy barriers: (i) they can collect impermeable material and thus build up a barrier, (ii) they can intensify the existing sealing properties of layers and (iii) they can offset existing barriers (Fig. 11). Collecting material and intensifying dissolution creates barriers whereas offsetting destroys barriers. Rectangular layer (type 1) stylolites are characterized by an intensification of barriers at the tips of the teeth and an offsetting of initial layering creating new pathways for fluids along the flanks of teeth. This class of stylolites creates very anisotropic permeabilities (Fig. 3) and can potentially destroy seals. The behavior of the seismograph pinning type (2) is more complicated. As long as layers pin at the teeth the structuring is similar to the rectangular layer type. However, the structuring of the median surface depends on how much material can be collected in the stylolites and what properties that material has. If the material is sealing and the median surface is not very rough, a barrier develops that is only breached at the existing larger teeth. The suture and sharp peak type (type 3) generally collect material. In this case they may create barriers, especially if they do not become very rough and if the collected material is sealing. Local spikes may still breach the barriers (for example see Koehn et al., 2012, Fig. 1b). Simple wave- like stylolites (type 4) may represent dissolution seams, quite often contain insoluble material and can represent original sedimentary layers or other sedimentary or diagenetic surfaces. This class can build good barriers, because the stylolites are not rough and are thus not offsetting the barrier.
15
Fig. 11. Figure showing our proposed classification of stylolites based on the numerical models and stylolite growth
dynamics. a) Stylolites can in general either collect material (that may be sealing), intensify densities of material at the top and bottom of teeth (increasing local sealing potential) or offset layers and thus destroying seals. b) New classification based on Park and Schot (1968). 4 types of stylolites are distinguished: 1) rectangular layer type, 2) seismogram pinning type, 3) suture and sharp peak type and 4) simple wave-like type. The shapes of the different stylolites are shown on the left hand side based on the numerical simulations, whereas the right hand side illustrates the local heterogeneity of permeability across the different types (assuming that the material that the stylolite collects is sealing). Rectangular layer type stylolites offset seals so that the flanks leak whereas the top and bottom of teeth are barriers. Seismogram pinning type stylolites offset seals, but may collect material and thus seal at median surfaces, whereas they may leak across the steep teeth. Suture/sharp peak type collect material that may seal but may leak at sharp peaks and teeth. As they do not have structures that offset any seals, simple wave-like type seal if enough material is present or collected.
A quantitative indicator for stylolite permeability or sealing quality could be the measure of sealing versus non-sealing material along the stylolite. This implies, however, knowledge of the sealing qualities of different parts of the stylolite. In addition, a three-dimensional morphology analysis would be ideal. If we perform a two-dimensional analysis of the stylolites shown in Fig. 1a and b, stylolite 1b has a sealing capability of only 15%, whereas stylolite 1a has a sealing capability of around 75%. Further research is needed in this direction in order to quantify sealing potential and local versus larger-scale permeabilities of these complex structures following the work of Heap et al. (2014).
16
Fig. 12. Comparison of natural examples and numerical models of the 4 proposed stylolite types and indications of their
potential to estimate compaction and their influence on local sealing.
6. Conclusion
Our study shows that stylolites in the Zechstein 2 carbonate units can influence reactions and fluid flux and can be used to estimate compaction. Stylolites typically have three different end-members of noise: background noise on the small-scale (small grains or secondary phases), noise on the larger-scale (large grains or fossils) and noise in the form of sedimentary layers. How these different noises interact and which noise is dominant determines which class of stylolites forms. We present a new classification of stylolites based on our simulations, observations of natural stylolites and the original classification of Park and Schot (1968). Our proposed classification separates stylolites into 4 classes: 1) rectangular layer type, 2) seismogram pinning type, 3) suture or sharp peak type and 4) simple wave type (Fig. 12). Rectangular layer type stylolites develop at layer interfaces, grow linearly, are the best indicators for the actual amount of chemical compaction at stylolites and are offsetting and thus destroying local seals. They typically have a highly variable local permeability with barriers at the tips of teeth and leaks at the teeth flanks. Seismogram pinning type stylolites often contain remnants of layers or pinning grains, typically have a median surface, and their largest teeth can grow linearly so that these teeth can be used for compaction estimates. Their effects on permeability are complicated, since large teeth can offset and destroy original seals but the median surface may also collect sealing material. Suture or sharp peak type stylolites are the most common and can have variable shapes, they develop mainly as a function of a relatively uniform noise without large pinning grains or layers, and they grow very non-linearly so are thus not very accurate for the use of compaction estimates. This class of stylolites can potentially create fluid-flow barriers if they collect enough sealing material during their growth and if local spikes do not breach the barrier. Stylolites of the last class, simple wave-like types, do not show a large roughness and often contain original layer material, so they can be good barriers. They are, however, very hard to use for compaction estimates and may not represent a lot of local dissolution.
Acknowledgements
This study was carried out within the framework of DGMK (German Society for Petroleum and Coal Science and Technology) research project 718 “Mineral Vein Dynamics Modeling”, which is funded by the companies ExxonMobil Production Deutschland GmbH, GDF SUEZ E&P Deutschland GmbH, DEA Deutsche Erdoel AG and Wintershall Holding GmbH, within the basic research program of the WEG Wirtschaftsverband Erdoel- und Erdgasgewinnung e.V. We thank the companies for their financial support and their permission to publish these results. This work has received funding from the European Union's Seventh Framework Programme for research, technological development and demonstration under grant agreement no 31688. The Zechstein data were collected with the help of Simon Gast. We thank Jean-Pierre Gratier and an anonymous reviewer for their comments that improved an earlier version of the manuscript.
17
References
Aharonov, E., Katsman, R., 2009. Interaction between pressure solution and clays in stylolite development: insights from modeling. Am. J. Sci. 309 (7), 607–632.
Alsharhan, A., Sadd, J.L., 2000. Stylolites in Lower Cretaceous Carbonate Reservoirs. v. 69. Society for Sedimentary Geology Special Publication, U.A.E, pp. 185–207.
Baud, P., Rolland, A., Heap, M.J., Xu, T., Nicole, M., Ferrand, T., Reuschle, T., Toussaint, R., Conil, N., 2016. Impact of stylolites on the mechanical strength of limestones. Tectonophysics (in press).
Beaudoin, N., Koehn, D., Lacombe, O., Lecouty, A., Billi, A., Aharonov, E., Parlangeau, C., 2016.
Fingerprinting stress: stylolite and calcite twinning paleopiezometry revealing the complexity of progressive stress patterns during folding-the case of the Monte Nero anticline in the Apennines, Italy. Tectonics 35:1687–1712. http://dx.doi.org/10.1002/2016TC004128
Bons, P.D., Koehn, D., Jessell, M.W., 2008. Microdynamics simulation. Lecture Notes in Earth Sciences, 106. Springer, Berlin.
Bruns, B., Di Primio, R., Berner, U., Littke, R., 2013. Petroleum system evolution in the inverted Lower Saxony Basin, northwest Germany: a 3D basin modeling study. Geofluids 13, 246–271.
Carozzi, A.V., Vonbergen, D., 1987. Stylolitic porosity in carbonates - a critical factor for deep hydrocarbon production. J. Pet. Geol. 10 (3), 267–282.
Dawson, W.C., 1988. Stylolite Porosity in Carbonate Reservoirs: American Association of Petroleum Geologists Search and Discovery Article, American Association of Petroleum Geologists Annual Convention, Houston, Texas, 20–23 March 1988 (Article#91030).
Dunnington, H.V., 1954. Stylolite development post-dates rock induration. J. Sediment. Petrol. 24 (1), 27–49. Dunnington, H.V., 1967. Aspects of Diagenesis and Shape Change in Stylolitic Limestone Reservoirs: 7th
World Petroleum Congress, 2–9 April 1967, Mexico City, Mexico. 2 pp. 339–352 12129.
Dutton, S.P., Willis, B.J., 1998. Comparison of outcrop and subsurface sandstone permeability distribution, Lower Cretaceous Fall River Formation, South Dakota and Wyoming. J. Sediment. Res. 68:890–900. http://dx.doi.org/10.2110/jsr.68.890
Ebner, M., Koehn, D., Toussaint, R., Renard, F., Schmittbuhl, J., 2009a. Stress sensitivity of stylolite morphology. Earth Planet. Sci. Lett. 277 (3–4), 394–398.
Ebner, M., Koehn, D., Toussaint, R., Renard, F., 2009b. The influence of rock heterogeneity on the scaling properties of simulated and natural stylolites. J. Struct. Geol. 31 (1), 72–82.
Ebner, M., Toussaint, R., Schmittbuhl, J., Koehn, D., Bons, P., 2010a. Anisotropic scaling of tectonic stylolites: a fossilized signature of the stress field? J. Geophys. Res. Solid Earth 115 (6), B06403.
Ebner, M., Piazolo, S., Renard, F., Koehn, D., 2010b. Stylolite interfaces and surrounding matrix material: nature and role of heterogeneities in roughness and microstructural development. J. Struct. Geol. 32 (8), 1070–1084.
Finkel, E.A., Wilkinson, B.H., 1990. Stylolitization as source of cement in Mississippian Salem Limestone, West-Central Indiana. AAPG Bull.-Am. Assoc. Pet. Geol. 74 (2), 174–186.
Gingras, M.K., MacMillan, B., Balcom, B.J., 2002. Visualizing the internal physical characteristics of carbonate sediments with magnetic resonance imaging and petrography. Bull. Can. Petrol. Geol. 50:363–369.
http://dx.doi.org/10.2113/50.3.363
Gratier, J.-P., Muquet, L., Hassani, R., Renard, F., 2005. Experimental microstylolites in quartz and modeled application to natural stylolitic structures. J. Struct. Geol. 27, 89–100.
Harris, N.B., 2006. Low-porosity haloes at stylolites in the feldspathic Upper Jurassic Ula sandstone, Norwegian North Sea: an integrated petrographic and chemical mass-balance approach. J. Sediment. Res. 76 (3), 444– 459.
18
Heap, M.J., Baud, P., Reuschlé, T., Meredith, P.G., 2014. Stylolites in limestones: barriers to fluid flow? Geology 42 (1), 51–54.
Koehn, D., Arnold, J., Malthe-Sørrenssen, A., Jamtveit, B., 2003. Instabilities in stress corrosion and the transition to brittle failure. Am. J. Sci. 303, 956–971.
Koehn, D., Malthe-Sørenssen, A., Passchier, C., 2006. The structure of reactive grain boundaries under stress containing confined fluids. Chem. Geol. 230, 207–219.
Koehn, D., Renard, F., Toussaint, R., Passchier, C.W., 2007. Growth of stylolite teeth patterns depending on normal stress and finite compaction. Earth Planet. Sci. Lett. 257 (3–4), 582–595.
Koehn, D., Ebner, M., Renard, F., Toussaint, R., Passchier, C.W., 2012. Modelling of stylolite geometries and stress scaling. Earth Planet. Sci. Lett. 341, 104–113.
Koepnick, R.B., 1987. Distribution and permeability of stylolite-bearing horizons within a Lower Cretaceous carbonate reservoir in the Middle East. Soc. Pet. Eng. Form. Eval.: 2 http://dx.doi.org/10.2118/14173-PA Landau, L.D., Lifshitz, E.M., 1986. Theory of Elasticity: Vol. 7 of Course of Theoretical Physics. Elsevier Ltd. Laronne Ben-Itzhak, L., Aharonov, E., Toussaint, R., Sagy, A., 2012. Upper bound on stylolite roughness as
indicator for amount of dissolution. Earth Planet. Sci. Lett. 337, 186–196.
Lind, I., Nykjaer, O., Priisholm, S., Springer, N., 1994. Permeability of stylolite-bearing chalk. J. Pet. Technol. 46:986–993. http://dx.doi.org/10.2118/26019-PA
Martín-Martín, J.D., Gomez-Rivas, E., Gómez-Gras, D., Travé, A., Ameneiro, R., Koehn, D. and Bons, P.D. Activation of stylolites as conduits for overpressured fluid flow in dolomitized platform carbonates. Geological Society of London Special Publications, (in press).
Merino, E., 1992. Self-organization in stylolites. Am. Sci. 80, 466.
Nelson, R.A., 1981. Significance of fracture sets associated with stylolite zones. Am. Assoc. Pet. Geol. Bull. 65, 2417–2425.
Park, W.C., Schot, E.H., 1968. Stylolites: their nature and origin. J. Sediment. Petrol. 38 (1), 175–191.
Petit, J.P., Mattauer, M., 1995. Paleostress superimposition deduced from mesoscale structures in limestone - the matellese exposure, Languedoc. France. J. Struct. Geol. 17, 245–256.
Railsback, L.B., 1993. Lithologic controls on morphology of pressure-dissolution surfaces (stylolites and dissolution seams) in Paleozoic carbonate rocks from the mid-eastern United-States. J. Sediment. Res. 63 (3), 513–522.
Raynaud, S., Carrio-Schaffhauser, E., 1992. Rock matrix structures in a zone influenced by a stylolite. J. Struct. Geol. 14 (8–9), 973–980.
Renard, F., Schmittbuhl, J., Gratier, J.-P., Meakin, P., Merino, E., 2004. Three-dimensional roughness of stylolites in limestones. J. Geophys. Res. Solid Earth 109. http://dx.doi.org/10.1029/2003JB002555
Rispoli, R., 1981. Stress-fields about strike-slip faults inferred from stylolites and tension gashes. Tectonophysics 75, 29–36.
Rolland, A., Toussaint, R., Baud, P., Schmittbuhl, J., Conil, N., Koehn, D., Renard, F., Gratier, J.P., 2012. Modeling the growth of stylolites in sedimentary rocks. J. Geophys. Res. Solid Earth 117 (6), B06403. Rolland, A., Toussaint, R., Baud, P., Conil, N., Landrein, P., 2014. Morphological analysis of stylolites for
paleostress estimation in limestones. Int. J. Rock Mech. Min. Sci. 67, 212–225.
Rutter, E.H., 1983. Pressure solution in nature, theory and experiment. J. Geol. Soc. 140, 725–740.
Sachau, T., Koehn, D., 2014. A new mixed-mode fracture criterion for large-scale lattice models. Geosci. Model Dev. 7 (1):243–247. http://dx.doi.org/10.5194/gmd-7-243-2014.
Sannemann, D., Zimdars, J., Plein, E., 1978. Der basale Zechstein (A2-T1) zwischen Weser und Ems. Z. Dtsch. Geol. Ges. 129, 33–69.
19
Schmittbuhl, J., Renard, F., Gratier, J.P., Toussaint, R., 2004. Roughness of stylolites: implications of 3D high resolution topography measurements. Phys. Rev. Lett. 93 (23): 238501.
http://dx.doi.org/10.1103/PhysRevLett.93.238501.
Stockdale, P.B., 1922. Stylolites: their nature and origin. Indiana University Studies 9, 1–97.
Strohmenger, C., Antonini, M., Jäger, G., Rockenbauch, K., Strauss, C., 1996. Zechstein 2 carbonate reservoir facies distribution in relation to Zechstein sequence stratigraphy (Upper Permian, Northwest Germany): an integrated approach. BCRDP 20, 1–35.
Taylor, J.C.M., 1990. Upper Permian - Zechstein. In: Glennie, K.W. (Ed.), Introduction to the Petroleum Geology of the North Sea. Blackwell Scientific Publications, Oxford, pp. 153–190.
Van Geet, M., Swennen, R., Wevers, M., 2000. Quantitative analysis of reservoir rocks by microfocus X-ray computerised tomography. Sediment. Geol. 132:25–36. http://dx.doi.org/10.1016/S00370738(99)00127-X. Vandeginste, V., John, C.M., 2013. Diagenetic implications of stylolitization in pelagic carbonates, Canterbury
basin, offshore New Zealand. J. Sediment. Res. 83, 226–240.
Wright, T.O., Platt, L.B., 1982. Pressure dissolution and cleavage in Martinsburg shale. Am. J. Sci. 282 (2), 122– 135.
Young, R.B., 1945. Stylolitic solution in Witwatersrand quartzites. Geol. Soc. S. Afr. Trans. 47, 137–142. Ziegler, P.A., 1990. Geological Atlas of Western and Central Europe. Shell Internationale Petroleum