1 Health Services Research Laboratory, University of Siena, Italy 2 Post Graduate School of Public Health, University of Siena, Italy 3 Ministry of Health, Roma, Italy
4 Health General Manager, Piedmont Region, Italy
Mobility trends of Patients across Italian Regions:
implications for planning and evaluation of hospital
services
N. Nante
1,2, G. Messina
1,2, L. Lispi
3, A. Serafini
2, G. Prisco
2, F. Moirano
2,4Key words: Hospital patients’ mobility, Health planning, Health services accessibility
Parole chiave: Mobilità Sanitaria, Programmazione ospedaliera, Accessibilità dei Servizi Sanitari
Abstract
Background. The study of patients’ mobility is useful for health planning and identifying deficiencies
in care supply. The Italian Health Service, with 21 different regional realities, can be considered as a macrocosmic test bench. Our study aims: (1) to describe the trend of patients’ hospital mobility across the Italian Regions; (2) to offer an immediate visual approach for decision making; (3) to identify some factors involved in patient’s mobility.
Study design. Observational cross sectional study.
Methods. We used ordinary and day hospital discharge data from 1998 to 2014. The study was carried
out using: (1) the Gandy’s Nomogram (GN), a graphical tool that assesses the power of attraction and the escape’s containment of hospital regional networks; (2) the vector analysis; (3) the trend analysis with Cuzik’s test; (4) the panel data analysis, with multiple logistic regression model.
Results. The mean number of annual admissions, in Italian hospitals, was 10,976,290, progressively
decreasing from 2001 to 2014, and 7% of it occurred “in mobility”. We have drawn the different paths of
patients’ mobility by Regions and observed critical situations almost in Regions of Southern Italy, compared with Regions of the Centre-North. Moreover we analyzed the factors implied in such mobility, highlighting that attraction is influenced by the hospitalization rate in private structures, by the percentage of graduates in the Regions, and by the number of hospital beds/10,000 inhabitants; while escapes are influenced by GDP per capita, by the number of hospital beds/10,000 inhabitants and by the sanitary expenses per capita of the Region.
Conclusions. We have shown the potentialities of the GN, applicable at micro level but also on a large scale
in the analysis of patients’ hospital mobility; and this, together with panel data analysis, can lead to a more conscious and effective health planning.
Introduction
The patients’ mobility is a key and very debated issue in the health policy, both because it is implicitly related to quality
(1) and accessibility of care services and because the mobility flows are associated with very high amounts of money transfer. Currently, patients’ mobility between distant places is under the spotlight in the
international arena (2-8): the Directive of European Union on cross-border migration (9), which recently came into force, aims to promote the free movement of patients between Member States. Of course, the scenario will reveal itself rather complex, due to the heterogeneity of the National Health Systems and to the complex problem of healthcare reimbursement to provider countries.
The Italian National Health Service (NHS), as result of federalist instances (10) translated into the Legislative Decrees 502 of 1992 (11) and 229 of 1999 (12), was split into 21 Regional Health Services, as many as the 19 Italian Regions plus the 2 Autonomous Provinces (AP) of Trento and Bolzano (considered, for the purposes of our investigation, comparable to the other Regions). Regions are now independent for administrative, financial and managerial aspects and in reciprocal competition according to the “quasi-market” model (13). In this system, the debtor Region will take over the reimbursement of the costs of health care for its own citizens who have chosen to seek treatment in another Region (creditor Region), based on the economic weight of the Diagnosis Related Groups (DRG).The study of the inter-regional flows of hospital patients can then provide indications about the perceived quality of hospital assistance and also about regional health policies. Mobility is a very important indicator not only because of the economic implication, but also because it is a measure of sanitary offer’s equity. In fact, considering that Italy applies a kind of Health Federalism - an universalistic model based on the autarchy of each region which should assure minimal equal level of health assistance - identifying patients who seek care elsewhere is an indicator of failure for the local health care system. In Italy there are 1,437 hospitals (14); on average each regional hospital network has 3.5 beds per 1,000 inhabitants (with a range of 2.9 in Campania and 4.3 per 1,000
in Molise) (15). Despite the claim that Italy guarantees to all its citizens homogeneous Essential Levels of Assistance (LEA in Italian) (16) this federalist model induces variations in the quality and quantity of healthcare provided by the different Regions (17). The analysis of health migration, that can be considered a proxy of healthcare quality (18), plays an important role for the purposes of health planning that should be aimed at ensuring equal accessibility and quality of healthcare. Moreover, a recent paper identified patients’ migration as an indicator of the efficiency of supplied services (19): internal managerial patterns of health care can influence the perception of quality by patients and consequently the decision to seek care elsewhere, regardless of the consequences. The quality of care is the result of specific health policies that are able to intervene on the organizational arrangements of services at different levels: at the micro level within the government of the individual team players; at meso level in the context of inter- and intra-company government, and at macro level, in the field of regional/national government (20). Therefore, the study of migratory flows, especially if focused on trends between the Regions, becomes a very important tool for evaluating past choices that provide a basis for planning the future ones, designed to repair any quantitative or qualitative deficiencies in regional healthcare, marked by an excessive outflow of patients. At the same time it is important to divulgate instruments that make the data of patients’ mobility intuitively comprehensible to both health professionals and policy makers. Previous studies have investigated the health mobility at micro and meso level (19, 21, 22) and at the macro regional (18) level but limited to a short period of time. Our study aims: (1) to analyze, at macro-level, trends in hospital patients’ mobility among the Italian Regions over a long period of time - 13 years); (2) to show an immediate
visual approach for decision making; (3) to analyze, through the panel data analysis, the factors which influence patients’ mobility across the Italian Regions.
Material and Methods
Sources of Data
We used ordinary and day hospital discharge data produced by all Italian hospitals from 1996 to 2014, obtained from the Ministry of Health. All the data for the independent variables were collected from the Italian Statistics Institute (ISTAT).
Pre data analysis was conducted to identify possible incongruences in the dataset and to discard outliers. Years 1996 and 1997 were excluded because data seemed having too many outliers, so our study time period was 1998-2014.
The following informations were collected for each Italian Region and per year:
- Admission of residents to their regional network hospitals (R);
- Admission to hospitals of patients “attracted” from other Regions (A);
- Admission of “escaped” residents to hospitals of other Regions (E).
The Regions, including the two Autonomous Provinces, have been classified as follows:
- Northern Regions: Piedmont, Aosta Valley, Lombardy, Veneto, Autonomous Province of Bolzano, Autonomous Province of Trento, Friuli-Venezia Giulia, Liguria, Emilia-Romagna;
- Central Regions: Tuscany, Marche, Latium, Umbria;
- Southern Regions: Campania, Abruzzo, Molise, Basilicata, Apulia, Calabria;
- Island Regions: Sicily, Sardinia. Average annual balances (absolute values) of patients’ hospital mobility among Italian Regions were obtained for the years 1998 – 2014 (Figure 1).
Gandy’s Nomogram
We adopted the Gandy’s Nomogram (23-28) to represent graphically hospital patients’ mobility among Italian Regions in the period under consideration (Figure 2).
It is a squared area with the side of 100, placed in a Cartesian plan:
- The X value (percentage) is obtained from the number of admitted residents divided by the admitted residents plus the attractions: X = (R / (R+A)) * 100;
- The Y value (percentage) is obtained dividing the admitted residents by the admitted residents plus the escapes: Y = (R / ( R+E)) * 100.
Going from 100 to 0, along the X-axis, the power of attraction increases, while along the Y-axis there is an increase of escapes to other Regions.
The Cartesian plan may be further parted in four squares by two lines, which take the origin at X=0, Y=50 and X=50, Y=0.
The diagonal which originates from the O point (X=0; Y=0) and ends at the W point (X=100; Y=100), splits the plan into: i) an upper part where the Y value is higher than the X one, and there are more incoming patients (A) than escapes (E) and ii) a lower one with an opposite situation. The points on the diagonal have the same value both for the escapes and the attractions.
The four above mentioned quadrants show a different balance between escapes and attractions:
- Regions placed in the upper left quadrant (I) have a number of residents’ hospital admissions higher than escapes and, at the same time, lower than attractions. This condition characterizes Regions which are “market oriented” (E<R<A), in which attractions generate funds because of patients coming from other areas, more than patients who are local residents.
The point X=0, Y=100 identifies the hypothetical condition in which the hospitals of a Region exclusively admits attracted
patients coming from other Regions and there are no escapes.
- The upper right quadrant (II) is parted in two areas, a and b. In the first one (II a) the resident admissions are higher than the attracted patients and the latter, at the same time, are higher than escaped patients (E<A<R). In the second area (II b) resident admissions are higher than escapes, but the latter are higher than the attracted patients (A<E<R).
In this two areas there are hospitals which satisfy in a more or less appropriate way (depending on their position) the healthcare needs of their Region.
- In the lower left quadrant (III) the diagonal parts two areas (III a and III b). Both of them have a lower number of resident admissions, exceeded by escapes and attractions: in the III a area escapes are lower than the attractions (R<E<A) and in III b we have an opposite situation (R<A<E).
- Finally, the lower right quadrant (IV) includes hospitals where resident admissions are lower than escapes and higher than arrivals (A<R<E).
Vectorial Analysis
For each year and Region we calculated the values of X and Y to identify a point. All the points, 1998-2014, have been linked and a vector was derived (29). For those Regions with a monophasic trend (during time the trend followed the same direction), the resulting vector was obtained linking the first (1998) to the last (2014) point. For those Regions with clearly a biphasic trend (during the time the trend followed the same direction until a given year, then continued following another direction) we created two vectors, one linking the first point (1998) to the point of the year of direction change, the second from this year to the last one (2014).
Trend Analysis
The Cuzick’s test was applied to verify the existence of significant trends for the
series of X and Y values of the Regions. All the biphasical trends have been analyzed separately and two Cuzick’s test were performed for each phase (30).
Panel data Analysis
We set the Italian Regions as a strongly balanced panel variable, and the year as time variable, from 2000 to 2011 (last available data). We created 2 models: 1 for attractions and 1 for escapes. The independent variables considered were: general practitioners per 10,000 inhabitants, hospital beds per 10,000 inhabitants, regional health expense per capita, GDP per capita, percentage of population with at least middle school license, percentage of graduated inhabitants, percentage of people very satisfied with the medical assistance received, hospitalization rates in public and private structures, average length of stay. To improve the strength of our analysis, the outcome variables (attractions and escapes) were dichotomized: 0 if the Region’s value was lower than Italian median, or 1 if it was equal or higher than Italian median. Independent variables were all categorized in quartiles. For each model we carried out a monovariate analysis, and then we included all the variables significantly associated to the outcome in a multiple logistic regression panel data model. Finally, with a backward elimination process, we reach the two final models for attractions and escapes.
Stata ® SE, version 12.1, StataCorp, College Station, Texas, USA software was used for the analysis. Statistical significance level was set at p<0.05.
Results
The average numbers of ordinary and day-hospital admissions (HDF) in Italy, along the study period 1998 – 2014, was 10,976,290/year, decreasing significantly (p <0.05), from 12,032,416 in 2001 to 8,557,745 in 2014.
Admissions in mobility (A + E) were on average 774,736 per year, representing about 7% of total HDF.
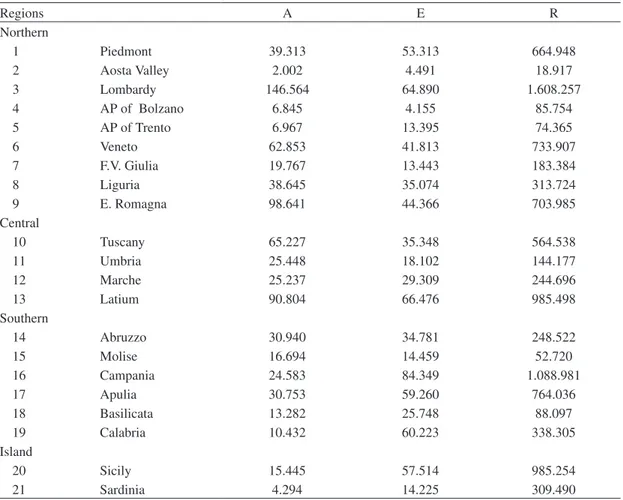
The average values recorded for each Region, in the studied period, of active (A) and passive (E) mobility and of residents’ (R) admissions are shown in Table 1. A Northern Region, Lombardy, had the largest number of attractions in absolute value, followed by Emilia-Romagna, Latium and Tuscany. In contrast, a Southern Region, Campania, had the highest number of escapes.
Figure 1 shows the mobility balances, i.e. the differences between the annual average values of active (A) and passive (E) mobility,
in the period 1998-2014, for all the Italian Regions. Lombardy reported the best positive balance, followed by other Northern-Central Regions such as Emilia Romagna, Tuscany, Latium and Veneto, while the worst negative balance was generated by Southern Regions such as Campania, followed by Calabria, Sicily and Apulia.
In general, the Regions with a number of “escaped” patients greater than the attractions are in Southern and Island Regions: Campania, Apulia, Basilicata, Calabria, Sicily and Sardinia; the only exceptions are represented by the Autonomous Province of Trento and by Piedmont, both in the north.
Regions A E R Northern 1 Piedmont 39.313 53.313 664.948 2 Aosta Valley 2.002 4.491 18.917 3 Lombardy 146.564 64.890 1.608.257 4 AP of Bolzano 6.845 4.155 85.754 5 AP of Trento 6.967 13.395 74.365 6 Veneto 62.853 41.813 733.907 7 F.V. Giulia 19.767 13.443 183.384 8 Liguria 38.645 35.074 313.724 9 E. Romagna 98.641 44.366 703.985 Central 10 Tuscany 65.227 35.348 564.538 11 Umbria 25.448 18.102 144.177 12 Marche 25.237 29.309 244.696 13 Latium 90.804 66.476 985.498 Southern 14 Abruzzo 30.940 34.781 248.522 15 Molise 16.694 14.459 52.720 16 Campania 24.583 84.349 1.088.981 17 Apulia 30.753 59.260 764.036 18 Basilicata 13.282 25.748 88.097 19 Calabria 10.432 60.223 338.305 Island 20 Sicily 15.445 57.514 985.254 21 Sardinia 4.294 14.225 309.490
Table 1 - Average annual values of hospital admissions (HDF): Attractions (A), Escapes (E) and Residents (R) referred to Italian Regions, in 1998 – 2014
All the Regions, over the studied period, are placed in the II (upper-right) quadrant of the GN (Figure 2). The Regions with a vector directed primarily and significantly toward the left, showing the ability to attract patients from other Regions, are: Lombardy, Veneto, Tuscany, Marche, Latium, Campania, Molise
and Basilicata. Region Piedmont and the Province of Bolzano have a vector directed significantly upward (decrease of the escapes). The Regions that instead show a vector directed significantly downward (increase of the escapes) are Veneto, Liguria, Marche, Umbria, Apulia, Calabria and Sardinia.
Figure 1 - Average annual balances (absolute values) of patients’ hospital mobility across Italian Regions, 1998 - 2014
Figure 2 - Hospital patients’ mobility vectors of each Italian Region from 1998 to 2014. A) Gandy’s Nomogram of
interregional mobility trends; B) Zooming of the II GN quadrant B A
Some Regions as Aosta Valley, Province of Trento, Friuli Venezia Giulia, Emilia Romagna, Abruzzo and Sicily are characterized by a biphasic trend, which was identified analyzing consecutive years. In all the cases, an inversion of the trend of attraction-development and/or escapes-containment occurred around the years 2005-2007.
Finally, the panel data analysis allowed us to identify predictors for both attraction and escape models of patients’ mobility (Table 2). In order to strengthen our analysis, we categorized our independent variables into quartiles, the first of which was always used as reference and compared with the others. The coefficients derived from a multiple logistic regression analysis allowed us to identify a direct correlation (positive coefficient) or an indirect correlation (negative coefficient) between the outcomes and the independent variables. We found that, by raising the hospitalization rate in private structures (more than 13.70 hospitalizations/10,000 inhabitants), the attractions significantly increase. Moreover, attractions were also positively influenced by the increase of the number of hospital beds per 10,000 inhabitants ( more than 10.27 beds/10,000). The final model for escapes showed a positive correlation with GDP per capita (escapes grow with the increasing of GDP up to more than 28,775 €) and an inverse correlation with hospital beds/10,000 inhabitants and regional health expenditure per capita: escapes are reduced with the raising of the number of hospital beds (more than 6.55 beds/10,000) and with the increasing of the health expense (expenses between 1,427 and 1,830 € per capita were significantly associated to escape reduction, while more than 1,830 € did not). Discussion and conclusions
The equitable distribution of the supply of care is a primary objective of the Italian
NHS: it should be characterized by uniform accessibility and quality of performance.
For the Local Health Units (LHUs), the territorial basis of our universalistic healthcare model, and for the Regions, politically responsible of hospital planning, the “elective” escape of the patients is a marker of failure of this objective.
The free choice of the place where to apply for care - a right arising from Article 32 of the Italian Constitution - in a situation of “third party payers” typical of the public health service - if really exercised by the citizens / patients, can represent an important tool for balancing the power of the bureaucratic planning. “Health mobility” is, therefore, the “gold” indicator of quality in health planning. It summarizes psychometric and econometric information, being linked to aspects such as equity, trust of patients, reputation of facilities (27, 28, 31). GN makes it possible to analyze this phenomenon, having the advantage of being declinable, lending itself from micro (departments and units), to meso (LHUs and hospitals) and to macro (regional and national health policy) applications. Our study focused on the macro level.
The fact that all Regions, even the smallest, are placed in the second quadrant of the GN, testifies that hospital planning has been performed by the Regions, beginning in 1978 after the birth of NHS until recent days, although with several imbalances. The GN allowed us to identify those Regions which were more critical and those which were able to face the problem. As an example, Basilicata Region (Southern Italy), although in “critical” conditions (placed in quadrant II b of GN), developed a great attraction power and reduction of escapes. In contrast, in the same critical condition, another Southern Region, Calabria, progressively lost its capability to attract patients and increased the numbers of escapes. This latter phenomenon has to be considered urgently by the health planners for immediate
corrections. In general, Regions in critical situations were observed in the South of Italy and on the Islands.
It can be assumed that the Regions that attract more patients and those that are less dependent on others have been able to virtuously steer hospital planning towards improvement of the supply in terms of quality and quantity.
The Regions in better conditions are those in the Centre-North, traditionally considered such as those with a better healthcare system: Lombardy, Emilia-Romagna and Tuscany.
Interesting are other considerations which emerge from the study of the GN; for example, although Piedmont, in the north of Italy, is in critical conditions (quadrant II b of the GN), it has a very different situation compared to the mentioned Region Basilicata; in fact it is clear that the overall performance is definitely better because it is placed in the upper part of the quadrant, therefore with a percentage of escapes less than that of a Region located at a lower level.
Moreover a cause for concern is given by two Regions historically equipped with excellent health services such as Veneto and Liguria , which, although in the “optimal” conditions (II a of the GN), showed a worsening of trend over time; Liguria in particular in the last few years left the “optimum” II a, reaching the “critical” II b. Such a phenomenon should not be underestimated at all by the regional hospital planners.
It is also interesting to note that some Regions showed biphasic trends, particularly in reference to the escape containment; the year of the trend reversal was almost around 2006.
A possible explanation for these biphasic trends could be the obligation issued by the Italian Ministry of Economy to Regions with significant account deficits to subscribe and apply “Recovery Plans” (Law 311/2004): such plans were aimed at restoring the
economic and financial balance, on penalty of compulsory administration (32).
In the Recovery Plans adopted by the different Regions in deficit, the hospital planning ranked first. The main lines of action consisted in renovation and redevelopment of the hospital network and in reduction of inappropriate hospital admissions. The reduction of passive mobility is one of the operational goals for cost containment. Nevertheless, it is emblematic the fact that to the same stimulus (Recovery Plans), some other Regions have reacted in a diametrically opposite way; for example, Friuli Venezia Giulia and Emilia-Romagna have taken specific actions against escapes; instead, Abruzzo and Sicily, since 2006, increased dramatically their escapes; this phenomenon could be explained because the good policies (improvement of escapes containment/ attraction) of other Regions negatively influenced their performances; or because Abruzzo and Sicily simply assumed it would have been more cost effective allowing their patients to seek care in hospitals outside the Region rather than seriously improving their own hospital network. Why such an aforementioned opportunistic attitude, of limited perspectives, inconsistent with the mission of a universalistic model devoted to homogeneous / equal distribution of care provision?
Our study may be affected by some limitations: i) from the data we could not subtract the share of the so-called “physiological migrants” (not by choice but by contingent conditions as holidays, college students away from home, commuters, etc.), although these limited numbers cannot significantly influence the precision of the measurements; ii) presence of “geographic” factors (roads, “boundary” zones, islands, etc.) that affect the freedom of movement; iii) small size and low population of some Regions, which limit the offer of advanced assistance; iv) impossibility of analyzing the data of those admissions occurred abroad.
This could lead to an under-estimation of cross-migration. In addition, admissions could not be “weighted” for financial impact (for example, DRG tariffs) or for severity; a Regional planning could take care of the most serious pathologies and/or of those of greater economic impact, neglecting the others, less relevant.
The panel data analysis allowed us to make further considerations on the factors influencing mobility: in Table 2 we see how a greater hospitalization rate in private structures and more numerous hospital beds per 10,000 inhabitants increase significantly the attractions (positive coefficients, p<0.05). Probably the regions with higher
Category (quartiles) Coefficient Standard error p Confidence interval
AttRActIons Hospitalization rate in private structure
<8.15 1 . . . ≥8.15 & <13.70 0.92 1.93 0.633 -2.870 4.719 ≥13.70 & <25.91 5.64 2.66 0.034 0.411 10.872 ≥25.91 6.08 2.68 0.024 0.814 11.346 % of graduated inhabitants <30.51 1 . . . ≥30.51 & <33.18 3.77 1.45 0.01 0.914 6.634 ≥33.18 & <37.93 2.02 1.55 0.19 -1.030 5.071 ≥37.93 3.71 1.90 0.05 -0.012 7.439
Hospital beds per 10000 inhabitants
<6.55 1 . . . ≥6.55 & <8.73 1.85 1.26 0.14 -0.627 4.332 ≥8.73 & <10.27 1.46 1.31 0.27 -1.112 4.052 ≥10.27 4.51 1.89 0.02 0.801 8.234 EscAPEs GDP per capita (€) <17740 1 . . . ≥17740 & <25515 -2.99 7.35 0.684 -17.398 11.415 ≥25515 & <28775 0.84 4.97 0.866 -8.917 10.599 ≥28775 10.42 4.60 0.024 1.402 19.444
Hospital beds per 10000 inhabitants
<6.55 1 . . .
≥6.55 & <8.73 -9.98 3.30 0.003 -16.470 -3.506
≥8.73 & <10.27 -11.03 4.30 0.010 -19.464 -2.601
≥10.27 -10.83 4.12 0.009 -18.923 -2.748
Regional health expenditure per capita (€)
<1427 1 . . .
≥1427 & <1657 -7.18 2.87 0.013 -12.820 -1.543
≥1657 & <1830 -9.18 3.59 0.011 -16.231 -2.131
≥1830 -1.60 3.81 0.674 -9.077 5.865
hospitalization rate in private structures are those with high specialization centers, capable of great attraction power. For what concern the escapes, it seems that they increase with GDP per capita (Table 2, positive coefficient, p<0.05): probably people with higher GDP have more possibility to travel to other structures, and are more aware of where they can receive better medical treatment; moreover, the escapes are reduced with higher regional health expenditure per capita and higher number of hospital beds per 10,000 inhabitants (Table 2, negative coefficient, p<0.05). From these data it seems that to invest in health could be a good strategy to reduce the escapes; however from Table 2 we can see that when the Regional health expenditure per capita is too high (last quartile, ≥1,830 €), it does not affect significantly the mobility. This could be explained because wastes in health expenditure not only are a great loss of money, but also a lack in results. In conclusion, we demonstrated that the study of patients’ hospital mobility provides valuable information for policy makers and health services evaluation and planning. The Gandy’s Nomogram, because of its easy construction and interpretation, is a powerful method to describe the dynamics of patients’ mobility and an useful tool of assessment, applicable at the micro level but also on a large scale. Moreover, with the panel data analysis, we were able to assess that higher hospitalization rates in private structures, higher percentages of graduated inhabitants and higher availability of hospital beds increase the attractions; while escapes increase with higher GDP per capita and are reduced by higher number of hospital beds per 10,000 inhabitants and higher regional health expense per capita.
conflict of interest
None declared.
Riassunto
La Mobilità Sanitaria interregionale in Italia: im-plicazioni per la programmazione e valutazione dei servizi ospedalieri
Introduzione. Lo studio della mobilità dei pazienti è
indispensabile per la pianificazione sanitaria nell’iden-tificare la mancanza di risorse. Il Sistema Sanitario Italiano, con 21 realtà regionali, può essere preso come un macrocosmo di realtà eterogenee. Il nostro studio ha lo scopo di: descrivere i trend di mobilità ospedaliera e interregionale, fornire un immediato approccio visivo al fenomeno mobilità ed identificare quali fattori sono implicati.
Disegno di studio. Osservazionale trasversale. Metodi. Abbiamo utilizzato i dati di dimissione
ospe-daliera ordinaria e day hospital dal 1998 to 2014. Lo stu-dio è stato condotto tramite: 1) il Nomogramma di Gandy (GN), uno strumento grafico in grado di visualizzare efficacemente attrazioni e fughe della rete ospedaliera interregionale; 2) analisi vettoriale; 3) analisi dei trend temporali tramite test di Cuzick, 4) analisi dei dati panel, con modelli di regressione multipla logistica.
Risultati. Il numero medio di ricoveri annuali, negli
ospedali Italiani, è stato di 10,976,290 in decrescita dal 2001 al 2014, di cui il 7% in mobilità sanitaria. Abbiamo rappresentato i differenti andamenti della mobilità inter-regionale osservando situazioni critiche soprattutto nelle regioni del Sud-Italia. Inoltre abbiamo riscontrato come le attrazioni siano influenzate dal tasso di ospedalizzazio-ne in strutture private, dalla percentuale di laureati in una regione e dal numero di letti ospedalieri/10,000 abitanti; mentre le fughe siano influenzate dal reddito pro capite, dal numero di letti ospedalieri /10,000 abitanti e dalla spesa sanitaria regionale pro capite.
conclusioni. Abbiamo dimostrato le potenzialità del
GN, applicabile non solo a livello micro, ma anche su larga scala nell’analisi della mobilità ospedaliera, che insieme all’analisi dal panel data può supportare una più consapevole programmazione sanitaria.
References
1. Luft HS, Garnick DW, Mark DH, et al. Does quality influence choice of hospital? JAMA 1990; 263: 2899-906.
2. Groene O, Poletti P, Vallejo P, Cucic C, Klazinga N, Sunol R. Quality requirements for cross-border care in Europe: a qualitative study of patients’, professionals’ and healthcare financers’ views. Qual Saf Health Care 2009;
18(Suppl 1): 115-21.
border health care in Europe. BMJ 1999; 318: 1157-8.
4. Lombarts MJ, Rupp I, Vallejo P, Sunol R, Klazinga NS. Application of quality improvement strategies in 389 European hospitals: results of the MARQuIS project. Qual Saf Health Care 2009; 18(Suppl 1): i28-37.
5. Rosenmöller M, Martin McKee M, Baeten R. Patient Mobility in the European Union. Learning from experience. Trowbridge: The Cromwell Press, 2006.
6. Sunol R, Garel P, Jacquerye A. Cross-border care and healthcare quality improvement in Europe: the MARQuIS research project. Qual Saf Health Care 2009; 18(Suppl 1): i3-7.
7. Vallejo P, Sunol R. MARQulS: quality improvement strategies for European cross-border healthcare. Qual Saf Health Care 2009; 18(Suppl 1): i1-2. 8. Peeters M. Free movement of patients: Directive
2011/24 on the application of patients’ rights in cross-border healthcare. Eur J Health Law 2012;
19: 29-60.
9. Directive 2011/24/EU of the European Parliament and of the Council 9 March 2011 on the application of patients’ rights in cross-border healthcare: Sess. Session 2011.
10. Amendments to Title V of Part II of the Constitution, constitutional Law 18/10/2011. 11. Healthcare Legislation Readjustment, legislative
decree 12/30/1992: Sess. Session 1992. 12. Regulations for the rationalization of the
National Health Service, legislative decree 19/06/1999 Sess. Session 1999.
13. Le Grand J, Bartlett W. Quasi-markets and Social Policy. Basingstoke: Macmillan, 1993.
14. Ministero della Salute, Italy. Available on: http:// www.salute.gov.it/portale/documentazione/ p6_2_2_1.jsp?lingua=italiano&id=2396 [Last accessed: 2016 June 21]
15. ISTAT Health for All, Italy Available on: http:// www.istat.it/it/archivio/14562 [Last accessed: 2016 June 10].
16. Definition of essential levels of assistance, Decree of the President of the Council of Ministers 29/11/2011.
17. Cantarero D. Health care and patients’ migration across Spanish regions. Eur J Health Econ 2006;
7: 114-6.
18. Messina G, Vigiani N, Lispi L, Nante N. Patient
migration among the Italian regions 2003. It J Public Health 2008; 5: 45-52.
19. Mafrolla E, D’Amico E. Patients’ mobility as an indicator for (in)efficiency:a panel data analysis on Italian health care authorities. Health Econ Rev 2013; 3: 3.
20. Grilli R, Taroni F. Il Governo Clinico. Roma: Pensiero Scientifico, 2004.
21. Messina G, Forni S, Collini F, Quercioli C, Nante N. Patient mobility for cardiac problems: a risk-adjusted analysis in Italy. BMC Health Serv Res 2013; 13: 56.
22. Messina G, Addari P, Macchi C, Nante N. Programmazione ospedaliera e flussi di pazienti: esperienza senese. Ann Ig 2005; 17: 323-33. 23. Gandy RJ. A graphical representation of the
inter-relationship between districts. Hosp Health Serv Rev 1979; 75: 50-51.
24. Gandy RJ. The calculation of catchment populations within the national health service. Statistician 1981; 28: 29-37.
25. Gandy RJ. The calculation of catchment populations within the national health service-reprise Forum. Statistician 1981; 30: 297-302. 26. Gandy RJ, Franci A, Gurrieri C, McClelland
B. Demonstrating Access to Public Services Diagrammatically. Int J Public Admin 2011; 34: 516-27.
27. Lako CJ, Rosenau P. Demand-driven care and hospital choice. Dutch health policy toward demand-driven care: results from a survey into hospital choice. Health Care Anal 2009; 17: 20-35. 28. Nante N, Al Farraj O, Morgagni S, et al. Hospital
patient migration: analysis using an utility index. In: Kirch W, ed. Public Health in Europe 10 Years Eupha. Berlin: Springer-Verlag, 2003: 293-316. 29. Griffiths IW. Principles of Biomechanics &
motion analysis. Philadelphia, PA: Lippincott Williams & Wilkins, 2006.
30. Cuzick J. A Wilcoxon-type test for trend. Stat Med 1985; 4: 87-90.
31. Victoor A, Delnoij DM, Friele RD, Rademakers JJ. Determinants of patient choice of healthcare providers: a scoping review. BMC Health Serv Res 2012; 12: 272.
32. Ministero della Salute, Italy. Available on: http:// www.salute.gov.it/portale/temi/p2_6.jsp?lingua =italiano&id=2239&area=pianiRientro&menu= obiettivi [Last accessed: 2016 June 10]. Corresponding author: Prof. Gabriele Messina, Department of Molecular and Developmental Medicine, Area of Public Health, University of Siena, Via Aldo Moro 2, 53100 Siena, Italy