Facoltà di Scienze Matematiche, Fisiche e Naturali
Dottorato di Ricerca in Scienze Chimiche
XXXI Ciclo
Glass Ceramics for High-Temperature Sealing Applications:
Synthesis and Physicochemical Properties of Modified
CaO-MgO-Al2O3-SiO2 Materials, with a view to recycling of industrial
waste
PhD Candidate: Supervisor:
Giulia Simonetti Dott. Andrea Ciccioli
Abstract
Solid Oxide Fuel cells (SOFC) and dense gas separation membranes based on mixed ionic and electronic conductors have gained increased interest the resent years due the search for new technologies for clean energy generation. These technologies can be utilized to produce electricity from fossil fuel with low CO2
emission compared to conventional gas or coal based energy plants. One crucial challenge with SOFCs is the sealing of the active membranes/electrolytes to prevent leakage of air to fuel side or vice versa. Due to the high operating temperatures of typical 600-1000°C the selection of reliable sealing materials is limited. The seals have to remain gas tight during the life time of the reactor/SOFC, they need to be chemical compatible with the sealed materials and stable in reducing and oxidizing atmospheres containing water vapor and CO2, and finally they should be cheap, readily available and easy to process. The main purpose of the present work was to evaluate rigid bonded glass ceramic seals for dense oxygen ion and proton conducting membranes and electrolytes for SOFCs. First, a review of sealing technologies has been carried out with emphasis on SOFC and ceramic membranes technologies applicable for zero emission power plants. Regarding sealing, the best and cheapest materials at the present time are based on silicate glass and glass ceramics.
The aim is to provide a systematic study of the properties of glasses and glass-ceramics as a function of the glass composition in the CaO-MgO-Al2O3-SiO2 system, which represent the most advanced sealing technology
for high-temperature Solid Oxide Fuel Cells (SOFC).
Two glass systems have been evaluated, aluminosilicate and boroaluminosilicate and their variants obtained adding five different oxides acting as nucleating agents, like TiO2, MnO2, ZnO and SnO2. Fabrication and
characterization of the glasses are reported with special focus on the thermal and thermochanical properties, glass forming ability, kinetic crystallization and phase evaluation. The influence of different additives in glass and glass ceramic properties has been analyze in depth.
In the last section, the research has been extended to the recycling of aluminosilicate basted waste to characterize a new type of glass ceramic derived from industrial waste, like Kaolin clay waste.
Table of contents
Introduction and objective 1
1. Solid Oxide Fuel Cells (SOFC) and sealing concept 3
1.1 State of art of sealants for high-temperature applications 3
1.2 Fuel cell 4
1.2.1 Solid Oxide Fuel Cell (SOFC) 6
1.2.1.1 Cell and stack designs 7
1.2.1.2 Electrolyte 10 1.2.1.3 Anode materials 11 1.2.1.4 Cathode materials 11 1.2.1.5 Interconnect materials 12 1.3 Sealing 13 1.3.1 Glass 18 1.3.2 Glass ceramic 26
1.3.3 Seal glasses for SOFC 31
2. Experimental 33
2.1 Experimental method 33
2.2 Preparation of glass 34
2.3 Characterization of glass and glass-ceramic 35
2.3.1 Characterization of glass properties 35
2.3.2 Characterization of glass ceramic properties 44
3. Synthesis and characterization of CMAS glass ceramics and their variants containing TiO2, MnO2, ZnO and SnO2 47
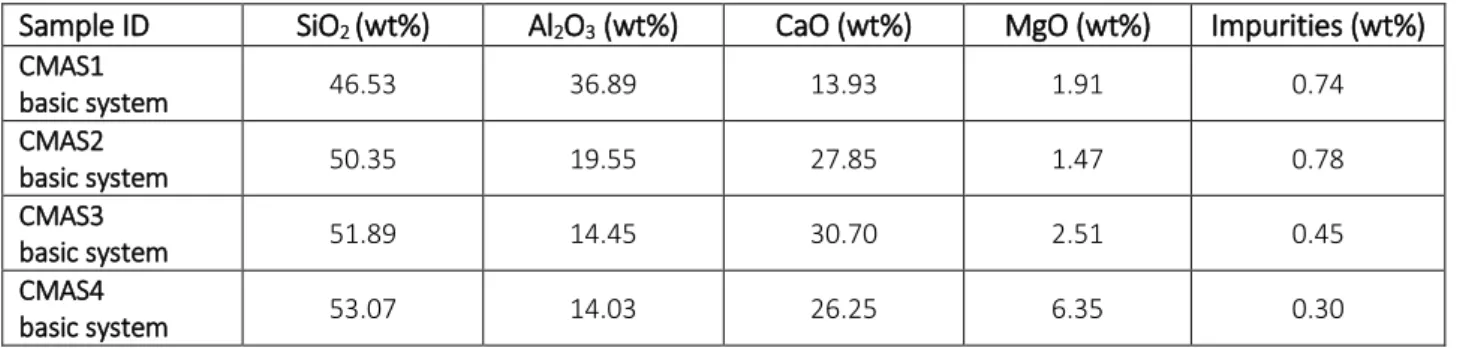
3.1 Chemical compositions 48
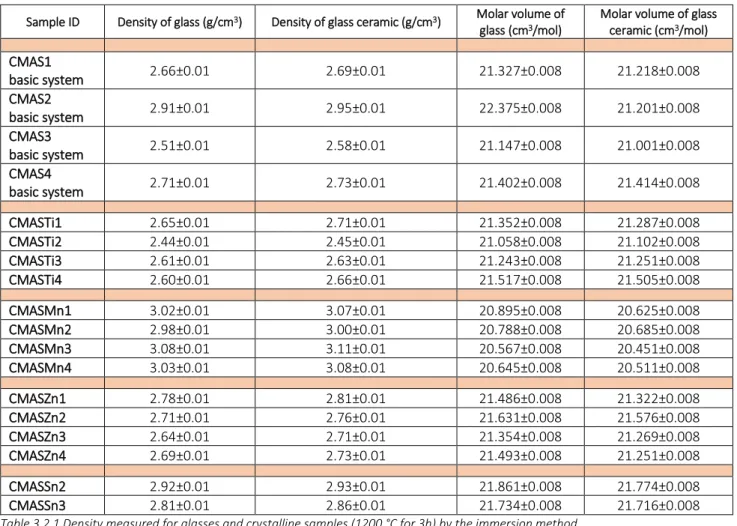
3.2 Density of glass and glass ceramic 50
3.3 Chemical resistance 51
3.4 Powder particles sizes 54
3.5 Thermophysical properties 56
3.5.1 Glass stability and glass forming ability 57
3.6 Thermomechanical properties 69
3.7 Temperature dependence of viscosity 76
3.8 Characterization of glass ceramic properties 81
3.8.1 Crystallization kinetics 82
3.9 Phase content and microstructures 97
3.9.1 Phase formation in CMAS1 series 98
3.9.2 Phase formation in CMAS2 series 103
3.9.3 Phase formation in CMAS3 series 106
3.9.4 Phase formation in CMAS4 series 111
4. Synthesis and characterization of Borosilicate glass ceramics (CMASB) and their variants containing TiO2, MnO2, ZnO and SnO2 116
4.2 Density, chemical resistance and particles size 118
4.3 Thermophysical and thermomechanical properties 120
4.4 Crystallization kinetics 126
4.5 Phase content and microstructures of glass ceramic 131
4.6 Vaporization experiments: Knudsen Effusion Mass Spectrometry 135
5. Preparation and properties of Mullite based glass ceramic derived from industrial process waste. 137
5.1 Characterization of
waste 1385.2
Characterization of glass
deriving from waste 1455.2.1 Preparation and composition of glass 145
5.2.2 Density, chemical resistance and particles size 146
5.2.3 Thermophysical, thermomechanical and kinetic crystallization properties 147
5.2.4 Evaluation of phase content in resulting glass ceramic 151
Conclusions
154References
157Appendix 1
166Annex 1: Thermophysical properties of CMAS glass series 166
SOFC Solid Oxide Fuel Cell AFC Alkaline Fuel Cell
PEMFC Proton Exanche Membrane Fuel Cell DMFC Direct Methanol Fuel Cell
DEFC Direct Ethanol Fuel Cell PAFC Phosphoric Acid Fuel Cell MCFC Molten Carbonate Fuel Cell MEA Membrane Electrode Assembly
PEN Positive electrode – Electrolyte – Negative electrode TSOFC Tubular Solid Oxide Fuel Cell
APU Auxiliary Power Units YSZ Yittrum stabilized- Zirconia CGO Ceria stabilized- Gadilinum LSM La1-xSrxMnO3
LSCF La1-xSrxCo1-y FeyO3
LC LaCoO3
LCCF Lanthanum Calcium Cobaltite Ferrite SSC Samarium Strontium Cobaltite PVB Polyvinyl Butyral
CTE, α Coefficient of thermal expansion Tg Glass transition temperature
Tm Melting temperature
TO Temperature of crystallization onset
TS Temperature of sintering
TC Temperature of crystallization
TFS Temperature of first shrinkage
TMS Temperature of maximum shrinkage
THB Temperature of half ball
TN Temperature of nucleation
TD Dilatometric softening temperature
TCG Maximum temperature of exothermic peak for samples nucleated
NBO Non-Bridging Oxygens
BO Bridging Oxygens
F Field strength of ions
z Valence of ions
r Ionic radius
Ea Activation Energy for Crystallization
Eb Water absorption coefficient
p Porosity percent
V External volume
Vo Volume of closed pores
V1 Volume of open pores
T Apparent density in the fraction of sample with less easily refillable porosities
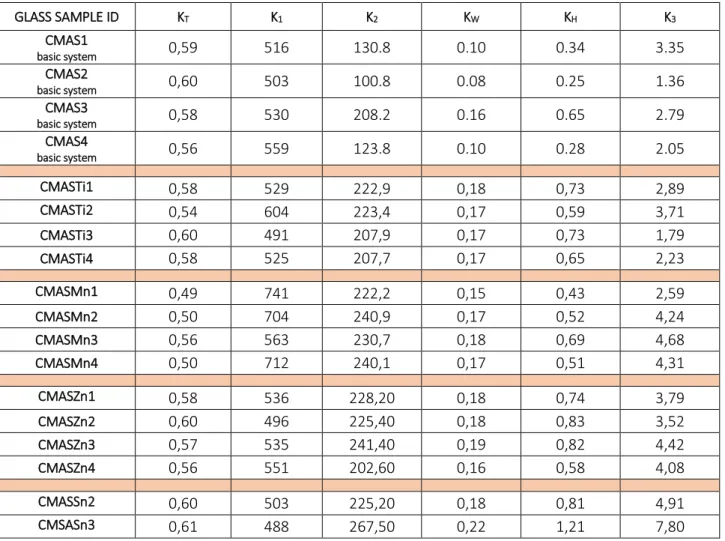
KT Stability of glass by Turnbull K1 Stability of glass
K2 Stability of glass
KW Stability of glass by Weinberg KH Stability of glass by Hruby
𝜂 Viscosity of materials
x Crystallization fraction
ko Frequency factor
n Avrami exponent
m Numerical factor of crystallization mechanism
β Heating rate
BAS Boroaluminiosilicate
CMAS Calcium Magnesium Aluminosilicate
CMASTi Calcium Magnesium Aluminosilicate modified by Titanium CMASMn Calcium Magnesium Aluminosilicate modified by Manganese CMASZn Calcium Magnesium Aluminosilicate modified by Zinc CMASSn Calcium Magnesium Aluminosilicate modified by Tin CMASB Calcium Magnesium Boroaluminiosilicate
CMASBTi Calcium Magnesium Boroaluminiosilicate modified by Titanium CMASBMn Calcium Magnesium Boroaluminiosilicate modified by Manganese CMASBZn Calcium Magnesium Boroaluminiosilicate modified by Zinc CMASBSn Calcium Magnesium Boroaluminiosilicate modified by Tin CMASX Calcium Magnesium Aluminosilicate with X is nucleating oxide
XRF X-Ray Fluorescence
ICP-OES Inductively Coupled Plasma- Optical Emission Spectroscopy HSM Hot Stage Microscope
DTA Differential Thermal Analyses DSC Differential Scanning Calorimetry XRD X-ray diffraction
SEM Scanning Electron Microscopy
EDX Energy Dispersive X-Ray Analysis
SE Secondary Electrons
BSE Backscattered Electrons
Table 1.2.1 Properties of different categories of Fuel Cells Table 1.2.1.5.1 Different type of interconnect materials Table 1.3.1 Functional requirements of sealing systems Table 1.3.2 Overview of potential sealing concepts for SOFCs Table 1.3.1.1 Function of different oxide constituents in a seal glass Table 2.2.1 Raw material used for glass preparation
Table 3.2.1.1 Nucleation and crystal growth mechanisms and corresponding values of parameters n and m for the modified Kissinger and Ozawa models, after Matusita et al. [121], and Henderson[119]
Table 3.1.1 Chemical compositions of glasses
Table 3.1.2 Chemical compositions of glass batches with nucleation agents
Table 3.2.1 Density measured by immersion method of glasses and crystalline samples (1200°C for 3h) Table 3.3.1 Characteristic values calculated from the ISO 10545:1995 method
Table 3.3.2 Calculated apparent density for all series of glasses Table 3.4.1 Particle size distribution of the CMAS glass powders Table 3.4.2 Particle size distribution of the CMASX glass powders Table 3.5.1.1 Characteristic temperatures of CMAS basic glasses Table 3.5.1.2 Characteristic temperatures of CMASTi glasses Table 3.5.1.3 Characteristic temperatures of CMASMn glasses Table 3.5.1.4 Characteristic temperatures of CMASZn glasses Table 3.5.1.5 Characteristic temperatures of CMASSn glasses
Table 3.5.1.6 Results of glass stability parameters for all examined glasses
Table 3.6.1 Thermal expansion coefficients of all glasses in range 200°-500°C and 200°-700°C
Table 3.6.2 Summary of dilatometer glass transition (Tg) and softening (TD) temperatures and the derived nucleation temperature (TN)
Table 3.7.1 Characteristic temperature and viscosity values at TS, THB, and 900°C calculated for all glasses
Table 3.7.2 Constants of VFT equation for all types of glasses
Table 3.8.1.1 Different methods for interpretation of non-isothermal kinetic data Table 3.8.1.2 Value of n and m for different crystallization mechanism
Table 3.8.1.3 Avrami exponents (n,m), crystallization activation energy (Ea) and k0 of the glasses belonging to CMAS1 series
Table 3.8.1.4 Avrami exponents (n and m), crystallization activation energy (Ea) and k0 of the glasses belonging to CMAS2, CMAS3 and CMAS4 series
Table 3.8.1.5 Crystallization activation energy (Ea) and Avrami index of glass samples calculated from Kissinger and Augis-Bennett equations
Table 3.9.1.1 Quantification of phases using Rietveld R.I.R method for CMAS1 glass series Table 3.9.1.2 Fraction of amorphous part and Rietveld parameters for CMAS1 glass series Table 3.9.1.3 CTE values for main formed phases and for all glasses belonging to CMAS1 series Table 3.9.2.1 Quantification of phases using Rietveld R.I.R method for CMAS2 glass series Table 3.9.2.2 CTE values for main formed phases and Rietveld R.I.R. for CMAS2 glass series Table 3.9.3.1 Quantification of phases using Rietveld R.I.R method for CMAS3 glass series Table 3.9.3.2 CTE values for main formed phases and Rietveld R.I.R. for CMAS3 glass series Table 3.9.4.1 Quantification of phases using Rietveld R.I.R method for CMAS4 glass series Table 3.9.4.2 CTE values for main formed phases and Rietveld R.I.R. for CMAS4 glass series Table 4.1.1 Chemical compositions of boroaluminosilicate glasses
Table 4.2.1 Density of glass and glass ceramic belonging to CMASB series Table 4.2.2 Characteristic values calculated from the ISO 10545:1995 method Table 4.3.1 Characteristic temperatures obtained from HSM and DTA tests Table 4.3.2 Results of glass stability parameters for all examined glasses
Table 4.3.3 CTE values recorded in the common temperature ranges of 200°C-500°C and 200°C-700°C for CMASB glass series
Table 4.3.4 Characteristic temperature and viscosity values at TS, THB, and 900°C calculated for all examined glasses
Table 4.3.5 VFT constants for glasses belonging to CMASB series
Table 4.4.1 Avrami exponents (n,m), crystallization activation energy (Ea) and k0 of the glasses belonging to CMASB series
Table 4.5.1 Quantification of phases using Rietveld R.I.R method for all glasses belonging to CMASB series Table 4.5.2 CTE values for main formed phases and Rietveld R.I.R. for all glasses belonging to CMASB
series
Table 5.1.1 Analysis of chemical composition of CER 10.12.01 waste Table 5.1.2 Analysis of waste by X-ray fluorescence
Table 5.1.3 Analysis of body green by X-ray fluorescence Table 5.1.4 Analysis of glaze by X-ray fluorescence
Table 5.1.5 Quantification of phases using Rietveld R.I.R method for CER 10.12.01 waste Table 5.1.6 Rietveld R.I.R. parameters for CER 10.12.01 waste
Table 5.2.1.1 Analysis of glass GC 10.12.01 by X-ray fluorescence
Table 5.2.2.1 Density of glass and glass ceramic belonging to CMASB series Table 5.2.2.2 Characteristic values calculated from the ISO 10545:1995 method Table 5.2.2.3 Particle size distribution of the glass powder
Table 5.2.3.1 Characteristic temperatures obtained from HSM and DTA tests Table 5.2.3.2 Results of glass stability parameters for all examined glasses
Table 5.2.3.3 Characteristic temperature and viscosity values at TS, THB, and 900°C calculated for all examined glasses
Table 5.2.3.4 VFT constants for glass derived from waste
Table 5.2.3.5 Avrami exponents (n,m), crystallization activation energy (Ea) and k0 of the glass derived from waste
Table 5.2.4.1 Quantification of phases using Rietveld R.I.R method for GC 10.12.01 Table 5.2.4.2 Rietveld R.I.R. parameters for GC 10.12.01
Figure 1.1.1 Overview of current sealing types for high temperature applications Figure 1.2.1.1 Schematic representation of operating principle of a planar SOFC
Figure 1.2.1.1.1 A schematic of a single cathode-supported tubular SOFC; (a) Cross sectional view, (b) Three dimensional view of cell
Figure 1.2.1.1.2 Schematic representation of planar SOFC
Figure 1.2.1.1.3 Self-supported cell concept: a) anode-supported cell, b) compared to electrolyte-supported cell concept.
Figure 1.2.1.1.4 Planar stack design
Figure 1.3.1 Schematic cross-section of a layer in a planar stationary SOFC stack with state of the art materials for each layers
Figure 1.3.2 Schematic of one possible design for sealing the air supply manifold to a planar SOFC stack. A corresponding manifold is needed for the fuel supply
Figure 1.3.1.1 Schematic representation of the random network of alkali silicates
Figure 1.3.1.2 The simple tetrahedron and complicated groups built from [SiO4] tetrahedrons Figure 1.3.1.3 The elements of silicates structure: (a) orthogroups of [SiO4] tetrahedrons; (b)
diorthogroups of [Si2O7]
Figure 1.3.1.4 Structures of some inosilicates (single chain silicates): (a) diopside – CaMg [Si2O6]; (b) wollastonite - Ca3[Si3O9]; (c) rodonite - Mn5[Si5O15]
Figure 1.3.1.5 (Si2O5)n 2n- tetrahedral silica layer
Figure 1.3.1.6
Volume changes versus temperature for a glass system (1) and a crystalline system (2). Path CE-fast cooling, CF-slow cooling. Glass transition temperature Tg depend on
cooling rate
Figure 1.3.1.7 Typical thermal expansion curve of a glassy materials Figure 1.3.1.8 General relationship between viscosity and temperature
Figure 1.3.1.9 Glass transition temperature and coefficients of thermal expansion of sealant glasses for SOFC. The frame represents the target range defined by Geasee et al.
Figure 1.3.2.1 Heating cycle for glass ceramic synthesis Figure 3.3.1
Visual impression of the reaction between distilled water and CMAS3, CMAS2 and CMAS4 glasses. Pictures of dried glass samples after 70 days show the evidence of reaction
Figure 3.4.1 Particles size distribution of CMAS basic glass series Figure 3.4.2 Particle size distribution of CMASTi glass series Figure 3.4.3 Particle size distribution of CMASMn glass series Figure 3.4.4 Particle size distribution of CMASZn glass series Figure 3.4.5 Particle size distribution of CMASSn glass series
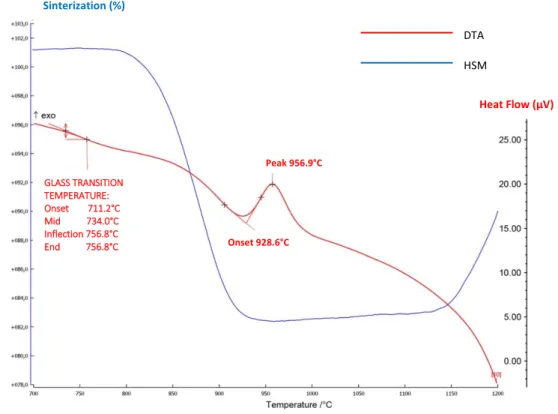
Figure 3.5.1.1 HSM and DTA curves on the temperature scale for CMAS1 Figure 3.5.1.2 HSM and DTA curves on the temperature scale for CMAS2 Figure 3.5.1.3 HSM and DTA curves on the temperature scale for CMAS3 Figure 3.5.1.4 HSM and DTA curves on the temperature scale for CMAS4
Figure 3.5.1.5 Influence of chemical composition of basic glasses CMAS on the evolution of characteristic temperatures
Figure 3.5.1.6 HSM and DTA curves on the temperature scale for CMASTi1 Figure 3.5.1.7 HSM and DTA curves on the temperature scale for CMASMn2 Figure 3.5.1.8 HSM and DTA curves on the temperature scale for CMASZn2 Figure 3.5.1.9 HSM and DTA curves on the temperature scale for CMASSn2 Figure 3.5.1.10 HSM and DTA curves on the temperature scale for CMASSn3 Figure 3.6.1 Expansion curve for CMAS1 glass system
Figure 3.6.2 Expansion curve for CMAS2 glass system Figure 3.6.3 Expansion curve for CMAS3 glass system
Figure 3.6.4 Expansion curve for CMAS4 glass system
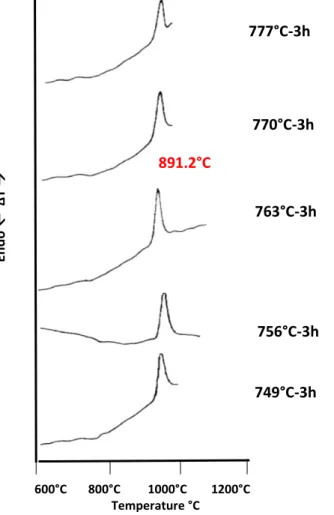
Figure 3.6.5 Differential thermal analyses traces of CMAS1 sample previously nucleated at the indicated temperature for 3h
Figure 3.6.6 Schematic diagram of CMAS glass one-step crystallization accomplished by building Ca2+ and M 2+ fast diffusion layer around the crystal
Figure 3.7.1 Viscosity of glasses belonging to CMAS1 series Figure 3.7.2 Viscosity of glasses belonging to CMAS2 series Figure 3.7.3 Viscosity of glasses belonging to CMAS3 series Figure 3.7.4 Viscosity of glasses belonging to CMAS4 series Figure 3.8.1.1 XRD patterns of the parent glasses
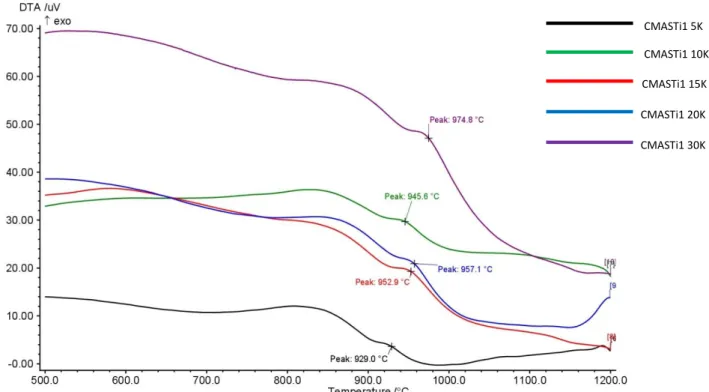
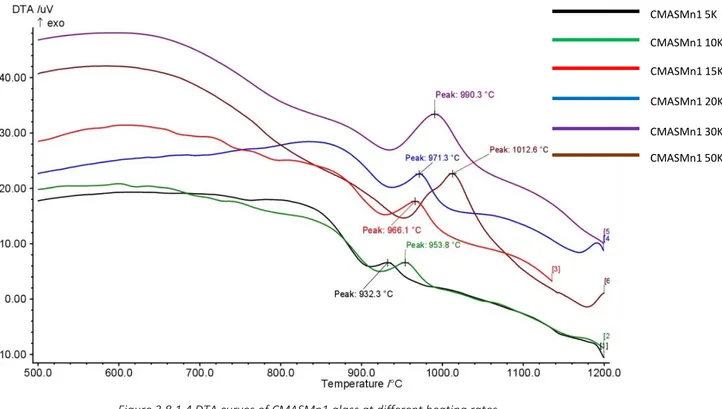
Figure 3.8.1.2 DTA curves of CMAS1 basic glass at different heating rates Figure 3.8.1.3 DTA curves of CMASTi1 basic glass at different heating rates Figure 3.8.1.4 DTA curves of CMASMn11 basic glass at different heating rates Figure 3.8.1.5 DTA curves of CMASZn1 basic glass at different heating rates Figure 3.8.1.6 Plot ln(-ln(1-x)) vs lnB for CMAS1 basic glass
Figure 3.8.1.7 Plot ln(-ln(1-x)) vs lnB for CMASTi1 glass Figure 3.8.1.8 Plot ln(-ln(1-x)) vs lnB for CMASMn1 glass Figure 3.8.1.9 Plot ln(-ln(1-x)) vs lnB for CMASZn1 glass
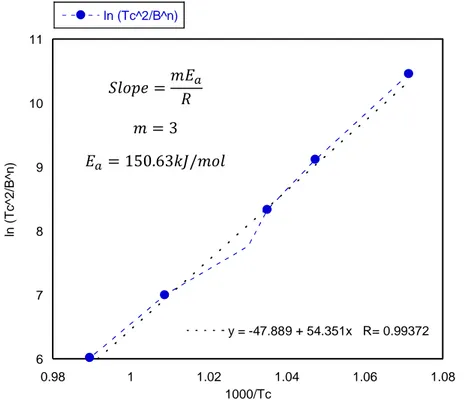
Figure 3.8.1.10 CMASMn1 Kissinger equation modified Matusita et al.for determining activation energy Figure 3.8.1.11 CMASMn1 Augis Benett equation for determining activation energy
Figure 3.8.1.12 CMASMn1 Afify I equation for determining activation energy Figure 3.8.1.13 CMASMn1 Afify II equation for determining activation energy
Figure 3.8.1.14 Activation energy derived from Kissenger equation of CMASZn glasses as a function of the (CaO+MgO)/ZnO ratio
Figure 3.8.1.15 SEM image of CMASMn4 glass sample crystallized at 1100°C for 1 hour
Figure 3.9.1.1 X-ray diffractograms of CMAS1 basic glass crystallized at different temperatures Figure 3.9.1.2 X-ray diffractograms of CMASTi1 glass crystallized at different temperatures Figure 3.9.1.3 X-ray diffractograms of CMASMn1 glass crystallized at different temperatures Figure 3.9.1.4 X-ray diffractograms of CMASZn1 glass crystallized at different temperatures
Figure 3.9.1.5 SEM micrograph of CMAS1 basic glass crystallized at 1100°C for 1h and EDS spectrum of Anorthite
Figure 3.9.1.6 SEM micrograph of CMASTi1 glass crystallized at 1100°C for 1h Figure 3.9.1.7 SEM micrograph of CMASMn1 glass crystallized at 1100°C for 1h Figure 3.9.1.8 SEM micrograph of CMASZn1 glass crystallized at 1100°C for 1h
Figure 3.9.2.1 X-ray diffractograms of CMAS2 basic glass crystallized at different temperatures Figure 3.9.2.2 X-ray diffractograms of CMASTi2 basic glass crystallized at different temperatures Figure 3.9.2.3 X-ray diffractograms of CMASMn2 basic glass crystallized at different temperatures Figure 3.9.2.4 X-ray diffractograms of CMASZn2 basic glass crystallized at different temperatures Figure 3.9.2.5 X-ray diffractograms of CMASSn2 basic glass crystallized at different temperatures Figure 3.9.2.6 SEM micrograph of CMAS1 basic glass crystallized at 1100°C for 1h and EDS spectrum
of AUGITE
Figure 3.9.2.7 SEM micrograph of CMASTi2 glass crystallized at 1100°C for 1h Figure 3.9.2.8 SEM micrograph of CMASMn2 glass crystallized at 1100°C for 1h Figure 3.9.2.9 SEM micrograph of CMASZn2 glass crystallized at 1100°C for 1h Figure 3.9.2.10 SEM micrograph of CMASSn2 glass crystallized at 1100°C for 1h
Figure 3.9.3.1 X-ray diffractograms of CMAS3 basic glass crystallized at different temperatures Figure 3.9.3.2 X-ray diffractograms of CMASTi3 glass crystallized at different temperatures Figure 3.9.3.3 X-ray diffractograms of CMASMn3 glass crystallized at different temperatures Figure 3.9.3.4 X-ray diffractograms of CMASZn3 glass crystallized at different temperatures Figure 3.9.3.5 X-ray diffractograms of CMASSn3 glass crystallized at different temperatures Figure 3.9.3.6 SEM micrograph of CMAS3 basic glass crystallized at 1100°C for 1h
Figure 3.9.3.7 SEM micrograph of CMASTi3 glass crystallized at 1100°C for 1h Figure 3.9.3.8 SEM micrograph of CMASMn3 glass crystallized at 1100°C for 1h
Figure 3.9.4.1 X-ray diffractograms of CMAS4 basic glass crystallized at different temperatures Figure 3.9.4.2 X-ray diffractograms of CMASTi4 glass crystallized at different temperatures Figure 3.9.4.3 X-ray diffractograms of CMASMn4 glass crystallized at different temperatures Figure 3.9.4.4 X-ray diffractograms of CMASZn4 glass crystallized at different temperatures Figure 3.9.4.5 SEM micrograph of CMAS4 basic glass crystallized at 1100°C for 1h
Figure 3.9.4.6 SEM micrograph of CMASTi4 glass crystallized at 1100°C for 1h Figure 3.9.4.7 SEM micrograph of CMASMn4 glass crystallized at 1100°C for 1h Figure 3.9.4.8 SEM micrograph of CMASZn4 glass crystallized at 1100°C for 1h
Figure 3.9.4.9 Phase diagrams of the system CaO-MgO-SiO2 at different Al2O3 contents: a) Al2O3 36.78wt%, b) Al2O3 19.45wt% and c) Al2O3 14.44wt%
Figure 4.2.1 XRD pattern of treated samples with dusty layer Figure 4.2.2 Particle size distribution of CMASB glasses
Figure 4.3.1 HSM and DTA curves on the temperature scale for basic glass CMASB1 Figure 4.3.2 HSM and DTA curves on the temperature scale for CMASBTi
Figure 4.3.3 HSM and DTA curves on the temperature scale for CMASBMn Figure 4.3.4 HSM and DTA curves on the temperature scale for CMASBZn Figure 4.3.5 HSM and DTA curves on the temperature scale for CMASBSn
Figure 4.3.6 Glass transition temperature trend for CMAS3 glass series and CMASB glass series Figure 4.3.7 Thermal expansion curves obtained for all CMASB glass series
Figure 4.3.8 Viscosity of the different CMASB glasses as a function of temperature Figure 4.4.1 DTA curves of CMASB basic glass at different heating rates
Figure 4.4.2 DTA curves of CMASBTi glass at different heating rates Figure 4.4.3 DTA curves of CMASBMn glass at different heating rates Figure 4.4.4 DTA curves of CMASBZn glass at different heating rates Figure 4.4.5 DTA curves of CMASBSn glass at different heating rates
Figure 4.5.1 X-ray diffractograms of CMASB basic glass crystallized at different temperatures Figure 4.5.2 X-ray diffractograms of CMASBTi glass crystallized at different temperatures Figure 4.5.3 X-ray diffractograms of CMASBMn glass crystallized at different temperatures Figure 4.5.4 X-ray diffractograms of CMASBZn glass crystallized at different temperatures Figure 4.5.5 X-ray diffractograms of CMASBSn glass crystallized at different temperatures
Figure 4.5.6 SEM micrograph of CMASB basic glass crystallized at 1100°C for 1h and EDS spectrum of Diopside
Figure 4.5.7 SEM micrograph of CMASBTi glass crystallized at 1100°C for 1h Figure 4.5.8 SEM micrograph of CMASBMn glass crystallized at 1100°C for 1h Figure 4.5.9 SEM micrograph of CMASBZn glass crystallized at 1100°C for 1h Figure 4.5.10 SEM micrograph of CMASBSn glass crystallized at 1100°C for 1h Figure 5.1.1 Process flow diagram for ceramic products manufacturing Figure 5.1.2 XRD patterns of waste derived from industrial process Figure 5.2.2.1 Particle size distribution of glass sample derived from waste Figure 5.2.3.1 Sintering behavior and DTA analysis for glass derived from waste Figure 5.2.3.2 Viscosity curve of glass derived from waste
Figure 5.2.3.3 DTA curves at different heating rates for glass derived from waste Figure 5.2.4.1 XRD patterns of GC 10.12.01 crystallized after different heat treatments
Figure 5.2.4.2 Acicular Mullite crystal dispersed in glassy phase after 1 hour at 1200°C and EDS spectrum of Mullite crystals
Introduction and objective
Over the last decades public awareness has been raised on the pressing need to reduce greenhouse gas emission. One of the most significant greenhouse gases, carbon dioxide, is released to the atmosphere by burning fossil fuels. CO2 emissions could be significantly reduced by increasing the efficiency of energy
conversion system. In central power plants, the overall efficiency could be increased by combining several complementary engines: combined cycle thermal power plants with gas turbines or steam turbines fed by exhaust gases were demonstrated in different places with efficiencies up to 58%[1].In decentralized energy
conversion systems, both electrical and thermal energies can be utilized in cogeneration systems, providing higher overall efficiencies. In comparison with conventional thermal engines, where fossil fuels are burned to produce electric energy after several conversion steps, fuel cells present the advantage to convert the chemical energy directly to electricity. Solid Oxide Fuel Cells (SOFC) are a class of fuel cells working at high temperatures of 700°C to 1000°C, thereby providing high electrical efficiencies of about 60 to 65%, with the possibility to use various fuel gases. Since a single cell unit usually generates a relatively small voltage, in order to achieve higher voltage output individual cells are connected together in series to form a stack. But significant limitations to the broad utilization of SOFC-based system are their high investment costs as well as their insufficient long-term stability. Besides the loss of performances of the cell under prolonged utilization, the gas tightness and electrical insulation of the sealing system represent critical point of fuel cell stack technologies. Seal and sealing processes are an important part of the construction process for complex devices as SOFCs. More generally, seals are probably the most challenging components for high temperature applications. Examples include sealing SiC/SiC parts in thermonuclear fusion reactors, separation membrane reactors, and planar solid oxide fuel cell (SOFC) stacks.
In SOFCs, sealing parts should fulfill stringent requirements regarding their compatibility with other cell and interconnect materials, their chemical stability at high temperature under dual atmospheres (oxidizing atmosphere on the cathode side, humidified reducing atmosphere on the anode side) and long-term constancy of their physical properties. Indeed, in planar SOFCs, fuel gas and air must be kept separate from each other to prevent a decrease in the efficiency of the production of electrical energy as well as direct combustion and local overheating of the components. Therefore, gas-tight sealing is essential along the edges of the electrodes, electrolyte and interconnects as well as between individual cells to bond the cell stacks, preventing the gases from mixing in the anode or the cathode, and providing electrical insulation to avoid shunting.
Several physical and chemical properties should be fulfilled simultaneously for a sealing material to allow proper SOFC operation. The most important are high temperature stability (between 750°C-900°C), electrical insulation (> 2kΩ·cm2), gas tightness, sufficient adaptation of the coefficient of thermal expansion (CTE) to the
electrolyte, chemical stability in oxidizing and (humid) reducing atmospheres, plasticity at the joining temperature (η ⁓ 106-108 Pa·s) and sufficient mechanical strength to withstand thermal stresses.
A great number of materials and approaches have been investigated as sealants for planar-type SOFC stacks, such as glass sealants, glass-ceramic sealants, glass-ceramic composite sealants and cement sealants. The best of these approaches succeed in sealing the cells with acceptable leakage rates. Today, glasses and glass-ceramics are widely used as sealing materials for several joining partners (glass, ceramic and metal) because they easily form hermetic seals in useful shapes. They provide electrical insulation and are also chemically stable under corrosive or oxidizing environments. Nevertheless, some problems appear with these seals during long-term operation, due to corrosion effects or cracking associated with multiple thermal cycles. Currently, the strength of the glass-ceramic sealants is considered a very important feature and for this reason over the last decade, have developed and improved glass-ceramics sealants to fulfill the requirements of planar SOFC stacks.
The main purpose of the present work is to evaluate rigid bonded glass ceramic seals for planar SOFCs. Our research aims to perform a systematic study of the properties of glasses and their counterparts glass ceramic in a particular glass-forming oxide system, the SiO2-Al2O3-CaO-MgO quaternary system, as a function of the
chemical composition. First, a review of sealing technologies has carried out with the aim to illustrate the requirements that a material must satisfy to be suitable for use as a sealant in the construction of the stack. Regarding sealing, the best performing and cheapest materials at the present time are based on silicate glass and glass ceramic. In this thesis, various aluminosilicate and boroaluminosilicate glass-ceramics with different nucleating agents have been examined as candidate for sealing materials. The main reason for studying aluminosilicate system is that this kind of materials are used in the ceramic industry for producing different types of manufactured goods, such as dishes, vessel, but also sanitary ware for example washbasins, sinks and water closets. The coarse fraction that remains after refining process is normally reburied as a waste product. In the last few years, in fact, numerous silicate based wastes, such as coal combustion ash, slag from steel production, fly ash and filter dusts from waste incinerators, mud from metal hydrometallurgy, different types of sludge as well as glass cullet or mixtures of them have been considered for the production of glass ceramics. The basic idea is to use wastes from ceramic industry as a starting material for glass ceramic seal production.
Chapter 1
Solid Oxide Fuel Cells (SOFC) and sealing concept
1.1
State of art of sealants for high-temperature applications
Sealants for high temperature applications have been developed with a focus on electrochemical devices such as SOFCs and high-temperature separation membrane reactors for oxygen separation and purification. In both cases, the sealant is responsible for gas tightness and electrical insulation. Oxygen ionic or proton-conducting ceramic membranes are technologically important in high temperature gas separation and membrane reactor processes. In practical applications, the operating temperatures are typically between 600°C and 1000°C. The joining of machined SiC/SiC composites for thermonuclear fusion reactor is another interesting application, demanding sealants capable of withstanding high temperatures. Choosing the sealing materials for high temperature applications can be very challenging because several requirements need to be respected in order to achieve a successful combination. These include good thermal and chemical compatibility, good wettability, specific viscosity, matching CTEs and an adequate bonding with the other metal or ceramic components. The high operating temperatures (650°C-1000°C) considerably limit the variety of sealing options, i.e. practically no organic or polymer seal can be employed. In Fig. 1.1.1 an overview of conventional high temperature seals is presented. Gland sealing Flat seal Composite seal
Overview sealing
types
O ring Wafe profile C oring Corrugated profile HeActive seal with gas shroud Fiber seal
Glass sealing Clamping C ring
Inorganic materials with high melting points can be used to seal the ceramic membranes at high temperatures above 600°C. Noble ductile metals, for example silver and gold, pure glass or ceramic are among the possible materials that can be used as high temperature seals, nevertheless, none of them meet all of the desired parameters. Metal seals for instance usually have higher CTEs than the joining partners, and pure glass seals can easily react with the joining surfaces provoking failure at the interfaces. Glass-ceramic seals perform better than pure metal, glass or ceramic seal because the properties of the composite seal can be tailored to match those of the joining partner materials.
1.2 Fuel cells
Fuel cells are electrochemical devices for direct conversion of chemical energy into electrical power. Different types of fuel cells were developed that follow the same basic principles and share generic component. They are composed of an oxygen electrode (cathode), an ionic conducting electrolyte and a fuel gas electrode (anode). Either on the cathode or on the anode side, gas is transported to the electrolyte where is adsorbed, dissociated and ionized. The driving force for ionic diffusion across the electrolyte is the partial pressure difference between cathodic and anodic atmospheres.
Different categories of fuel cells are defined by the employed electrolyte. The electrolyte determines the domain of operating temperatures, the choice of materials for components, conception design, possible fuel gases, efficiency and potential fields of application. Different categories are represented in Table 1.2.1., with their operating temperatures, oxidant and fuel gases, diffusing species, electrolyte and possible applications.
Chapter 1 Solid Oxide Fuel Cells (SOFC) and sealing concept
5
Operating temperature
Alkaline Fuel Cell (AFC) 60-80°C
Proton-Exchange Membrane Fuel Cell
(PEMFC) 70-90°C
Direct Methanol/Ethanol Fuel Cell (DMFC/DEFC)
70-90°C
Phosphoric Acid Fuel Cell
(PAFC) 150-200°C
Molten Carbonate Fuel Cell
(MCFC) 600-650°C
SOLID OXIDE FUEL CELL (SOFC) 650-1000°C
OXIDANT O2 AIR / O2 AIR AIR AIR / CO2 AIR
IONIC CONDUCTION OH- H+ H+ H+ CO32- O2-
FUEL H2 H2 CH3OH / CH3CH2OH H2 ref. CH4 H2 / CH4 / CO H2 / CH4 / CO
ELECTROLYTE POROUS MATRIX
SATURED IN AN ACQUEOUS ALKALINE SOLUTION OF 35-50% KOH
POLYMER MEMBRANE (the membrane is covered with a catalyst layer of Pt or Pt/Ru)
POLYMER MEMBRANE (the membrane is covered with a catalyst layer of Pt or Pt/Ru)
CONCENTRATED PHOSPHORIC ACID
ELECTROLYTE COMPOSED A MOLTEN CARBONATE SALT MIXTURE (Li2CO3,
K2CO3 OR Na2CO3)
SUSPENDED IN A POROUS CERAMIC MATRIX OF BETA ALUMINA DENSE, GAS-TIGHT OXIDE CERAMIC ELECTROLYTE, TYPICALLY YTTRIA STABILIZED ZIRCONIA (YSZ) CATHODE ANODE CARBON, NiO/Ni or POLYMER DOTED WITH A NOBLE METAL CATALYST
GRAPHITE GRAPHITE THE ELECTRODES ARE
MADE OF CARBON PAPER BONDED WITH A POLYMER (PTFE), COATED WITH A FINELY DISPERSED PLATINUM CATALYST - CATHODE: Ag2O or LITHIUM-COATED NiO - ANODE: Ni with 10 wt.% Cr - CATHODE: PEROVSKITE CERAMIC - ANODE: CERMET OF Ni-YSZ MAX. ELECTRICAL EFFICIENCY 63% 40-55% 35% 40% 55% 65% POWER OUTPUT 10-100 kW 1-250 kW 1-100 W UP TO 1 MW UP TO 100 MW UP TO 100 MW
APPLICATION AREOSPACE - AEROSPACE
- AUTOMOTIVE INDUSTRY
THEY ARE ILL-SUITED FOR POWER APPLICATION BUT IDEAL FOR CONSUMER GOODS SUCH AS BATTERIES FOR MOBILE PHONES OR LAPTOPS
PAFC HAS BEEN WELL ESTABLISHED IN THE STATIONARY FUEL CELL MARKET, SYSTEM OF 200kW ARE
COMMERCIALISED IN THE USA AND JAPAN
DEVELOPED FOR
NATURAL GAS AND COAL-BASED POWER PLANTS, UNITS OF 250Kw HAVE SHOWN OVERALL EFFICIENCIES OF UP TO 65% COMBINED TO A STEAM TURBINE AUXILIARY POWER UNITS (APU)
LIMIT INCOMPATIBILITY OF THE
ELECTROLYTE WITH CO2
- WATER MANAGEMENT FOR THE MEMBRANE PERFORMANCE - POISONING OF THE CATALIST BY CO - HIGH PERMEATION OF CH3OH THROUGH THR MEMBRANE - LOW ELECTRICAL EFFICIENCY OF ABOUT 20% TO 30% FOR SYSTEM UP TO 100 W - SOLIDIFICATION OF PHOSPHORIC ACID AT 40°C HIGHLY CORROSIVE ENVIROMENT REDUCING CELL LIFE HIGH COST OF MATERIALS
1.2.1 Solid Oxide Fuel Cell (SOFC)
The SOFC [2] is a solid-state device for electro-chemical electricity production that uses a dense metal oxide
ion-conducting ceramic material as an electrolyte, placed between a porous cermet anode or “fuel electrode” and a porous ceramic cathode or air electrode. Together, these three components are often denoted as the membrane electrode assembly (MEA)[3]. The electrolyte should be a good ionic conductor and should have no
electronic conductivity (it remains electrically insulating at high temperatures), while the electrodes should be good electronic conductors and possibly also ionic conductors. Each electrode should have a high catalytic activity for adsorption, dissociation and electrochemical reactions of the oxidant or fuel species. Depending whether the electrolyte is a pure oxygen ion conductor or a proton conductor, two types of SOFC can be considered. Figure 1.2.1.1. illustrates the operating principle of a SOFC based on an oxygen ion conducting electrolyte.
Figure 1.2.1.1 Schematic representation of operating principle of a planar SOFC.
The fuel (H2 in the figure) is brought into the anode compartment and the oxidant (air) into the cathode
compartment. Oxygen as a constituent of air at the cathode side is transformed into ions (oxygen gas is electrochemically reduced to O2-) as a result of receiving electrons from the external circuit. O
2 molecules are
adsorbed on the catalytic surface of the cathode material, dissociated and ionized to O2-, following the reaction:
𝑂2+ 4𝑒−→ 2𝑂2−
Driven by differences in potential and concentration, oxygen ions migrate to the anode through oxygen vacancies in the electrolyte[4]. The fuel at the anode side is oxidized to water by reacting with oxygen ions,
releasing electrons to the external circuit. On the anode side, the fuel molecules reach the so-called “three-phase” boundaries between metal, oxide and atmosphere. They are adsorbed and react with the diffused oxygen ions:
Chapter 1 Solid Oxide Fuel Cells (SOFC) and sealing concept
7
𝐻2+ 𝑂2−→ 𝐻2𝑂 + 2𝑒−
If the fuel is, for instance, CO, the anode reaction becomes 𝐶𝑂 + 𝑂2−→ 𝐶𝑂
2+ 2𝑒−
Electrons charge the anode negatively compared to the cathode. The ionic current between the electrodes within the electrolyte maintains the overall electrical charge balance. Finally, the flow of electrons in the external circuit generates the electrical power output. The resulting voltage can be used to feed an external circuit, returning the electrons to the cathode side. The global reaction in the fuel cell is hence given by:
2𝐻2+ 𝑂2 → 2𝐻2𝑂
or for CO
2𝐶𝑂 + 𝑂2→ 2𝐶𝑂2
If the fuel gas is methane the reaction at the anode is 𝐶𝐻4+ 4𝑂2−= 𝐶𝑂2+ 2𝐻2𝑂+ 8𝑒− and that at cathode
4𝑂2 + 8𝑒− = 4𝑂2−, resulting in the total reaction 𝐶𝐻4+ 2𝑂2= 𝐶𝑂2+ 2𝐻2𝑂. Compared with other fuel
cells, the main feature of SOFCs is the utilization of solid oxide as the electrolyte, which also prevents leakage or vaporization and makes the cell design more flexible[2]. Solid oxides used in SOFCs typically possess
sufficiently high ionic conductivity at elevated temperatures of 600°C-1000°C. Advantages of SOFCs are high energy conversion efficiency, long-term stability, fuel flexibility, low levels of NOx and SOx emissions. The largest
disadvantage is the high operating temperature, which result in longer start-up times as compared to low-temperature fuel cells as well as mechanical and chemical compatibility issues[5].
1.2.1.1 Cell and stack designs
In order to obtain high voltage and high power from SOFCs, single cells are stacked together in different ways. Two major stack design, tubular (Fig. 1.2.1.1.1) and planar (Fig. 1.2.1.1.2), are widely used, each with specific benefits and drawbacks.
Figure 1.2.1.1.1 Schematic of a single cathode-supported tubular SOFC (a) Cross sectional view (b) Three dimensional view of the cell.
The tubular SOFC (TSOFC) can be manufactured with different diameter, and the main advantage of this desing is that it does not require a high-temperature seal to separate the oxidant from the fuel. This gives the system long-term reliability. A limit to the use this kind of SOFC is the long current path around the circumference of the single cell tube which basically decreases the power density to typically 200 mW/cm2 at 1000°C [6]. A
problem is also the higher fabrication costs.
Figure 1.2.1.1.2 Schematic representation of planar SOFC.
The development of planar SOFCs for large electrical power units started before that of tubular SOFCs. The planar configurations more closely resemble a stacking arrangement, with a simple series of electrically connected cells avoiding the long current path of the tubular cell. The main advantage of the planar design over other concepts is the potential to achieve higher power densities due to the short transport paths across the cell. An additional advantage lies in the simpler fabrication technology, with the possibility to use low cost processes like screen-printing or tape-casting, representing a largescale production potential [7]. The
inconvenience of the design is the need of a high-temperature sealing. Furthermore, the ceramic layers show a lower tolerance to thermally induced stresses that can cause the cracking of the cells upon thermal cycling. Planar SOFC design can be divided in two categories:
1. Self-supported configuration, where one of the cell components acts as the structural support (Fig. 1.2.1.1.3) Cathode ⁓50µm Anode ⁓50µm Electrolyte ⁓200µm Cathode ⁓50µm Electrolyte ⁓10µm Anode ⁓5-10µm Anode substrate ⁓1500µm b) a)
Chapter 1 Solid Oxide Fuel Cells (SOFC) and sealing concept
9
A kind of this configuration is electrolyte-supported cells that offers a strong support from a dense thick electrolyte, but require a high operating temperature of about 900-1000C° to minimize the ohmic losses of the electrolyte. Anode- or cathode-supported cells with thin electrolytes (5-20μm) allow operating temperatures lower that 800°C. High conducting anode cermets have been favored as substrate but have a lower stability due to potential re-oxidation [8].
2. Externally supported configuration, including interconnect-supported cells that provide a lower electrical transport limitation than anode-supported and a stronger metallic support. However, an issue is the interconnect oxidation. Porous metallic substrate is an alternative to improve the support properties.
The advantages of reduced operation temperature include a wider choice of materials, especially low-cost materials for interconnect, reduced thermal stresses, improved reliability and longer cell life, together with reduced cell cost. Main drawbacks are slower electrode reaction kinetics and reduced thermal energy extracted from hot exhaust steams of the cell.
The actual stack design for stationary applications is presented in Fig. 1.2.1.1.4.
Figure 1.2.1.1.4 Planar stack design.
A typical planar SOFC consists of a sandwich-like structure with a thin ionic oxygen-conducting electrolyte layer, an anode usually acting as the mechanical support that is exposed to the gaseous fuel, a cathode that is exposed to air, and an interconnect material [9]. The cathode side is typically contacted using a ceramic contact
SOFCs to prevent leakage during operation and mixing of fuel and oxidant [10]. The interconnect layer is placed
between each individual cell made up of an anode, an electrolyte and a cathode, connecting them in series. Between interconnect and cell, a nickel mesh is typically inserted to work as anode current collector. The entire building up of the individual cells and the interconnect is called the stack (Fig. 1.2.1.1.2). In practical applications, a positive electrode-electrolyte-negative electrode plate (PEN), is fabricated by sintering anode, electrolyte and cathode together at high temperatures [11]. The voltage and the power of a single cell are
limited. In order to obtain higher voltage and power, interconnects with high electrical conductivity and gas-separation ability are used to provide electrical conduction between several PEN plates in a serial connection
[12]. Each of the components of an SOFC stack anodes, cathodes, electrolytes and interconnects must be
thermally, chemically, mechanically and dimensionally stable at the operating conditions and compatible, in terms of thermal expansion and chemical reactivity, with the other layers to which they come into contact.
[13].
The cell concept presents the following advantages:
- a thin electrolyte of 5 to 10 µm, with low resistance provides high power densities at low operating temperatures of 750° - 850°C.
- a thick anode substrate gives the cell mechanical stability; different thicknesses can be obtained by warm pressing or tape casting, with dimensions up to 250 x 250 mm2
- the anode functional layer and electrolyte can be coated successively by different methods including vacuum slip casting and screen-printing and co-fired
- low operating temperatures allow the use of ferritic steels as interconnect plates instead of expensive high-temperature alloys or ceramics
A major issue of planar SOFC is the need for gas-tight sealing around the edge of the cell components, but a positive point of this design is that the sealing contours for manifold are located in-plane (Fig. 1.2.1.1.4) which makes assembling easier.
1.2.1.2 Electrolyte
From a material point of view the electrolyte is one of the most demanding components in a SOFC. The electrolyte has to be physically and chemically stable in both oxidizing (PO2>0.2 bar at the anode) and reducing
conditions (PO2<10-19 bar)[14]. Thefunction of the electrolyte is to transport oxygen ions from the cathode to
the anode, and it should have no electronic conductivity. The oldest and still most used electrolyte for oxygen ion conduction is ZrO2 stabilized with 8 mol% Y2O3 (YSZ). The operating temperature is typically 800-1000°C.
Yttrium-stabilized-Zirconia is an appropriate material for this task at elevated temperatures [15] due to its low
cost, acceptable ionic conductivity, high mechanical and chemical stability [16]. YSZ is also highly stable with
respect to the anode and cathode materials during operation. The ionic conduction of YSZ is based on oxygen vacancies, which are induced by replacement of Zr4+ ions by Y3+ions [17] in the fluorite crystal structure of
Chapter 1 Solid Oxide Fuel Cells (SOFC) and sealing concept
11
zirconia. Considering the requested ionic conductivity, the electrolyte layer must be manufactured as thin as possible to yield a good cell performance. Ceria with 10-20 mol% Gd, (CGO) offers excellent promise as a potential electrolyte for lower temperature SOFC (500-600°C). However, unfortunately under the reducing atmosphere at the anode, ceria becomes an electronic conductor, which significantly reduces the efficiency of the SOFC. Extensive research is going on to tackle this problem [18-19].
1.2.1.3 Anode materials
In view of the reducing atmosphere at the anode side, metallic anodes can be used. The most commonly used material is a porous Ni-YSZ cermet with 40-50% nickel evenly distributed in a porous YSZ matrix. The Ni metal phase provides the required electronic conductivity and catalytic activity [20], whereas the 8YSZ ceramic phase
lowers the thermal expansion coefficient of the anode to match it with that of the electrolyte, prevents the Ni phase from coarsening, and offers a conduction path for oxide ions and thus the potential to extend the active zones for anode reactions [21]. Ni-YSZ anodes have been used for more than twenty years. They are also used
as anode substrates due to the high mechanical strength and good operation performance. Other anode materials are perovskites (ABO3) of the LaCrO3type doped with Ca, Sr, or Ti, and SrTiO3 doped with niobium or
lanthanum e.g. Sr0.6Ti0.2Nb0.8 O3 and La0.4Sr0.6TiO3 [22-23-24].
1.2.1.4 Cathode materials
Possible SOFC cathode materials have been investigated for many decades. Noble metals could be used but are excluded for the high cost. Most cathode materials are perovskite materials. Indeed, ceramics with perovskite structure possessing high electronic conductivity have so far been the materials of choice for cathodes. The most common cathode material is lanthanum manganite doped with strontium La1-xSrxMnO3
(LSM), it has been used for almost one decade due to its high electrochemical activity for oxygen reduction at operation temperatures, good stability, and good thermal expansion match with YSZ anode and electrolyte materials [25]. Another important benefit is that it shows no chemical reaction with common electrolyte
materials. Recently the focus has shifted towards lanthanum cobaltite doped with Sr and Fe of the type La1-x
SrxCo1-yFey O3 (LSCF), due to its better performance at lower temperatures (750°C and below) envisaged for
future SOFC developments. Other option could be lanthanum cobaltite LaCoO3 (LC), lanthanum calcium
cobaltite ferrite (LCCF), samarium strontium cobaltite (SSC) [23-26-27]. Thecathode is often made of two layers,
one consisting of a porous mix of electrode and electrolyte (e.g. LSM/YSZ) and the other pure electrode material (e.g. LSM). These two-layers cathode give a better match of the thermal expansion coefficients between electrolyte and the cathode and better chemical compatibility without reducing the performance of the cathode.
1.2.1.5 Interconnect materials
To obtain functional fuel cell units, the single cells have to be assembled in stacks in order to give enough power for commercial use. This can only be accomplished by some interconnects between each cell. Indeed, the main purpose of the interconnect plates is to provide electrical connection between two successive cells, separation between both atmospheres and distribution of the fuel and oxidant gases, avoiding the electrical contact between the anode of one individual cell and the cathode of the neighboring one in the stack. The materials for the interconnect parts are selected for their high electronic conductivity, low thermal expansion mismatch to cell components (coefficient of thermal expansion, CTE, of about 10.5-12.5·10-6 °C-1 between
room temperature and the operating temperature in the range 750°C to 850°C [28-29]) and chemical stability in
both high and low oxygen partial pressures corresponding to cathode and anode atmospheres, respectively. Interconnect materials should not undergo significant shape changes with temperature or oxygen partial pressure changes [30]. The materials should show a high thermal conductivity to allow a uniform heat
distribution across the stack, as well as a good chemical compatibility with adjacent stack components. In addiction the interconnect parts should be fabricated with a high density to ensure gas tightness and a high creep resistance, as the bottom cells of the stack are under a large weight load.
Different types of interconnect materials were successively developed for different ranges of operating temperature (Table 1.2.1.5.1). Operation temperature Ceramic materials 900-1000°C Metallic materials BELOW 800°C EXAMPLES OF SUITABLE MATERIALS
- LaCrO3 doped with divalent cations, e.g.
La1-xMx CrO3 (M= Sr2+, Ca2+ or Mg2)
- Y CrO3
- Ni-alloys
- Cr-alloys or FeCr-alloys - Ferritic stainless steels
PROPERTIES - They can easily be modified to fulfil the main requirement
- The electrical conductivity of these perovskites is improved by substituting divalent ions, such as Sr2+, Ca2+ or Mg2+on
either the A or the B sites of the ABO3
lattice
- CTE could be markedly increase by doping the perovskites with aliovalent ions such as Co+. In the lattice ABO
3, the
replacement of a trivalent by a divalent ion is electrically compensated by the formation of tetravalent chromium ions at high PO2.
- Higher electrical and thermal conductivity
- Easier fabrication with low machining costs
- High oxidation resistance with CTEs close to the ceramic components
- The chromium content has to be higher than 17 wt% to ensure the formation of a protective chromium oxide layer, but larger amounts are required to achieve low CTE values and offer a chromium reservoir.
- Al and Si contents are avoided to prevent the formation of an external protective layer, which low electronic conductivity would increase the resistance at the interface are fabricated by power metallurgy from mixture of Cr flakes, Fe and Y2O3
powders, and additional alloying elements like Mn, Ti and Mo to improve the physical and chemical properties of intermediate temperature alloys.
Chapter 1 Solid Oxide Fuel Cells (SOFC) and sealing concept
13
- The alloys are fabricated by powder metallurgy from mixture of Cr flakes, Fe and Y2O3 powders, an additional
alloying element like Mn, Ti, Mo to improve the physical and chemical properties of intermediate temperature alloys. A fine distribution of Y2O3 particles is essential to improve
the oxidation resistance of the alloys, as well as their mechanical properties.
- Small amount of Mn and Ti could be added to provide an external (Cr,Mn)3O4 spinel formation of volatile
Cr-species and to obtain fine internal titania precipitates for strengthening of the near-surface region.
- Lanthanium appears the most beneficial because it becomes distributed in the alloy rather that forming intermetallics at grain boundaries like Y or Ce.
LIMITS - The change of valence state, together with a variation of the oxygen vacancy concentration in a reducing atmosphere, leads to a volume expansion generating mechanical stresses within the interconnect
- Low thermal conductivity (< 5Wm-1·K-1)
that causes strong thermal gradients in the stack
- Drawback of chromite materials are related to their fabrication process, they are difficult to sinter up to high density under high Po2, and lack a proper
workability to large dimensions due to their brittleness
- Commercially available high temperature oxidation resistant alloys could not directly be used to their high CTE
- The electrical conductivity is controlled by the oxide scale formed at high temperature
- Under either oxidizing or reducing atmospheres, Cr- and FeCr-based alloys form a chromium oxide layer, which growth rate id strongly affected by size and distribution of the oxide dispersion. Small dispersion size and small distances between the particles insure an optimum reduction of the oxide growth rate
Table 1.2.1.5.1 Different type of interconnect materials.
1.2
Sealing
In this research work the attention will be focused in particular on the study of new materials for sealing applications in solid oxide fuel cells. Several seal concepts for SOFCs have been developed during the last 20 years but few have been tested for long time (> 2 years) under realistic conditions. A key challenge in assembling planar SOFC systems is to create and maintain a hermetic seal between a thin dissymmetric stack of ceramic layers and the metallic interconnect plate.
The schematic cross-section of the sealing in Fig.1.3.1 highlights the main problems related to joining of planar SOFCs.
Figure 1.3.1 Schematic cross-section of a layer in a planar stationary SOFC stack with state of the art materials for each layers. *LSM: (La, Sr)1-xMnO3-δ or LSCF: (La, Sr)1-x(Co, Cu, Fe)O3-δ perovskites
**8YSZ: 8mol% Yttria-Stabilized Zirconia
***Ni/8YZS cermet: cermet of 8YSZ with 40 vol% Ni
Interconnect and frame: 17-26 wt% Cr ferritic steel or powder metallurgy alloy
Finding solutions for the seal challenges are crucial for large scale use of SOFC technology. The main functions of sealing materials for fuel cells are to ensure the gas separation between both gas atmospheres, i.e. air on the cathode side and fuel gas on the anode side, and to guarantee electrical insulation between two successive interconnect planes. Solid oxide fuel cells typically work under a gradient of oxygen partial pressure across a dense, gas-tight electrolyte. Leaks due to fabrication defects or degradation of the components or interfaces during operation, reduce the system performance drastically, if not lead to complete failure of the stack [31].
The seal has to match the electrolyte, cathode and interconnect materials with respect to thermal expansion. Depending on the design, the seal might have to join ceramic to ceramic, ceramic to metal or metal to metal. For air and fuel supply, the SOFC stacks need manifolds with corresponding sealing as shown in Fig. 1.3.2.
Figure 1.3.2 Schematic of one possible design for sealing the air supply manifold to a planar SOFC stack. A corresponding manifold is needed for the fuel supply.
Hence the sealant must be tailored to match the thermal expansion coefficient of the adjacent materials, cell (anode substrate) and interconnect [32]. Even a modest degree of thermal expansion mismatch can cause
Chapter 1 Solid Oxide Fuel Cells (SOFC) and sealing concept
15
substantial bowing of the cells, which can lead to fuel and air mal-distribution in the stack and hence poor system performance [33] as well as fracture of sealant and/or cells.
Sealants need to withstand thermal cycles during the routine operation of SOFC stacks in a stationary design, the envisaged operation lifetimes being more than 40000 h with up to 100 thermal cycles for stationary application and 5000 h with at least 2000 cycles under high heating rates (short start-up time) for mobile applications at high operating temperature (600 °C and more). Given the importance of its role, there are some severe conditions which the sealants material must satisfy [34]. A critical problem is the chemical stability
of the sealing materials at high temperature, for this reason they should show a limited reactivity with adjacent components, typically the yttria-stabilized zirconia (YSZ) electrolyte and chromium-rich ferritic steel interconnect and should be stable against evaporation. Besides these stringent requirements, other specifications are closely tied to the cell and stack design as well as the system application, i.e. either mobile or stationary application. The functional requirements of sealing systems for SOFCs can be summarized as follows (Table 1.3.1):
CHEMICAL PROPERTIES MECHANICAL PROPERTIES ELECTRICAL PROPERTIES DESIGN AND FABRICATION Long-term stability under
dual air//wet fuel atmospheres up to 850°C
Hermetic sealing or low, non–localized leakages
Electrical insulation between interconnect plates (ρ=1MΩ·cm)
Simple processing and flexible design
Limited reactivity with adjacent components, low corrosion of ferritic steel interconnects
CTE matching the cell substrate and interconnect (Δα≤1.5·10-6°C-1) or
dissipation of thermal stresses
High reliability and reproducibility High bond strength to joined
components or applied compressive load
Low cost Tolerance to
thermos-mechanical and externally applied stresses
Table 1.3.1 Functional requirements of sealing systems.
Different approaches have been imagined to fulfill those demanding specifications and can be classified into three categories:
1. Rigid bonded seals
In a rigid sealing design, the sealant material (non-deformable at room temperature) forms a joint (chemical bond) that is non-deformable. Due to the inherent brittle nature of the materials, suitable materials for this type of sealant are glass, glass-ceramics and ceramics. Another option for rigid seals is composite sealants, where the addiction of either an inert or a reactive filler material to a glass matrix in controlled proportion, allow to tailor the thermo-mechanical properties of the composite
[35]. For high temperature purposes seals based on glass or glass-ceramics are the most promising
concept because of their high chemical stability at high temperature. Nevertheless, due to the inherent brittle nature of these materials, they are sensitive to tensile stresses, caused by thermal
expansion mismatches between the sealant and adjacent components. Glass is cheap, readily available and can be supplied as a paste or paint of powder mixed with a liquid binder. The glass powders can be also tape cast in thin sheets, which can be cut into special shapes to fit the parts to be sealed. The sealing function is achieved by heating the membrane assembly with the “green” seals to a temperature high enough for the seal to sinter completely. The maximum temperature for the sealing cycle should be lower than for all the fabrication steps of the cell components and higher than the operational temperature. The seal must wet the components during sealing, but not react in a way that reduces the performances of the seal or the sealed components.
2. Compliant bonded seals
In contrast to rigidly bonded seals, compliant seal forms a bond that undergo plastic deformation at operating temperatures. In this way stresses that arise from external expansion mismatch between the cell components of the stack can be relaxed to a certain extent. However, this approach raises different issues like the possible bend of non-constrained cells, which in turn implies losses in electrical contact and non-uniformity of gas distribution across the cell. In addition, similar problems of electrical conduction are encountered like with metal gaskets, if metal-based materials are used. Therefore, the approach requires the development of insulating layers to prevent internal short-circuiting. The implementation of this technology remains difficult due to the need of reliable high temperature sealing materials.
3. Compressive seals
Compressive seal is based on deformable materials that do not bond to the adjacent components but rather serve as a gasket. That is, the sealing parts need to conform to the adjacent surfaces and require constant compressive load during use. Because not rigidly bonded, the sealing surfaces can slide along on another and components are free to expand and contract during thermal cycling with no need to consider CTE matching. Additionally, they open the possibility to replace damaged cells or interconnect part during service time, by release of the compressive load on the stack during operation, which should be tolerable for the cell components. Further problems are related to the load frame oxidation, load relaxation due to creep, and increased weight and thermal mass that reduce the specific power of the overall system.
Each of these concepts has advantages and limitations. In table 1.3.2 [36-37] the properties of each type of seal
Chapter 1 Solid Oxide Fuel Cells (SOFC) and sealing concept
17
Sealing concept ADVANTAGES DISADVANTAGES
R igi d bo nd e d sea ls Glass ceramic Electrical insulation Gas tightness Paste processing Hermetic seal Tailorable performance by composition design High electrical resistivity Suitable for stationary and mobile applications Flexible in design and fabrication Control of phase content Chemical reactivity
Fragile fracture Brittle at low temperature Poor resistance to
thermal cycling Chemical reaction
with other cell components Ceramic
Chemically inert Pyrolysis processing Non-adapted CTE Fragile fracture
Composite
Tailored CTE Filler phase stability Control of viscous flow Fragile fracture C ompr e ssi ve s eal s Metal gasket
Plastic stress relaxation Enable disassembling Easy replacement of seals in a malfunctioning cell stack. Resistance to thermal cycling Non-adapted CTE Permanent gas leakage Creep under high load
Application of external load Complex design
and high cost High gas leakage
rate Unsuitable for mobile application Poor stability Electrically conductive Mica-based
Elastic High leakage rates High permanent load
Metal-mica
Elastic
Plastic stress relaxation Enable disassembling
Electrical conductivity High permanent load Complex processing C omp lian t s eal s Metal brazing Gas tightness
Plastic stress relaxation Paste, sheet processing
Low thermal stress
Electrical conductivity Chemical reactivity Processing (T, atm) Non-wetting to other SOFC components Poor oxidation resistance Hydrogen embrittlement Electrically conductive Glass Electrical insulation Gas tightness Plastic deformation Chemical reactivity Stability against evaporation “Wet” seal Gas tightness Plastic “self-healing” Chemical reactivity Stability against evaporation Electrical insulation
Table 1.3.2 Overview of potential sealing concepts for SOFCs.
Rigidly bonded seals have many advantages compared to compressive and compliant seals and are preferred for SOFCs. For this reason, the emphasis of this work is mainly put on developing a new glass ceramic for rigid bonded seals.
Glass and glass ceramic seals are flexible in design, easy to fabricate, and cost-competitive. A wide range of materials’ properties required for sealing can be achieved with glass and glass-ceramic seal by compositional design [38]. These materials have a good resistance to the oxidizing and reducing atmospheres in the stack,
hermetically separate anode and cathode gas supply, are chemically stable to any component materials or gaseous species in the stack environment, and possess a sufficient bonding strength to withstand the operation-induced stresses [39]. Moreover, the glass paste can be manufactured to the sealing surface due to
the good wetting behavior and can be designed to have a good matching of the thermal expansion coefficient to those of the adjacent layers [40]. Glasses and partially crystallized glass-ceramics are characterized by a glass
ductile behavior [40]. During the joining process, the glass might partially or fully crystallize. Furthermore, it will
react with the joining partner (or oxide layer) to form a rigid bonding. The resulting interfacial phases might thicken and become porous during long annealing times implying a susceptibility to micro-cracking when thermally cycled [41]. Crystallization is advantageous since the resulting microstructure is mechanically stronger
than the initial glass [42].
1.3.1 Glass material
Glass is an amorphous solid material which possesses no long-range atomic order and, upon heating, gradually softens to finally reach a molten state [43]. The glass components can be classified mainly into network formers,
network modifiers and intermediates (Fig. 1.3.1.1).
Figure 1.3.1.1 Schematic representation of the random network of alkali silicates.
Inorganic glasses consist of one or several network formers, one or several network modifier and often also some intermediates [44]. The network formers build the main structure of the glass. The network modifiers
strongly influence the glass properties. The intermediates stabilize the glass structure depending on their mole fraction. The functions of different oxide constituents in glass are listed in table 1.3.1.1. [45]
Glass constituent Oxide Function
Network former SiO2, B2O3 Form glass network
Determine Tg and Ts
Determine thermal expansion coefficient (CTE)
Determine adhesion/wetting with other SOFC components Network modifier Li2O, Na2O, K2O
BaO, SrO, CaO, MgO
Maintain charge neutrality
Create non-bridging oxygen species
Modify glass properties such as Tg, Ts and CTE Intermediate Al2O3, Ga2O3 Hinder devitrification
Modify glass viscosity Additive La2O3, Nd2O3, Y2O3 Modify glass viscosity

![Figure 1.3.1.2 The simple tetrahedron and more complex groups built from [SiO 4 ] tetrahedrons](https://thumb-eu.123doks.com/thumbv2/123dokorg/2895574.11619/34.892.242.619.242.596/figure-simple-tetrahedron-complex-groups-built-sio-tetrahedrons.webp)