Università degli Studi di Roma “Tor Vergata”
Facoltà di Medicina e Chirurgia
Dottorato di Ricerca in
“Microbiologia Medica ed Immunologia”
XX ciclo
Coordinatore Prof. Carlo F. Perno
Evaluation and characterization of the capability of dendritic
cells generated by exposure of human peripheral blood
monocytes to GM-CSF and IFN-alpha of inducing CD8 T cell
priming and TH1 polarization
Anno Accademico 2007-2008
Candidato Relatore Dott. Simona Donati Dott. Maria Ferrantini
Index
Introduction………...3
1.1 Biology of dendritic cells………...3
1.2 Role of dendritic cells in linking innate and adaptive immunity……....5
1.3 Type I IFNs ………....9
1.4 Differentiation of highly active dendritic cells from human peripheral blood by a single-step 3-day culture with IFN-α………10
Background and Aim of the study………..14
Materials and Methods 2.1 Cell Separation and Culture ………..17
2.2 Immunophenotypic Analysis……….18
2.3 Phagocytosis………..………18
2.4 Antigen presentation assay of the HCV-NS3 protein to the specific CD8+ T cell clone………...18
2.5Detection of HIV-1 infection in DC cultures………19
2.6Immunization of hu-PBL-SCID Mice………...20
2.7ELISA for Human Immunoglobulins………20
2.8Recovery of Cells from hu-PBL-SCID Mice and ELISPOT Assay…..21
2.9In vitro induction of cross-priming of CD8+ T cells against HIV-1 antigens by using either purified CD8+ T cells or total PBLs……….21
2.10Detection of cytokine production ……….22
2.11Evaluation of IL-23 and IL-27 subunit mRNA expression by real-time RT-PCR analysis……….23
2.13 Naïve CD4+ T cells expansion and phenotypic analysis of specific surface markers………23
2.14 Polarization of naïve T cells and intracellular cytokine staining …...24
2.16 Cytokine production………25
2.17 Real Time quantitative PCR to evaluate expression of mRNA Toll Like Receptor ……….25
Results 3.1 Comparison between IFN-DCs and IL-4-DCs for capabilities of antigen-uptake and endosomal processing……….26
3.2 Cross-presentation of exogenous soluble antigens to CD8+ cells by monocyte-derived DCs………29
3.3 Comparison of 3-day IFN-DCs versus CD40L-activated IL-4-DCs for their capability to induce humoral response and cross-priming in hu-PBL-SCID mice………...33
3.4 Efficient CD4+ T cell-independent generation of effector CD8+ T cells against HIV-antigens by IFN-DCs in vitro……….41
3.5 IFN-DCs exhibit a high capability to express the IL-12 family cytokines IL-23 and IL-27 upon sCD40L-induced maturation…………...44
3.6 Different expression of TLRs between IFN-DC and IL4-DC………..47
3.7 IFN-DC, stimulated or not with TLR agonists, drive a TH1 oriented polarization of naïve T lymphocytes………...51
Discussion………...57
References………...63
Introduction
Biology of dendritic cells
Dendritic cells (DCs) are the most potent antigen-presenting cells (APC) characterized by a unique capacity to stimulate naïve T cells toward microbial and tumor antigens and to initiate primary immune responses [Liu YJ., 2001; Cella M. et al.,1997; Steinman R.M., and J. Banchereau, 2007]. DCs represent 0.5-1.5% of circulating human mononuclear cells derived from hematopoietic progenitor cells. In recent years, several studies have suggested that DCs also play critical role in the induction of central and peripherical immunological tolerance, regulate the types of T cell immune responses, and function as “sentinels” in innate immunity against microbes [Liu YJ., 2001; Banchereau J, and Steinman. R.M., 1998; Steinman RM, and M.C. Nussenzweig, 2002]. Different subsets of DC precursors can be distinguished in human blood, based of the relative expression of specific surface markers: a major CD11c+ population, either CD1a+ or CD1a-, expressing the CD13, CD33 and GM-CSF-receptor (referred as myeloid DCs), and a CD1a-/CD11c- population expressing high levels of CD123 (IL-3Rα), originally called lymphoid DC, and known as plasmacytoid DCs (pDCs), which represent the major source of type I IFN upon virus challenge [Liu YJ., 2001; Cella, M., et al.,1999; Siegal, F.P., 1999]. The major pool of myeloid DC precursors is represented by monocytes, which give origin to interstitial DCs or tissue-resident DCs and Langherhans cells (LCs) [Caux, C., 1996]. Immature DCs are generally located in peripheral tissues, in sites where they can optimally survey for incoming pathogens. The interaction of DCs with pathogens leads to migration to secondary lymphoid organs where they can initiate a specific T cell response. This
complex process is associated with differentiation and functionalactivation of DCs [Cella M.,et al., 1997, Steinman R.M., and Banchereau J., 2007; Banchereau J, and Steinman R.M., 1998]. Notably, the migratory behaviour of DCs is strictly regulated by their capacity to respond to different sets of soluble factors, namely chemokines that characterize maturation stage and shape functional activities of DCs [Dieu-Nosjean M-C, et al., 1999; Sozzani S, et al., 2000]. DCs represent an essential link between innate and adaptive immune responseby acting as an interface between the environment and the immune system and by subsequently directing the quality of the adaptive response to incoming pathogens. Immature DCs are capable of efficiently capturing and internalizing a wide spectrum of antigens, bacteria, viruses, apoptotic bodies and necrotic cells, by different mechanisms such as conventional phagocytosis, macropinocytosis and receptor-mediated endocytosis via C-type lectin receptors, such as mannose receptor, DEC-205, DC-SIGN (CD209), FCγ receptors type I (CD64) and type II (CD32) [Bell, D. et al., 1999; Sallusto, F. et al., 2000]. The transition from immature to mature DCs is characterized by phenotypic and functional changes, which are tipically induced by inflammatory cytokines such as IL-1 and TNF-α or by bacterial and virus-derived molecules, such as LPS, double strand RNA, poly I:C and DNA. As a consequence, DCs loose the capacity to phagocytose and their sensitivity to some inflammatory chemokines (i.e., CCL3, CCL4 and CCL5), as they are induced to express a new and different set of chemokine receptors. The expression of CCR7, make mature DCs responsive to CCL20 and CCL21 chemokines, which are responsible for DC migration to the T cell areas in lymphoid tissues [Heath, W.R, and Carbone, F.R, 2001]. Mature DCs express high levels of membrane accessory molecules, such as CD80, CD86 and CD40, upregulate MHC class I and II antigens and exhibit a strong capability to initiate an immune
response. Of note, DCs are capable to exploit peculiar MHC class I-restricted antigen presentation pathways. Besides the classical presentations of endogenous peptides derived from intracellular proteins and pathogens, DCs are endowed with the aptitude to present MHC class I-restricted epitopes derived from exogenous antigens exploiting unconventional antigen processing pathways, ensuring the efficient “cross priming” of cytotoxic CD8+ T cells [Heath, W.R, and Carbone, F.R , 2001; Albert, M.L. et al.,1998]. Of note, regulation of MHC class-II appears to be specifically modulated in pDCs and myeloid DCs with respect to other cell types [LeibundGut-Landmann, S. et al., 2004].
Role of dendritic cells in linking innate and adaptive immunity
Innate recognition of infection in vertebrates can lead to the induction of adaptive immune responses through activation of dendritic cells (DCs). DCs are activated directly by conserved pathogen molecules and indirectly by inflammatory mediators produced by other cell types that recognise such molecules. In addition, it is likely that DCs are activated by poorly characterised cellular stress molecules and by disturbances in the internal milieu. The multiplicity of innate pathways for DC activation may have evolved to ensure that any signs of infection are detected early, before overwhelming pathogen replication [Reis e Sousa C., 2004a].
Cells of the innate immune system, including DCs, possess pattern-recognition receptors (PRRs) that recognise conserved molecular motifs found in microrganisms: pathogen-associated molecular patterns (PAMPs), from viruses, bacteria, fungi and protozoa. The best-studied pattern-recognition receptors are toll-like receptors (TLRs). The engagement of TLRs on DCs leads to increased expression of MHC–peptide complexes
and co-stimulatory molecules, as well as the production of immunomodulatory cytokines, all of which have a profound effect on T-cell priming and differentiation, thus indicating that TLRs link innate and adaptive immunity [Reis e Sousa C., 2004a ; Steinman R.M., and Hemmi H., 2004 ; Reis e Sousa C., 2004b] The activation of many of them (TLR3, TLR4, TLR7, TLR8, and TLR9) results in the induction of type I IFN gene expression in different DC subsets [Levy D.E. et al., 2003; HondaK. et al., 2005]. TLR are type I trans-membrane proteins consisting of at least 10 members in humans and 12 in mouse. The pattern of TLR expression in different DC types and their interaction with specific ligands regulates cytokine and chemokine production. Each member of the TLR family recognizes a specific set of bacterial- or viral-derived molecules [Akira S., 2006] (Table 1).
The adaptive immune response is biased during the process of antigen presentation by DCs and is affected by the cytokine milieu [Steinman R.M., and Hemmi H., 2006]. Inflammatory cytokines generally promote DC activation, favoring a TH-1 type of immune response through the production of IL-12 and of both IL-23 and IL-27, the newly discovered members of IL-12 cytokine family. In contrast, exposure of immature DCs to IL-10 results in impairment of the up-regulation of costimulatory molecules and CD83 as well as in the inhibition of the development of a fully mature DC phenotype; this can promote the induction of anergic T cells, characterized by reduced IL-2 and IFN-γ production and low CD25 expression [Steinbrink, K. et al.1997;Steinbrink, K. et al., 1999].
The availability of defined cell culture conditions for generating relatively large numbers of DCs from cell precursors has allowed an impressive advance in our comprehension of DC biology. DCs can be obtained from CD34+ stem cells and expanded and differentiated in vitro upon exposure
to cytokine cocktails, including GM-CSF, IL-4 and TNF-α [Caux, C. et al., 1992;Luft, T. et al., 1998]. Currently, large numbers of immature DCs are obtained from monocytes cultured in the presence of GM-CSF and IL-4 for 5-7 days [Sallusto, F. and Lanzavecchia, A, 1994]. GM-CSF is required to ensure monocyte survival, whereas IL-4 exerts an inhibitory activity on macrophage differentiation, promoting the generation of immature DCs [Romani, N. et al., 1994]. Maturation/activation of DCs is reached through a further culture step with maturation agents, such as LPS and Poly-I:C (ligands of Toll-like receptor), TNF-α (pro-infiammatory cytokine), CD40L or with a cytokine cocktail known as the “golden standard” (IL6, IL1β, TNF-α and prostaglandin E2)[ Jonuleit H. et al. 1997; O'Sullivan, B.J. and Thomas, R., et al., 2003; Fujii, S. et al., 2004]. Even though the IL-4/GM-CSF culture method has allowed to perform many important studies on DC biology, this pathway of DC differentiation may not reflect the physiological process by which monocytes differentiate into DCs in
vivo, as high levels of IL-4 are unlikely to be present in the course of a
natural immune response to infections. Since type I IFNs are rapidly produced in response to viruses and other stimuli, these cytokines could represent early danger signals ensuring an efficient link between innate and adaptive immunity, thus acting as physiological factors involved in DC differentiation.
Table 1: Toll-like receptor and their ligands PRR LIGANDS LOCALIZATION TLR1 Lipoproteins Cell-surface (co-receptor of TLR2) TLR2 Peptidoglycan (Gram-positiv bacteria) Cell-surface
TLR3 dsRNA (Poli I:C) Endosomal
compartiments TLR4 Lipopolysaccharide (Gram-negativa bacteria) Cell-surface TLR5 Flagellin Cell-surface TLR6 Lipoproteins Cell-surface (co-receptor of TLR2)
TLR7 ssRNAs (Imiquimod) Endosomal
compartiments
TLR8 ssRNAs (Resiquimod) Endosomal
compartiments TLR9 Bacterial or viral unmethylated CpG DNA motif Endosomal compartiments TLR10 Unknown Unknown
Type I IFNs
IFNs represent a growing family of cytokines which share antiviral activities and overlapping signalling pathways. IFNs have been classified in three types based on their receptor usage: in humans type I IFNs contain 13 IFN-α, 1 IFN-β, 1 IFN-ω, 1 IFN-ε, 1 IFN-κ; type II IFN includes a single IFN-γ, while type III IFNs consist of IFN-λ1, IFN-λ2 and IFN-λ3. Type I IFNs use a receptor composed of IFNAR1 and IFNAR2 chains, type II IFN binds to a receptor formed by IFNGR1 and IFNGR2 chains, and type III IFN receptor consists of IFNLR1 and IL10R2 chains [Pestka S.et al., 2004; Coccia E.M., 2008]. Type I IFNs are currently recognized as “danger” molecules signalling the presence of a wide variety of infectious agents and providing a link between innate and adaptive immunity [Gallucci S. and Matzinger P.; 2001; Santini S.M. et al., 2002; ToughD.F., 2004]. Essentially all cells, that are susceptible to a viral infection, may release type I IFNs. Type I IFNs, especially IFN-α, originally considered as a simple antiviral substance, is an important cytokine for the generation of a protective T cell-mediated immune response to virus infections and tumor growth. It is present at low levels under normal physiological conditions, but can be secreted at high levels soon after cell exposure to viruses or other stimuli [Belardelli, F., and Gresser I., 1996; Belardelli, F. et al., 1984; Mohty M. et al., 2003]. However, within the immune system dendritic cells are unique for their ability to recognize and respond to a variety of pathogens through the release of these cytokines and, at the same time, to act as guardians against pathogens and as potent antigen presenting cells capable of inducing an appropriate immune response [Reis e Sousa C, 2004a; Steinman RM, and Hemmi H., 2006].
IFN-α and IFN-β are currently the most used cytokines in clinics, especially in the treatment of cancer and certain infectious diseases. Early
studies had reported multiple effects of IFN-α/β on the immune system, including the enhancement of macrophage functions and of natural killer (NK) cell activity [Belardelli, F. et al., 1984; Belardelli F., 1995; Belardelli F., and Ferrantini M., 2002]. Besides its well known role in innate immunity, type I IFNs are considered to play a role in the shaping of adaptive immunity, as previously demonstrated in mouse tumor models [Belardelli, F. et al., 1984; Belardelli F., 1995] and more recently by a series of papers highlighting the role of type I IFNs, in particular of IFN-α, in the modulation of T cell functions, including the polarization of T-helper cells toward the TH-1 type of immune response and the generation/activation of cytotoxic T lymphocytes (CTL) [Belardelli F., and Ferrantini M., 2002; Ferrantini M. et al., 2007].
Differentiation of highly active dendritic cells from human peripheral
blood by a single-step 3-day culture with IFN-
α
In recent years, a number of studies have investigated the effects of IFN-α and of IFN-β on the differentiation of human DCs. In spite of some contrasting results probably due to the experimental setting, i.e. the timing of cytokine addition and culture conditions, several groups have independently demonstrated that type IFNs efficiently promote the differentiation of peripheral blood monocytes into DCs. In particular, monocytes expose to IFN-α together with GM-CSF acquire the features of fully functional partially mature DCs (IFN-DCs) after no more than 3 days of culture [Santini S.M. et al., 2000;Paquette R.L. et al., 1998].
IFN-DCs undergo an early loss of adhesion to the substrate and are bent to form large cell clusters, developing long dendritic-like processes in a
CD86 and CD40,the intercellular adhesion molecule, ICAM-1 (CD54) and HLA-DR is rapidly enhanced, while low levels of CD14 are retained all through the differentiation process together with significant levels of CD123, typical of plasmacytoid DCs. Even though the majority of DCs generated in the presence of IFN-α displayed features of immature DCs, markers of activated/mature DCs, such as CD83 and CD25, could be unexpectedly detected in a variable percentage (12%–40%) of cells, concomitantly with high levels of costimulatory molecule expression (Fig.1).
Consistently with their partially activated phenotype and in agreement with the attribution of IL-15 production to CD83-expressing DCs, IFN-DCs produce significant amounts of IL-15 in the culture supernatant [Santini S.M. et al, 2000; Parlato S. et al., 2001; Jonuleit H. Et al., 1997b]. Interestingly, IFN-DCs were found to markedly express the molecule TRAIL (TNF-related apoptosis-inducing ligand) and to specifically kill TRAIL-sensitive tumor cell lines [Santini S.M. et al., 2000; Korthals M. et al., 2007 ; Papewalis C. et al., 2008]. Very recent studies have shown that monocyte-derived IFN-α-induced DCs combine features of NK cells and mature DCs, as demonstrated by anti-CD56 antibody staining and microarray gene expression profiling that revealed a higher expression of genes coding for DC maturation markers and molecules linked to DC migration to the lymph nodes, like DC-LAMP, CCR7 and CD49d, as well as for markers of NK cells, including granzymes and TRAIL. Of note, the TRAIL-dependent cytolytic activity of IFN-α-DCs was attributed to the CD56+ fraction [Korthals M. et al., 2007 ; Papewalis C. et al., 2008].
IFN-DCs also exhibit an enhanced chemotactic response and migration activity. They express very high levels of CCR5 and exhibit an enhanced response to its ligands CCL5, CCL3 and CCL4,whilea remarkable fraction
of IFN-DCs expresses CCR7, shows a migratory response to CCL19 and expresses significant levels of CCL19 themselves, together with CCL18 and CXCL10 [Parlato S. et al., 2001].
IFN-DCs are able to stimulate the proliferative response of allogeneic T cells and the production of high levels of IFN-γ in mixed lymphocyte reactionseven at very low stimulator/responder ratios.
A typical feature of professional APCs is represented by their ability to successfully prime naïve T cells and of inducing an effective immune response. In vitropriming of autologous T cells with antigen pulsed IFN-DCs has been shown to induce a strong lymphocyte proliferationand a Th1 polarized response, as revealed by production of high levels of IFN-γ and the virtual absenceof IL-4 in the culture upon restimulation [Santini S.M. et al., 2000, Parlato S. et al., 2001; Lapenta C. et al., 2003; Tosi D. et al., 2004].
IL IL--1212 IL IL--2323 IL IL--2727 TNF TNF--αα IL IL--66 IFN IFNαα IL IL--1212 TNF TNF--αα IL IL--66
Generation of DCs in vitro
CD14+ CD14+ MONOCYTEs MONOCYTEs IFN IFN--αα ++ GM GM--CSFCSF CD80+ CD80+++ CD86++ CD86++ CD40+ CD40+++ HLA HLA--DR++DR++ CD83+ CD83+//- -CD CD123123++++ CD25+ CD25+ CD54++ CD54++ CD56++ CD56++ DC DC--SIGN+/SIGN+/- -CCR5+/ CCR5+/- -CXCR4+/ CXCR4+/- -CCR7+ CCR7+ TRAIL+ TRAIL+ IL IL--44++ GM GM--CSFCSF CD80+ CD80+ CD86+ CD86+ CD40+ CD40+ HLA HLA--DR++DR++ CD83 CD83- -CD CD123+/123+/- -CD25+ CD25+ CD54+ CD54+ DC DC--SIGN++SIGN++ CCR5++ CCR5++ CXCR4++ CXCR4++ CCR7 CCR7- -TRAIL TRAIL- -IL IL--1515 MipMip--11ββ,Mip,Mip--33ββ IL IL--11ββ TNF TNF--αα IL IL--66 IL IL--1212 MATURATIVE MATURATIVE STIMULI STIMULI TNF TNF--αα IL IL--66 IMMATURE DCs MATURE DCs
Figure 1 - In vitro generation of DCs from GM-CSF-treated monocytes in the presence of IFN-α or IL-4 and differential characteristics of the two DC populations. Large numbers of DCs can be obtained from peripheral blood monocytes
upon exposure to type I IFN or IL-4, in combination with GM-CSF. The figure summarizes some characteristics and features of both DC subsets.
Background and aim of the study
The priming and expansion of antigen-specific CD8+ T cell response is a complex process involving concerted interactions between lymphocytes and dendritic cells (DCs), the professional antigen-presenting cells (APCs) [Banchereau, J. and Steinman, R.M, 1998; Banchereau, J.,et al. 2000]. The priming of antigen-specific CD8+ T cells requires recognition through the T cell receptor of peptide-MHC class I complexes on the surface of appropriate APCs. This event occurs when viral proteins are synthesized within an infected cell, where cytoplasmic proteasomes and peptidases degrade them into peptides, which are then translocated into the endoplasmic reticulum for the access to newly formed MHC class I molecules and transport to the cell surface. However, suitable peptides may also be derived from exogenous antigens intersecting this pathway after endocytosis by APCs, a process named as cross-presentation. Notably, DCs are considered as the most efficient cells at cross-presenting exogenous antigens, but they must undergo a special activation process or “licensing” step in order to cross-prime CD8+ T cells. Under patho-physiological conditions, DCs are “licensed” by engagement of surface CD40 by activated CD4+ helper T cells or by microbe-derived macromolecules, which can trigger DC maturation and up-regulate the expression of surface co-stimulatory molecules.
It is generally assumed that only mature DCs can efficiently induce cross-priming of CD8+ T cells against exogenous antigens [Schuler, G. et al., 2003; Kaiser, A. et al., 2003]. Our group has previously demonstrated that highly active partially mature DCs are generated from monocytes after a single step of 3-day culture with IFN-α/GM-CSF (IFN-DCs) [Santini S.M. et al., 2000]. IFN-DCs proved to be more effective than immature DCs
generated in the presence of GM-CSF and IL-4 in inducing a Th-1 type of immune response and CD8+ T cell responses against defined antigens in different models [Mohty M. et al., 2003; Lapenta C. et al., 2003; Santodonato, L. et al., 2003; Gabriele, L. et al., 2004; Buelens, C. et al., 2002; Blanco, P. et al., 2001; Carbonneil, C. et al., 2003]. In particular by using IFN-DCs pulsed with aldrithiol-2 (AT-2)-inactivated HIV-1 in the hu-PBL-SCID mouse model, our group revealed that IFN-DCs are far superior with respect to immature IL-4-DCs in inducing an in vivo cross-priming of CD8+ T cells against exogenous HIV antigens [Lapenta C. et al., 2003]. However, the mechanisms underlying this special attitude of IFN-DCs remained to be determined. In this regard, different and distinct mechanisms could be invoked, including an improved antigen uptake and processing, as well as an enhanced antigen presentation, possibly due to higher levels of co-stimulatory molecules or, eventually, to the partially mature phenotype of these cells. In addition, partially mature IFN-DCs had never been compared with classical fully mature IL-4-DCs and the importance of CD4+ T cells in the IFN-DC-mediated cross-priming of CD8+ T cells still remained to be evaluated.
In order to address all these important issues, we have first evaluated antigen uptake and the capacity of IFN-DCs to cross-present viral antigens and to present viral peptides to specific CD8+ T cell clones, as compared to conventional IL-4-DCs. In the present study, we have also compared the capability of IFN-DCs to induce a CD8+ T cell response against exogenous HIV antigens with respect to that exhibited by mature DCs obtained after 6 days of monocyte culture in the presence of GM-CSF/IL-4 and subsequent exposure to sCD40L, which is thought to represent a crucial step for an efficient induction of cytotoxic CD8+ T cells [Ridge, J.P. et al., 1998;
Schoenberger, S.P. et al., 1998; Bennett, S.R. et al., 1998; Fujii, S. et al., 2004; O'Sullivan, B.J. and Thomas, R., 2002 ].
Moreover we have evaluated IFN-DCs versus mIL4-DCs in inducing in
vitro and in vivo (in Hu-PBL-SCID mice) cross-priming of HIV-specific
CD8+ T cells.
Finally, we have attempted to further investigate the mechanisms underlying the special attitude of IFN-DCs to induce TH1 polarization, as compared to conventional DCs. In particular, we have started to study the interactions between IFN-DCs and autologous naive CD4+ T cells, stimulated with SEA superantigen.
Materials and Methods
Cell Separation and Culture.Peripheral blood mononuclear cells were obtained from heparinized blood of healthy donors by Ficoll density gradient centrifugation (Seromed). Monocytes were isolated by immunomagnetic selection (MACS Cell Isolation Kits; Miltenyi Biotec). Positively selected CD14+ monocytes were plated at the concentration of 2 x 10⁶ cells/ml in AIM-V medium (GIBCO BRL), supplemented with 2% autologous plasma, 500 U/ml GM-CSF (Peprotech) and either 250 U/ml IL-4 (R&D Systems) for 6 days or 10,000 U/ml natural IFN-α (Alfaferone; AlfaWasserman) for 3 days. Both dendritic cells were washed and analyzed by cytofluorometric analysis for specific marker expression.
DCs were matured by treatment with CD40L (1µg/ml) + 0.1 µg/ml enhancer (Alexis Biochimicals) for one additional day. CD40L and enhancer kit Human rhsCD40L FLAG® Set is a commercial kit from Alexis corporation. The extracellular domain of human CD40L (CD154) (aa 116-261) is fused at the N-terminus to a linker peptide (6 aa) and a FLAG®-tag. FLAG is a registered trademark of Sigma-Aldrich Co. The “Enhancer” for Ligands (Prod. No. ALX-804-034) increases the biological activity of rhsCD40L at least 1,000-fold by ligand crosslinking. Human CD8+ T cells were isolated by positive immunomagnetic selection (MACS Cell Isolation Kits; Miltenyi Biotec). Negatively selected PBLs were used to isolate by positive selection with CD4+Naïve specific microbeads (Miltenyi Biotec).
Immunophenotypic Analysis.
Cells were washed and resuspended in PBS containing 1% human serum and 0.09% NaN3 and incubated with a panel of fluorochrome-conjugated mAbs specific for IFN-DC and IL4-DC anti-CD80 (Becton Dickinson), CD40, CD86, CD83, HLA-ABC, DC-SIGN, CCR5, CXCR4 and CD4 (BD PharMingen). Isotypematched antibodies were used as a negative control.
Cells were analyzed by flow cytometry by using a FACSortTM (Becton Dickinson) flow cytometer. Fluorescence data are reported as the percent positive cells when treatment induces expression of the marker in cells that were negative; data are reported as median fluorescence intensity (MFI) when treatment increases expression of the marker in cells that were already positive.
Phagocytosis
DCs (0.5x10⁶ cells) were incubated for 60 min at 37°C with either 50 µg/ml of dextran-FITC conjugate (Molecular Probes) or 10 µg/ml of DQ-Ovalbumin (Molecular Probes). Cells were washed and resuspended in 500 µl of PBS. DCs incubated with either dextran-FITC or DQ-Ovalbumin at 4°C were used as control. Cells were analysed by flow cytometry.
Antigen presentation assay of the HCV-NS3 protein to the specific CD8+
T cell clone
Cells of a CD8+ T cell clone specific for the HLA-A2 binding peptide NS31406–1415 (KLVALGINAV) of the HCV-NS3 c33c recombinant protein [Barnaba, V.,et al., 1990] were stimulated with the relevant peptide
or with protein-loaded DC (either IFN-DCs or IL-4-DCs) in U-bottom microculture wells at 2×10⁴ DC /3×104 CD8+ T cell /well in 0.2 ml of RPMI 1640 medium supplemented with 10% foetal calf serum (RPMI-1640-10%). DCs loaded with either the peptide or the NS3 protein for 18 h at 37°C were then washed with RPMI-1640-10% and added to the culture at the DC/T cell ratio of 1:1.5. After a 2-h culture, the cells were further treated with brefeldin-A (10 µg/ml, Sigma-Aldrich) at 37 °C for 18 h. Cells were washed and stained with anti-CD8 tricolor (TC) (Caltag Laboratories, Burlingame, California, USA) for 20 min at 4°C, fixed, permeabilized using Cytofix/Cytoperm solution (BD Pharmingen) at 4°C for 20 minutes, rewashed with Perm Wash Buffer (BD Pharmingen), intracellularly stained with FITC-labeled anti-IFN-γ antibody (BD Pharmingen) for 30 min at 4°C and finally subjected to flow cytometry.
Detection of HIV-1 infection in DC cultures
DCs (IFN-DC and IL4-DC) were washed and infected with HIV-1 SF162 strain for 2 hours at 37°C. After extensive washing, DCs were cultured in RPMI containing 10% FCS at the concentration of 106 cells/ml. Culture medium was harvested at day 3. For PCR detection of HIV-1 proviral sequences, DNA was extracted from DCs. The presence of human sequences was determined by DNA-PCR using specific primers for the HLA-DQα gene: GH26 5’ GTGCTGCAGGTGTAAACTTGTACCAG,
GH27 3’CACGGATCCGGTAGCAGCGGTAGAGTTG. HIV-1 proviral
DNA was detected by specific amplification of HIV-1 gag sequences:
GAG 881 5’ GGTACATCAGGCCATATCACC, GAG 882 3’
ACCGGTCTACATAGTCTC. The sensitivity of the assay was tested by amplifying serial dilutions of DNA prepared from 8E5 cells (which harbour
one proviral copy/cell). 8E5 DNA was serially diluted into human cell DNA. Virus replication was determined after 3 days of culture by detection of p24 gag antigen in culture supernatant using a commercial ELISA kit (PerkinElmer Life Sciences).
Immunization of hu-PBL-SCID Mice
CB17 scid/scid female mice (Charles River Laboratories) were used at 4 week of age. Three or four mice for each group were injected i.p. with 30-40 x 106 PBLs resuspended in 0.5 ml AIM-V medium. To prepare the inactivated HIV-1, different SF-162 HIV-1 stocks were inactivated by treatment for 1 h at 37°C with 2,2'-dithiodipyridine (aldrithiol-2 [AT-2]). Four or seven days after reconstitution, hu-PBL-SCID mice were injected i.p. with 2.5 x 10⁶ autologous DCs pulsed for 2 h at 37°C with AT-2-inactivated HIV-1 (100 ng p24). Mature DCs were loaded with antigens prior to the induction of maturation by sCD40L treatment. The vaccinated mice received one boost immunization at day 7 and were sacrificed after additional 7 days.
ELISA for Human Immunoglobulins
Sera from control and vaccinated hu-PBL-SCID mice, collected at 7 and 14 days after the first immunization, were tested for the presence of antibodies to HIV-1 by an ELISA system for quantifying human immunoglobulins to the AVERY HIV-1 gp41 epitope, based on the use of anti-human total IgG or IgM (Cappel-Cooper Biomedical).
Recovery of Cells from hu-PBL-SCID Mice and ELISPOT Assay
Hu-PBL-SCID mice were sacrificed 7-10 days after the last immunization. Cells were collected from the peritoneal cavity and spleen. Human cells from mouse spleens were enriched by Ficoll density gradient centrifugation and pooled (3-4 mice per group). Autologous DCs were pulsed for 2 h at 37°C with AT-2-inactivated HIV-1 (100 ng p24), washed and used as APCs for stimulation of human cells recovered from hu-PBL-SCID mice. Control uninfected DCs were used as stimulators for the calculation of background spots. PBMC cultures treated with 2 µg/ml PHA served as positive controls. The cells were added at 106 per well and incubated at 37°C overnight in a final volume of 2 ml of AIM-V medium (GIBCO) supplemented with 2 mM L-glutamine and 2% heat-inactivated autologous plasma. After incubation with autologous DCs at a responder/stimulator ratio of 4:1, CD8+ T cells were positively selected by MACS Micro Beads (Miltenyi Biotec) and tested 105/well in an ELISPOT assay for the production of IFN-γ (Euroclone Ltd.).
In vitro induction of cross-priming of CD8+ T cells against HIV-1
Antigens by using either purified CD8+ T cells or total PBLs
CD8+ T cells and PBLs (4 x 10⁶) were stimulated with 106 autologous IFN-DCs or mIL-4-IFN-DCs, pulsed with AT-2-inactivated HIV-1 (100 ng of p24) for 2 h at 37°C. In the case of IL4-DCs, cells were first loaded with antigens and subsequently induced to maturation by sCD40L treatment. CD8+ T cells and PBLs were restimulated 7 days later with HIV-pulsed DCs. Seven days later, the frequency of HIV-1-specific T cells was evaluated by ELISPOT assays for IFNγ (Euroclone) or granzyme-B (Becton Dickinson). according to the manufacturer's instructions. Ten-fold
dilutions (from 105 to 102) of DC-stimulated CD8+ T cells and PBLs from primary cultures were restimulated overnight with DCs pulsed with inactivated HIV-1 (E/S ratio of 1:1), added to duplicate wells, and incubated for 18 h. Control uninfected DCs were used as stimulators/targets for the calculation of background spots to be subtracted for the evaluation of the specific number of IFN- γ or granzyme-B-spot-forming cells. PBMCs cultures treated with 2 µg/ml PHA served as positive controls. IFN- γ or granzyme-B-producing cells was evaluated by enumerating single spots using an automatic analyzer (A.EL.VIS. reader).
Detection of cytokine production
Commercial ELISAs were used to quantitate in the cell culture supernatants the following cytokines: IL-6, IL-2, IL-1β, IL-12 and TNF-α (Endogen), IL-23 (Bender MedSystem), IL-7 (D.R.G.), IL-10 and IL-15 and TGF-β1(R&D Systems), IL-18 (M.B.L.) and for measuirng PGE2 (Assay, Designs,Inc.). Assay sensitivity was as follows: IL-6 (10.24 pg/ml), IL-7 (15.6 pg/ml), IL-10 (3.6 pg/ml), IL-12 (25.6 pg/ml), IL-23 (78 pg/ml), IL-15 (3.9 pg/ml), IL-18 (25.6 pg/ml), TNF-α (15.6 pg/ml), IL-2 (38.4 pg /ml), IL-1β (10.24 pg/ml, TGFβ1 (31.2 pg/ml) and PGE2 (39.1 pg/ml). ELISAs were performed in triplicate and laboratory standards were included on each plate. Optical density was measured with a microplate reader at 450 nm (Dynex Opsys MR).
Evaluation of IL-23 and IL-27 subunit mRNA expression by real-time RT-PCR analysis
DCs were obtained from blood monocytes as described above and then induced to differentiate by overnight exposure to sCD40L. To measure cytokine mRNA expression, TaqMan real-time reverse transcriptase PCR (RT-PCR) analysis was used (Applied Biosystems, Foster City, Calif.). Total RNA was extracted from monocytes and DCs at different time points ( Sigma-Aldrich), and reverse transcribed. TaqMan assays were performed according to the manufacturer's instructions with an ABI 7700 thermocycler (Applied Biosystems). PCR was performed, amplifying the target cDNA (p40, and p19 transcripts for IL-23. EBI-3 and p28 for IL-27), with ß-actin cDNA as an endogenous control. Specific primers and probes were obtained from Applied Biosystems. Data were analyzed with the PE
Relative Quantification software of Applied Biosystems. At time zero, mRNA levels, normalized to β-actin, were determined for each individual cytokine chain and were expressed relative to β-actin mRNA. Specific mRNA transcript levels were expressed as fold increase over the basal condition (untreated monocytes).
Naïve CD4+ T cells expansion and phenotypic analysis of specific surface markers
Dendritic cells, obtained as described above, were maturated with Imiquimod (10µg/ml) (Invivogen) or Poly I:C (1µg/ml) (Sigma-aldrich)for 2 days. Cell preparations was analyzed by cytofluorometric staining. Dendritic cells were washed and cultured with autolougus naïve CD4+ T cells (1:4 ratio) and 1µg/ml SEA (Staphylococcal enterotoxin A; sigma-aldrich) for 7 days at 37°C. Cells were washed, resuspended in PBS
containing 3% fetal bovine serum and 0.09% NaN3, incubated with a panel of fluorochrome-conjugated mAbs (BD Bioscience) specific for T cells (anti-CD4, anti-CD25, anti-CXCR3, anti-CD212) and analyzed with a FACScalibur (Becton Dickinson).
Polarization of naïve T cells and intracellular cytokine staining
The cytokine–producing capability was performed as following: after 7 days of DC/naïve T cells culture (1:4 ratio), in complete medium in 24-well plates (Costar), cells were stimulated for 5h with PMA (40ng/ml) (Sigma-aldrich) and ionomycin (500ng/ml) (Sigma-(Sigma-aldrich), in the presence of Golgi Plug (1µg/ml) (BD Pharmingen) for the final 4h of culture at 37°C. GolgiPlug blocks proteins in the endoplasmic reticulum, thus inhibiting cellular secretion and preventing the binding of secreted cytokines to the cell surface. Cells were fixed and made permeable with BD Cytofix/Cytoperm Plus (BD Bioscience) according to the manufacturer’s instructions. Cells were incubated with fluorescein isothiocyanate-labeled anti IFN-γ (BD Bioscience), phycoerythrin labelled anti IL-4 (BD Bioscience) and an appropriate isotype control. After a 30-min incubation at 4°C, cells were washed and analyzed on a FACSalibur cytometer with CellQuest software.
Proliferation assay of SEA-stimulated Naïve CD4+ T cells
IFN-DCs and IL4-DCs, previously exposed to Imiquimod or Poly I:C, were incubated (1:4 ratio) with autolougus naïve CD4+ T cells, purified from peripheral blood mononuclear cells by positive sorting with magnetic beads (92%), and seeded into round-bottom 96-well plates (Costar, Cambridge, Mass.) at 2.5x10⁴cells/well. After 5 days, 0.5 µCi of [3H]thymidine (Amersham Biosciences, Little Chalfont, Buckinghamshire, United
Kingdom) were added to each well and incubation was continued for additional 18h. Thymidine incorporation was quantified by scintillation counting using Microbeta.
Cytokine production
Supernatants of cell cultures were collected after 7 days. IFN-γ, TNF-α, IL-12, IL-4 (Endogen), IL-23 (Bender MedSystem), IL-13(R&D Systems), production was measured by an enzyme-linked immunosorbent assay (ELISA). Assay sensitivity was as follows: IFN-γ (25,6pg/ml), TNF-α (15.6pg/ml), IL-12 (7.8pg/ml), IL-4 (31.2pg/ml), IL-23 (78pg/ml), IL-13 (62.5pg/ml). Optical density was measured with a microplate reader (Dynex Opsys MR) at 450 nm.
Real Time quantitavive PCR to evaluate expression of TLRs and IRFs mRNA
To measure cytokine mRNA expression, TaqMan real-time reverse transcriptase PCR (RT-PCR) analysis was used (Applied Biosystems, Foster City, Calif.). Total RNA was extracted from monocytes, IFN-DCs and IL4-DCs. TaqMan assays were performed according to the manufacturer’s instructions with an ABI 7700 thermocycler (Applied Biosystems). PCR was performed, amplifying the target cDNA (TLR7, TLR8, TLR9, IRF3, IRF7) with ß-actin cDNA as an endogenous control. Data were analyzed with the PE Relative Quantification software of Applied Biosystems. Specific mRNA transcript levels were expressed as fold increase over the basal condition (untreated monocytes).
Results
Comparison between IFN-DCs and IL-4-DCs for capabilities of antigen-uptake and endosomal processing
Firstly, we performed a set of experiments aimed at evaluating whether the higher capability of CD8+ T cell cross-priming by the IFN-DCs with respect to the IL-4-IFN-DCs [Lapenta C. et al., 2003] could be associated with an enhanced attitude of antigen uptake and endosomal processing. Antigen uptake by DCs is mediated predominantly by either mannose receptor-mediated endocytosis or macropinocytosis, which are modulated during DC differentiation. We have evaluated mannose receptor-mediated endocytosis by measuring the uptake of FITC-conjugated dextran polysaccharide, while macropinocytosis and endosomal processing capacity has been evaluated by the uptake of DQ ovalbumin, which is a self-quenched conjugate of albumin exhibiting bright green fluorescence upon endo-lysosomal protease-dependent degradation, thus permitting the evaluation of both antigen uptake and processing by live DCs. Figures 2A and 2B show the phenotype of the two types of DCs used in these experiments. Consistently with previously published results [Santini S.M. et al., 2000], IFN-DCs were characterized by a higher percentage of cells expressing CD40, CD80, CD86 (Figure 2A). The up-regulation of membrane expression of these markers (Figure 2B) was also associated with the appearance of the DC maturation marker CD83+. Notably, IFN-DCs nearly exhibited a two-fold increase of HLA Class-I molecule expression intensity as compared to IL-4 DCs (Figure 2B and 6). As illustrated in Figure 2C, no major difference in the dextran uptake capacity was detected between the two DC types (IFN-DCs and IL-4-DCs)
incubation with DQ ovalbumin (Figure 2D), suggesting that the majority of cells retained comparable phagocytic and processing activity. In particular, time-course analyses of antigen uptake and processing revealed similar kinetics for both DC types (data not shown). Thus, the finding that both DC types exhibited a similar capability of antigen uptake and processing suggested that other mechanisms were responsible for the special attitude of IFN-DCs to induce cross-priming of CD8+ T cells against exogenous viral antigens.
Dextran FITC DQ - Ova IFN-DC IL-4-DC D C A B 0 20 40 60 80 100 120 HLA-ABC CD40 CD80 CD86 CD83 % o f p o si ti ve cel ls IL-4-DC IFN-DC 0 100 200 300 400 500 600 700 800 HLA-ABC CD40 CD80 CD86 CD83 MF I
Figure 2. Phenotype, antigen uptake and antigen processing capacity by IFN-DCs and IL-4-DCs. (A) Percentage of DCs expressing a series of selected membrane
markers as detected by FACS analysis. (B) Florescence intensity of selected membrane markers as detected by FACS analysis. Bars represent the percentage or the mean fluorescence intensity of cells expressing the selected membrane marker and the standard error. (C and D)Antigen uptake and processing by the IFN-DCs and IL-4 DCs. Cells were incubated for 60 min at 37°C with 50 µg/ml of dextran-FITC conjugate (C) or 100 µg/ml of DQ-Ovalbumin (D). After 60 min, cells were washed and analysed by Flow cytometry. DQ ovalbumin is a self-quenched conjugate of albumin that exhibits bright green fluorescence only upon proteolityc degradation.
Cross-presentation of exogenous soluble antigens to CD8+ cells by monocyte-derived DCs
It could be argued that IFN-DCs were endowed with an enhanced capability of cross-presenting viral antigens to CD8+ T cells with respect to IL-4-DCs. This hypothesis has been addressed by experiments aimed at evaluating the efficiency of both DC types loaded with a reference viral soluble protein to activate a CD8+ T cell clone specific for the viral antigen. In particular, in a series of 3 experiments with DCs from different donors, we have studied the presentation of exogenous HCV NS3 protein to a HLA-A2-restricted NS3(1406–1415)-specific CD8+ T cell clone [Accapezzato D. et al., 2005]. The response was evaluated by intracellular staining of IFN-γ-producing cells followed by flow cytometry. First, by using cells from the same donors, we performed a series of cross-presentation assays using the same CD8+ T cell clone and the same DCs loaded with the whole recombinant NS3 protein. As shown in figure 2A, IFN-DCs showed a cross-presentation capability comparable to that of the IL-4-DCs when loaded with protein concentrations of 50 and 10 µg/ml. However, the IFN-DCs proved to be superior in cross-presenting antigen at lower protein concentration (Figures 3A and 3B). Consistently, when the DCs were loaded with high concentrations of the corresponding NS3 peptide, the activation of the CD8+ T cell clone by either IFN-DCs or IL-4-DCs proved to be similar (Figure 4A). However, at very low peptide concentration (0.01 or 0.001 ng/ml), clone activation by IFN-DCs was significantly more efficient (figure 4A). This was also supported by the dot-plot analysis of IFN-γ production by the specific T cell clone when stimulated with DCs loaded with 0.001 ng/ml of the NS3 peptide, which clearly showed that
IFN-DCs were associated with higher number of IFNγ-producing cells and a stronger florescence intensity (Figure 4B).
IL-4-DC IFN-DC 0 20 40 60 80 100 50 10 1 0 NS3 recombinant protein ( µg/ml) % IF N γ HCV -s pe ci fi c CD8 + T c el ls A IL-4-DC IFN-DC IF N γ B FSC NS3 recombinant protein IL-4-DC IFN-DC Gated CD8+ 1 µg/ml 0 µg/ml 18.3% 29.2% 1.3% 0.9%
Figure 3. Cross-presentation of the whole NS3 protein to the specific CD8+ T cell
clone (clone NS3-1). Cells (3×10⁴/test) of the CD8+ T cell clone NS3-1 specific for an
HLA-A2 binding peptide HCV1406 were incubated, at a S/R cell ratio of 1:1.5 in a microculture plate, with IFN-DCs or IL-4-DCs previously loaded with (A) NS3 recombinant protein (50 µg, 10 µg, 1 µg or 0 ). After 18-h incubation at 37°C, cells were assayed for IFN-γ production by intracellular immunofluorescence staining followed by flow cytometry (see Materials and Methods for details). Each bar represents the mean (± SE) of values of three experiments. (B) Representative dot plot analysis of IFN-γ expression by the CD8 clone NS3-1 stimulated with DCs loaded with the NS3 protein.
A 0.001 ng/ml % I F N γ HC V -s p ec if ic C D 8+ T ce lls NS3 peptide (ng/ml) 0 20 40 60 80 100 120 100 10 1 0.1 0.01 0.001 0 IL4-DC IFN-DC IF N γ B FSC NS3 peptide IL-4-DC IFN-DC Gated CD8+ 0 ng/ml 26% 0.6% 56% 1.1%
Figure 4. Presentation assay of the NS3-1406 peptide to the specific CD8+ T cell
clone (clone NS3-1). Cells (3×10⁴/test) of the CD8+ T cell clone NS3-1 specific for an
HLA-A2 binding peptide HCV1406 were incubated, at a S/R cell ratio of 1:1.5 in a microculture plate, with IFN-DCs or IL-4-DCs previously loaded with peptide HCV1406 (100 ng, 10ng, 1ng, 0.1ng, 0.01ng 0.001ng/ml or 0) (A). After 18-h incubation at 37°C, cells were assayed for IFN-γ production by intracellular immunofluorescence staining followed by flow cytometry (see Materials and Methods for details). Each bar represents the mean (± SE) of values of three experiments. (B) Representative dot plot analysis of IFNγ expression by the CD8 clone NS3-1 stimulated with DCs loaded with the NS3-1406 peptide.
Comparison of 3-day IFN-DCs versus CD40L-activated IL-4-DCs for their capability to induce humoral response and cross-priming in hu-PBL-SCID mice.
In a previous study based on the use of DCs pulsed with inactivated HIV-1 as antigen model, we had shown that virus-pulsed IFN-DCs were superior with respect to immature IL-4-DCs in inducing a potentially protective humoral and cellular immune response against HIV antigens when tested in hu-PBL-SCID mice [Lapenta et al., 2003]. However, it remained to be evaluated whether IFN-DCs could compare favorably with reference mature DCs (mIL-4-DCs), as those obtained after in vitro maturation of IL-4-DCs by exposure to CD40L. Before addressing this issue, it was also important to evaluate whether the IFN-DCs and IL-4-DCs could exhibit any differential property in interacting with HIV-1. In previous study [Lapenta et al., 2003], the virus inactivation was achieved by using aldrithiol-2 (AT-2), which selectively disrupts the p7 nucleocapsid (NC) protein, thus resulting in inactivation without affecting the conformation and fusogenic activity of the gp120. We have now analyzed the two DC types by flow cytometry for the expression of selected membrane molecules involved in viral entry. The phenotypic analysis showed lower levels of expression of membrane CD4, CXCR4, CCR5 and DC-SIGN in IFN-DCs as compared to IL-4-DCs (Figure 5A), consistently with results from other groups [Mothy M. et al., 2003; Carbonneil C. et al., 2003]. Similar proviral load was detected in both IFN-DCs and IL-4-IFN-DCs previously exposed to HIV (Figure 5B). IL-4-IFN-DCs proved to be capable of releasing higher amounts of HIV with respect to the IFN-DCs. On the whole, these results suggested that the superior capability of the HIV-pulsed IFN-DCs to induce a human humoral and
cellular immune response in hu-PBL-SCID mice was not due to an enhanced susceptibility of these DCs to virus entry and infection.
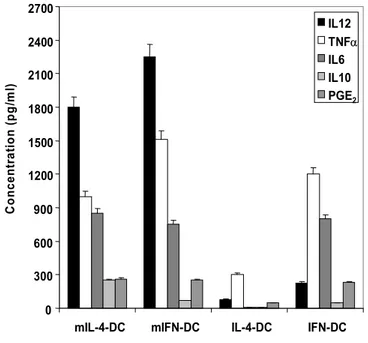
Figure 6 illustrates the phenotype, while Figure 7 show cytokine secretion patterns, before and after CD40L stimulation, of the DCs types utilized in the subsequent studies. As expected, only a small fraction of the IFN-DCs expressed the CD83 maturation marker, while the large majority of both mIL-4-DCs and mIFN-DCs were CD83+ (Figure 6). Both mIFN-DCs and mIL-4-DCs expressed comparable levels of the costimulatory molecules CD80 and CD86, higher than the corresponding immature DCs. As illustrated in Figure 7, IFN-DCs secreted higher amounts of TNF-α, PGE2 and IL-6 than IL-4-DCs. Interestingly, after CD40L-induced maturation, the levels of the secreted IL-12 and TNF-α were higher for IFN-DCs than for 4-DCs. In contrast, no or very low levels of secretion of 15, IL-18, IL-1β, IL-7, TGF-β1 and IL-2 were detected in the different DC cultures (data not shown).
The immune priming activity of IFN-DCs and mIL-4-DCs pulsed with AT-2-HIV-1 was tested in hu-PBL-SCID mice, by measuring their in vivo capability to induce the generation of human antibodies and, more importantly, of CD8+ T cells against HIV-1 antigens. Figure 8 shows the antibody response to HIV-1 gp41 immunodominant peptides obtained in hu-PBL-SCID mice immunized with either IFN-DCs or mIL-4-DCs loaded with AT-2-inactivated HIV-1. At 1 week after primary and boost immunization, comparable levels of anti-HIV antibodies were detected in mouse sera, indicating that both DC types exhibited similar efficacy in the elicitation of a human antibody response. When CD40L-treated IFN-DCs (mIFN-DC) were compared with IFN-DCs, no major difference in the antibody production was observed (data not shown), suggesting that the
subsequent maturation step did not result in any significant enhancement of the DC functional activity.
Interestingly, however, IFN-DCs were more efficient than mIL-4-DCs in inducing the generation of HIV-1-specific CD8+ T cells in the immunized hu-PBL-SCID mice, as revealed by IFN-γ ELISPOT assay (figure 9, Exp.1). Notably, treatment of IFN-DCs with sCD40L did not significantly enhance the generation of HIV-specific CD8+ T cells (figure 9, Exp. 2), suggesting that IFN-DCs are fully committed to the efficient cross-priming of CD8+ T cells without the requirement of additional maturation steps provided by CD4+ T cells
IFN-DC
IL-4-DC
CD4 CXCR4 CCR5 DC-SIGN
A
Proviral copy number 8E5 104 103 102 10 1 Proviral DNA HLA-DQα IL4-DC+HIV IFN-DC+HIV B 0 500 1000 1500 2000 2500 3000 IFN-DC IL-4DC p2 4 p g /m l C
Figure 5. Comparative characterization of the expression of HIV-1 receptors and of the
DC susceptibility to HIV infection. Membrane expression of molecules involved in HIV entry and infection ( A) Three days after HIV-1 infection, proviral load was analyzed in DCs by PCR for viral gag sequences (B). The sensitivity of the assay was tested by amplifying serial dilutions of DNA prepared from 8E5 cells which harbour one proviral copy/cell (B). Viral release from infected DCs was assessed by measuring the levels of the HIV-1 p24 protein in culture supernatants (C), as described in Materials and Methods.
IL4 -DCs IFN-DCs mIL4-DCs mIFN-DCs CTR FITC CTR PE CD86 CD40 CD83 CD80 HLA-ABC
Figure 6. Phenotype by the different immature and mature DC types.
Representative dot histogram FACS® profiles of 4 types of DCs used in the in vivo experiments in the hu-PBL-SCID mouse model.
0 300 600 900 1200 1500 1800 2100 2400 2700
mIL-4-DC mIFN-DC IL-4-DC IFN-DC
C o n cen tr at io n (p g /m l) IL12 TNFα IL6 IL10 PGE2
Figure 7. Cytokine production by the different immature and mature DC types.
PGE2 and cytokine levels in the culture supernatants of IFN-DCs, IL-4-DCs, mIFN-DCs
and mIL4-DCs after their culture for 24 h in fresh medium. Each bar represents the mean concentration values (± SE) of three experiments.
0 1000 2000 3000 4000 5000 CTR IFN-DC mIL4-DC 0 1000 2000 3000 4000 5000 CTR IFN-DC mIL4-DC A b so rb an ce O .D . 492 .6 n m 0 300 600 900 1200 1500 CTR IFN-DC mIL4-DC 0 300 600 900 1200 1500 CTR IFN-DC mIL4-DC A b so rb an ce O .D . 492 .6 n m
First immunization (Day 7)
Second immunization (Day 14)
IgM
IgG
A
Figure 8. Generation of anti-HIV-1 antibodies in hu-PBL-SCID mice immunized with AT2-HIV-1-pulsed DCs. ELISA detection of antibodies to the HIV-1 gp41
ectodomain epitope AVERY in the sera from hu-PBL-SCID mice immunized with virus-pulsed IFN-DCs or CD40L-matured IL-4-DCs (mIL4-DC) as compared to the basal response in non-immunized hu-PBL-SCID mice (CTR). Three 10-fold serum dilutions (1:10 ■; 1:100 □; 1:1000 ) from 3 mice in each group were tested. Each bar represents the mean (± SE) of values of 3 serum samples from individual mice.
Stimulators: DCDC+AT-2
Immunizzation of hu-PBL-SCID Mice
None None AT2-IFN-DCAT2-mIL4-DC 0 40 80 120 160 IF Ng sp ot f o rm in g C D 8+ cel ls /1 06 EXP1 None None AT2-IFN-DC AT2-mIFN-DC 0 200 400 600 800 1000 1200 EXP2
Figure 9. Generation of HIV-specific human CD8+ T cells in hu-PBL-SCID
mice immunized with AT2-HIV-1-pulsed DCs. Elispot analysis of anti-HIV-1 CD8+
T cell response. Human cells recovered from three spleens of hu-PBL-SCID mice from each group were pooled. The assay was performed using as stimulators autologous AT2-HIV-1-pulsed or unpulsed DCs. Bars represent the CD8+ T cell response from hu-PBL-SCID mice immunized with either IFN-DCs or mIL-4-DCs (Exp. 1) and IFN-DCs or mIFN-DCs (Exp. 2), as compared to the basal CD8+ T cell response in non-immunized hu-PBL-SCID mice (CTR). Control cultures were incubated with unpulsed autologous DCs. The panel shows the results of one representative experiment out of three. Hu-PBL-SCID mice were immunized as described and Materials and Methods
Efficient CD4+ T cell-independent generation of effector CD8+ T cells against HIV-antigens by IFN-DCs in vitro
The in vivo studies illustrated above suggested that IFN-DCs are especially effective in inducing the cross-priming of virus specific CD8+ T cells in vivo. Thus, we have performed in vitro experiments to characterize the capability of IFN-DCs of inducing antigen-specific effector CD8+ T cells against exogenous HIV antigens in the presence or absence of CD4+ T cell help. In particular, we compared the in vitro cross-priming of highly purified CD8+ T cells using the two types of AT-2-HIV-1-pulsed DCs: IFN-DCs and mIL-4-DCs. Positively selected CD8+ T cells represented > 97% of the cell population as assessed by flow cytometry (Figure 10A). IFN-DCs were far superior in the induction of specific CD8+ T cell response in absence of CD4+ T cell help as evaluated by both ELISPOT enumeration of IFN-γ and granzyme-B-releasing cells after restimulation with HIV-1 antigens (Figure 10B and 10C). Comparable numbers of IFN-γ-producing T cells were detected when the total PBLs, instead of purified CD8+ T cells, were co-cultured with either IFN-DCs or mIL-4-DCs (Figure 10B). The generation of granzyme-B releasing cells was more efficiently induced by IFN-DCs both in the presence and absence of CD4+ T cells (Figure 10C). Figure 11 illustrates the production of IL-6, IL-10, IL-12, TNF-α and PGE2 in supernatants from the last DC restimulation. Of interest, high levels of IL-12 were detected in supernatants from co-cultures of purified CD8+ T cells with antigen-pulsed-IFN-DCs, suggesting that IFN-DCs had acquired the full capacity to release this cytokine during co-culture. However, the differential capability of the two DC populations to induce a CD8+ specific T cell response (Figure 10B and Figure 10C) did not correlate with major differences in the pattern of cytokine production (Figure 11).
A 0 100 200 300 400 500 600 N. S P O T s /1 0 6c e lls AT2 - IFN -DC/ CD8 AT2 - mIL 4-DC /CD8 AT2 - IFN -DC/ PBL AT2 - mIL 4-DC /PBL IFNγ B 0 100 200 300 400 N .SPO T s /1 0 6cel ls AT2 -IF N-DC/ CD8 AT2 -mI L4-DC /CD8 AT2 - IF N-DC/P BL AT2 -mI L4-DC /PBL Granzyme B C CD8 CD4 97% CTR FITC CTR PE FSC-H SSC-H
Figure 10. In vitro cross-priming of CD8+ T cells against exogenous HIV-1
antigens by DCs co-cultivated with either total PBLs or purified CD8+ T cells.
Purified CD8+ or total PBLs were stimulated on day 0 and restimulated on day 7 with the autologous IFN-DCs or mIL-4-DCs pulsed with AT-2-inactivated HIV-1 (stimulator/responder ratio of 1:4). Panel A shows the light scatter and dot plot analyses of the purified CD8+ T cell population used in the experiment illustrated in panels B and C. Control cultures were incubated with unpulsed autologous DCs. Exogenous IL-2 (25 U/ml) was added every 4 days. At day 14, the cultures were restimulated with DCs pulsed with AT2-HIV-1, before performing ELISPOT IFN-γ (Β) and ELISPOT granzyme-B (C) assays, as described in Materials and Methods.
AT 2-IFN-D C/CD 8 AT 2-mIL4 -DC/ CD8 AT2 -IFN -DC/ PBL AT 2-mIL4 -DC/ PBL IL10 IL-6 PGE2 TNFIL-12α 0 200 400 600 800 1000 Con ce n tr at io n pg/ m l
Figure 11. Cytokine production after in vitro cross-priming of CD8+ T cells against
exogenous HIV-1 antigens by DCs co-cultivated with either total PBLs or purified
CD8+ T cells. Purified CD8+ or total PBLs were stimulated on day 0 and restimulated
on day 7 with the autologous IFN-DCs or mIL-4-DCs pulsed with AT-2-inactivated HIV-1 (stimulator/responder ratio of 1:4). Cytokine production in the supernatants of primary cultures stimulated three times with autologous DCs. Cytokines were measured as described in Materials and Methods. Data are representative of three experiments. No measurable levels of IL-2, IL-1β, IL-7, IL-18, IL-15 and TGFβ1 were detected.
IFN-DCs exhibit a high capability to express the IL-12 family cytokines IL-23 and IL-27 upon sCD40L-induced maturation
The results reported above showed that IFN-DCs were capable of efficiently generating an effective CD8+ T cell response, including the production of high levels of IFN-γ. It was reasonable to suppose that these special property of IFN-DCs could be due to their capability to express certain cytokines involved in the amplification of the action of IL-12 and in the generation and expansion of a cytotoxic CD8+ T cells. In this regard, Th1 and CTL responses have been demonstrated to be promoted by the IL-12 family cytokines IL-23 and IL-27 [Trinchieri G. et al., 2003; Trinchieri G., 2003;Matsui M. et al.]. Thus, we have measured the mRNA levels of IL-23 p19/p40 and IL-27 EBI-3/p28 subunits in the two types immature DCs and their corresponding mature counterparts. As shown in Figure 12, p40 subunit mRNA, which is shared by IL-12 and IL-23 heterodimers, was up-regulated in both IL-4-DCs and IFN-DCs at comparable levels upon maturation, while the p19 subunit was specifically up-regulated in IFN-DCs more than 1,000-fold, as confirmed by the higher levels of secreted IL-23 detected in supernatants from matured IFN-DC by ELISA (Figure 13). Likewise, the IL-27 EBI-3/p28 subunit mRNA levels proved to be strongly up-regulated in the IFN-DCs. Thus, these results suggested that IFN-DCs exhibited a greater attitude to produce IL-12 family cytokines capable of supporting IL-12 activity and promoting T cell IFN-γ production.
1 10 100 1000 10000 100000
mono DC-ifn DC-il4
Re la ti ve p 19 m RNA Ex p re s s io n 1 10 100 1000 10000 100000 1000000
mono DC-ifn DC-il4
Re la ti ve p 40 m RNA E x p re s si o n
Monocytes IFN-DCs IL4-DCs Monocytes IFN-DCs IL4-DCs
Not treated sCD40L 6000 R e la ti ve E B I-3 m R N A E x pr essi on 0 1000 2000 3000 4000 5000
Monocytes IFN-DCs IL4-DCs
R e la ti ve p 28 m R N A E x pr essi on IL-27 0 1 2 3 4 5 6
Monocytes IFN-DCs IL4-DCs
IL-23
Figure 12. Evaluation of the levels of mRNA expression of the subunits of the
IL-23 and IL-27 cytokines by TaqMan real-time RT-PCR analysis.DCs were obtained
from blood monocytes as described in Materials and Methods. Immature DCs were then induced to differentiate by overnight exposure to sCD40L. To measure cytokine mRNA expression, TaqMan real-time reverse transcriptase PCR (RT-PCR) analysis was used (Applied Biosystems, Foster City, Calif.). Total RNA was extracted from monocytes and DCs at different time points, and reverse transcription was carried out as previously described. TaqMan assays were performed according to the manufacturer's instructions with an ABI 7700 thermocycler (Applied Biosystems). PCR was performed, amplifying the target cDNA (p40, and p19 transcripts for IL-23. EBI-3 and p28 for IL-27), with ß-actin cDNA as an endogenous control. Data were analyzed with the PE Relative Quantification software of Applied Biosystems. Specific mRNA transcript levels were expressed as fold increase over the basal condition (untreated monocytes).
0 100 200 300 400 500 600
Monocyte IFN-DCs IL4-DC
IL -2 3 pg /m l 0 400 800 1200 1600 2000 2400 2800
Monocyte IFN-DCs IL4-DC
IL -1 2 pg /m l Not treated sCD40L
Figure 13. Cytokine production by ELISA. IL-12 and IL-23 protein release in culture
supernatant was tested by using a commercially available Elisa Kit. Each bar represents the mean concentration values (± SE) of three experiments
Different expression of TLRs between IFN-DCs and IL4-DCs
The expression pattern of TLRs in IFN-DCs and IL4-DCs have been compared by Real Time PCR analysis. The relevant results are shown in Figure 14, which shows differerential expression of some TLRs in this two classes of DCs. TLR3, known to be constitutively expressed in myeloid dendritic cells, appeared to be expressed at higher level in IFN-DCs as compared to IL4-DCs. TLR7 has been found to be expressed exclusively by IFN-DCs and not by IL4-DCs, as previously observed by Mohty and colleagues (Mohty M. et al., 2003). Interestingly, low levels of TLR9 transcription have been evidenced in IFN-DCs. Since TLRs downstream signalling involve the activation of several transcription factors including the Interferon Regulatory Factors (IRFs) some of which are specifically expressed or induced in different classes of DCs, we have comparatively analyzed IRF3 and IRF7 expression in IFN-DCs and IL4-DCs. No significant differences in the expression of IRF3 were foundbetween IFN-DCsand IL4-DCs (Figure 14). Interestingly, expression of IRF7, known to be transcribed in mature DCs, has been selectively detected IFN-DCs but not in immature IL4-DCs (Figure 14). Based on the data of TLR expression, we have stimulated IFN-DCs and IL4-DCs with imiquimod (TLR7 agonist), or Poly I:C (TLR3 agonist), in order to compare cytokine production in the supernatants 48h after the addition of the soluble factors. As expected, IL4-DCs have been found to produce lower levels of TNF-α and IL-23 (member of the IL-12 family) with respect to IFN-DCs, in response to Imiquimod or Poli I:C. In contrast, as shown in control DC culture supernatant, IFN-DCs produced higher quantities of these cytokines even in the absence of exogenous stimuli (Figure 15). These data confirm the peculiar aptitude of IFN-DCs to induce TH1 polarization and suggest
the intrinsic susceptibility of IFN-DCs to further increase this property in response to specific TLR agonists (i.e. Imiquimod).
IRF7 0.0 5.0 10.0 15.0 20.0 25.0 30.0 35.0
mono IFN DC IL-4 DC
TLR7 0.00 1.00 2.00 3.00 4.00 5.00 6.00 7.00 8.00
mono DC-ifn DC-il4
TLR9 0 5 10 15 20 25 30 35
mono DC-ifn DC-il4
IRF3 0.0 1.0 2.0 3.0 4.0 5.0 6.0 7.0 8.0
mono DC-ifn DC-il4
TLR3 0 500 1000 1500 2000 2500 3000 3500
mono DC-ifn DC-il4
TLR8 0,00 1,00 2,00 3,00 4,00 5,00 6,00 7,00 8,00 9,00
mono DC-ifn DC-il4 Exp. 1 Exp. 2 Exp. 3 Exp. 4 Exp. 5 Mean
Real Time PCR
p=0.043 p=0.043 p=0.043 p=0.043 p=0.043Poly I:C receptor ss-RNA and imiquimod receptor
AU
Figure 14. Evaluation of the levels of mRNA expression of the TLRs and IRFs by TaqMan real-time RT-PCR. Quantitative RT-PCR for TLR3, TLR7, TLR8, TLR9,
IRF3, IRF7 gene expression by DCs was performed. DCs were obtained as described in Materials and Methods. Total RNA was extracted from monocytes and DC, and reverse transcription was carried out as previously described. TaqMan assays were performed according to the manufacturer’s instructions with an ABI 7700 thermocycler (Applied Biosystems). Data were analyzed with the PE Relative Quantification software of Applied Biosystems. Specific mRNA transcript levels were expressed as fold increase over the basal condition (untreated monocytes).
0 500 1000 1500 2000 IF N-DC IF N-DC+ IMIQ IF N-DC+ PoliI:C IL 4-DC IL4-D C+IM IQ IL 4-DC+P oliI:C pg/ m l TNFa IL23
Fig.15. Cytokine secretion analyzed by ELISA. Cytokine production was measured in
supernatants collected from IFN-DCs or IL4-DCs untreated (none) or cultured in fresh medium, in the presence of Imiquimod or Poly I:C for 48h. Each bar represents the mean concentration values (± SE) of three experiments